Comparison of Digital Building Height Models Extracted from AW3D, TanDEM-X, ASTER, and SRTM Digital Surface Models over Yangon City


Abstract
1. Introduction
Objective
2. Methodology
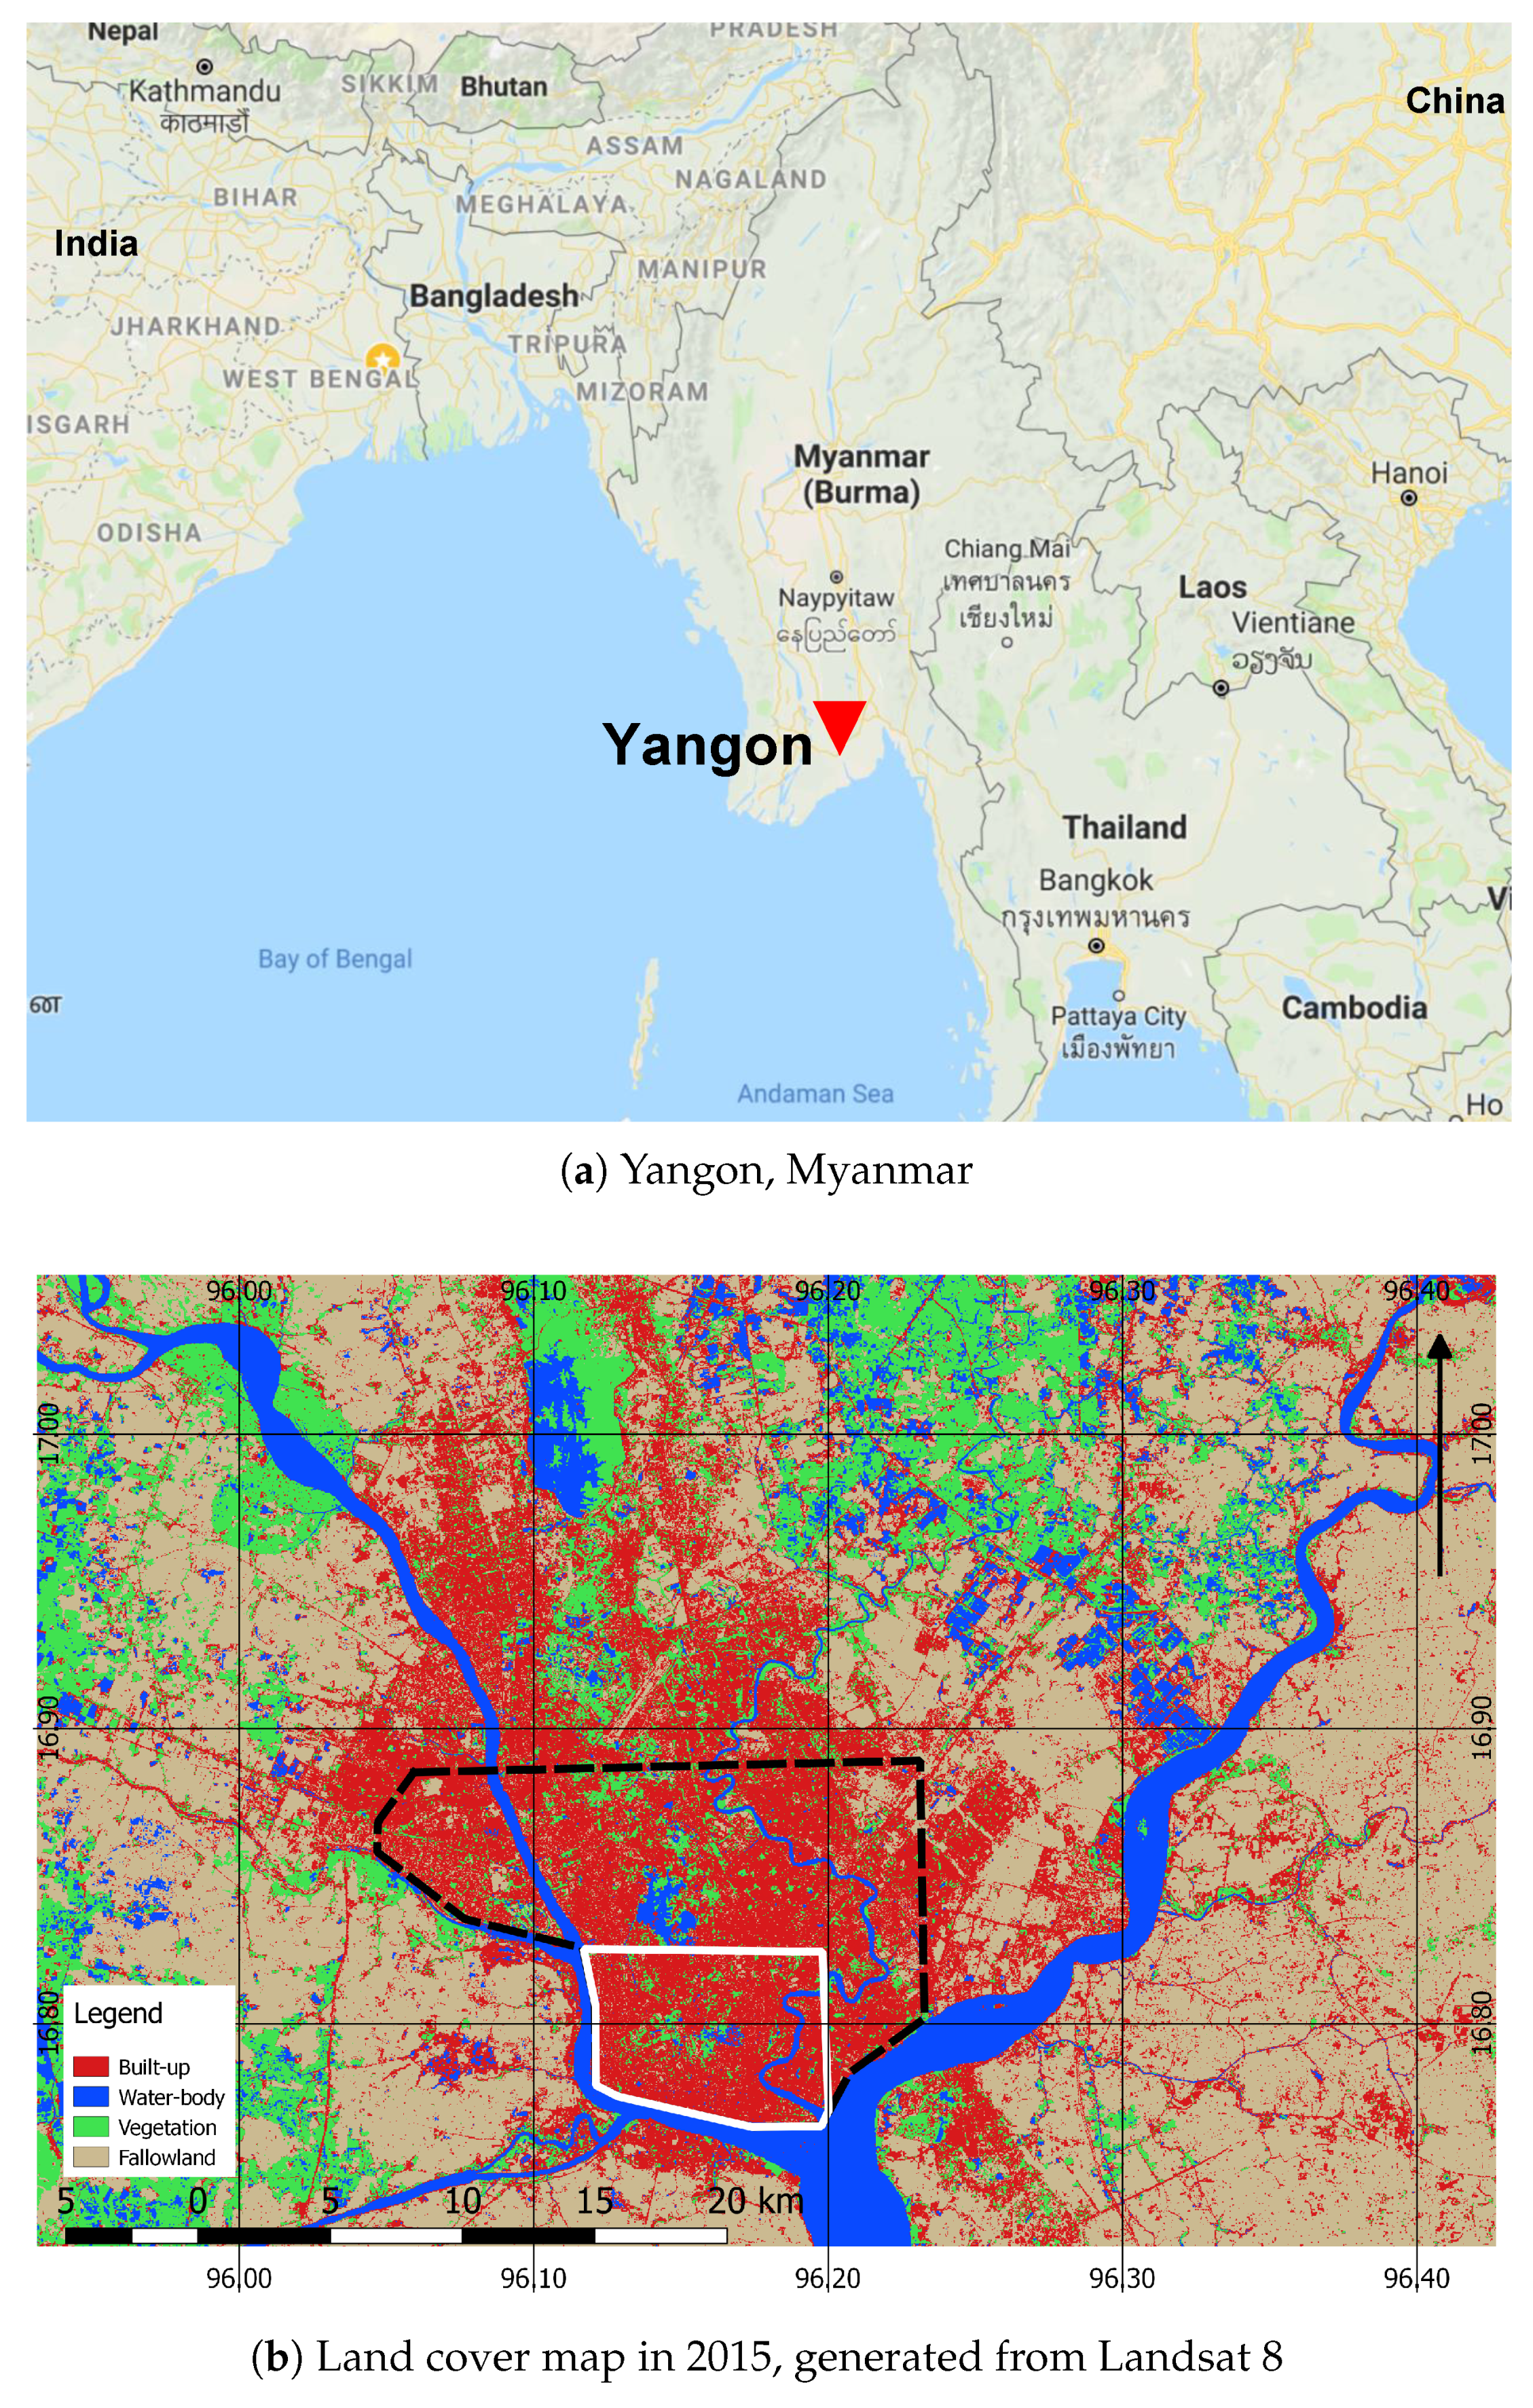
2.1. Study Site
2.2. Data Used
2.3. DBH Generation
Parameter Selection
2.4. Vertical Accuracy Assessment
3. Results and Discussion
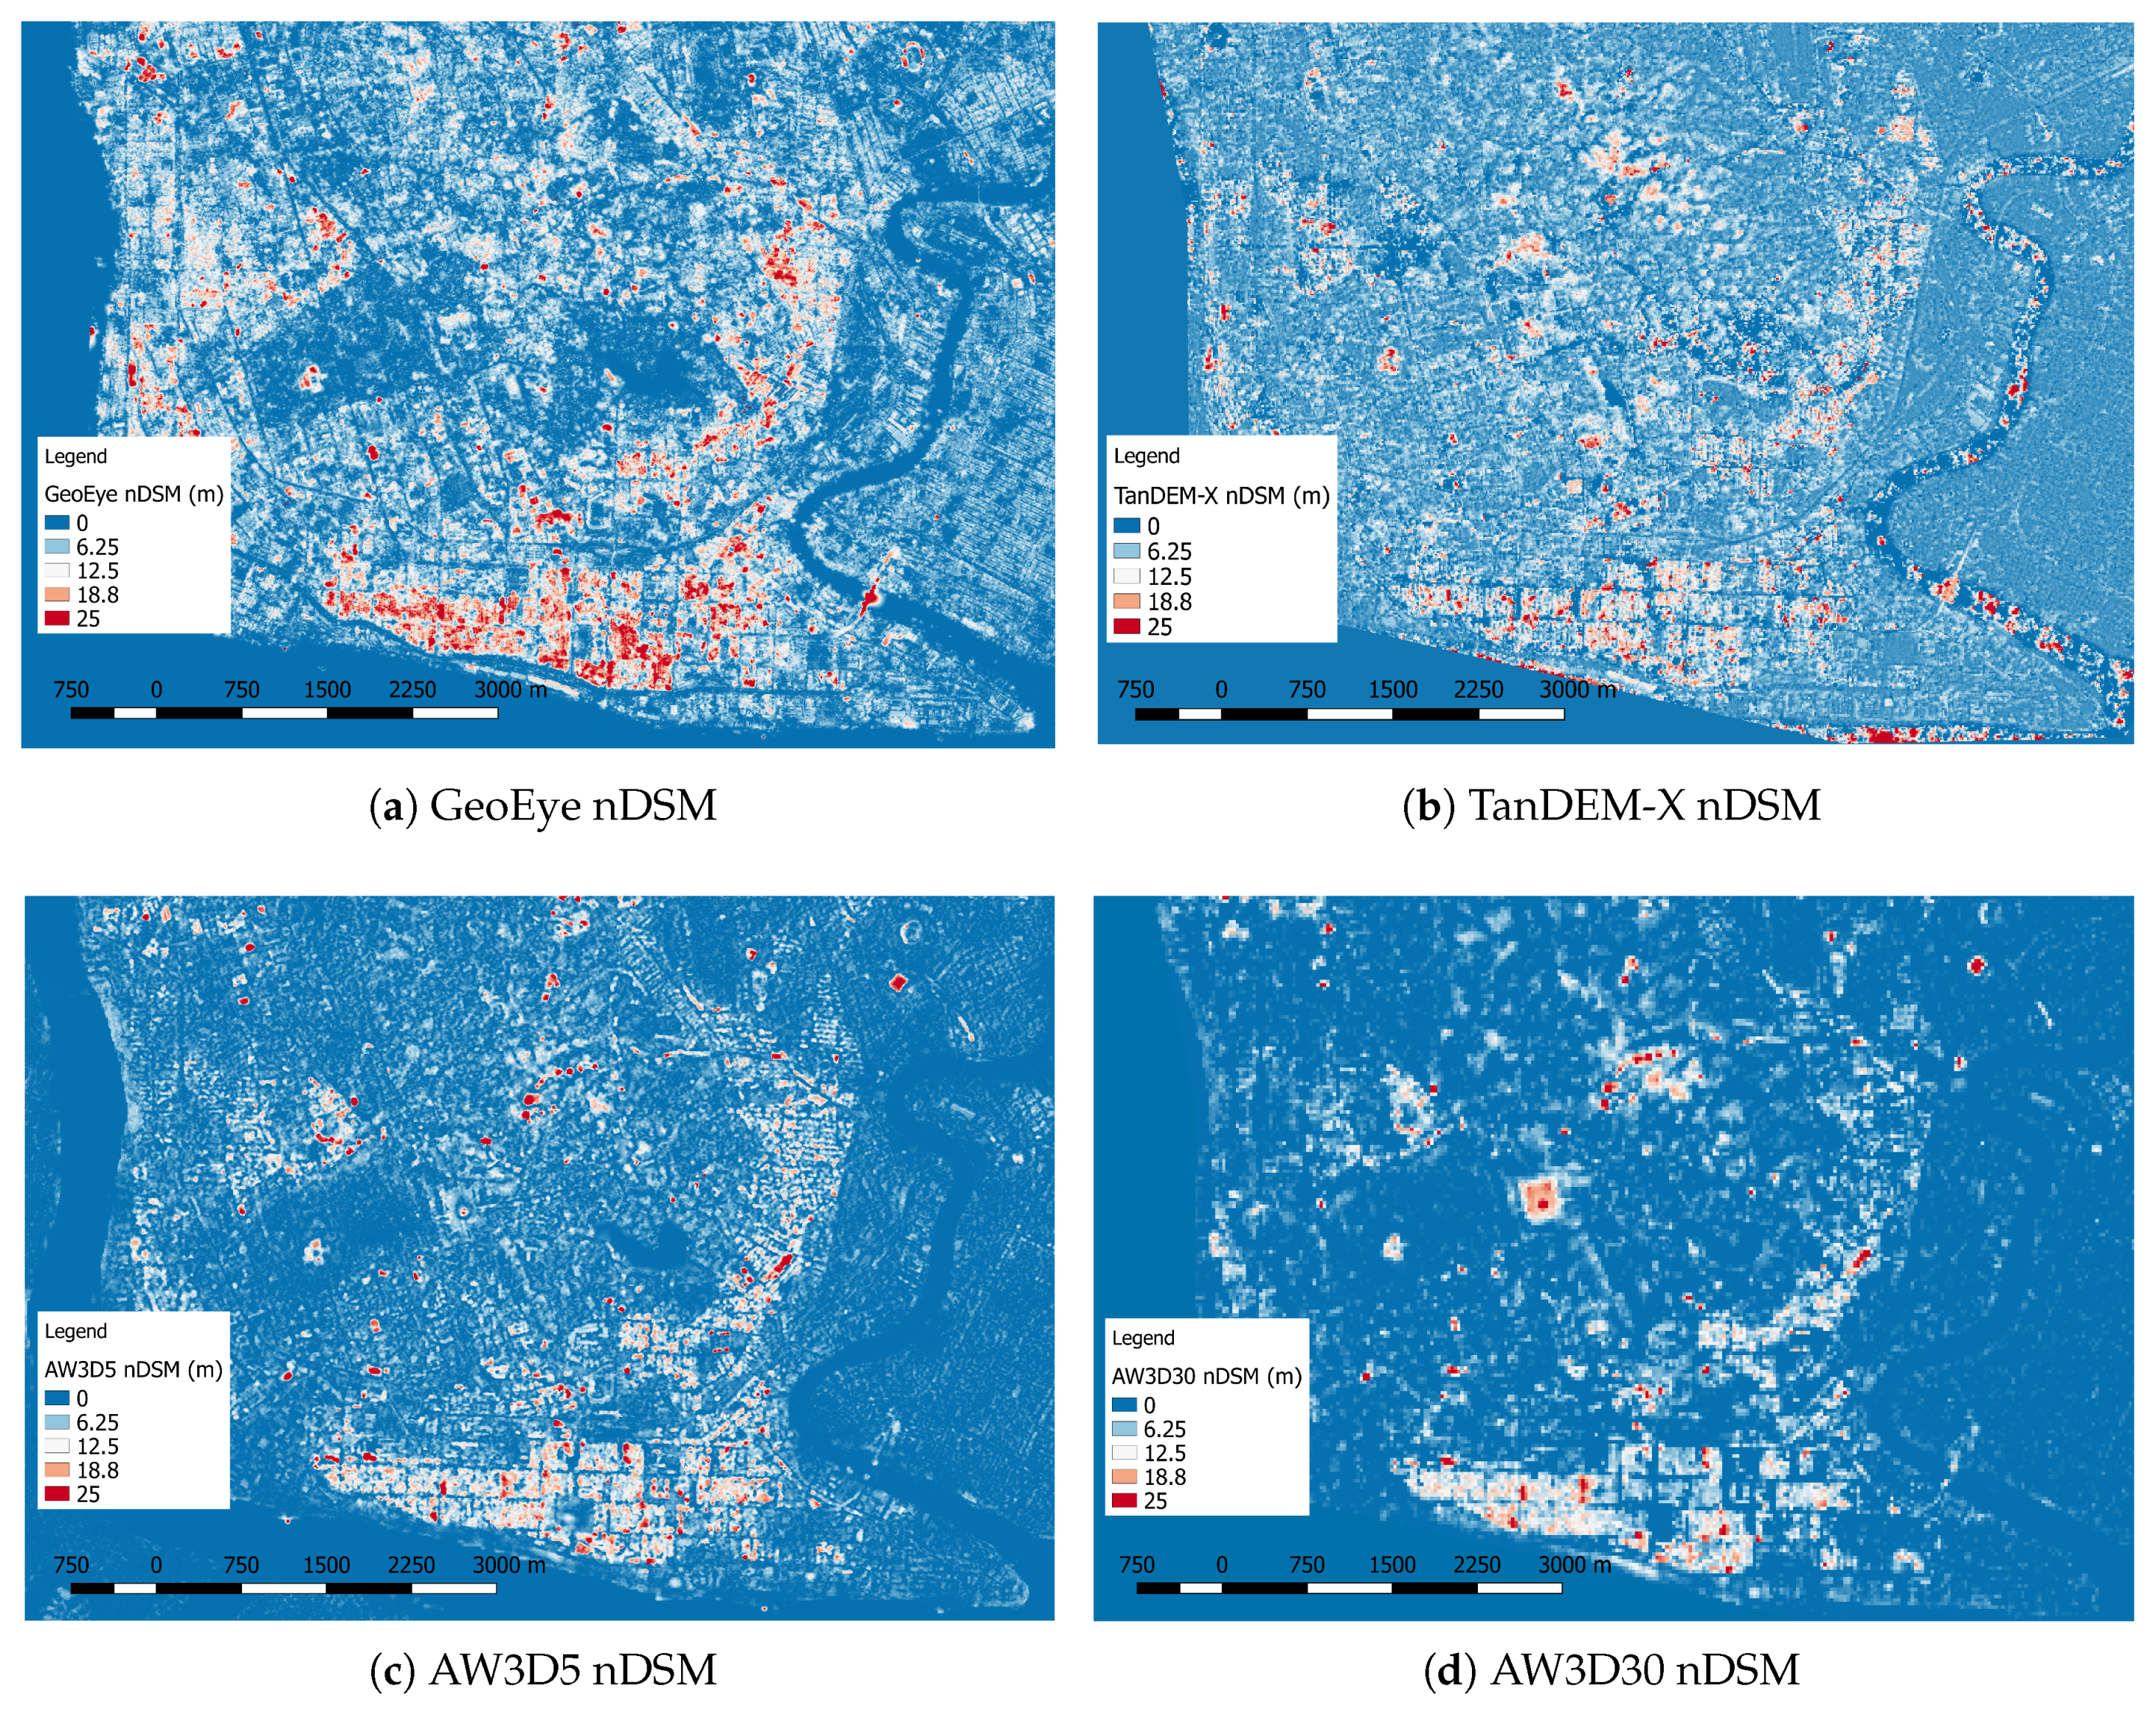
3.1. Comparison of AW3D5 and TanDEM-X DBH
3.2. Accuracy Loss in AW3D DBH with Resolution Degradation
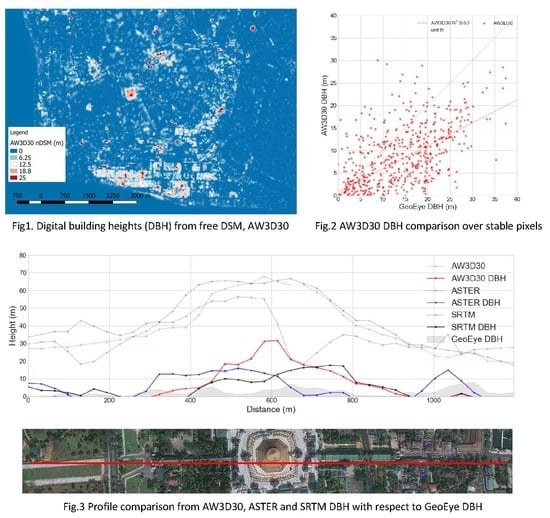
3.3. Comparison of DTMs from AW3D30, ASTER, and SRTM
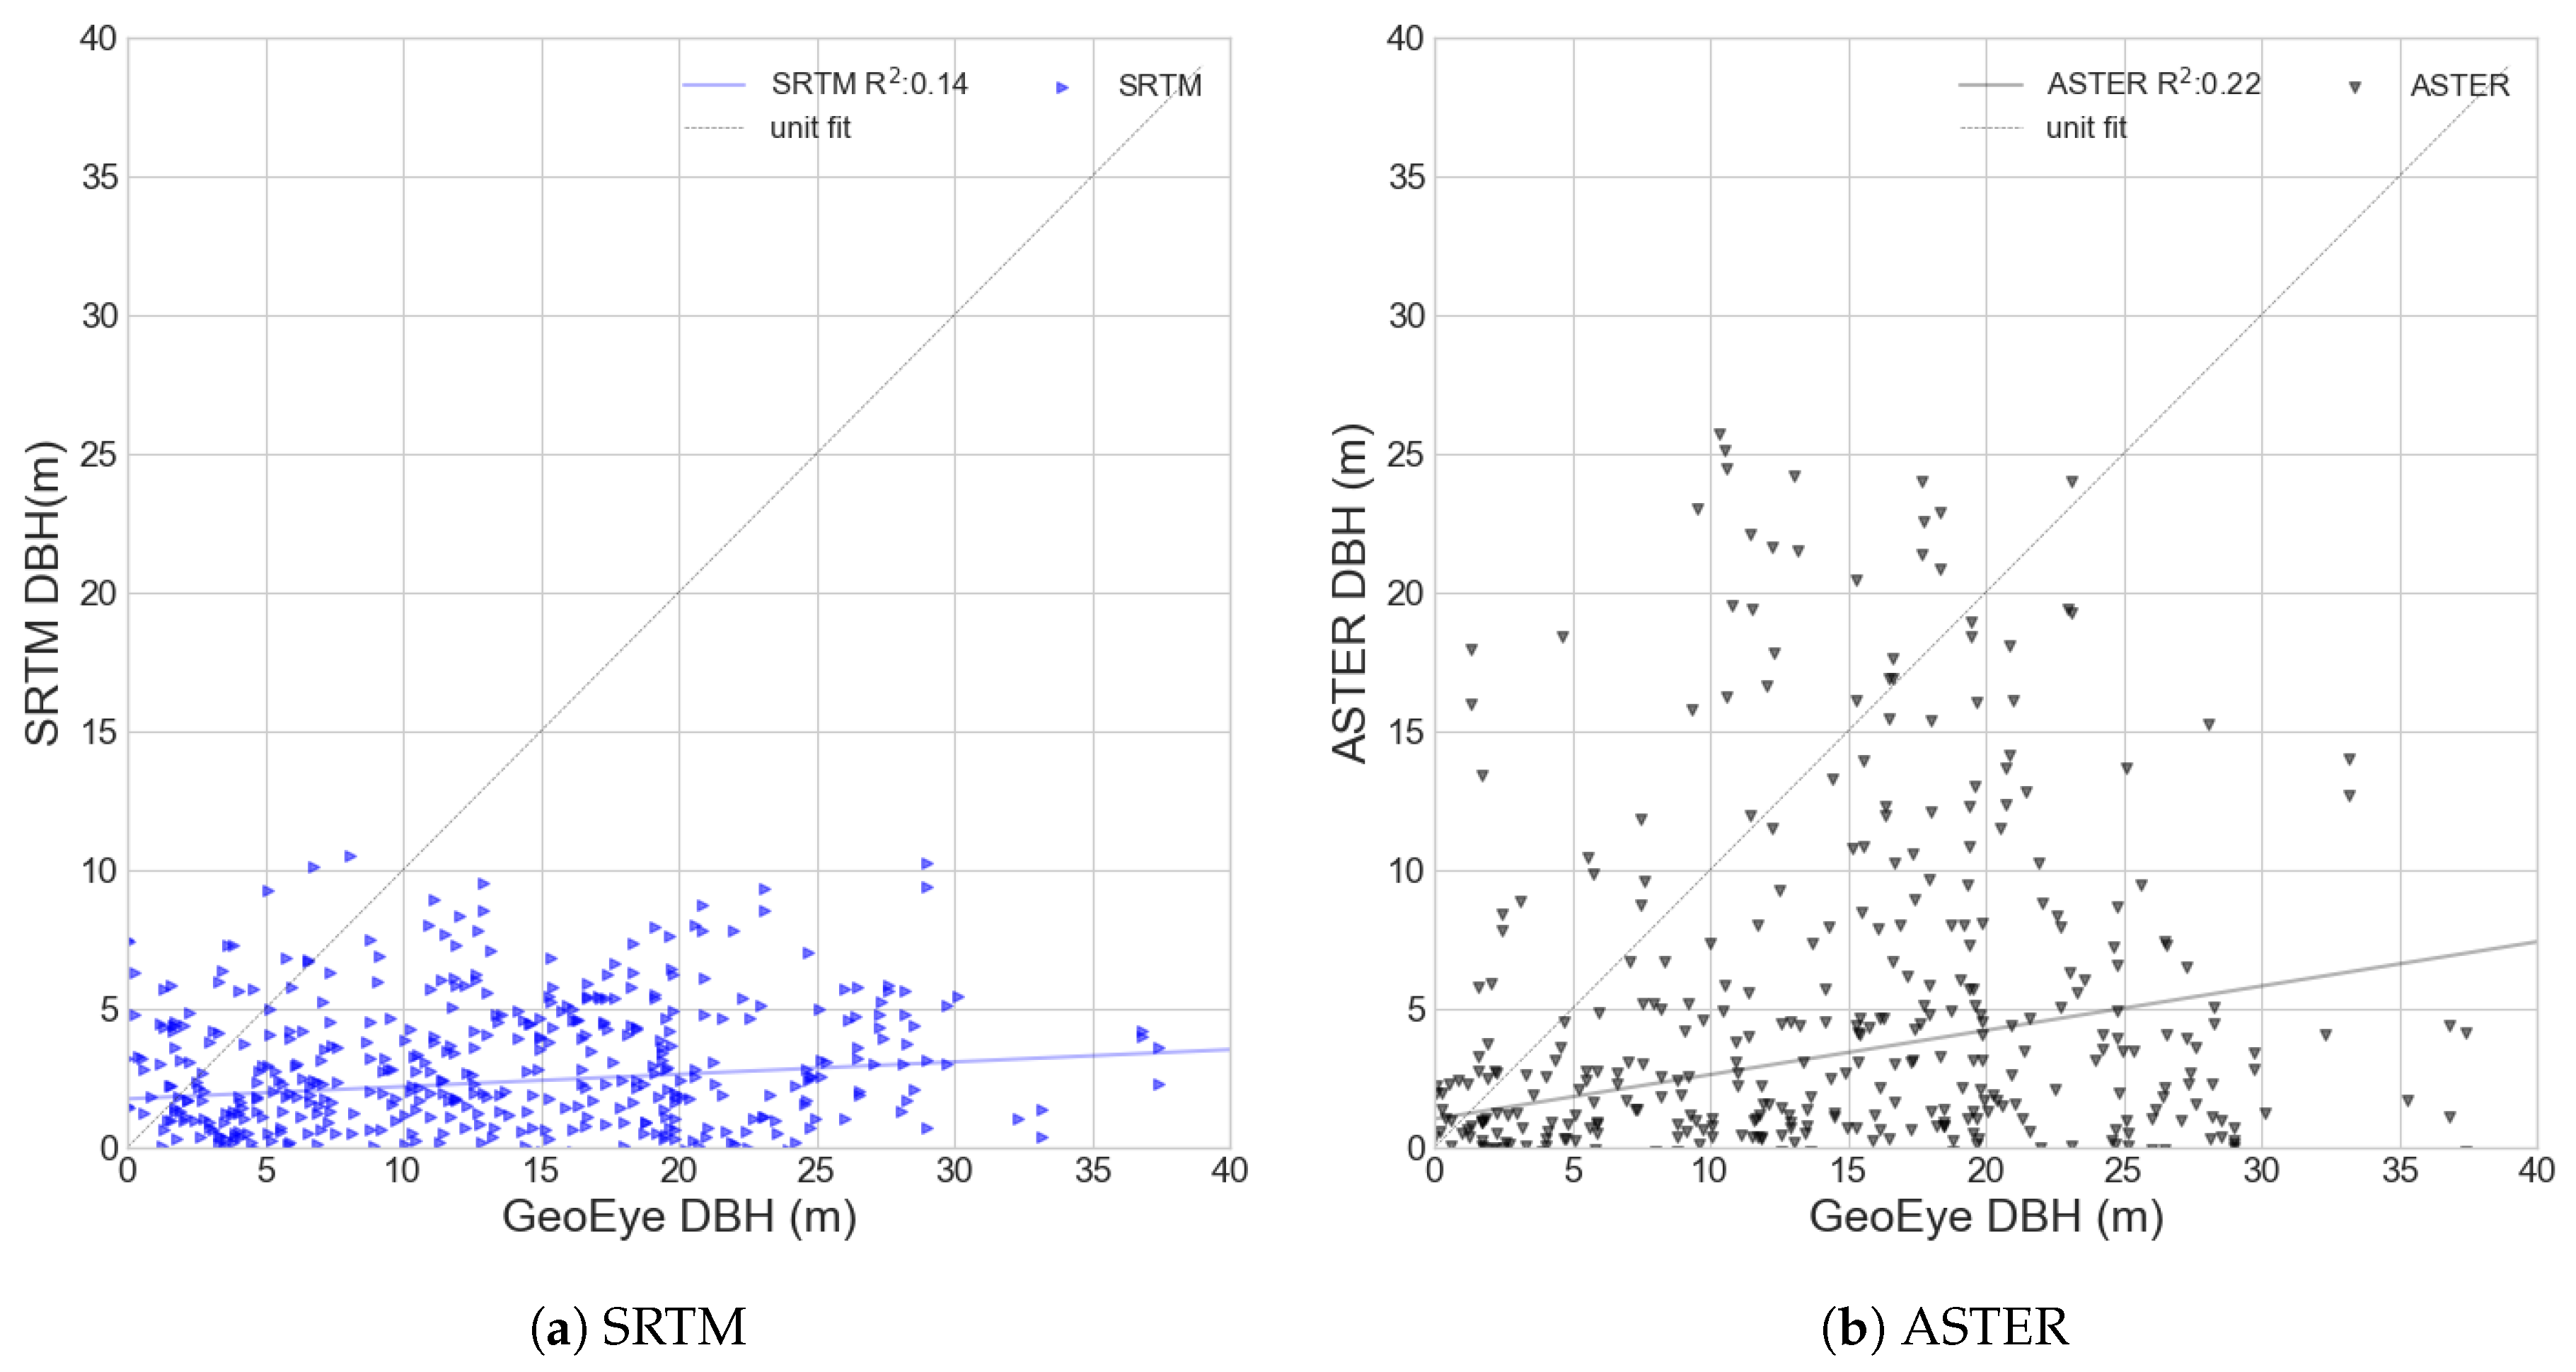
3.4. Comparison of DBHs from AW3D30, ASTER, and SRTM
3.5. Discussion
4. Conclusions
Author Contributions
Funding
Acknowledgments
Conflicts of Interest
Abbreviations
| ALS | airborne laser scanning |
| ASTER | Advanced Spaceborne Thermal Emission and Reflection Radiometer |
| AW3D5 | ALOS world 3D 5 m resolution DSM |
| AW3D30 | ALOS world 3D 30 m resolution DSM |
| DSM | digital surface model |
| DTM | ditial terrain model |
| DBH | digital building height model |
| MAE | mean absolute error |
| ME | mean error |
| MSD | multi-directional slope filtering |
| nDSM | normalized digital surface model |
| RMSE | root mean square error |
| SAR | synthetic aperture radar |
| SD | standard deviation |
| SRTM | Shuttle Radar Topography Mission |
| TanDEM-X | TerraSAR-X add on for Digital Elevation Measurements |
| VHR | very high-resolution |
References
- UN Habitat. Resilience. Available online: https://unhabitat.org/urban-themes/resilience/ (accessed on 19 November 2018).
- Handayani, H.H.; Estoque, R.C.; Murayama, Y. Estimation of built-up and green volume using geospatial techniques: A case study of Surabaya, Indonesia. Sustain. Cities Soc. 2018, 37, 581–593. [Google Scholar] [CrossRef]
- Jiang, F.; Liu, S.; Yuan, H.; Zhang, Q. Measuring urban sprawl in Beijing with geo-spatial indices. J. Geogr. Sci. 2007, 17, 469–478. [Google Scholar] [CrossRef]
- Shi, L.; Shao, G.; Cui, S.; Li, X.; Lin, T.; Yin, K.; Zhao, J. Urban three-dimensional expansion and its driving forces—A case study of Shanghai, China. Chin. Geogr. Sci. 2009, 19, 291–298. [Google Scholar] [CrossRef]
- Clarke, K.C.; Gaydos, L.J. Loose-coupling a cellular automaton model and GIS: Long-term urban growth prediction for San Francisco and Washington/Baltimore. Int. J. Geogr. Inf. Sci. 1998, 12, 699–714. [Google Scholar] [CrossRef] [PubMed]
- Haala, N.; Brenner, C. Extraction of buildings and trees in urban environments. ISPRS J. Photogramm. Remote Sens. 1999, 54, 130–137. [Google Scholar] [CrossRef]
- Ratti, C.; Ratti, C.; Di Sabatino, S.; Di Sabatino, S.; Britter, R.; Britter, R.; Brown, M.; Burian, S.; Caton, F.; Caton, F.; et al. Analysis of 3-D urban databases with respect to pollution dispersion for a number of European and American cities. Water Air Soil Pollut. Focus 2002, 2, 459–469. [Google Scholar] [CrossRef]
- Ratti, C.; Baker, N.; Steemers, K. Energy consumption and urban texture. Energy Build. 2005, 37, 762–776. [Google Scholar] [CrossRef]
- Hofierka, J.; Kaňuk, J. Assessment of photovoltaic potential in urban areas using open-source solar radiation tools. Renew. Energy 2009, 34, 2206–2214. [Google Scholar] [CrossRef]
- Buyantuyev, A.; Wu, J. Urban heat islands and landscape heterogeneity: Linking spatiotemporal variations in surface temperatures to land-cover and socioeconomic patterns. Landsc. Ecol. 2010, 25, 17–33. [Google Scholar] [CrossRef]
- Fernández, D.S.; Lutz, M.A. Urban flood hazard zoning in Tucumán Province, Argentina, using GIS and multicriteria decision analysis. Eng. Geol. 2010, 111, 90–98. [Google Scholar] [CrossRef]
- Costa, E. Simulation of the effects of different urban environments on gps performance using digital elevation models and building databases. IEEE Trans. Intell. Transp. Syst. 2011, 12, 819–829. [Google Scholar] [CrossRef]
- Zhang, W.; Li, W.; Zhang, C.; Ouimet, W.B. Detecting horizontal and vertical urban growth from medium resolution imagery and its relationships with major socioeconomic factors. Int. J. Remote Sens. 2017, 38, 3704–3734. [Google Scholar] [CrossRef]
- Kim, C.; Habib, A.; Chang, Y.C. Automatic Generation of Digital Building Models for Complex Structures From Lidar Data. Int. Arch. Photogramm. Remote Sens. Spat. Inf. Sci. 2008, 37, 463–468. [Google Scholar]
- Sirmacek, B.; Taubenböck, H.; Reinartz, P.; Ehlers, M. Performance evaluation for 3-{D} city model generation of six different DSMs from air-and spaceborne sensors. IEEE J. Sel. Top. Appl. Earth Obs. Remote Sens. 2012, 5, 59–70. [Google Scholar] [CrossRef]
- Gamba, P.; Houshmand, B.; Saccani, M. Detection and extraction of buildings from interferometric SAR data. IEEE Trans. Geosci. Remote Sens. 2000, 38, 611–618. [Google Scholar] [CrossRef]
- Rutzinger, M.; Rüf, B.; Höfle, B.; Vetter, M. Change Detection of Building Footprints from Airborne Laser Scanning Acquired in Short Time Intervals. In ISPRS Technical Commission VII Symposium—100 Years ISPRS; Wagner, W., Székely, B., Eds.; Institute of Photogrammetry and Remote Sensing, Vienna University of Technology: Vienna, Austria, 2010; Volume XXXVIII, pp. 475–480. [Google Scholar]
- Wu, B.; Yu, B.; Wu, Q.; Yao, S.; Zhao, F.; Mao, W.; Wu, J. A graph-based approach for 3d building model reconstruction from airborne lidar point clouds. Remote Sens. 2017, 9, 92. [Google Scholar] [CrossRef]
- Sun, Y.; Zhang, X.; Zhao, X.; Xin, Q. Extracting building boundaries from high resolution optical images and LiDAR data by integrating the convolutional neural network and the active contour model. Remote Sens. 2018, 10, 1459. [Google Scholar] [CrossRef]
- Bonczak, B.; Kontokosta, C.E. Large-scale parameterization of 3D building morphology in complex urban landscapes using aerial LiDAR and city administrative data. Comput. Environ. Urban Syst. 2018, 73, 126–142. [Google Scholar] [CrossRef]
- Chen, K.; Lu, W.; Xue, F.; Tang, P.; Li, L.H. Automatic building information model reconstruction in high-density urban areas: Augmenting multi-source data with architectural knowledge. Autom. Constr. 2018, 93, 22–34. [Google Scholar] [CrossRef]
- Aljumaily, H.; Laefer, D.F.; Cuadra, D. Big-Data Approach for Three-Dimensional Building Extraction from Aerial Laser Scanning. J. Comput. Civ. Eng. 2016, 30, 04015049. [Google Scholar] [CrossRef]
- Tomljenovic, I.; Höfle, B.; Tiede, D.; Blaschke, T. Building extraction from Airborne Laser Scanning data: An analysis of the state of the art. Remote Sens. 2015, 7, 3826–3862. [Google Scholar] [CrossRef]
- Alobeid, A.; Jacobsen, K.; Heipke, C. Comparison of Matching Algorithms for DSM Generation in Urban Areas from Ikonos Imagery. Photogramm. Eng. Remote Sens. 2010, 76, 1041–1050. [Google Scholar] [CrossRef]
- Tian, J.; Cui, S.; Reinartz, P. Building Change Detection Based on Satellite Stereo Imagery and Digital Surface Models. IEEE Trans. Geosci. Remote Sens. 2014, 52, 406–417. [Google Scholar] [CrossRef]
- Balk, D.; Deichmann, U.; Yetman, G.; Pozzi, F.; Hay, S.; Nelson, A. Determining Global Population Distribution: Methods, Applications and Data. Adv. Parasitol. 2006, 62, 119–156. [Google Scholar] [PubMed]
- Center for International Earth Science Information Network—CIESIN—Columbia University; International Food Policy Research Institute (IFPRI); The World Bank; Centro Internacional de Agricultura Tropical. Global Rural-Urban Mapping Project, Version 1 (GRUMPv1): Urban Extents Grid; NASA Socioeconomic Data and Applications Center (SEDAC): Palisades, NY, USA, 2011. [Google Scholar]
- Center for International Earth Science Information Network—CIESIN—Columbia University. Global Urban Heat Island (UHI) Data Set, 2013; NASA Socioeconomic Data and Applications Center (SEDAC): Palisades, NY, USA, 2016. [Google Scholar]
- Zhang, W.; Villarini, G.; Vecchi, G.A.; Smith, J.A. Urbanization exacerbated the rainfall and flooding caused by hurricane Harvey in Houston. Nature 2018, 563, 384–388. [Google Scholar] [CrossRef] [PubMed]
- Lwin, K.K.; Murayama, Y. Estimation of Building Population from LIDAR Derived Digital Volume Model. In Spatial Analysis and Modeling in Geographical Transformation Process; Murayama, Y., Thapa, R., Eds.; Springer: Dordrecht, The Netherlands, 2011; Volume 100. [Google Scholar]
- Yamazaki, D.; Ikeshima, D.; Tawatari, R.; Yamaguchi, T.; O’Loughlin, F.; Neal, J.C.; Sampson, C.C.; Kanae, S.; Bates, P.D. A high-accuracy map of global terrain elevations. Geophys. Res. Lett. 2017, 44, 5844–5853. [Google Scholar] [CrossRef]
- Santillan, J.R.; Makinano-Santillan, M. Vertical accuracy assessment of 30-M resolution ALOS, ASTER, and SRTM global DEMS over Northeastern Mindanao, Philippines. Int. Arch. Photogramm. Remote Sens. Spat. Inf. Sci. ISPRS Arch. 2016, 41, 149–156. [Google Scholar] [CrossRef]
- Jain, A.O.; Thaker, T.; Chaurasia, A.; Patel, P.; Singh, A.K. Vertical accuracy evaluation of SRTM-GL1, GDEM-V2, AW3D30 and CartoDEM-V3.1 of 30-m resolution with dual frequency GNSS for lower Tapi Basin India. Geocarto Int. 2018, 33, 1237–1256. [Google Scholar] [CrossRef]
- Purinton, B.; Bookhagen, B. Validation of digital elevation models (DEMs) and comparison of geomorphic metrics on the southern Central Andean Plateau. Earth Surf. Dyn. 2017, 5, 211–237. [Google Scholar] [CrossRef]
- Acharya, T.D.; Yang, I.T.; Lee, D.H. Comparative Analysis of Digital Elevation Models between AW3D30, SRTM30 and Airborne LiDAR: A case of Chuncheon, South Korea. J. Korean Soc. Surv. Geod. Photogramm. Cartogr. 2018, 36, 17–24. [Google Scholar]
- Alganci, U.; Besol, B.; Sertel, E. Accuracy Assessment of Different Digital Surface Models. ISPRS Int. J. Geo-Inf. 2018, 7, 114. [Google Scholar] [CrossRef]
- Nghiem, S.; Balk, D.; Small, C.; Deichmann, U.; Wannebo, A.; Blom, R.; Sutton, P.; Yetman, G.; Chen, R.; Rodriguez, E.; et al. Global Infrastructure: The Potential of SRTM Data to Break New Ground; White Paper; NASA-JPL and CIESIN: Columbia University: New York, NY, USA, 2001; p. 20. [Google Scholar]
- Gamba, P.; Acqua, F.D.; Houshmand, B. SRTM data Characterization in urban areas. Int. Arch. Photogramm. Remote Sens. Spat. Inf. Sci. 2002, 34, 55–58. [Google Scholar]
- Quartulli, M.; Datcu, M. Information fusion for scene understanding from interferometric SAR data in urban environments. IEEE Trans. Geosci. Remote Sens. 2003, 41, 1976–1985. [Google Scholar] [CrossRef]
- Schneider, A.; Woodcock, C.E. Compact, dispersed, fragmented, extensive? A comparison of urban growth in twenty-five global cities using remotely sensed data, pattern metrics and census information. Urban Stud. 2008, 45, 659–692. [Google Scholar] [CrossRef]
- Seto, K.C.; Fragkias, M.; Güneralp, B.; Reilly, M.K. A Meta-Analysis of Global Urban Land Expansion. PLoS ONE 2011, 6, e23777. [Google Scholar] [CrossRef] [PubMed]
- Small, C.; Elvidge, C.D. Night on earth: Mapping decadal changes of anthropogenic night light in Asia. Int. J. Appl. Earth Obs. Geoinf. 2013, 22, 40–52. [Google Scholar] [CrossRef]
- Wang, P.; Huang, C.; Tilton, J.C. Mapping Three-dimensional Urban Structure by Fusing Landsat and Global Elevation Data. arXiv, 2018; arXiv:1807.04368. [Google Scholar]
- Department of Population. The 2014 Myanmar Population and Housing Census; The Union Report, Census Report Volume 2; Ministry of Immigration and Population: Nay Pyi Taw, Myanmar, 2015. [Google Scholar]
- Sritarapipat, T.; Takeuchi, W. Urban Growth Modeling based on the Multi-centers of the Urban Areas and Land Cover Change in Yangon, Myanmar. J. Remote Sens. Soc. Jpn. 2017, 37, 248–260. [Google Scholar]
- Sritarapipat, T.; Takeuchi, W. Land Cover Change Simulations in Yangon Under Several Scenarios of Flood and Earthquake Vulnerabilities with Master Plan. J. Disaster Res. 2018, 13, 50–61. [Google Scholar] [CrossRef]
- Gorelick, N.; Hancher, M.; Dixon, M.; Ilyushchenko, S.; Thau, D.; Moore, R. Google Earth Engine: Planetary-scale geospatial analysis for everyone. Remote Sens. Environ. 2017, 202, 18–27. [Google Scholar] [CrossRef]
- Farr, T.; Rosen, P.; Caro, E.; Crippen, R.; Duren, R.; Hensley, S.; Kobrick, M.; Paller, M.; Rodriguez, E.; Roth, L.; et al. The shuttle radar topography mission. Rev. Geophys. 2007, 45, 1–33. [Google Scholar] [CrossRef]
- Rodríguez, E.; Morris, C.S.; Belz, J.E. A Global Assessment of the SRTM Performance. Photogramm. Eng. Remote Sens. 2006, 72, 249–260. [Google Scholar] [CrossRef]
- U.S. Geological Survey. Societal Benefits of Higher Resolution SRTM Products. Available online: https://lpdaac.usgs.gov/societal_benefits_higher_resolution_srtm_products (accessed on 19 November 2018).
- Mukul, M.; Srivastava, V.; Mukul, M. Accuracy analysis of the 2014–2015 global shuttle radar topography mission (SRTM) 1 arc-sec C-Band height model using international global navigation satellite system service (IGS) network. J. Earth Syst. Sci. 2016, 125, 909–917. [Google Scholar] [CrossRef]
- Satge, F.; Denezine, M.; Pillco, R.; Timouk, F.; Pinel, S.; Molina, J.; Garnier, J.; Seyler, F.; Bonnet, M.P. Absolute and relative height-pixel accuracy of SRTM-GL1 over the South American Andean Plateau. ISPRS J. Photogramm. Remote Sens. 2016, 121, 157–166. [Google Scholar] [CrossRef]
- U.S. Geological Survey. USGS Earth Explorer. Available online: https://earthexplorer.usgs.gov/ (accessed on 19 November 2018).
- Tachikawa, T.; Hat, M.; Kaku, M.; Iwasaki, A. Characteristics of ASTER GDEM version 2. In Proceedings of the 2011 IEEE International Geoscience and Remote Sensing Symposium (IGARSS), Vancouver, BC, Canada, 24–29 July 2011; pp. 3657–3660. [Google Scholar]
- NASA JPL. ASTER Global Digital Elevation Map Announcement. Available online: https://asterweb.jpl.nasa.gov/gdem.asp (accessed on 19 November 2018).
- Jing, C.; Shortridge, A.; Lin, S.; Wu, J. Comparison and validation of SRTM and ASTER GDEM for a subtropical landscape in Southeastern China. Int. J. Digit. Earth 2014, 7, 969–992. [Google Scholar] [CrossRef]
- Colosimo, G.; Crespi, M.; De Vendictis, L.; Jacobsen, K. Accuracy evaluation of SRTM and ASTER DSMs. In Proceedings of the 29th EARSeL Symposium, Chania, Greece, 15–18 June 2009. [Google Scholar]
- Marconcini, M.; Marmanis, D.; Esch, T.; Felbier, A. A novel method for building height estmation using TanDEM-X data. In Proceedings of the 2014 IEEE Geoscience and Remote Sensing Symposium (IGARSS), Quebec City, QC, Canada, 13–18 July 2014; pp. 4804–4807. [Google Scholar]
- Wessel, B.; Huber, M.; Wohlfart, C.; Marschalk, U.; Kosmann, D.; Roth, A. Accuracy assessment of the global TanDEM-X Digital Elevation Model with GPS data. ISPRS J. Photogramm. Remote Sens. 2018, 139, 171–182. [Google Scholar] [CrossRef]
- Avtar, R.; Yunus, A.P.; Kraines, S.; Yamamuro, M. Evaluation of DEM generation based on Interferometric SAR using TanDEM-X data in Tokyo. Phys. Chem. Earth Parts A/B/C 2015, 83–84, 166–177. [Google Scholar] [CrossRef]
- Takaku, J.; Tadono, T.; Tsutsui, K.; Ichikawa, M. Validation of ’AW3D’ Global DSM Generated From ALOS PRISM. ISPRS Ann. Photogramm. Remote Sens. Spat. Inf. Sci. 2016, III-4, 25–31. [Google Scholar] [CrossRef]
- Caglar, B.; Becek, K.; Mekik, C.; Ozendi, M. On the vertical accuracy of the ALOS world 3D-30m digital elevation model. Remote Sens. Lett. 2018, 9, 607–615. [Google Scholar] [CrossRef]
- Estoque, R.C.; Murayama, Y.; Ranagalage, M.; Hou, H.; Subasinghe, S.; Gong, H.; Simwanda, M.; Handyani, H.H.; Zhang, X. Validating ALOS PRISM DSM-derived surface feature height: Implications for urban volume estimation. Tsukuba Geoenviron. Sci. 2017, 13, 13–22. [Google Scholar]
- NTT DATA; RESTEC. High-Resolution Digital 3D Map Covering the Entire Global Land Area. Available online: https://www.aw3d.jp/en/products/standard/ (accessed on 19 November 2018).
- Earth Obervation Research Center JAXA. ALOS Global Digital Surface Model “ALOS World 3D—30m (AW3D30)”. Available online: https://www.eorc.jaxa.jp/ALOS/en/aw3d30/ (accessed on 19 November 2018).
- Grohmann, C.H. Evaluation of TanDEM-X DEMs on selected Brazilian sites: comparison with SRTM, ASTER GDEM and ALOS AW3D30. Remote Sens. Environ. 2018, 212, 121–133. [Google Scholar] [CrossRef]
- Aguilar, M.A.; del Mar Saldana, M.; Aguilar, F.J. Generation and Quality Assessment of Stereo-Extracted DSM From GeoEye-1 and WorldView-2 Imagery. IEEE Trans. Geosci. Remote Sens. 2014, 52, 1259–1271. [Google Scholar] [CrossRef]
- Beumier, C.; Idrissa, M. Digital terrain models derived from digital surface model uniform regions in urban areas. Int. J. Remote Sens. 2016, 37, 3477–3493. [Google Scholar] [CrossRef]
- Özcan, A.H.; Ünsalan, C.; Reinartz, P. Ground filtering and DTM generation from DSM data using probabilistic voting and segmentation. Int. J. Remote Sens. 2018, 39, 2860–2883. [Google Scholar] [CrossRef]
- Xu, Y.; Wu, L.; Xie, Z.; Chen, Z. Building extraction in very high resolution remote sensing imagery using deep learning and guided filters. Remote Sens. 2018, 10, 144. [Google Scholar] [CrossRef]
- Gevaert, C.M.; Persello, C.; Nex, F.; Vosselman, G. A deep learning approach to DTM extraction from imagery using rule-based training labels. ISPRS J. Photogramm. Remote Sens. 2018, 142, 106–123. [Google Scholar] [CrossRef]
- Bittner, K.; Cui, S.; Reinartz, P. Building extraction from remote sensing data using fully convolutional networks. Int. Arch. Photogramm. Remote Sens. Spat. Inf. Sci. ISPRS Arch. 2017, 42, 481–486. [Google Scholar] [CrossRef]
- Long, J.; Shelhamer, E.; Darrell, T. Fully convolutional networks for semantic segmentation. In Proceedings of the 2015 IEEE Conference on Computer Vision and Pattern Recognition (CVPR), Boston, MA, USA, 7–12 June 2015; pp. 3431–3440. [Google Scholar]
- Deng, J.; Dong, W.; Socher, R.; Li, L.J.; Li, K.; Li, F.-F. ImageNet: A large-scale hierarchical image database. In Proceedings of the 2009 IEEE Conference on Computer Vision and Pattern Recognition, Miami, FL, USA, 20–25 June 2009; Volume 20, pp. 248–255. [Google Scholar]
- Perko, R.; Raggam, H.; Gutjahr, K.H.; Schardt, M. Advanced DTM generation from very high resolution satellite stereo images. ISPRS Ann. Photogramm. Remote Sens. Spat. Inf. Sci. 2015, II-3/W4, 165–172. [Google Scholar] [CrossRef]
- Meng, X.; Wang, L.; Silván-Cárdenas, J.L.; Currit, N. A multi-directional ground filtering algorithm for airborne LIDAR. ISPRS J. Photogramm. Remote Sens. 2009, 64, 117–124. [Google Scholar] [CrossRef]
- Mousa, Y.A.K.; Helmholz, P.; Belton, D. New DTM extraction approach from airborne images derived DSM. Int. Arch. Photogramm. Remote Sens. Spat. Inf. Sci. ISPRS Arch. 2017, 42, 75–82. [Google Scholar] [CrossRef]
- Auer, S.; Schmitt, M.; Reinartz, P. Automatic alignment of high resolution optical and SAR images for urban areas. In Proceedings of the 2017 IEEE International Geoscience and Remote Sensing Symposium (IGARSS), Fort Worth, TX, USA, 23–28 July 2017; pp. 5466–5469. [Google Scholar]
- Jones, E.; Olopihant, T.; Pearu, P. SciPy: Open Source Scientific Tools for Python. Available online: http://www.scipy.org/ (accessed on 10 December 2018).
- Awrangjeb, M.; Fraser, C.S. An automatic and threshold-free performance evaluation system for building extraction techniques from airborne LIDAR data. IEEE J. Sel. Top. Appl. Earth Obs. Remote Sens. 2014, 7, 4184–4198. [Google Scholar] [CrossRef]
- Truong-Hong, L.; Laefer, D.F. Quantitative evaluation strategies for urban 3D model generation from remote sensing data. Comput. Graph. (Pergamon) 2015, 49, 82–91. [Google Scholar] [CrossRef]
- Rutzinger, M.; Rottensteiner, F.; Pfeifer, N. A Comparison of Evaluation Techniques for Building Extraction From Airborne Laser Scanning. IEEE J. Sel. Top. Appl. Earth Obs. Remote Sens. 2009, 2, 11–20. [Google Scholar] [CrossRef]
- Rossi, C.; Gernhardt, S. Urban DEM generation, analysis and enhancements using TanDEM-X. ISPRS J. Photogramm. Remote Sens. 2013, 85, 120–131. [Google Scholar] [CrossRef]
- Capaldo, P.; Crespi, M.; Fratarcangeli, F.; Nascetti, A.; Pieralice, F. DSM generation from high resolution imagery: Applications with WorldView-1 and Geoeye-1. Eur. J. Remote Sens. 2012, 44, 41–53. [Google Scholar] [CrossRef]
- Zeng, C.; Wang, J.; Shi, P. A stereo image matching method to improve the DSM accuracy inside building boundaries. Can. J. Remote Sens. 2013, 39, 308–317. [Google Scholar] [CrossRef]
- Hasegawa, H.; Matsuo, K.; Koarai, M.; Watanabe, N.; Masaharu, H. DEM Accuracy and the Base to Height (B/H) Ratio of Stereo Images. Int. Arch. Photogramm. Remote Sens. 2000, 33, 356–359. [Google Scholar]
- Arai, X.; Ozawa, M.; Terayama, Y. Optimization method for B/H ratio determination taking occlusion effect and MTF degradation due to atmosphere into account. In Proceedings of the IGARSS ’94—1994 IEEE International Geoscience and Remote Sensing Symposium, Pasadena, CA, USA, 8–12 August 1994; Volume 3, pp. 1464–1466. [Google Scholar]
- Zhang, L.; Gruen, A. Multi-image matching for DSM generation from IKONOS imagery. ISPRS J. Photogramm. Remote Sens. 2006, 60, 195–211. [Google Scholar] [CrossRef]
- Schneider, A.; Mertes, C.M.; Tatem, A.J.; Tan, B.; Graves, S.J.; Patel, N.N.; Horton, J.A.; Gaughan, A.E.; Rollo, J.T.; Schelly, I.H.; et al. A new urban landscape in East–Southeast Asia, 2000–2010. Environ. Res. Lett. 2015, 10, 034002. [Google Scholar] [CrossRef]
- DLR. Tandem-L Mission Description. Available online: https://www.tandem-l.de/mission-description/ (accessed on 19 November 2018).
- Misra, P.; Fujikawa, A.; Takeuchi, W. Novel decomposition scheme for characterizing urban air quality with MODIS. Remote Sens. 2017, 9, 812. [Google Scholar] [CrossRef]


| DSM | Resolution | Acquisition Period | Vertical Accuracy (m) | Remarks |
|---|---|---|---|---|
| SRTM | 30 m | 2000 | 5.9–10.3 m | Open dataset acquired with InSAR |
| ASTER | 30 m | 2000–2009 | 15.1–23.2 m | Open dataset acquired with stereo photogrammetry |
| TanDEM-X | 12 m | 6 September 2011 | 1.6–6.2 m | Closed dataset acquired with InSAR, open for research purposes |
| AW3D | 5 m, 30 m | 2006–2011 | 1.7–6.8 m | Commercial and open dataset available, generated with stereo photogrammetry |
| GeoEye | 0.5 m | 16 November 2013 | 0.57–0.87 m | Generated from commercial high-resolution stereo-pairs |
| DSM Source | RMSE (m) | ME (m) | MAE (m) | SD (m) |
|---|---|---|---|---|
| AW3D5 | 3.55 | −1.55 | 1.99 | 3.20 |
| TanDEM-X | 3.35 | −0.04 | 1.87 | 3.35 |
| RMSE (m) | ME (m) | MAE (m) | SD (m) | |
|---|---|---|---|---|
| AW3D30 | 0.79 | −0.03 | 0.18 | 0.78 |
| DTM | RMSE (m) | ME (m) | MAE (m) | SD (m) | Correlation |
|---|---|---|---|---|---|
| AW3D30-SRTM | 1.91 | 0.34 | 1.47 | 1.88 | 0.97 |
| SRTM-ASTER | 4.09 | −1.08 | 3.27 | 3.95 | 0.87 |
| AW3D30-ASTER | 3.18 | −0.75 | 2.46 | 3.09 | 0.88 |
| Min | Max | RMSE | ME | MAE | SD | |
|---|---|---|---|---|---|---|
| DBH | ||||||
| SRTM | 0.04 | 10.52 | – | 3.10 | – | 2.24 |
| ASTER | 0.01 | 25.71 | – | 5.49 | – | 6.08 |
| AW3D30 | 0.02 | 30.06 | – | 9.14 | – | 6.40 |
| GeoEye | 0.03 | 37.41 | – | 13.06 | – | 8.19 |
| Pixel-based | ||||||
| SRTM-GeoEye | −35.96 | 7.46 | 13.50 | −10.65 | 11.06 | 8.31 |
| ASTER-GeoEye | −37.55 | 16.60 | 13.35 | −9.88 | 10.96 | 8.99 |
| AW3D30-GeoEye | −27.40 | 21.23 | 8.88 | −5.61 | 7.27 | 6.89 |
| Object-based | ||||||
| SRTM-GeoEye | −23.86 | 4.30 | 11.94 | −10.34 | 10.53 | 6.04 |
| ASTER-GeoEye | −24.98 | 12.58 | 11.68 | −9.55 | 10.54 | 6.80 |
| AW3D30-GeoEye | −16.06 | 12.08 | 6.92 | −4.31 | 6.06 | 6.92 |
© 2018 by the authors. Licensee MDPI, Basel, Switzerland. This article is an open access article distributed under the terms and conditions of the Creative Commons Attribution (CC BY) license (http://creativecommons.org/licenses/by/4.0/).
Share and Cite
Misra, P.; Avtar, R.; Takeuchi, W. Comparison of Digital Building Height Models Extracted from AW3D, TanDEM-X, ASTER, and SRTM Digital Surface Models over Yangon City. Remote Sens. 2018, 10, 2008. https://doi.org/10.3390/rs10122008
Misra P, Avtar R, Takeuchi W. Comparison of Digital Building Height Models Extracted from AW3D, TanDEM-X, ASTER, and SRTM Digital Surface Models over Yangon City. Remote Sensing. 2018; 10(12):2008. https://doi.org/10.3390/rs10122008
Chicago/Turabian StyleMisra, Prakhar, Ram Avtar, and Wataru Takeuchi. 2018. "Comparison of Digital Building Height Models Extracted from AW3D, TanDEM-X, ASTER, and SRTM Digital Surface Models over Yangon City" Remote Sensing 10, no. 12: 2008. https://doi.org/10.3390/rs10122008
APA StyleMisra, P., Avtar, R., & Takeuchi, W. (2018). Comparison of Digital Building Height Models Extracted from AW3D, TanDEM-X, ASTER, and SRTM Digital Surface Models over Yangon City. Remote Sensing, 10(12), 2008. https://doi.org/10.3390/rs10122008