Article

A Ship Rotation Detection Model in Remote Sensing Images Based on Feature Fusion Pyramid Network and Deep Reinforcement Learning

1
Key Laboratory of Technology in Geo-Spatial Information Processing and Application System, Institute of Electronics, Chinese Academy of Sciences, Beijing 100190, China
2
School of Electronic, Electrical and Communication Engineering, University of Chinese Academy of Sciences, Beijing 100049, China
3
College of Life Science and Bioengineering, Beijing University of Technology, Beijing 100124, China
*
Author to whom correspondence should be addressed.
Remote Sens. 2018, 10(12), 1922; https://doi.org/10.3390/rs10121922
Submission received: 2 November 2018 / Revised: 26 November 2018 / Accepted: 27 November 2018 / Published: 30 November 2018
(This article belongs to the Special Issue Deep Learning for Remote Sensing)

Abstract

:
Ship detection plays an important role in automatic remote sensing image interpretation. The scale difference, large aspect ratio of ship, complex remote sensing image background and ship dense parking scene make the detection task difficult. To handle the challenging problems above, we propose a ship rotation detection model based on a Feature Fusion Pyramid Network and deep reinforcement learning (FFPN-RL) in this paper. The detection network can efficiently generate the inclined rectangular box for ship. First, we propose the Feature Fusion Pyramid Network (FFPN) that strengthens the reuse of different scales features, and FFPN can extract the low level location and high level semantic information that has an important impact on multi-scale ship detection and precise location of dense parking ships. Second, in order to get accurate ship angle information, we apply deep reinforcement learning to the inclined ship detection task for the first time. In addition, we put forward prior policy guidance and a long-term training method to train an angle prediction agent constructed through a dueling structure Q network, which is able to iteratively and accurately obtain the ship angle. In addition, we design soft rotation non-maximum suppression to reduce the missed ship detection while suppressing the redundant detection boxes. We carry out detailed experiments on the remote sensing ship image dataset, and the experiments validate that our FFPN-RL ship detection model has efficient detection performance.

Graphical Abstract

1. Introduction

In recent years, remote sensing technology has developed rapidly, and more and more research has gradually been carried out on the high-quality, high-resolution remote sensing images. Ship detection is an important part of these works and continues to attract attention. In addition, it can greatly improve the ability of coastal defense, maritime monitoring management and harbour dispatching. The ship detection task in remote sensing images is full of challenges, such as the special aspect ratio of the ship, the dense parking scene, the uneven illumination, the large number of complex interferences in the background, etc.
Thus far, many ship detection models have been proposed. Some ship detection methods are based on ocean and land segmentation. Long et al. [1] proposed a method for detecting coastal ships based on prior geographical information. Through separating the sea surface from the port, the ships were detected by the threshold method in the separated sea area. Jiang et al. [2] adopted the separation method of ocean and land to extract the characteristics of the ship and complete the detection task. Liu et al. [3] proposed a piecewise energy function based on the active contour model to obtain ship local features. Zhou et al. [4] and Xu et al. [5] proposed methods for detecting ships in Synthetic Aperture Radar (SAR) images. Li et al. [6] used a multi-model fusion approach and a two-stage step of detection–classification to detect side-by-side ships. Some work focuses on ship detection using a saliency model. Bi et al. [7] proposed a bottom-up computational model to extract candidate regions of optical satellite images. Qi et al. [8] built a Phase Spectrum of a Fourier Transform model for region proposal to automatically detect ships. Most of the above ship detection models are based on prior knowledge and artificially designed features. They are effective only under certain conditions and lack generalization ability for ships of different scales and types.
For object detection tasks, some methods based on template, sparse representation and dictionary learning perform well in the detection and classification of specific objects. Dao et al. [9] built a novel sparsity based method which combined the resolution of multispectral bands into the soil detection to realize the automatic tunnel mining monitoring. Based on the theory that hyperspectral pixels are able to be sparsely represented through combination of a few training samples, Chen et al. [10] proposed a sparsity algorithm to classify hyperspectral images and achieved state-of-the-art performance. Huang et al. [11] constructed a moving object detection algorithm through sparse representation and dictionary learning. The most sparse representation of the data dictionary was obtained by K Singular Value Decomposition (K-SVD), and the moving object was segmented by robust principal component tracking (PCP) to detect moving object. Xiao et al. [12] proposed an object detection method based on local contour learning and matching. The template image was generated by unsupervised clustering; then, a local contour codebook dictionary was established, and a final detection area was obtained by sliding window.
Due to the development of convolutional neural network based on deep learning, object detection in natural images have made rapid progress over recent years. With the application of various convolutional neural network training methods and the increasingly abundant computing resources, the convolutional neural network continues to evolve and the performance achieved in various competitions is also getting higher and higher. The classical convolutional neural network models include AlexNet [13], Visual Geometry Group Networks (VGG) [14], GoogLeNet [15], Residual Networks (ResNet) [16], Densely Connected Convolutional Networks (DenseNet) [17] and Neural Architecture Search Networks (NASNet) [18]. Because of the continuous advancement of these neural network models, the performance of object detection models based on these networks is also increasing, such as Fast Regions Convolution Neural Network (Fast R-CNN) [19], Faster Regions Convolution Neural Network (Faster R-CNN) [20], Feature Pyramid Networks [21], You Only Look Once Network (YOLO) [22] and Single Shot Multibox Detector (SSD) [23]. Customized versions based on these efficient detection frameworks are used for different visual tasks. Nguyen et al. [24] built LightDenseYOLO to detect and track marker in Unmanned Aerial Vehicle (UAV). In addition, it achieved perfect performance. LightDenseYOLO combined LightDenseNet and YOLO v2. LightDenseNet was adopted as a feature extractor, and YOLO v2 directly predicted a bounding box of marker. These neural network detection models are robust and effective for detecting remote sensing ships because of the strong generalization ability. However, due to the particularity of ship rotation, large aspect ratio and dense parking, they sometimes have difficulty getting perfect results.
There are some works to focus on the detection of object with a large aspect ratio, such as text and ship. Once the angle of such object is inclined, the conventional horizontal detection rectangle does not accurately and strictly surround the object. For example, due to the large aspect ratio, the ship’s horizontal detection box often contains redundant ports, coasts, and parts of surrounding ships. In order to overcome the above problem, some object detection models were proposed to generate inclined rectangle boxes. Ma et al. [25] built the Rotation Region Proposal Networks (RRPN) that generated inclined proposals with an angle information of text. However, because of the angle error in Regions Of Interest (ROI) pooling, the classification and regression layers of the network cannot obtain all ship feature information, which led to poor detection performance. Jiang et al. [26] presented Rotational Region CNN (RRCNN) to detect inclined text. Compared to RRPN, RRCNN used horizontal boxes in the Region Proposal Network stage, which preserved the text features to some extent. Yang et al. [27] proposed Rotation Dense Feature Pyramid Networks (R-DFPN) to detect ships in different scenes through direct features connection and rotation anchor strategy. In the detection method of these large aspect ratio object, the orientation information is obtained by the regression angle or the relative coordinates. Exact orientation information is a vital part in the detection of this kind object, and the direct angle regression method is often difficult to obtain accurate prediction results. Reinforcement learning provides a new intelligent solution for angle prediction.
Reinforcement learning is an important machine learning method, and it is widely used in the field of robot control, analysis and prediction. It learns the mapping from environmental state to agent behavior, and obtains the biggest reward from the environment through action selected by the agent. In 2013, DeepMind presented a groundbreaking work [28], which first proposed deep reinforcement learning and deep Q network (DQN) algorithm to learn to play Atari 2600 games through pure image input. Nature published the evolutionary version of DQN paper [29] in 2015. The advanced DQN achieved beyond human performance in half of the 49 games. The relevant researchers gradually proposed efficient deep reinforcement learning algorithms, like Double DQN [30], Dueling DDQN [31], Hierarchical Reinforcement Learning [32] and continuous action control algorithm [33]. At present, research based on deep reinforcement learning in the traditional computer vision are constantly developing, such as object tracking [34], person re-identification [35], autonomous driving [36], etc.
In this paper, we propose a ship detection framework based on a Feature Fusion Pyramid Network and Deep Reinforcement Learning (FFPN-RL). Through enhancing the reuse of different scales features in FFPN, the detection model is able to efficiently detect ships of various scales. The angle prediction agent can accurately obtain the ship angle information by iteratively rotating the ship image. Experiments validate that our FFPN-RL ship detection model obtains state-of-the-art detection performance. Our work has the following contributions:
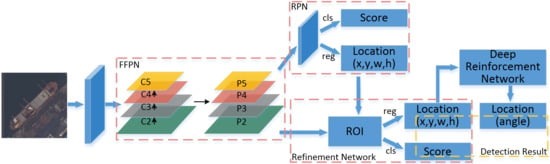
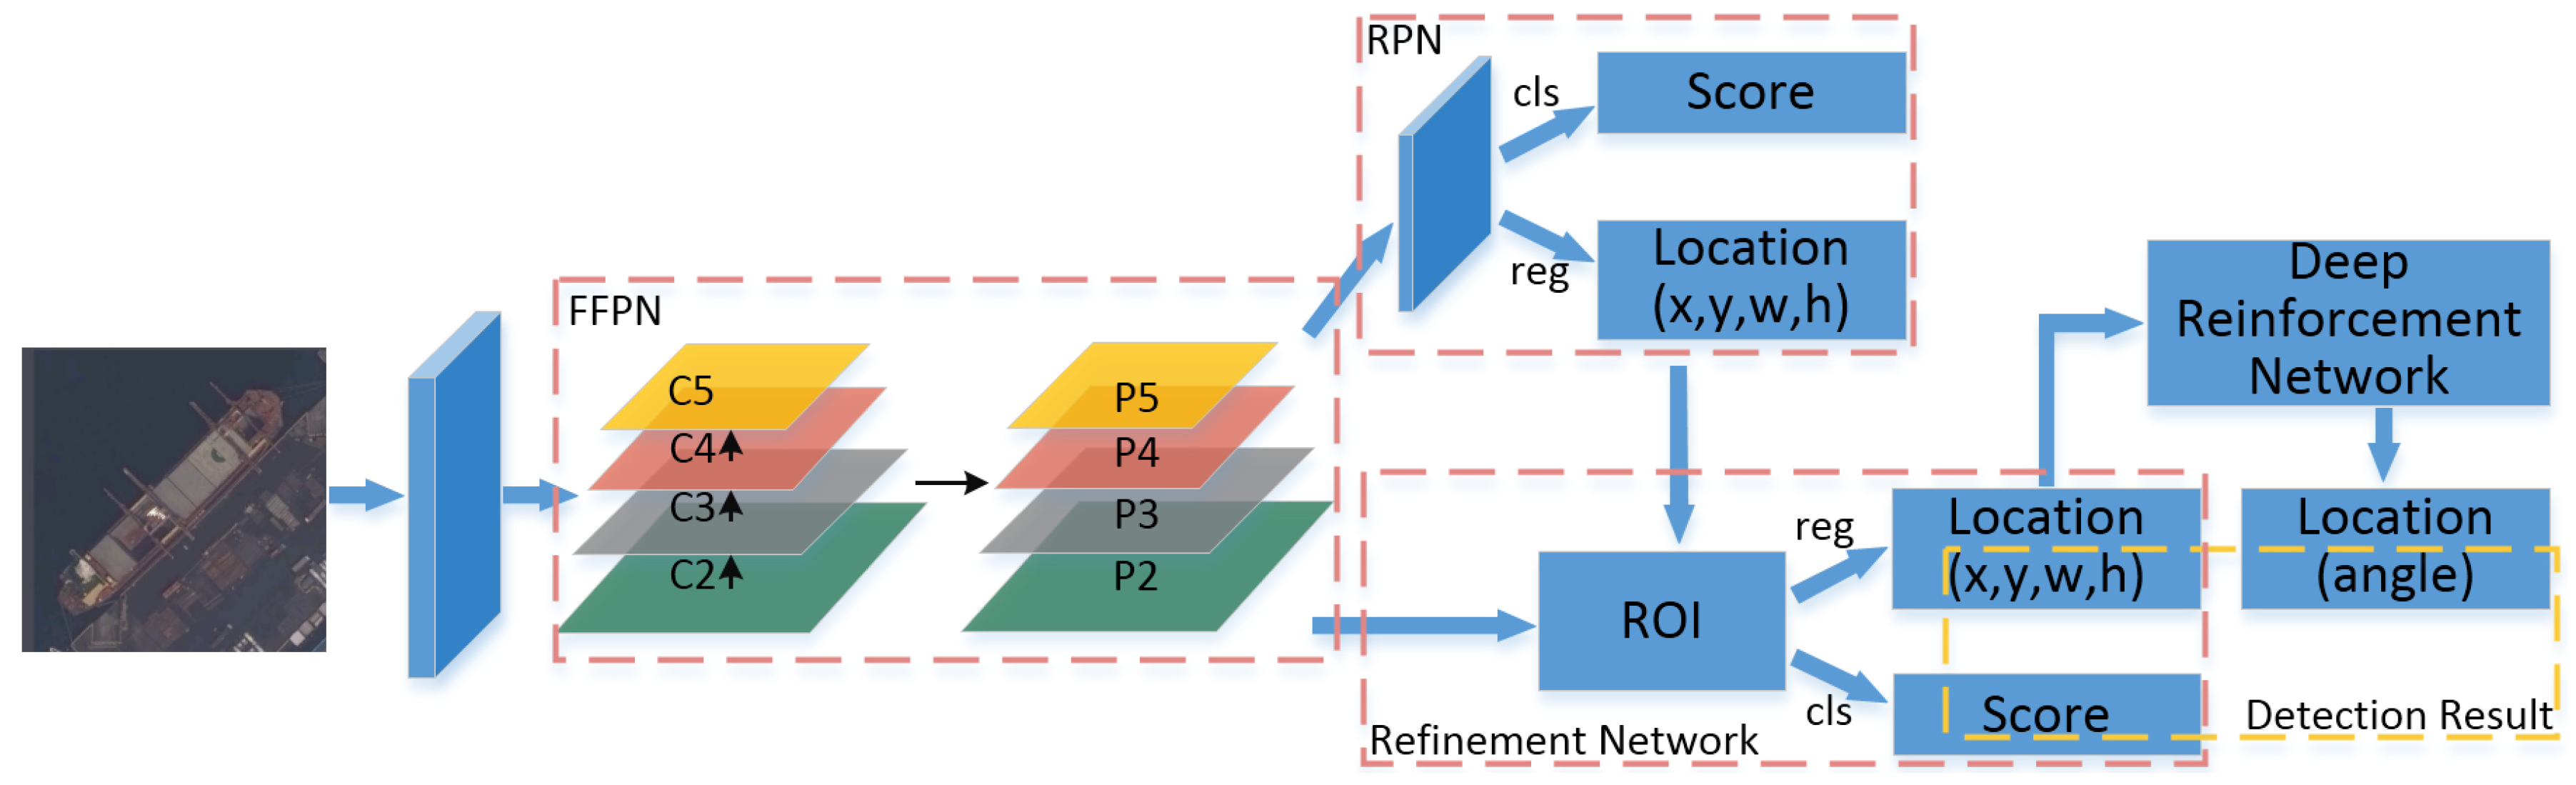
  • We construct an efficient ship detection model which unites Feature Fusion Pyramid Network and deep reinforcement learning. To the best of our knowledge, this is the first time that reinforcement learning is applied to the remote sensing ship detection task. The model achieves accurate detection results with angle information.
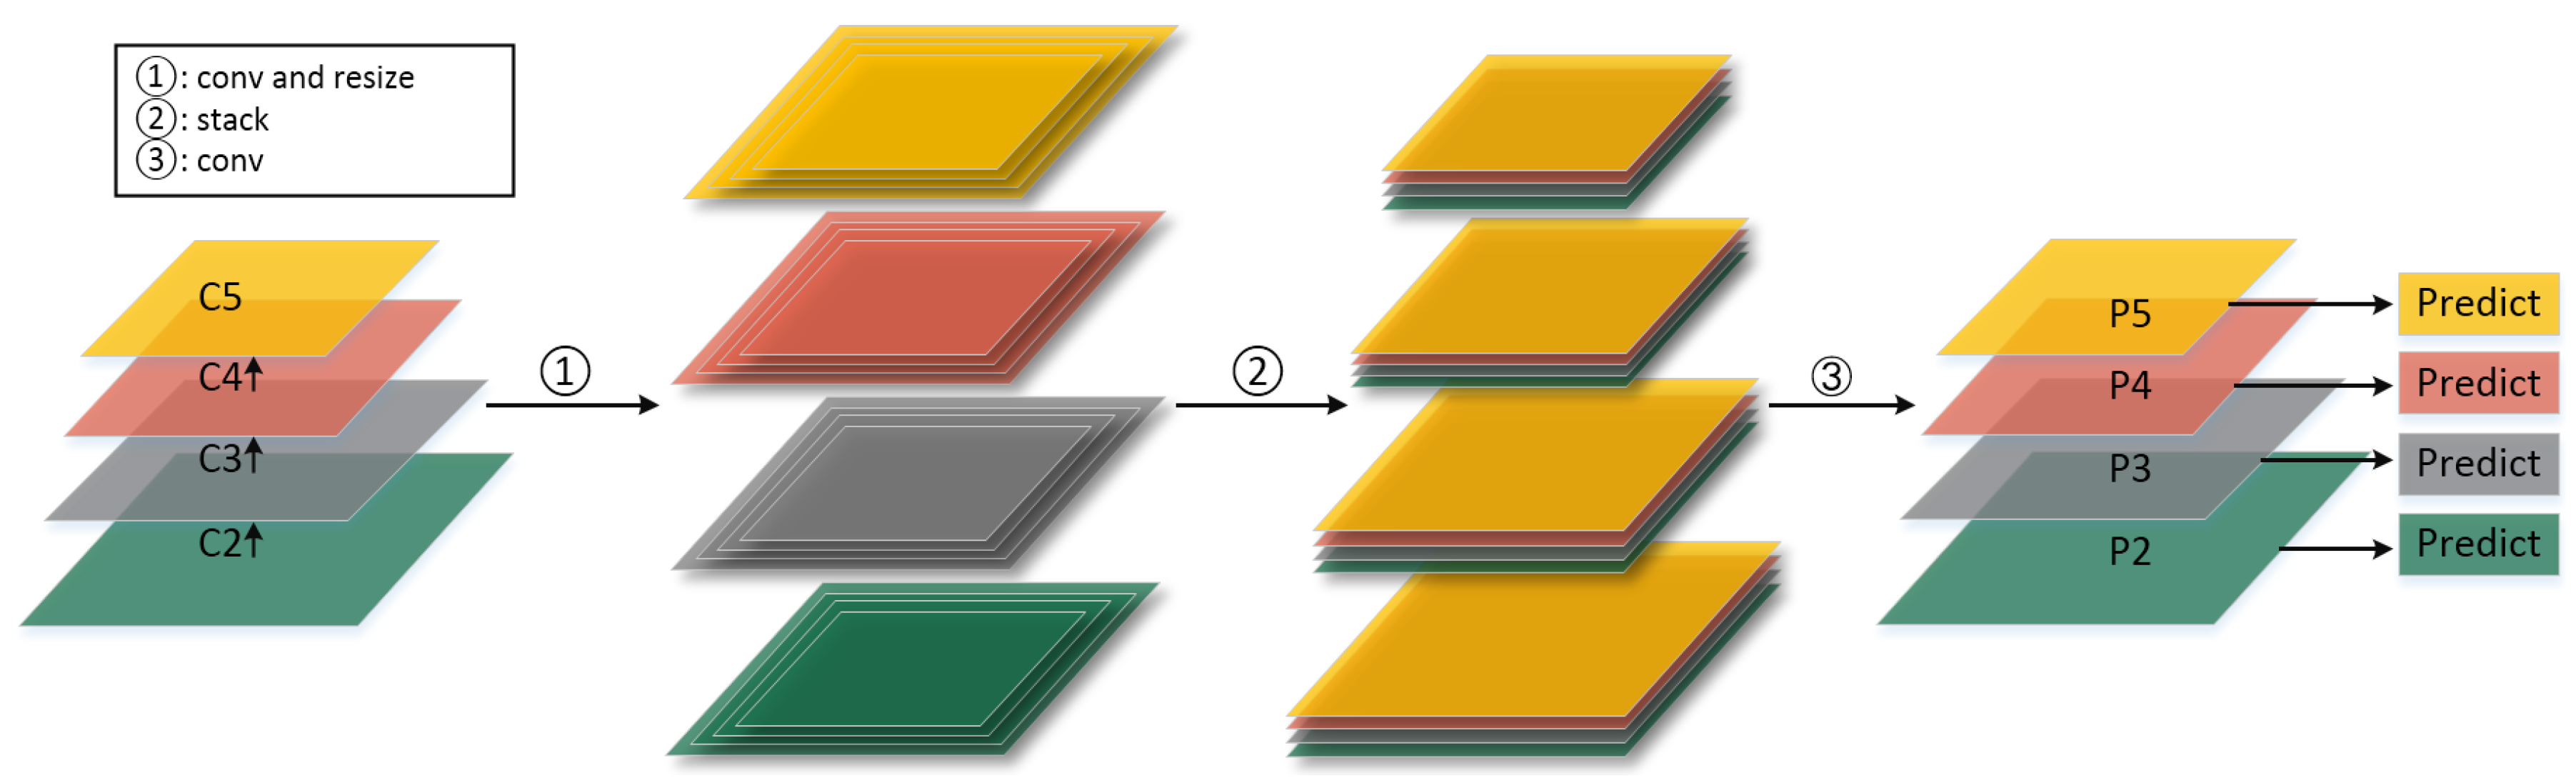
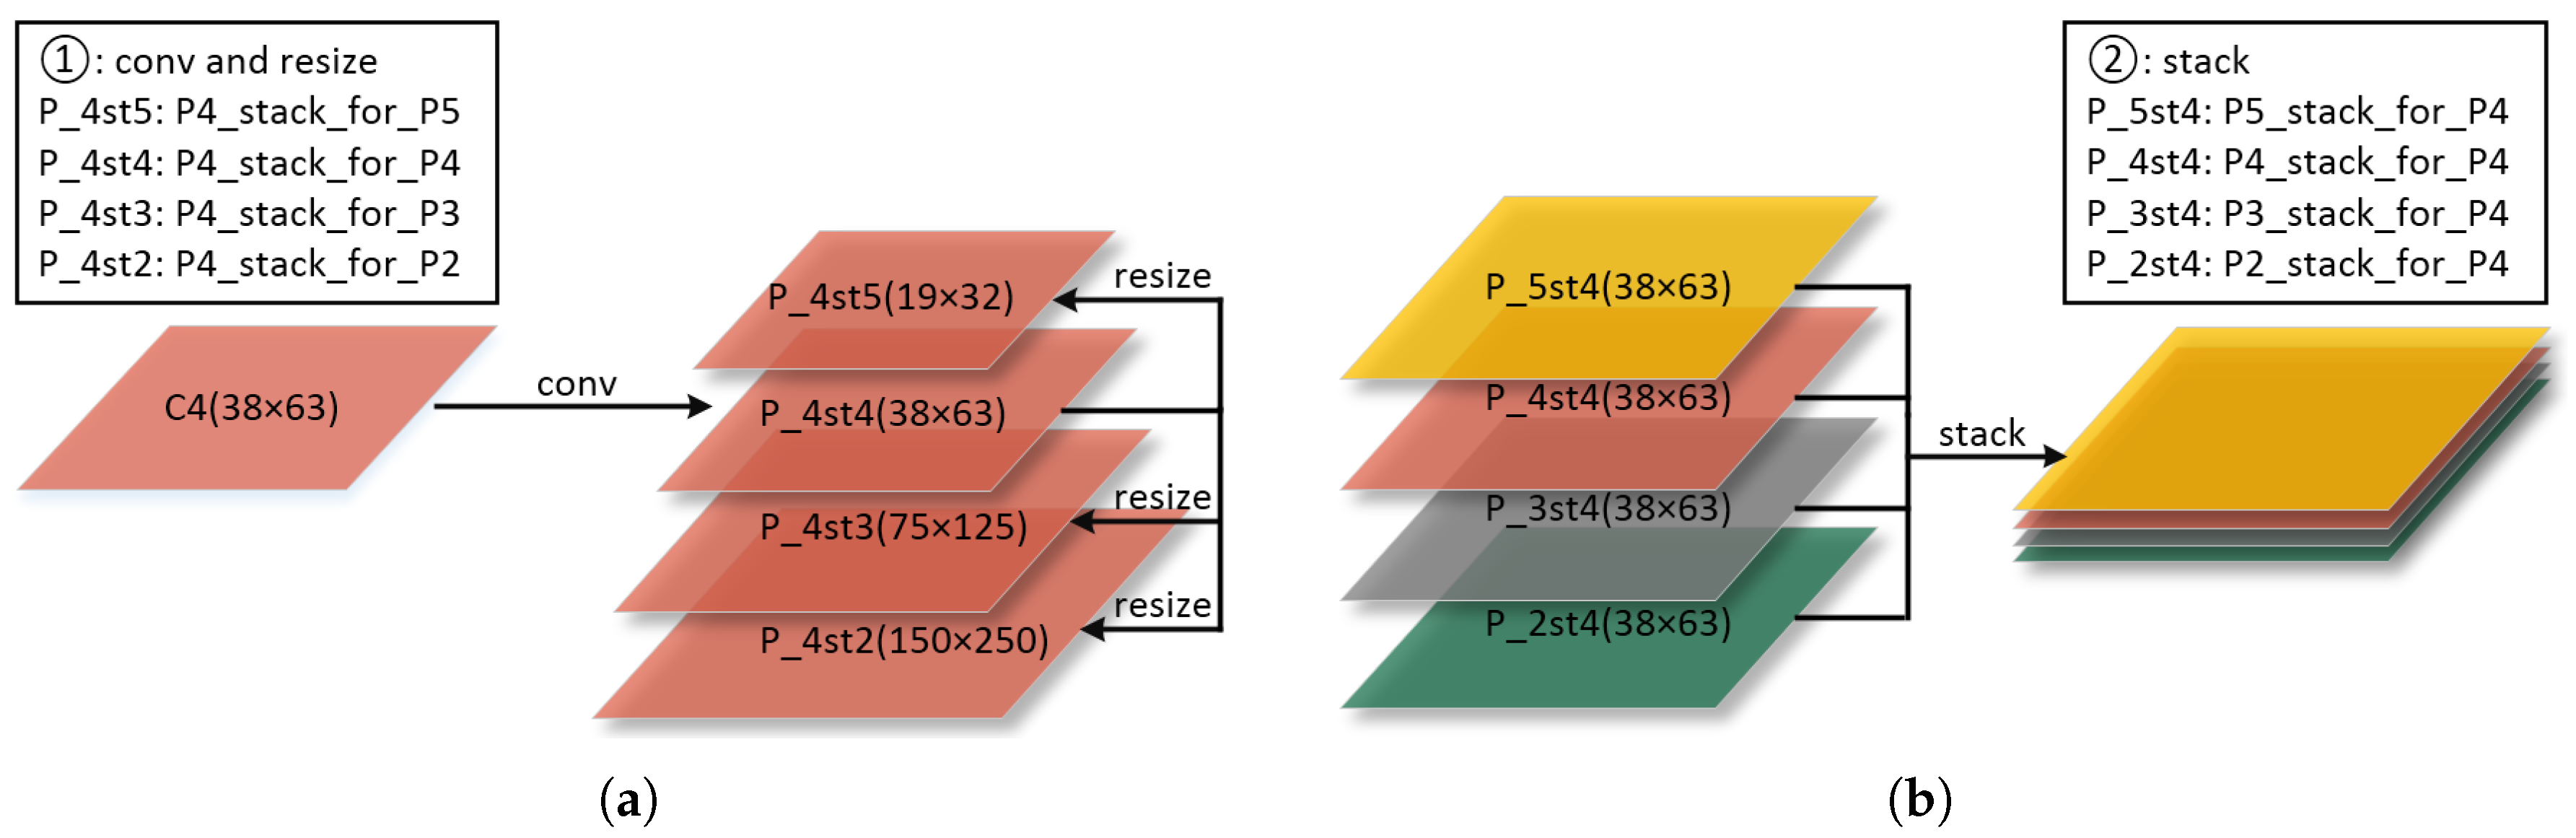
  • We build the Feature Fusion Pyramid Network (FFPN) through the multi-scale feature reuse in feature pyramids. FFPN can fully utilize features of different scales, and sufficiently combines the location and semantic information. It is effective for ship detection of different scales. Semantic information is considered as discriminable features of ships. It is encoded by neural networks to represent the characteristics of ship category.
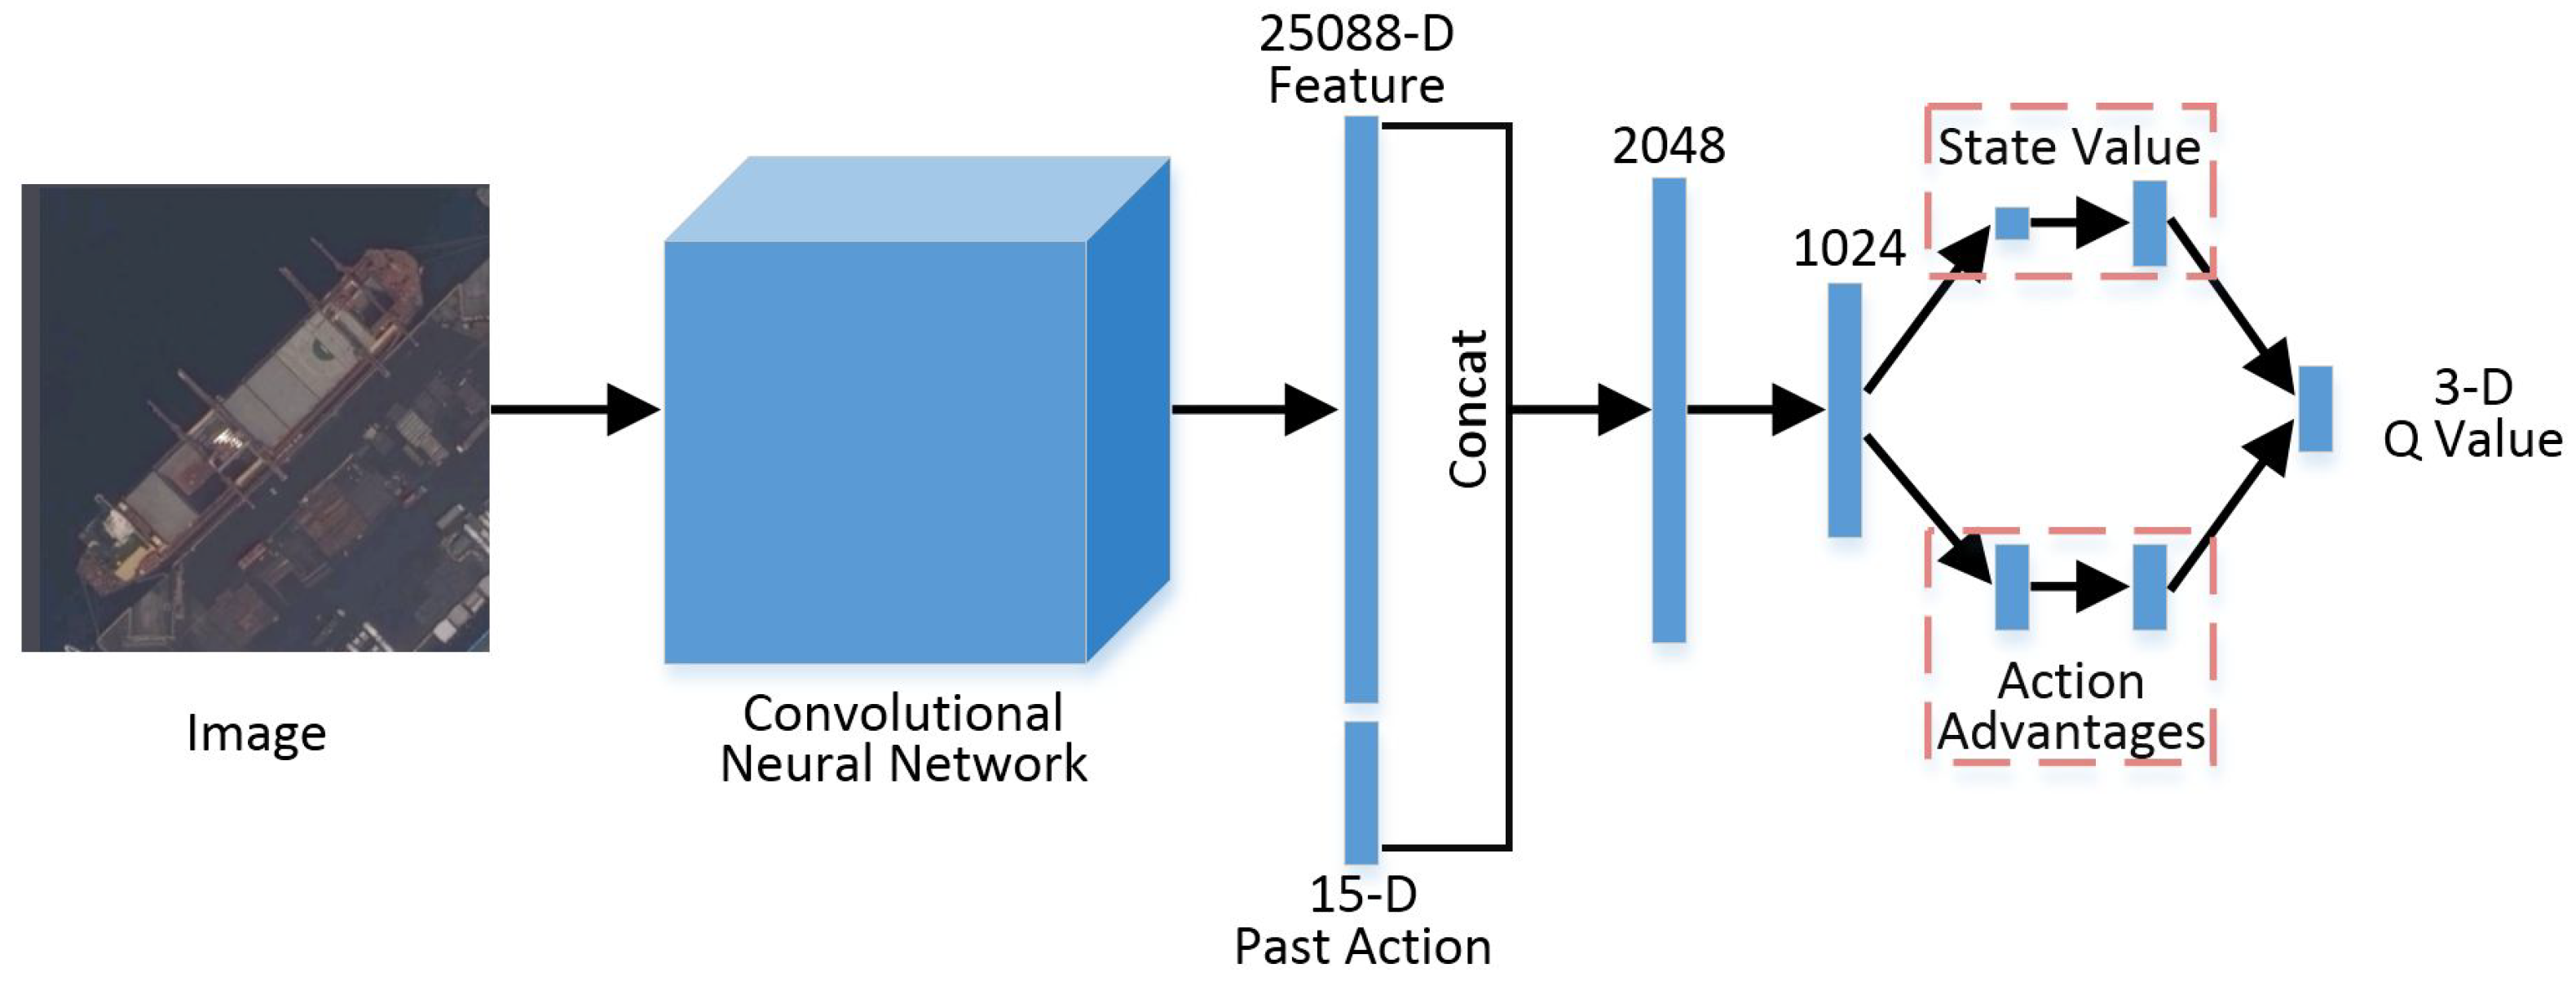
  • We convert the ship angle prediction task to a Markov Decision Process. A prediction agent based on a dueling deep Q network is trained through policy guidance and a long-term training method proposed in this paper. By iteratively rotating the ship image, the agent can obtain the accurate orientation information of a ship.
  • We adopt the soft rotation non-maximum suppression (SRNMS) algorithm to suppress redundant detection results. Combining the detection rectangle with an angle and the soft suppression strategy, SRNMS is able to avoid the absolute suppression, reduce the missed detection, and further improve the overall detection performance.
The rest of this paper is organized as follows: the ship detection model and important parts are presented in Section 2. Section 3 introduces the thorough comparison experiments and analyses in detail. Section 4 discusses the results of a detection model we proposed. In addition, the paper is concluded in Section 5.

2. Proposed Ship Detection Method

We present the details of our ship detection model (FFPN-RL) in this section. Compared to horizontal detection framework, our model is able to generate an inclined result with an angle that better describes the state of ship. We divide the entire detection task into three parts: classification, location detection, and angle prediction. We design two-stage networks to complete the first two missions through classification and regression. In addition, we use deep reinforcement learning to iteratively predict the angle.
Figure 1 shows the whole ship detection model. The Feature Fusion Pyramid Network (FFPN) can generate features of various scales, which are used as input for Region Proposal Networks (RPNs), and Regression and Classification Refinement Detection Networks. Through RPN, the detection framework can get high-quality horizontal proposals of raw input images. The refinement network can classify and regress based on the proposals to acquire the category and location information. In addition, the angle prediction agent trained by reinforcement learning can get accurate angles based on the location result generated in refinement networks. Finally, soft rotation non-maximum suppression is adopted to remove redundant inclined detection boxes. Each part of the proposed method is detailed in the following sections.

2.1. Feature Fusion Pyramid Network

Most of the object detection methods only use the high level features of the neural network for prediction. Low level features have less semantic information; nevertheless, the object location is accurate. In contrast, the semantic information of high level features is rich, but the object location is relatively rough. The Feature Pyramid Networks (FPN) in [21] is able to integrate the semantic information of high level and the location information of low level with special top-down connection, which is beneficial to the object detection of different scales.
Remote sensing ship detection not only accurately locates ships but also distinguishes ships and backgrounds from extremely complex remote sensing images. The FPN adds the resized higher layer feature map to the current layer to obtain the new feature map. The aliasing effect generated by this kind of feature map connection may have a negative impact on ship location and classification. For reducing the above influence and increasing the utilization of features, we propose the Feature Fusion Pyramid Network (FFPN), which is shown in Figure 2.
In FFPN, we take ResNet50 as the network backbone. The outputs of each stage last residual block in ResNet50 are used as original feature maps, which are C2, C3, C4, and C5. Through convolution, resizing and stacking operations, the original feature maps are converted to fused feature maps as Figure 2 shows. We define the fused feature maps as {P2, P3, P4, P5, P6}. In addition, P6, which is not illustrated in Figure 2, is generated through two stride convolutions of P5.
Specifically, we take the feature map C4 as an example to illustrate the feature fusion process in detail. As shown in Figure 3a, we perform convolutions on C4 and get the feature map P_4st4. Then, we perform the nearest neighbor upsampling and downsampling operations on the P_4st4 to obtain the P_4st5, P_4st3 and P_4st2 at different scales. After operation ①, we can get four groups of feature maps. Each of them contains four scale feature maps. As shown in Figure 3b, we stack the P_5st4, P_4st4, P_3st4 and P_2st4 feature maps that have same size. Finally, in operation ③, we perform convolutions to reduce the number of channels and aliasing effect.
The Feature Fusion Pyramid Network can significantly provide detailed information for bounding box regression and classification in the following network, and it is beneficial to overall ship detection.

2.2. Location and Classification Prediction in Ship Detection

In this section, we introduce our method to detect the location and predict the ship/non-ship score of arbitrary-oriented ship. Firstly, we describe the ground truth definition of ship. Then, we introduce the location and classification prediction networks in detail. Finally, we present the multi-task loss function in training.

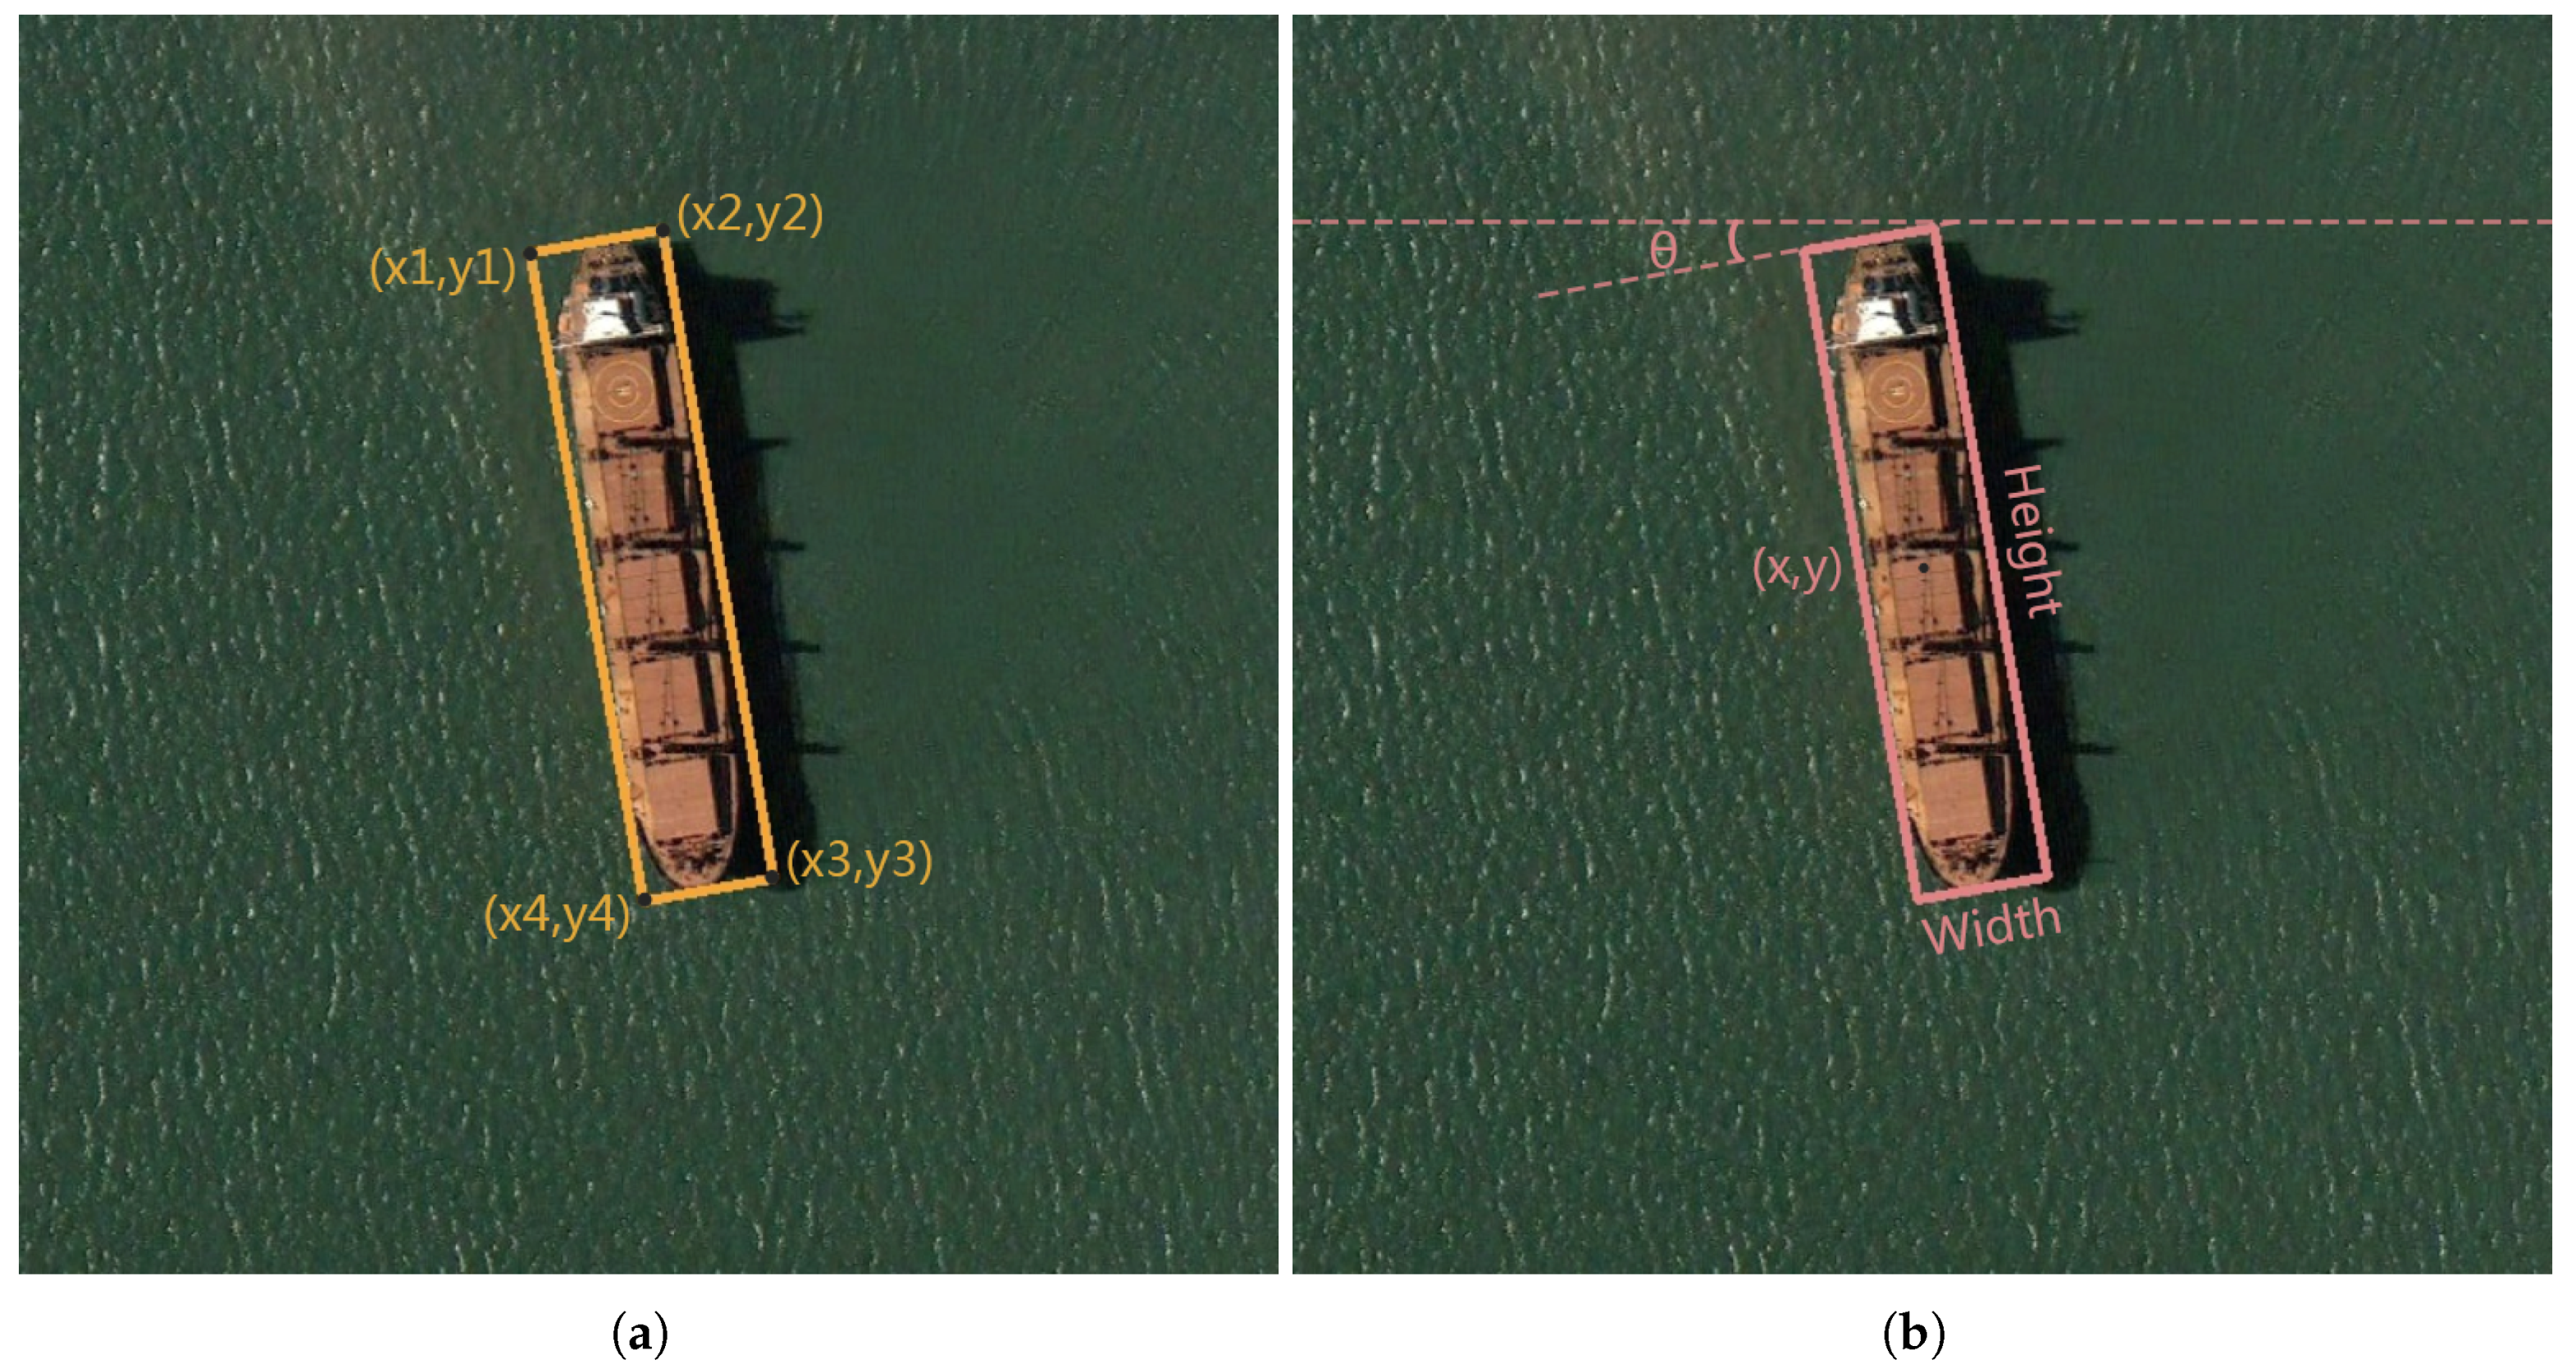
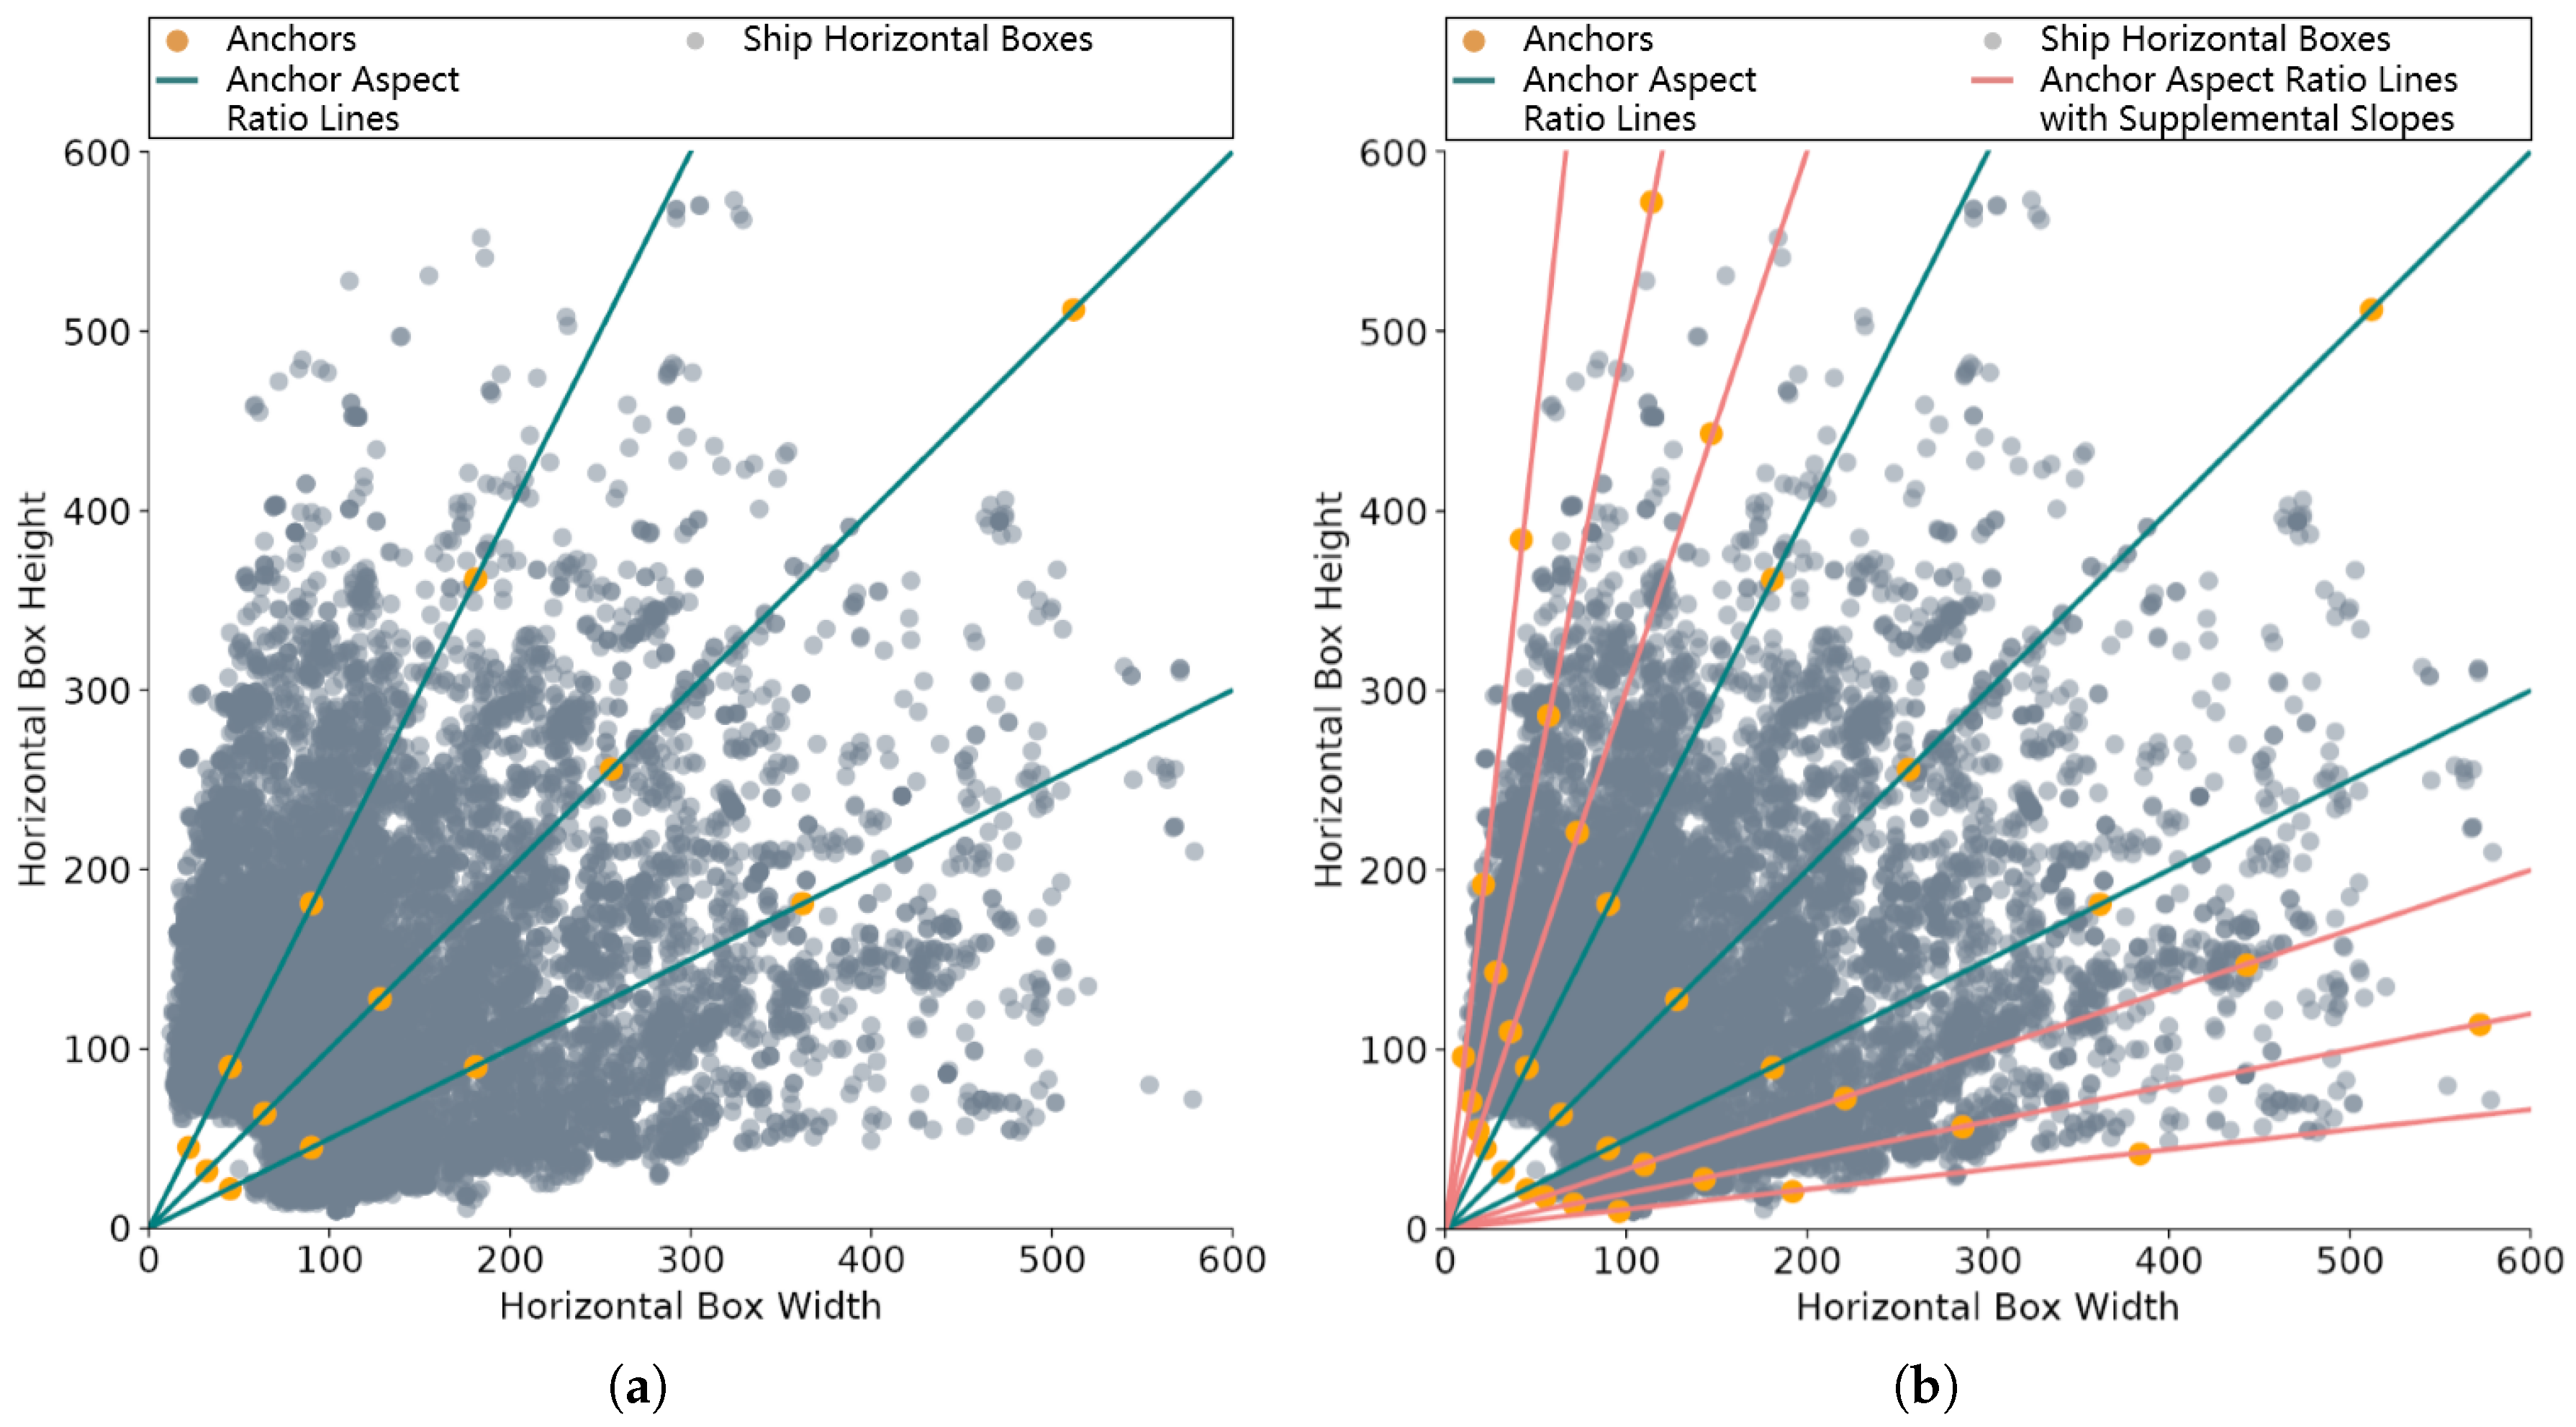
2.2.1. Ground Truth Definition

Unlike the horizontal ground truth of traditional object detection, the ground truth of object with large aspect ratios like ship and text is usually composed of four point coordinates ( x 1 ,   y 1 ,   x 2 ,   y 2 ,   x 3 ,   y 3 ,   x 4 ,   y 4 ) , which tightly surround objects as shown in Figure 4a. In order to simplify the detection of this kind of object, the quadrilateral ground truth is approximated as an inclined rectangle. In scene text detection, work in [26] adopts the first two point coordinates clockwise and the height of the bounding box to represent an inclined rectangle ( x 1 ,   y 1 ,   x 2 ,   y 2 ,   h ) . In our work, the horizontal axis forms two angles with the two sides of inclined rectangle in the counterclockwise direction. We select the smaller one ( θ ) as the angle in ground truth. The edge corresponding to this angle is width, and the other side is height. Then, in our work, we combine these three variables ( w i d t h ,   h e i g h t ,   θ ) with the center point coordinates ( x ,   y ) as the ground truth of ship, which is shown in Figure 4b.

2.2.2. Location and Classification Prediction Networks

The region proposal network, regression and classification refinement network constitute the overall location and classification prediction networks as shown in Figure 1. Benefiting from FFPN in Section 2.1, the region proposal network can generate horizontal proposals which contain ships in any orientation. After ROI pooling operation on these horizontal proposals, the extracted features are concatenated to the fully connected layers for final classification and regression. In addition, we can get the probability, the center point coordinate, width and height of ship.
Region Proposal Network: In our detection model, RPN is used to generate high quality horizontal region proposals which contain ships in any orientation. Through FFPN, we can get the fusion feature maps {P2, P3, P4, P5, P6}. We perform two convolution operations on each fusion feature map. The first convolution fixes the channel to 512, and the second generates the coordinates of proposals ( x ,   y ,   w ,   h ) and category scores. Due to the high level and low level feature fusion at different scales in FFPN, RPN can simultaneously focus on the location and semantic information of ship which is crucial to detecting ships with large scale difference in remote sensing images.
We assign anchors of a single scale to each feature map. In addition, in order to accurately calculate and reduce error, we assign anchors of 32, 64, 128, 256, 512 scales to P2, P3, P4, P5, P6. We set the anchor ratios to 1/9, 1/5, 1/3, 1/2, 1.0, 2.0, 3.0, 5.0 and 9.0. The appropriate anchor aspect ratio is beneficial to ship detection. We keep other hyperparameters of RPN the same as original FPN in [21], including the definition of positive samples and negative samples. Figure 5 shows the multiscale region proposals generated by RPN based on FFPN.
Regression and Classification Refinement Network: Behind RPN, we design the regression and classification refinement network in our ship detection model. Specifically, we implement ROI pooling on multiple levels of the feature pyramid to obtain fixed size features. In addition, in a refinement network, we remove the P6, the feature pyramid is P2, P3, P4, P5. Then, we connect the fixed size features to two 1024-d fully-connected layers followed by final classification and regression layers. Finally, we can get the probability, center point coordinate ( x ,   y ) , width and height of inclined rectangle illustrated in Figure 4b.
We perform non-maximum suppression with 0.7 threshold to get 2000 ROIs generated by RPN. Science the ship is a large aspect ratio object, we use 7 × 7, 3 × 14 and 14 × 3 ROI poolings to extract features to reduce the negative influence caused by the cropping and resizing operation. To train the regression and classification refinement network, we select 256 ROIs for each image, and the ratio of positive and negative samples is 1:1.

2.2.3. Multi-Task Loss Function

In the RPN network training, the category of anchor and the loss function are the two critical parts. We use the loss function similar to the Faster RCNN [20] at the RPN stage. The horizontal ground truth bounding box is defined as { x m i n ,   y m i n ,   x m a x ,   y m a x } . In addition, x m i n is the minimum of the four abscissas illustrated in Section 2.2.1, and x m a x is the maximum. Similarly, y m i n is the minimum of the four ordinates, and y m a x is the maximum. In addition, we determine whether the anchor belongs to the category containing ship through the IoU (Intersection over Union) between the anchor and the horizontal ground truth bounding box of ship. Specifically, the following rules are used in our work: (1) if the IoU between the anchor and every horizontal ground truth bounding box is less than 0.3, the category of anchor is defined as the negative region; (2) if the IoU between the anchor and one horizontal ground truth bounding box is greater than 0.75, the category of anchor is defined as the positive region; (3) if the anchor has the highest IoU between any bounding box, we also define it as the positive region. Neutral anchors do not match the conditions above, and they also do not have an influence on the loss function.
In the training of regression and classification refinement networks, we perform the loss function calculation on sampled region proposals generated by RPN. The loss function is composed of two parts: the ship/non-ship classification loss, the central point coordinate and scale regression loss. The multi-task loss function that needs to be minimized is defined as:
L ( p , c , i , i * ) = L c l s ( p , c ) + λ c L r e g ( i , i * ) ,
where the parameter p generated by a softmax function in a prediction network is the probability distribution of ship and background. The parameter c represents the category label. L c l s ( p , c ) is cross-entropy loss for binary classification, and L c l s ( p , c ) = l o g p c is the log loss for true class.
The parameter i = ( i x , i y , i w , i h ) is the coordinate and the scale information of inclined ground truth rectangle bounding box, and i = ( i x * , i y * , i w * , i h * ) is the prediction value through network regression. λ is the balance parameter in training. Regression loss is defined as:
L r e g ( i , i * ) = s m o o t h L 1 ( i * i ) ,
s m o o t h L 1 ( x ) = 0.5 x 2 , if   | x | < 1 , | x | 0.5 , otherwise .

2.3. Angle Prediction Based on Deep Reinforcement Learning

As Figure 6 shows, the ship ground truth is mark with blue box. At the same center point and scale conditions, the yellow inclined rectangle is the result generated by counterclockwise 5° rotation of ground truth. Through calculation, we can find that only 5° difference results in 0.76 IoU between two boxes, which may greatly affect the final detection and evaluation. Due to the large aspect ratio of ship, angle prediction accuracy is vital for ship detection in remote sensing images.
In this section, we present our angle prediction agent based on deep reinforcement learning in detail. Some researchers have utilized the convolutional neural network detection framework to directly regress ship angle. In contrast, our approach is to iteratively predict the angle. We adopt Markov Decision Processes in the ship angle detection task. With reinforcement learning, we train an intelligent agent to continuously rotate the remote image which contains an inclined ship to horizontal position, and the rotation angle is a fixed number of values every time. Eventually, we can get the prediction of ship angle through the entire rotation process. The accuracy of ship angle prediction is positively correlated with the total cumulative discounted reward in the ship angle prediction Markov Decision Process. The angle prediction agent is able to choose the appropriate actions to obtain a high total cumulative discounted reward.

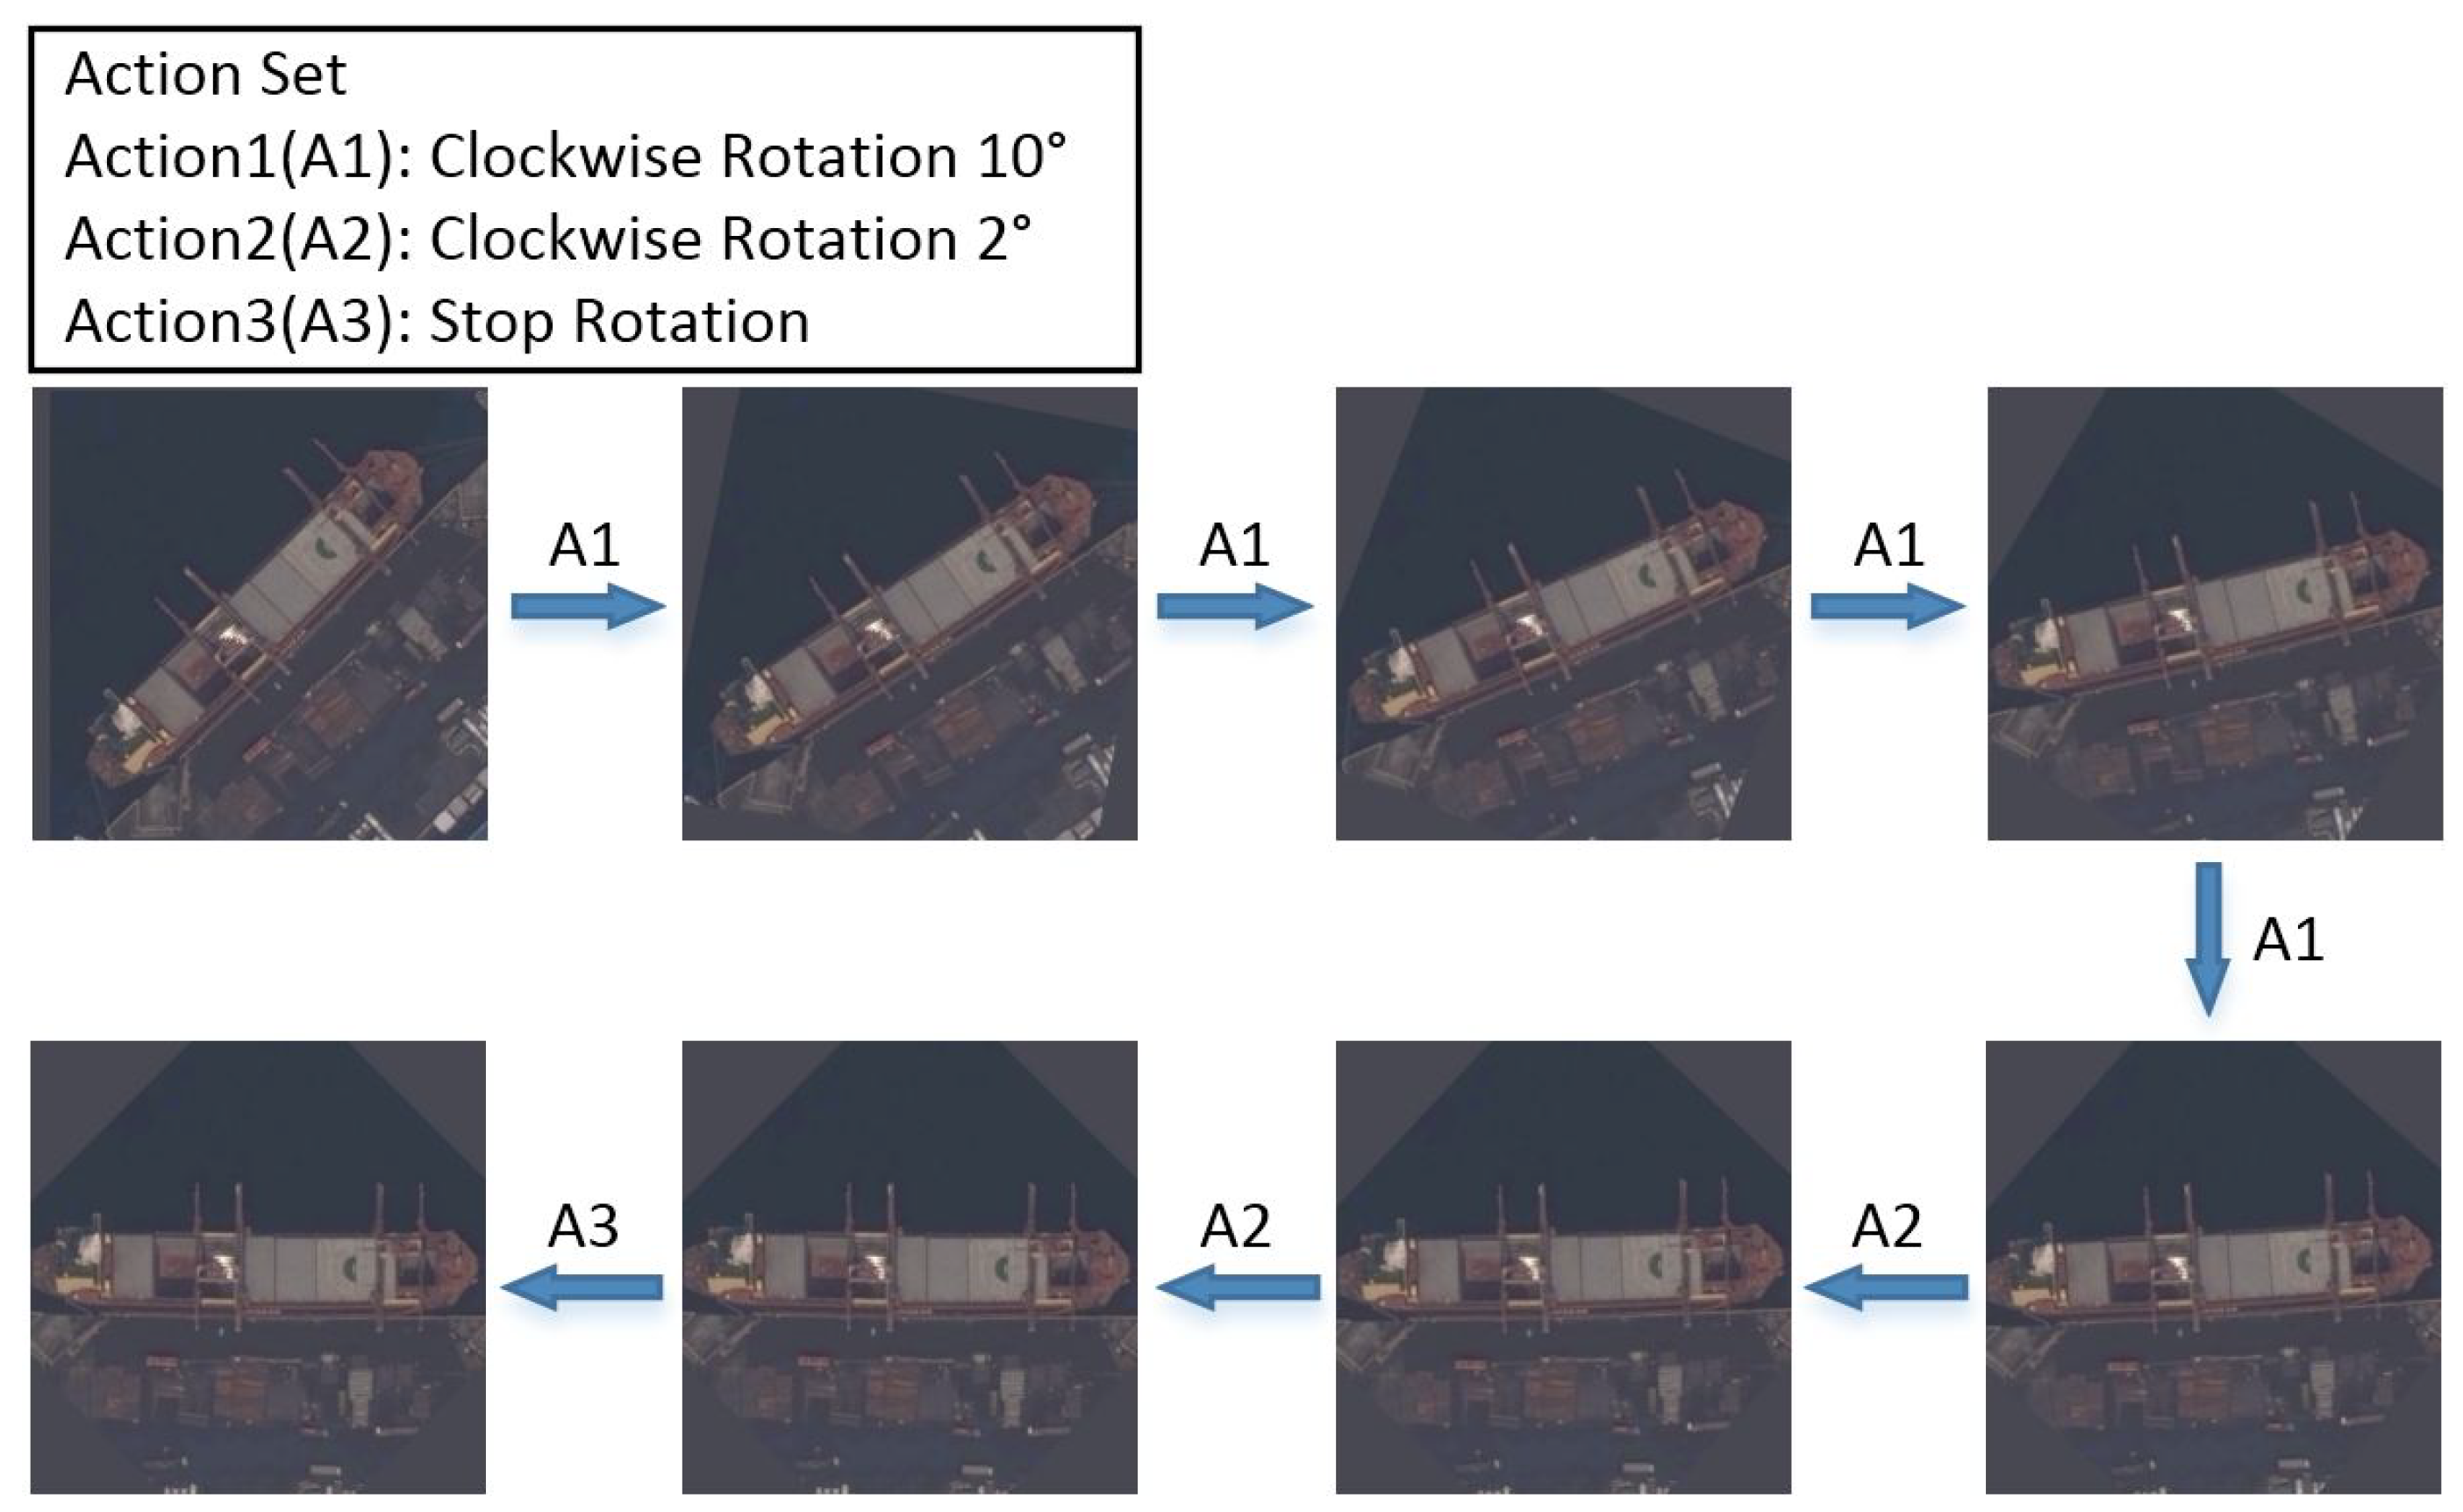
2.3.1. Markov Decision Process of Ship Angle Prediction

In Markov Decision Processes (MDPs) of ship angle prediction, the rotation agent observes the current inclined ship image (State), and it selects one action from our pre-defined Action Set. Then, the ship rotates at a certain angle which the selected action determines. In addition, the agent receives a corresponding encouragement or punishment based on whether the ship is closer to the horizontal position. These decision processes and state transitions are continually cycled until the end of MDP. In the above MDP, there are three import elements: State Set, pre-defined Action Set and Reward Function which evaluate the selected action.
We use the part of current remote sensing image that contains the inclined ship to contrast the state in angle prediction MDP. Specifically, we crop the square containing ship as the initial image. The center of the square coincides with the center of ship, and the side length of the square is 2 × W i d t h 2 + H e i g h t 2 . At the same time, we adopt the past action selected by an agent in the construction of state to improve the stability of training process. Consequently, the current inclined ship image and the past action encoded through one-hot constitute the state in angle prediction MDP.
The action set consists of three actions: Action1, Action2 and Action3. When the angle detection agent selects Action1, the ship will be rotated 10° clockwise. Correspondingly, when Action2 is selected, the ship will be rotated 2° clockwise. Action3 marks the end of the rotation process. After selecting Action3, we can get the predicted value of the ship angle through the overall decision-making process. With these different rotation angles in action sets, we can achieve higher prediction accuracy and reduce the number of decision-making actions. This short-term MDP can facilitate the convergence of the training process. Figure 7 shows the action set in angle prediction MDP. After selecting several Action1 and Action2s, the ship is rotated to corresponding angle clockwise. Finally, the ship is rotated to horizontal position until Action3 is selected, and we can get the ship angle.
The reward function encourages or punishes the angle prediction agent through the selected action. The agent accumulates experience with the above reward, learns from it and finally selects appropriate actions in each decision. We contrast the reward functions R a 1 ( s t , s t + 1 ) , R a 2 ( s t , s t + 1 ) , R a 3 ( s t , s t + 1 ) for each action based on the difference between the ground truth angle ( a n g l e _ t r u e ) and the next angle ( a n g l e _ n o w t + 1 ) , which is generated by adding current angle ( a n g l e _ n o w t ) with the angle corresponding to the action selected by agent. We define the initial angle of each MDP process to be 1° ( a n g l e _ n o w 1 = 1 ° ) . The reward functions are defined:
R a 1 ( s t , s t + 1 ) = + 2 , if   0 ° a n g l e _ t r u e a n g l e _ n o w t + 1 , 2 , otherwise ,
R a 2 ( s t , s t + 1 ) = + 2 , if   1 ° < a n g l e _ t r u e a n g l e _ n o w t + 1 < 8 ° , 2 , otherwise ,
R a 3 ( s t , s t + 1 ) = + 5 , if   1 ° < a n g l e _ t r u e a n g l e _ n o w t + 1 1 ° , 5 , otherwise ,
where the state is s t at time t, and the ship prediction agent selects action a t , then the state changes into s t + 1 . Based on the difference mentioned above between angles and the threshold we set, the agent gets encouragement ( + 2 , + 5 ) or punishment ( 2 , 5 ) .
The reward function R a 1 ( s t , s t + 1 ) and R a 2 ( s t , s t + 1 ) evaluate whether the agent rotate the inclined ship at an appropriate angle. For example, when the difference between the ground truth angle and the current angle is 13°, it means that the agent needs to rotate the ship 13° clockwise to the horizontal position. At this time, if the agent select the action A1 which rotates the inclined ship 10° clockwise, the difference between the ground truth angle ( a n g l e _ t r u e ) and the next angle ( a n g l e _ n o w t + 1 ) changes to 3°, then the agent can get + 2 encouragement. If the action A2 is selected, the angle difference changes into 11°, and the agent will be punished 2 .
The reward function R a 3 ( s t , s t + 1 ) measures the angle prediction accuracy. When the end action A3 is selected, the entire MDP is over. If the absolute value of angle difference is greater than −1° and less than or equal to 1°, the end encouragement is + 5 ; otherwise, the punishment is 5 .

2.3.2. Dueling Double Deep Q Learning

Q learning is a reinforcement learning algorithm that is used to find an optimal action-selection policy to maximize the sum of the discounted rewards. The Q function is defined as Q π ( s , a ) = E [ R t | s t = s , a t = a , π ] , and it represents the Q value of action a in state s and policy π which is a policy mapping states to actions. The optimal action value is defined as Q * ( s , a ) = m a x π E [ R t | s t = s , a t = a , π ] ; it represents the maximum expected return in any policy. According to the Bellman equation, we adopt the deep neural network to estimate the optimal action value function Q ( s , a , θ ) where θ is the network parameters.
Furthermore, we adopt dueling network architecture in our work because the estimation of state value is of great importance for every state. Contrasted with the stack structure of fully connected layers in a traditional deep Q model, the dueling network uses two parallel streams at the end of the network. One stream calculates the state value, and the other is used to estimate the action advantage function. After parallel structure, two streams are connected to Q output.
As shown in Figure 8, dueling network architecture contains convolutional neural networks, connection of features and past actions, two fully connected layers, State Value part, Action Advantages part and 3D Q value output. The ResNet50, which is pre-trained on the ImageNet [37] and has effective feature extraction performance, is used to initialize weights in convolutional neural networks.
The combined Q value is defined as:
Q ( s , a ; c , w v , w a ) = V ( s ; θ , w v ) + A ( s , a ; θ , w a ) ,
where s is the state, and a is the action. c is the weight of convolutional neural network. w v and w a are the fully connected layer parameters of state value part and action advantage part. V ( s ; θ , w v ) calculates the value for each state, and A ( s , a ; θ , w a ) estimates the advantages for three actions in our angle prediction MDP.

2.3.3. Training of Dueling Double Deep Q Network

The neural network in parallel structure can automatically compute the value and action advantages, and they have no influence on the network optimization. We adopt a double deep Q algorithm (DDQN) to optimize the Q network. Different from a single Q network in [28], DDQN uses two Q networks (Q and Q ) to avoid high estimation of action Q value. Two Q networks correspond to action selection and evaluation. The update of neural network weights is defined as:
w i + 1 = w i + α ( r + β Q ( s t + 1 , a r g m a x a Q ( s t + 1 , a ; w i ) ; w i ) Q ( s t , a ; w i ) ) w i Q ( s t , a ; w i ) ,
where w i is the ith weights of deep Q network (Q) and the w i + 1 is the ( i + 1 ) th weights. w i is the ith weights of target deep Q network ( Q ). The angle prediction agent selects action a at state s t ; then, the state changes into s t + 1 . The learning rate is α , and β represents the discount factor in discounted reward.
We use policy guidance instead of random action selection in the original algorithm to help the angle prediction agent make appropriate action in training. The original dueling double deep Q network (dueling DDQN) selects random action with a probability of ε in each ε g r e e d y decision-making stage. However, we optimize this kind of selection in our method. Before the agent selects action, we can calculate the difference between the ground truth angle and the current angle. Based on the angle difference, the most appropriate action is chosen for the agent to get the + 2 or + 5 encouragement. Compared with random selection, this kind of policy guidance increases the proportion of positive reward in experience buffer, which improves the performance of the agent.
For the angle prediction task, we replace the single step training in the original algorithm with the long-term training that updates weights until one MDP is ended. On one hand, this approach enables the agent to quickly accumulate experience, and, on the other hand, it accelerates the training of networks.
Algorithm 1 shows the training pseudo code of optimized dueling double deep Q network. We adopt the policy guidance and long-term training method to make the angle prediction agent learn effectively. Subsequent experiment results demonstrate the advantages of the optimized algorithm.
Algorithm 1 Optimized Dueling Double Deep Q Learning
Input: dueling deep Q network Q with weights w, target dueling deep Q network Q with weights w which are duplicated from w, empty experience deque buffer B.
Output: the weights of trained dueling deep Q network
 set ε with 100% in ε g r e e d y policy
for loop counter = 1, I do
    update ε with m a x ( ε 10 % , 0 . 1 )
    for ship counter = 1, J do
    initialise state s 1 (inclined ship image m 1 + past action p 1 )
    while True do
      duplicate w with w each M action selection
      if random(0,1) > ε then
         select action a i corresponding to the maximum of the Q network output
      else
         compute angle difference and perform policy guidance to get action a i
      rotate the image clockwise by the angle corresponding to a i
      get new state s i + 1 (new inclined ship image m i + 1 + new past action p i + 1 ) and reward r i
      store ( s i , a i , r i , s i + 1 ) in experience deque buffer B
      set current state s i with s i + 1
      if a i = = A 3 then
         stop current cycle
 
    Sample random batch ( s t , a t , r t , s t + 1 ) from experience deque buffer B
    if a t = = A 3 then
    set network label l t with r t
    else
    set network label l t with r t + β Q ( s t + 1 , a r g m a x a Q ( s t + 1 , a ; w i ) ; w i )
    calculate loss ( l t Q ( s t , a t ; w i ) ) 2 and update the weights in Q with loss backpropagation

2.4. Soft Rotation Non-Maximum Suppression

So far, we obtain the center point coordinate ( x , y ) , the scale ( w i d t h , h e i g h t ) and the angle ( θ ) information of ships. Because of the overall multi-stage detection framework and the abundant region proposals generated by RPN, there are redundant boxes in one remote sensing image. We need to use algorithms to reduce useless results in final detection.
Normally, the non-maximum Suppression (NMS) is used as the last operation in many detection models to reduce redundant detection bounding boxes. The NMS algorithm is based on the scores and bounding boxes in detection results. Specifically, the highest score detection bounding box is selected, and the others that have obvious overlap with the selected one are suppressed. The process is continually and recursively applied to the remaining bounding boxes until the end.
Since the ship detection results in our work are the inclined rectangles, we use the rotated bounding boxes to compute the IoU in NMS. Contrasted with the traditional horizontal detection boxes, the inclined rectangles and rotation non-maximum suppression (RNMS) can avoid large overlap and missed detection in ship rotation detection tasks.
Furthermore, we adopt the soft strategy in rotation non-maximum suppression. In traditional NMS, if the IoU is higher than the threshold, the bounding box is absolutely suppressed and disappears in subsequent steps. This approach may result in missed detection. We use a Gaussian kernel function to control the suppression extent in soft strategy. The soft rotation non-maximum suppression (SRNMS) is a signification solution to the dense parking problem. SRNMS algorithm is detailed in Algorithm 2. In addition, our evaluation results confirm the effectiveness of SRNMS.
Algorithm 2 Soft Rotation Non-Maximum Suppression
Input: inclined rectangle bounding Boxes: B = ( x 1 , y 1 , w 1 , h 1 , t 1 ) , , ( x l , y l , w l , h l , t l ) , bounding boxes length: L, bounding boxes Scores: S = ( s 1 , , s l ) , final threshold, Gaussian kernel function parameter: sigma.
Output: Index of final result: Keep
 initialize empty index set: Keep, initialize all zero suppression flag set: Suppression
for _i = 1, L do
    get the current score index in descending order: Order
    set current_index i with Order[_i]
    if Suppression[current_index] == 1 then
    stop current cycle
    add current_index i to Keep
    for _j = _i + 1, L do
    set the next score index j with Order[_j]
    if Suppression[current_index] == 1 then
      stop current cycle
    calculate rotated IoU of two inclined rectangles ( x i , y i , w i , h i , t i ) , ( x j , y j , w j , h j , t j )
    calculate suppression weight = e x p ( I o U 2 / s i g m a )
    update Scores[j] = weight × Score[j]
    if Scores[j]<final threshould then
      update suppression flag set element at index j to 1

3. Experiments and Analysis

In this section, we perform experiments to evaluate the performance of our ship detection model. Firstly, we carefully analyze the ship dataset and detail the relevant parameters of network training. Then, we design experiments to illustrate that, compared to the direct regression of neural networks, the prediction agent based on deep reinforcement learning can obtain the angle more accurately. Finally, some experiments are designed to explore the influence of Feature Fusion Pyramid Networks, the contributions that the angle prediction agent make and the importance of Soft Rotation Non-Maximum Suppression in our overall ship detection model (FFPN-RL). The comparisons with other ship detection models show the effectiveness of our method. All experiments are carried out on a NVIDIA K80M 12G GPU which is manufactured through United States NVIDIA.

3.1. Implementation Introduction

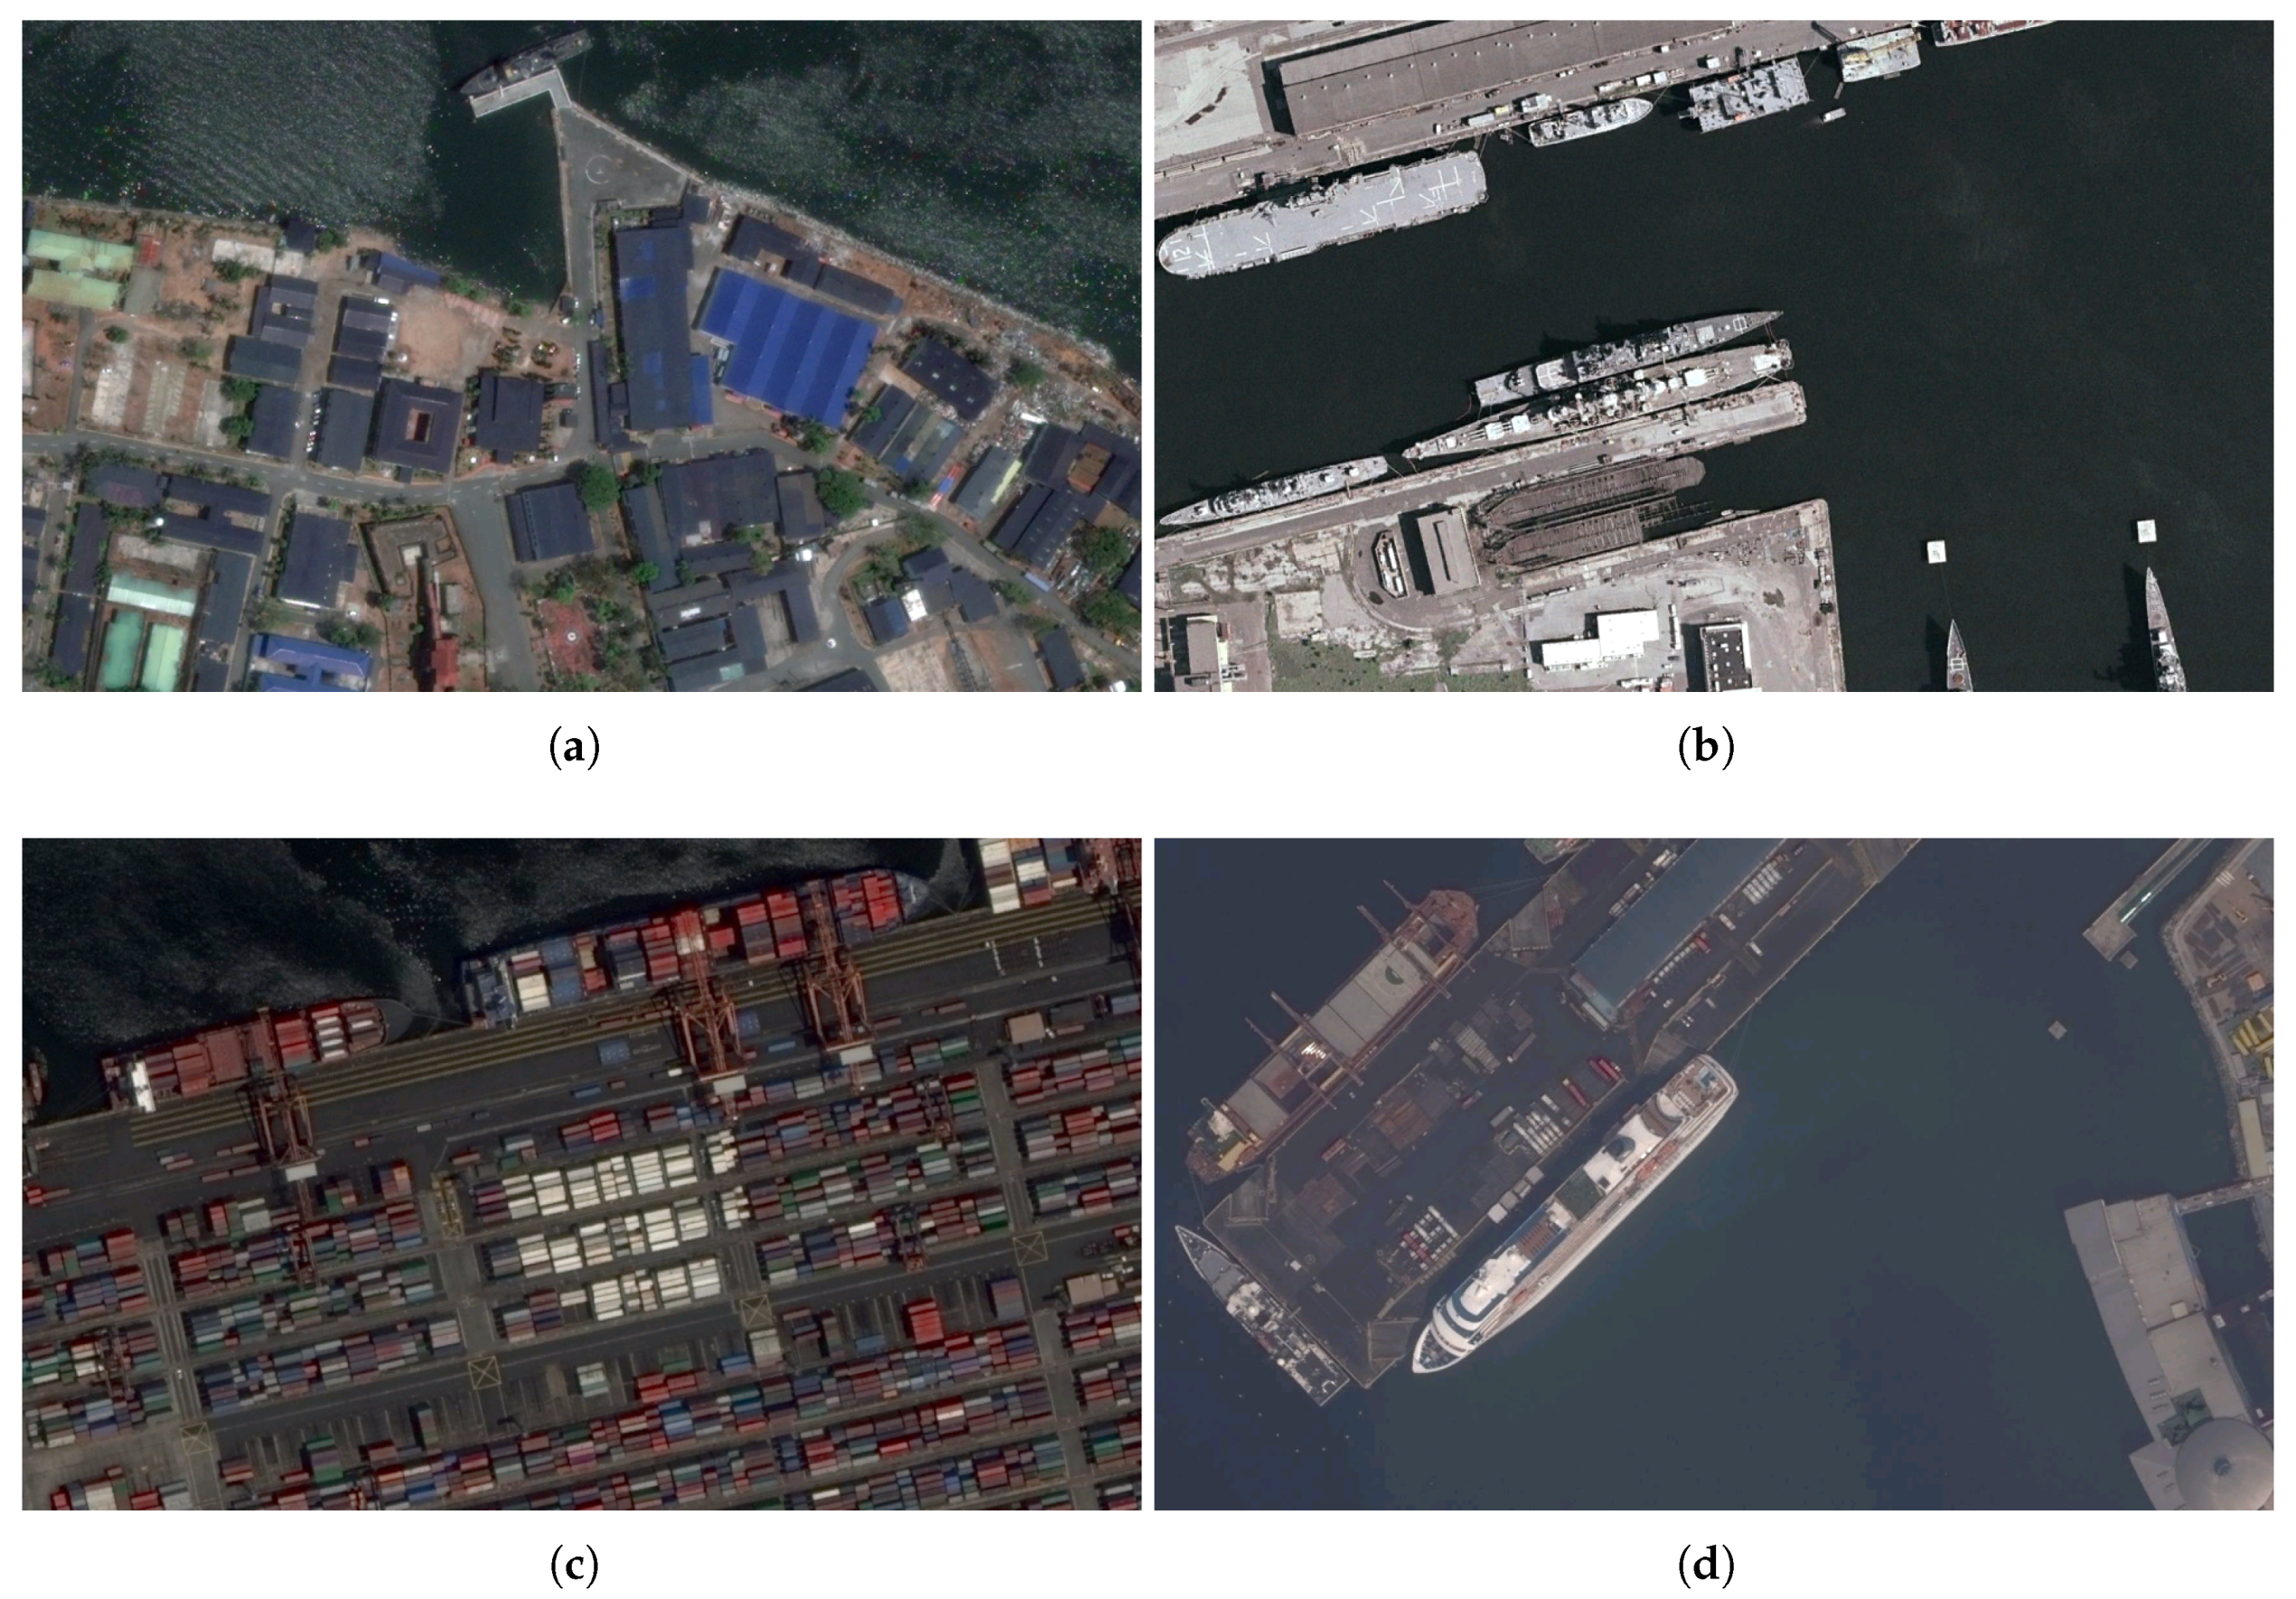
3.1.1. Ship Remote Sensing Image Dataset

We generate our ship detection dataset, which is collected publicly from the Google Earth through the QuickBird satellite. Specifically, Google Earth images are downloaded through software, and we crop the downloaded images to many uniform size subimages. Since the ship images are downloaded directly, the spatial resolution is lower than 0.6 meters of the original QuickBird satellite. Due to the arbitrariness of image acquisition time, shadows exist around the ships. At the same time, there are some clouds and fogs in images. The dataset contains 10,000 remote sensing ship images. The image is in Red Green Blue (RGB) format with uniform 1000 × 600 pixels size. Through manual annotation, the ground truth is the four points coordinates that surround the ship. We take the center point coordinate ( x , y ) , width, height and angle of the minimum bounding rectangle as the final ground truth that is calculated through four points’ coordinates. Widths range from 8 to 578, and heights range from 11 to 573.
We take 8000 image samples for training, 1000 samples for verification and the last 1000 samples for testing. We build the testing set by randomly selecting images from all 10,000 remote sensing ship images at 10% ratios. We evenly divide the remaining 9000 images into nine parts. Eight parts are selected as the training set which the ship detection model is trained based on, and the remaining one is used as a validation set to adjust hyperparameters of the network. Due to the uneven distribution of data, cross-validation is adopted. We use our dataset to train and test the overall ship rotation detection model.
Some image samples are shown in Figure 9. The ships in the dataset contain boats, cruise ships and warships that have different scales. The background of remote sensing images includes rivers, oceans, ports, containers, residential areas and so on, which affect the ship detection task.

3.1.2. Location and Classification Prediction Network

Our ship location and classification prediction network are implemented with the pre-trained model ResNet50 based on deep learning framework Keras. Because of the large aspect ratio of ship, the edge of the image sometimes only contains the prow or stern, not the entire ship. During training, we remove the samples containing only part of a ship. With this selection strategy of training samples, the detection model focuses more attention on detecting whole ships rather than any part of them.
In order to find the appropriate anchors, we analyze the widths and heights of ships horizontal ground truth boxes ( x m i n   a n d   x m a x   o f   x 1 ,   x 2 ,   x 3 ,   x 4 ;   y m i n   a n d   y m a x   o f   y 1 ,   y 2 ,   y 3 ,   y 4 ) in training and verification datasets. Anchor scales are set to 32, 64, 128, 256 and 512. As shown by the gray dots in Figure 10a, we draw the scatter plot of ships’ horizontal boxes widths and heights. We draw the green lines with 1/2, 1.0 and 2.0 slopes and yellow dots of anchors with 1/2, 1.0 and 2.0 aspect ratios, which are widely used in common natural object detection. However, there are a lot of gray dots outside the three lines due to the large aspect ratios of ships. These anchor ratios make the regression of the neural network difficult and adversely affect the final ship detection performance. Taking into account the detection accuracy and computational complexity, we set the anchor ratios to 1/9, 1/5, 1/3, 1/2, 1.0, 2.0, 3.0, 5.0 and 9.0. As shown in Figure 10b, the green lines, red lines and yellow dots evenly distribute near the gray dots. In our ship detection task, we adopt the anchor ratios in Figure 10b.
The location and classification prediction network is trained 60 × e 4 iterations. The learning rate starts from 1 × e 4 in the first 20 × e 4 iterations. In the second 20 × e 4 iterations, the learning rate is set to 1 × e 5 . In addition, it remains 1 × e 6 in the last 20 × e 4 iterations. Weight decays are set to 0.0001. We adopt the Adam Optimizer [38] in the training process. At the RPN stage, the anchor stride is set to 1, and anchors are created for each cell in feature maps. We sample 256 anchors for training in each batch. At regression and classification refinement network training stage, we set the positive ROI ratio to 0.5.

3.1.3. Angle Prediction Agent

We train the angle prediction agent through reinforcement learning algorithm. The agent interacts with the images of trainval dataset and rotates ships in images to horizontal position. To expand the trainval dataset, we make the agent interact with dataset 30 times during the entire training process. As illustrated in Algorithm 1, ε g r e e d y policy is carried out when one trainval dataset loop is over. After the end of 8th loop, the ε is set to 0.1 and remains unchanged. Every time 32 units are randomly selected from the experience deque buffer. We use mean squared error as the loss function and adopt Adam Optimizer with fixed 1 × e 5 learning rate in deep reinforcement learning network training process.
The optimized dueling double deep Q network algorithm in our work contains policy guidance and long-term training method. Some advantages are detailed below compared with the original dueling double deep Q network [31]:
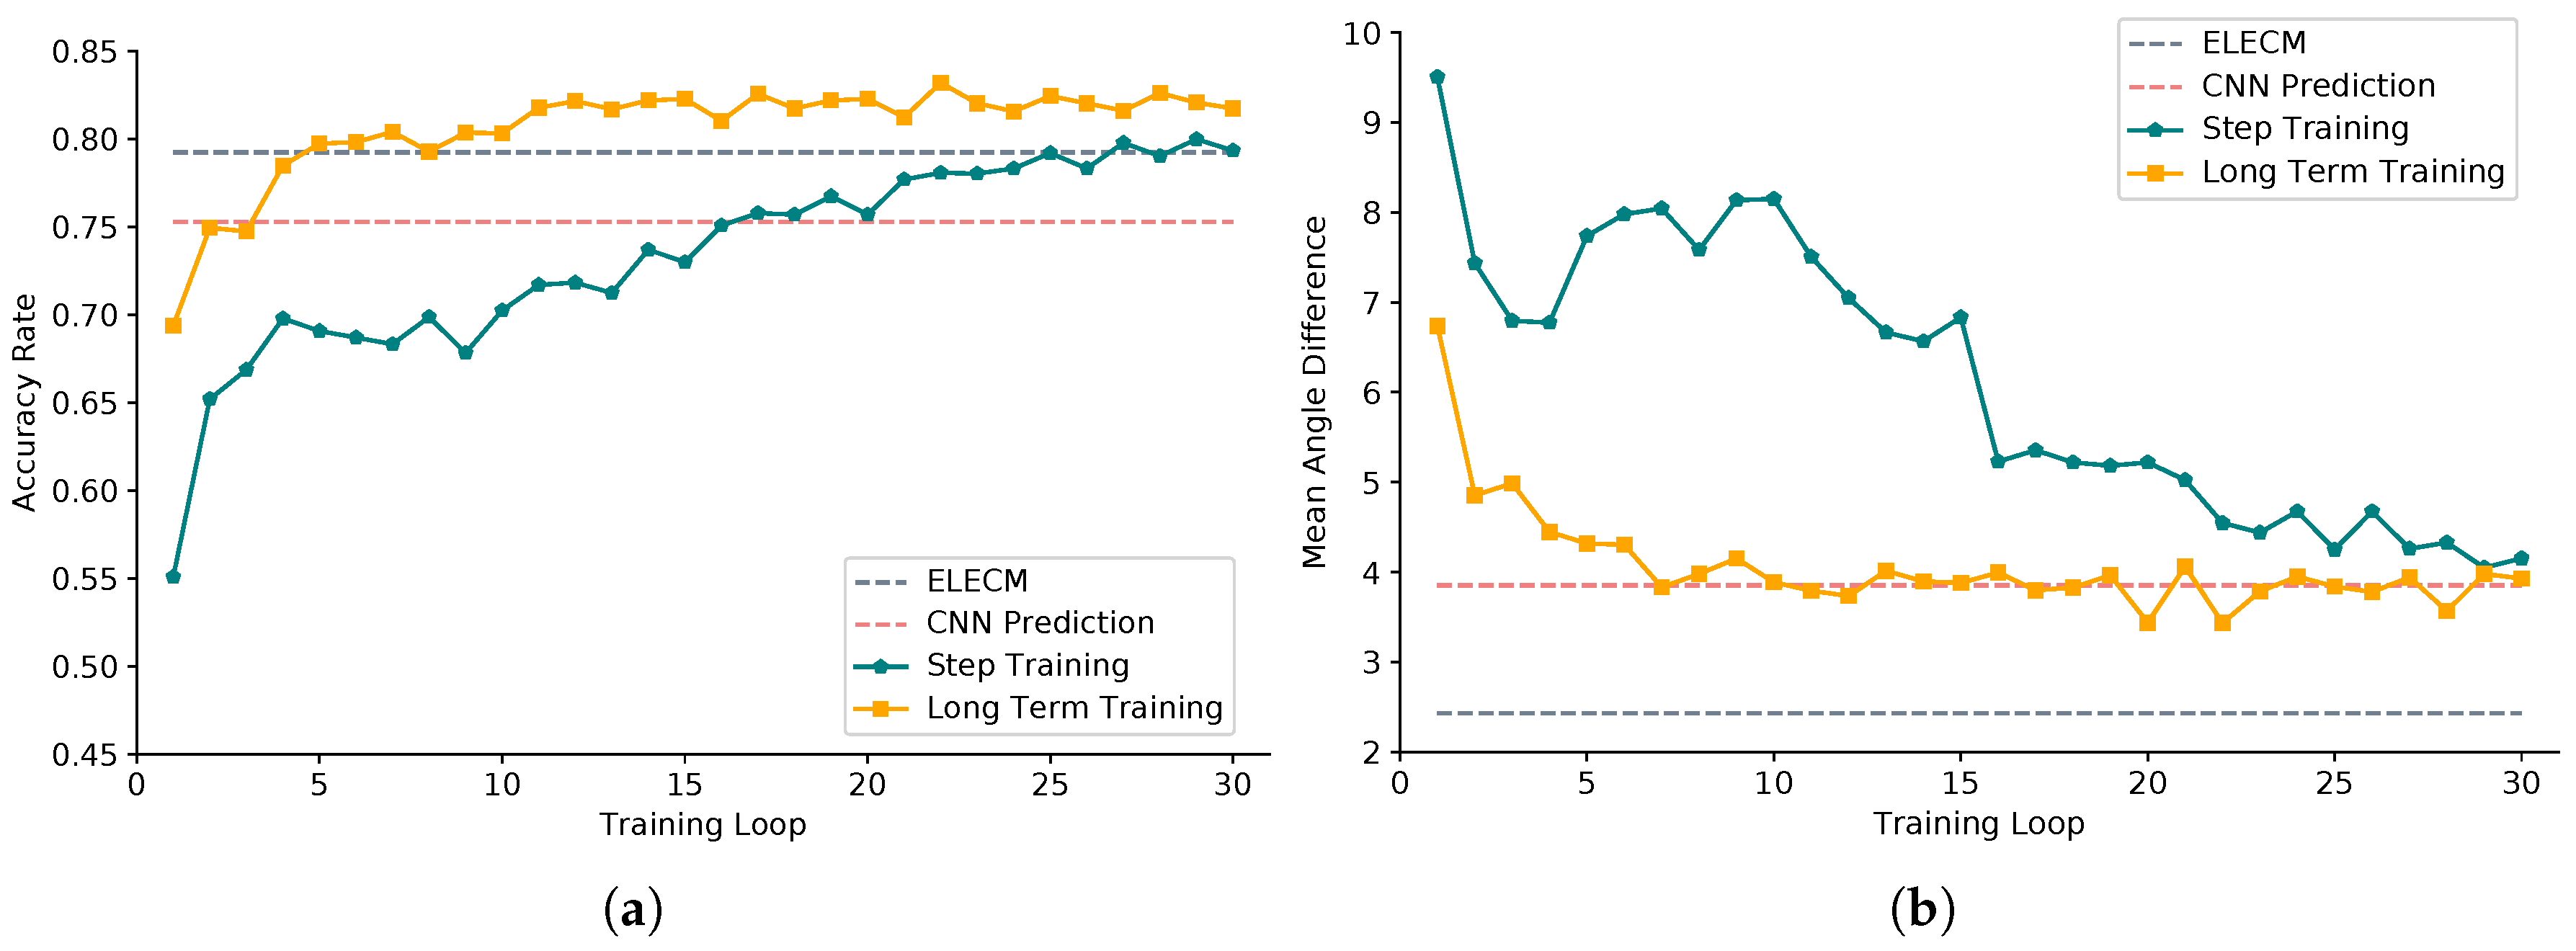
  • In addition to action selection based on a deep Q network, the original training algorithm in dueling double deep Q network [31] randomly selects actions in action sets. However, our optimized algorithm adopts a priori policy guidance to help agents quickly accumulate the positive experience.
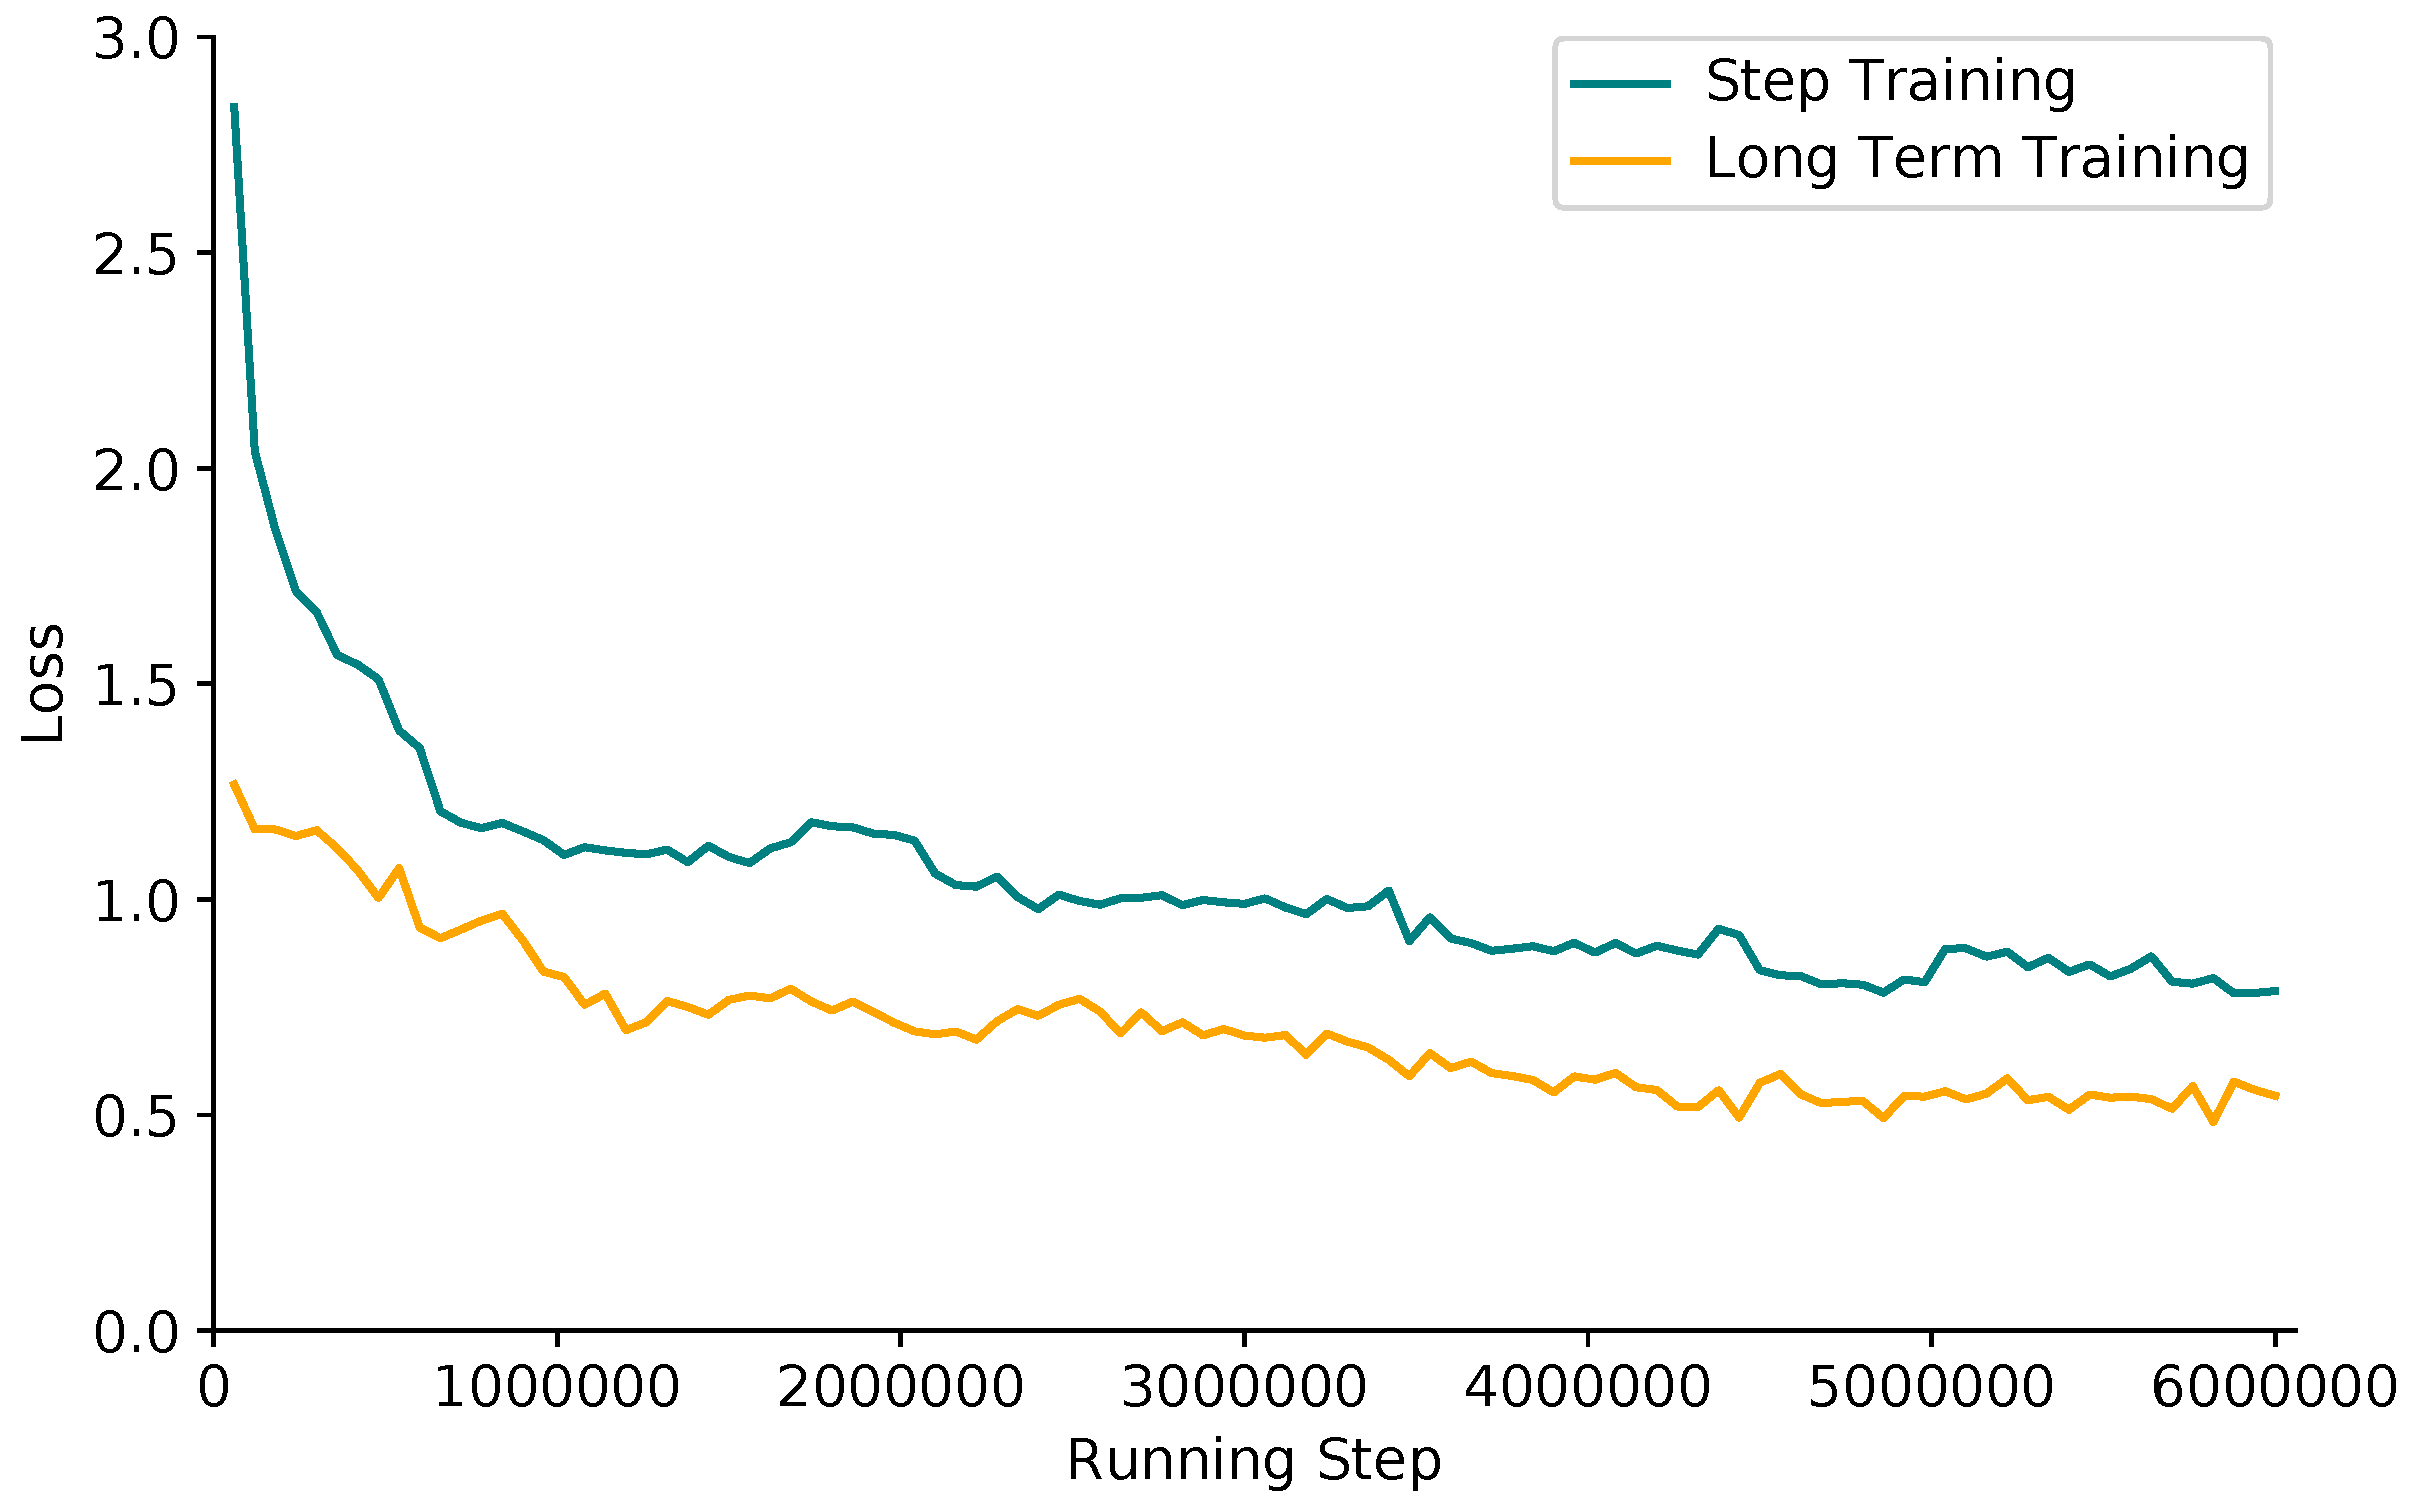
  • We perform the long-term training method which trains the deep Q network after the rotation end action A3 is selected in Algorithm 1. The algorithm in [31] trains the network after the end of each action selection. The long-term training method can accelerate the convergence process of the network.
  • Compared to the original simple video game scene, considering the complex background and difficult-to-distinguish objects in remote sensing images, we store the experiences to larger first-in-first-out experience deque buffer (length: 200,000) in Algorithm 1.
In each training loop, the agent performs about two hundred thousand action selections, and after the end of thirty training loops, about six million actions are selected. For the comparison of algorithms, we train an agent which rotates the images based on policy guidance, and another agent that randomly rotates the images is trained by contrast. Moreover, two kinds of agents based on the step training and long-term training are trained to compare the convergence speed.

3.2. Evaluating the Angle Prediction Agent

We evaluate the performance of angle prediction agents trained through reinforcement learning in 1000 testing remote sensing images. We use the following evaluation criterias: angle prediction accuracy rate and mean angle difference, which are defined as:
A c c u r a c y   R a t e = N c o r r e c t N ,
where N is the number of ships in testing images, and N c o r r e c t denotes the number of ships whose angles are correctly predicted. In our work, we define that the prediction is considered to be correct when the absolute value of angle difference between prediction and the ground truth is less than 2°, which is already a relatively strict standard in ship detection tasks:
M e a n   A n g l e   D i f f e r e n c e = 1 N n = 1 N | p r e d i c t i o n i t r u t h i | ,
where N is the number of ships in testing images, p r e d i c t i o n i is the angle prediction value, and t r u t h i is the angle ground truth of i t h ship.
In contrast, we train a convolutional neural network with supervised learning to directly regress the angle information from the ship image, and the convolutional neural network also takes ResNet50 as a backbone. On the other hand, we convert the ship image in the test set into oval binary image, and we use the angle estimation method in [39] (Eigenvectors with the Largest Eigenvalue of Covariance Matrix, ELECM) to predict the ship angle on the transformed image for comparison.
We first explore the impact of policy guidance on angle prediction agent training. As Figure 11 shows, ELECM achieves accuracy rate of 79.23% and 2.43° mean angle difference for binary images, and the CNN model gets a 75.28% accuracy rate and 3.85° mean angle difference in testing images. As the amount of training increases, two kinds of angle prediction agents gradually perform better. The agent trained based on policy guidance achieves a 79.98% accuracy rate, which eventually surpasses the CNN model, and a 4.05° mean angle difference that is close to the result of a CNN model. However, suffering from the lack of prior knowledge guidance, the second agent only learns from the random action selection, and it gets a 58.28% accuracy rate and 10.35° mean angle difference.
On the other hand, we also compare the effects of step training and long-term training methods. According to the positive influence of policy guidance, we use it in the two different training methods above. As Figure 12 shows, the agent trained through long-term training achieves an 82.60% accuracy rate and 3.56° mean angle difference, which outperforms the direct regression of CNN model and the agent trained through a traditional step training method in [31]. The angle prediction method in our work outputs the angle based on the original ship image. The ELECM method predicts the angle of the simplified binary image. The accuracy rate of agent prediction is slightly higher than ELECM, and the mean angle difference is one degree larger than ELECM. Figure 13 shows the different convergence processes of the step training above and long-term training methods. The long-term training method has better performance in terms of loss convergence speed and results. Due to the competitive effect of policy guidance and long-term training, we adopt the agent trained based on these two methods in the following experiments.
We compare the average prediction time of ELECM, the CNN model and agent based on deep reinforcement learning as Table 1 shows. ELECM requires the least amount of time 0.005 s because it directly calculates the angle based on binary images. The CNN model directly regresses the angle with one forward propagation and takes 0.065 s on average. The prediction agent iteratively gets the angle through action selection guided by a deep Q network, and it costs 0.122 s.

3.3. Evaluating the Detection Model

The combination of location and classification prediction, angle prediction based on deep reinforcement learning and soft rotation non-maximum suppression constitutes our overall ship detection model. When the IoU between one ground truth box and the detection inclined rectangle is higher than 0.5, the ship corresponding to the ground truth is considered to be detected. The Precision (P), Recall (R) and F1 score are used as standards to evaluate the performance of ship detection model, which are defined as:
P = T P T P + F P ,
R = T P T P + F N ,
F 1 = 2 × P × R P + R ,
where T P is the number of true positive objects (correct detected ships), F P is the number of objects that are mistaken for ship, and F N is the number of un-detected ships. In general, P or R can only measure one aspect of detection model. F 1 combines both of them and evaluates the overall performance of the model.

3.3.1. The Influence of Feature Fusion Pyramid Network and Angle Prediction Agent

As described above, different feature maps of CNN have different semantic and location information. Low level features have less semantic information; nevertheless, the object location information of them is often accurate. In contrast, the semantic information of high level features is rich, but the object location information of them is always relatively rough. We use the high-low layer feature fusion method to make full use of the characteristics of different layers. Furthermore, we design the FFPN to increase the reuse of features at different scales and reduce the aliasing of features. In order to clarify the effect of FFPN, we perform experiments to compare original FPN [21], DFPN [27] and FFPN in our work. All models are evaluated under the 0.8 confidence score. As Table 2 shows, three detection models adopt different feature fusion methods. In addition, each of these three models has two different ways to get the ship angle information, agent prediction and neural network direct regression. As mentioned above, agent prediction iteratively obtains the ship angle based on the location result. However, in neural network regression, we directly add an output node at the end of network to return ship angle information. Through supervised learning training, the angle is obtained while outputting the position and scale information.
Compared with original FPN, FFPN makes full use of high and low feature maps and adopts stacking operation instead of upper layer addition to reduce aliasing effect. In addition, FFPN can better extract different layer information through reusing features at different scales compared with DFPN. Under the same angle prediction method (direct regression or agent prediction), Recall, Precision and F1 score of FFPN are higher than original FPN and DFPN. DFPN performs better than original FPN, which is shown in Table 2.
At the same time, we also compare different angle prediction methods to identify the effectiveness of agents trained through reinforcement learning. As Table 2 shows, in the same feature fusion method, Recall, Precision and F1 score of agent prediction are better than direct regression. Benefitting from the gradual angle prediction way of loop iteration, the agent often achieves accurate ship orientation information that improves Recall of detection framework, such as comparison of the 83.42% Recall of AP and the 78.99% Recall of DR in FFPN. On the other hand, due to the accurate ship angle, adjacent detection boxes that are overlapped may be separated from each other; therefore, the subsequent NMS can generate more correct detection boxes that increase the Precision of detection framework, such as the 88.08% Precision of AP and the 85.15% Precision of DR in DFPN.
As shown in Figure 14a,c, the agent prediction can generate more accurate angles which cover the ships closely. In addition, due to accurate angle information, all nine ships are detected which are shown in Figure 14d compared with seven detected ships whose angles are generated through direct regression, which are shown in Figure 14b.

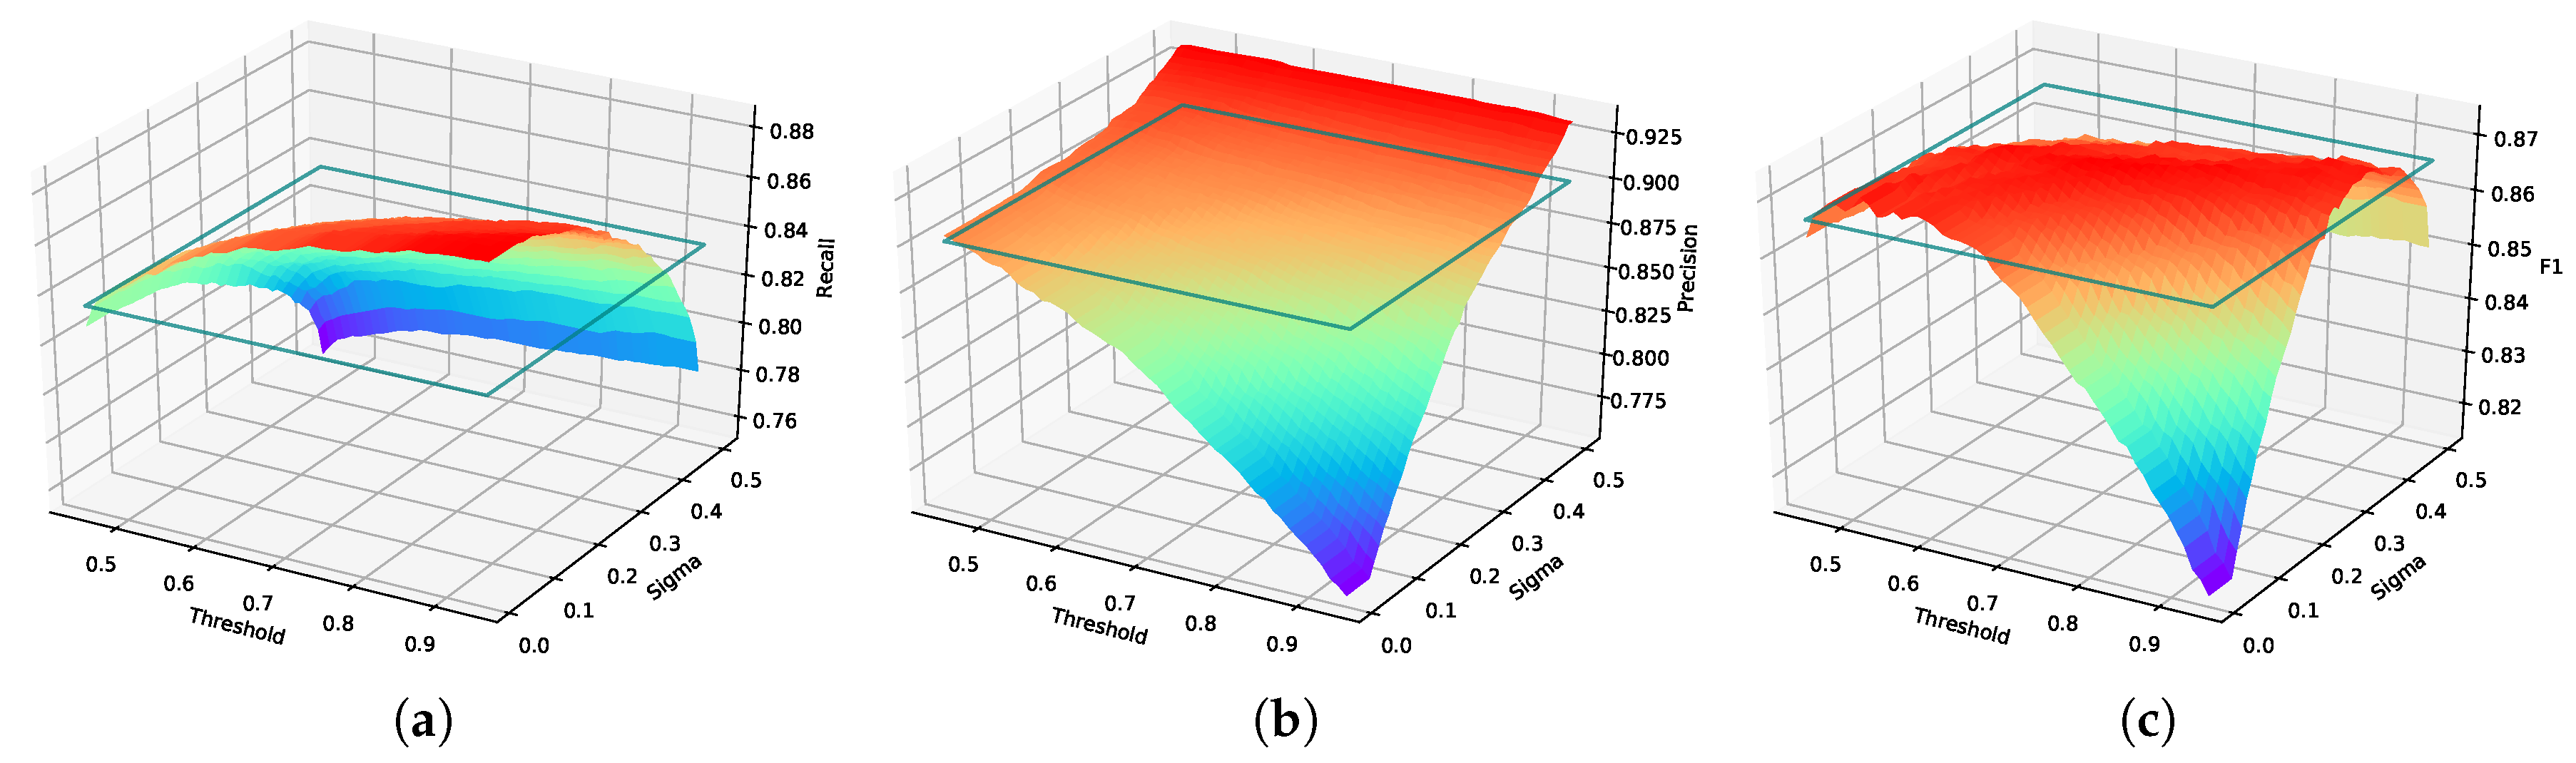
3.3.2. The Effect of Soft Rotation Non-Maximum Suppression

Due to the multi-stage ship detection framework, we get a lot of inclined detection results, and only part of them are correct detection boxes while the rest of them are redundant. Like other detection models, we adopt non-maximum suppression to reduce useless results and get final detection. With the inclined detection boxes, we design the soft rotation non-maximum suppression (SRNMS) to further improve detection performance. We explore the impact of SRNMS on detection results in this part.
As Algorithm 2 shows, we adopt soft strategy, which is implemented by Gaussian kernel function, to replace the absolute suppression in original NMS. We discuss the influence of Gaussian kernel function parameter sigma and the suppression score threshold on final evaluation standards. Figure 15 shows the changes of detection evaluation standards. The dark green quadrilaterals in three sub-images indicate the constant values of evaluation standards after traditional NMS processing, 83.42% Recall, 90.05% Precision and 86.61% F1 score. For the convenience of display, we select [0.45, 0.95) Threshold and (0, 0.5] Sigma as interval. Through verification, it can be found that the maximum of F1 score is within the above intervals.
As illustrated in Figure 15a,b, when Threshold increases, Recall is also improved and exceeds the 83.42% generated by traditional NMS, and Precision is reduced at the same time. As Sigma becomes larger, Recall is falling and Precision is gradually increased and higher than 90.05% in traditional NMS. F1 is the overall measure of detection performance, and part of the F1 score rainbow curved surface is above the dark green quadrilateral plane as Figure 15c shows. The F1 score at the highest point of the surface is 87.41%, and the corresponding Recall and Precision are 86.17% and 88.69%.
Figure 16 visually shows different processing results of Rotation NMS (RNMS) and SRNMS. As shown in Figure 16b, five ships are manually labeled in image. It is worth pointing out that they are parked densely. Figure 16c shows the processing result of RNMS; only four ships are detected because of the hard suppression standard. However, SRNMS generates all five ships as shown in Figure 16d. Because of the soft strategy, SRNMS allows more overlap between detection boxes, which is important for dense ship detection. The combination of detection boxes with angle information and soft strategy in SRNMS can complete the dense ship parking detection task to a large extent.

3.3.3. Comparison with Other Detection Models

In this section, we validate the effectiveness of FFPN-RL ship detection method in our work through comparison with You Only Look Once Network (YOLO) [22], Faster Regions Convolution Neural Network (Faster R-CNN) [20], Rotation Region Proposal Networks (RRPN) [25], Rotational Region CNN (RRCNN) [26] and Rotation Dense Feature Pyramid Networks (R-DFPN) [27], which are impactful natural image object, scene text or ship detection frameworks. Table 3 shows the performance of each detection method.
YOLO and Faster R-CNN are ship detection models that generate horizontal rectangular boxes. Due to the large aspect ratio of ships, complex background and side-by-side parking scene, Recalls of these two detectors are low. However, Precisions are high, especially YOLO. Due to the feature information loss in ROI pooling, RRPN often cannot accurately get the overall ship spatial information. Therefore, the detection performance of RRPN is poor. RRCNN detects ships through directly regressing the first two points coordinates in clockwise and the height of ship. In addition, there are often dense parking areas in remote sensing ship images, and such detection methods sometimes confuse the coordinate order and causes missed detection. R-DFPN adopts dense connection structures in feature pyramid networks and multiscale ROI aligns to solve features misalignment, and it achieves the highest 88.84% Precision. Because of the effective feature fusion method, FFPN-RL in our work can extract characteristic information of different scale ships. In addition, with angle prediction agent, FFPN-RL is able to get accurate angle information contrasted with direct regression in other detection methods. After the final processing of SRNMS, FFPN-RL gets the highest 86.17% Recall and 87.41% F1 score.
Through increasing the confidence score threshold from 0 to 1, we can get different evaluation results. Figure 17 shows the Precision–Recall curves of the ship detection methods above. When Recall remains the same, higher Precision can generate larger F1 scores. A higher Precision–Recall curve means that the detection model performs better. The Precision–Recall curve of FFPN-RL is clearly above the other five models. Consequently, the FFPN-RL ship detection model in our work has better performance than YOLO, Faster R-CNN, RRPN, RRCNN and R-DFPN.
Table 4 shows the processing time on each remote sensing ship image. Angle prediction in FFPN-RL is independent of coordinate regression, and it costs the longest 0.89 s because of the extra runtime. RRPN and R-DFPN need to generate a large number of inclined anchors, and they take 0.46 s and 0.51 s to detect ships. Due to the rectangular anchors and one forward propagation regression, RRCNN takes 0.46 s. Faster R-CNN costs 0.13 s. Since YOLO is a one-stage detector, it requires minimal runtime 0.02 s.

4. Discussion

Through careful analysis and comparison of many groups’ experiments, the efficiency of FFPN-RL ship detection method we proposed is verified. This is the first time we adopt deep reinforcement learning in inclined ship detection of remote sensing images. It can be seen from the experiments that FFPN-RL we proposed has effective detection performance on multi-scale and dense parking ships.
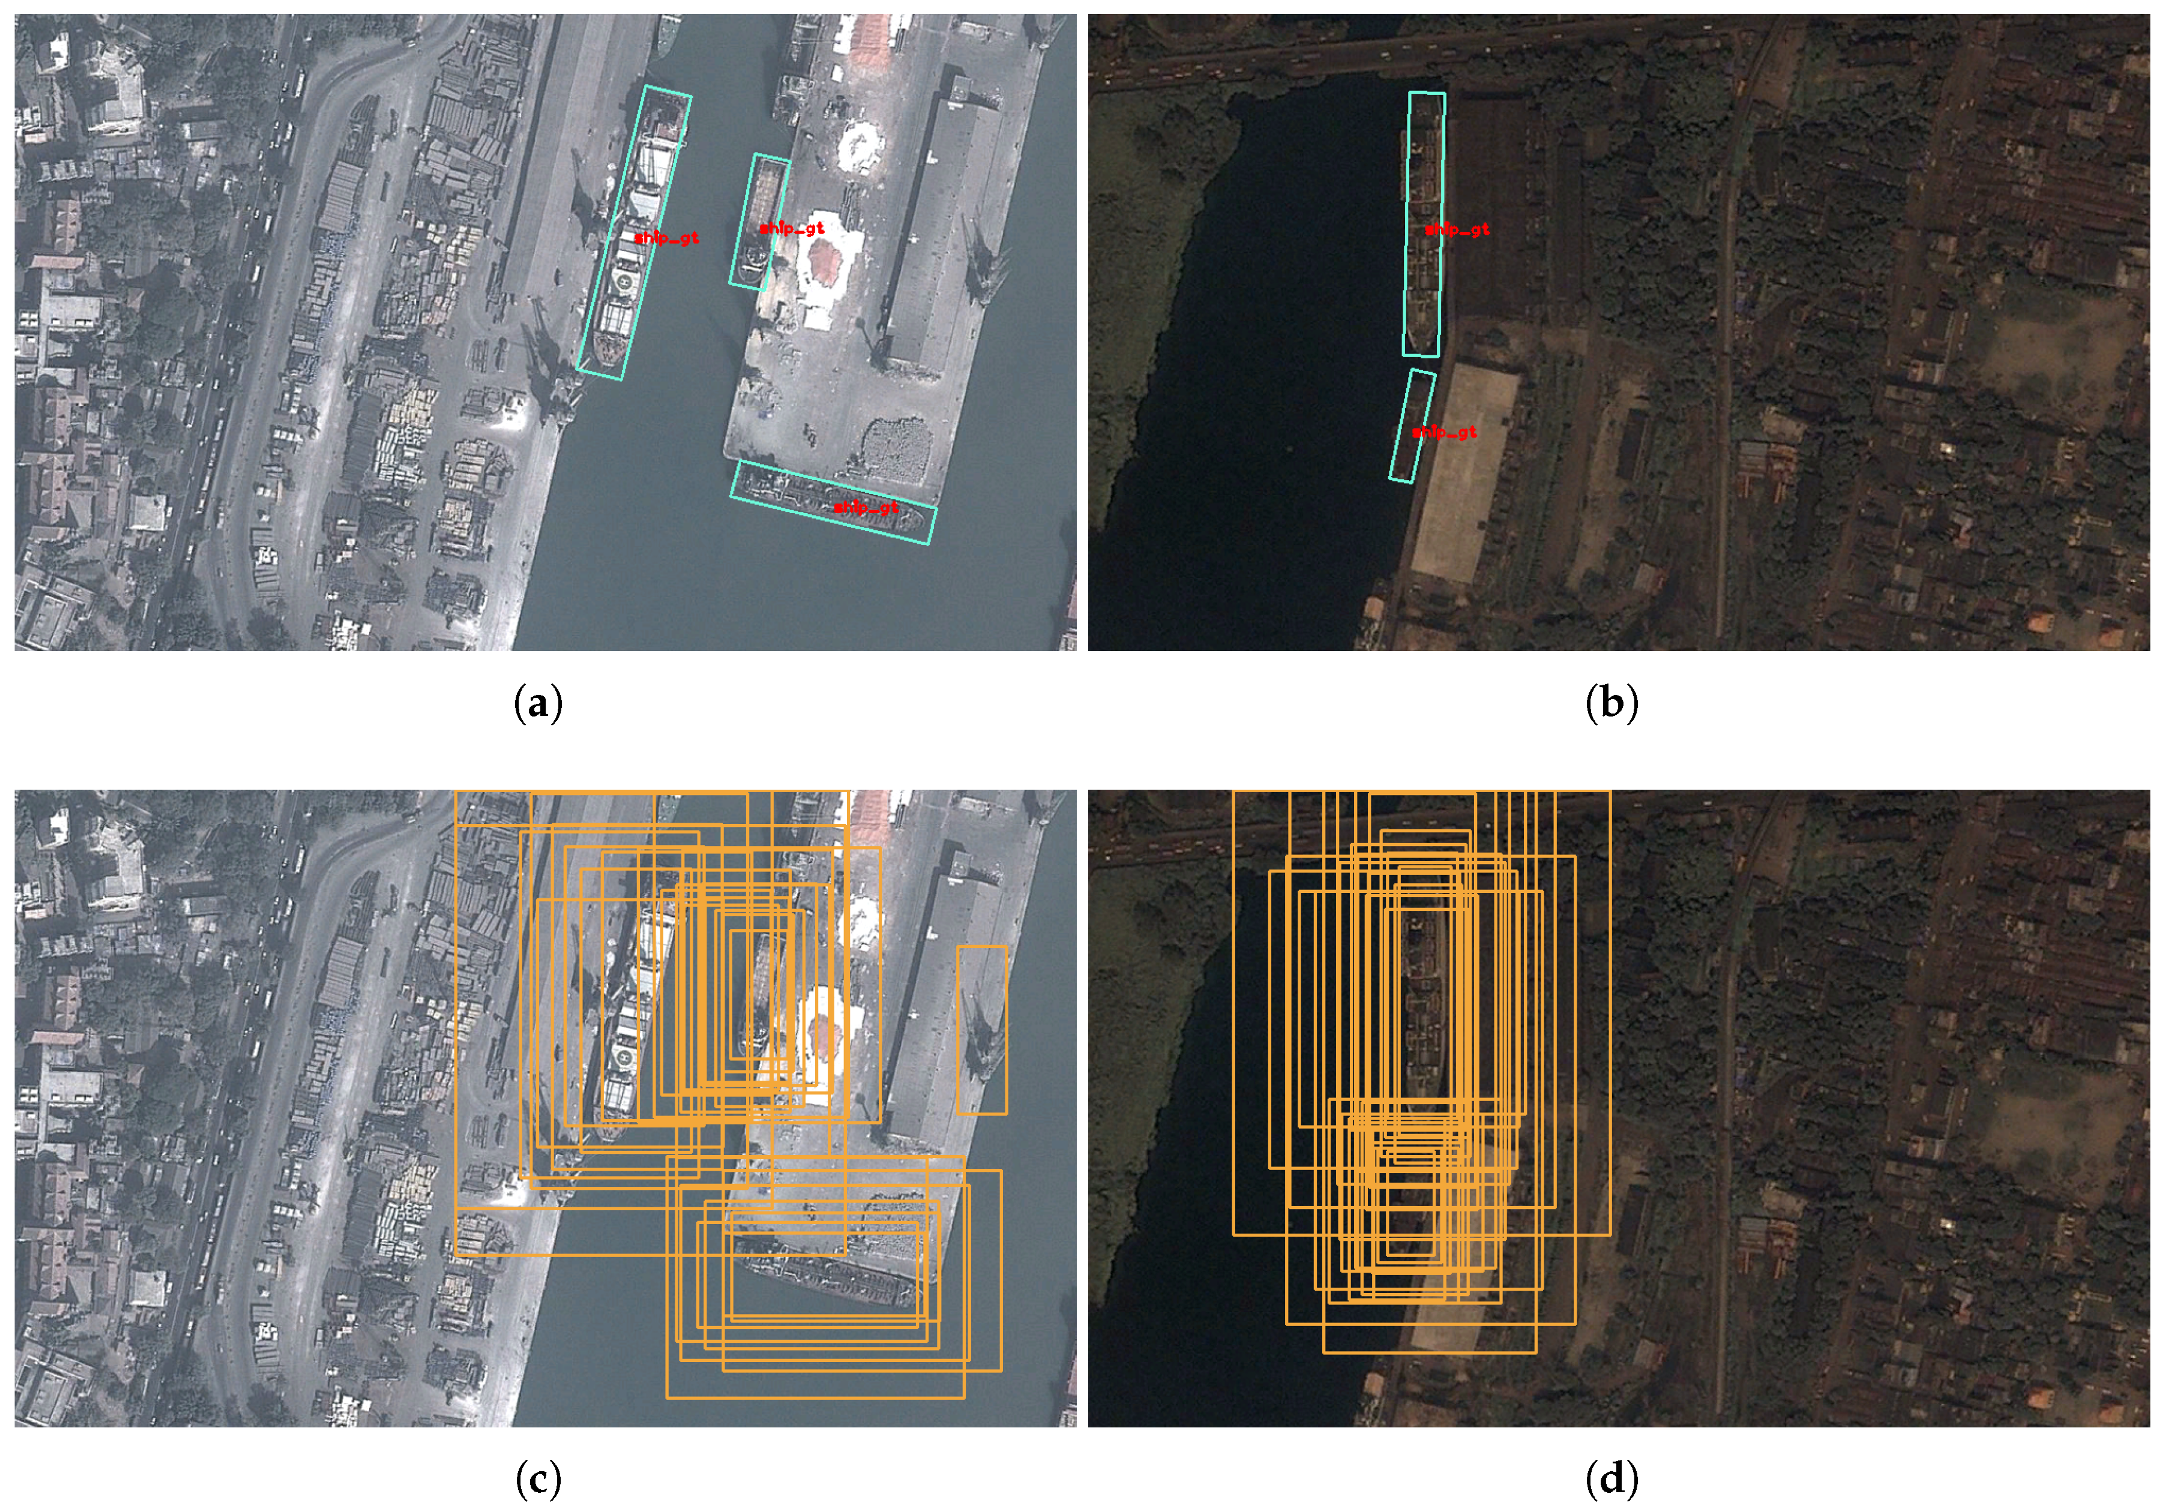
  • We propose the Feature Fusion Pyramid Network (FFPN) to extract the ship features of different scales. Unlike the traditional two stage detectors, which only operate at the high feature maps, FFPN classifies and regresses on different scales feature maps. Figure 5 shows that, benefitting from FFPN, the Region Proposal Network can generate high-quality proposals for different scales’ ships. At the same time, the multi-scale reuse of features in FFPN also has a positive impact on the location and classification of the overall ship detection model. Table 2 shows that FFPN can achieve better performance compared with other feature connection methods.
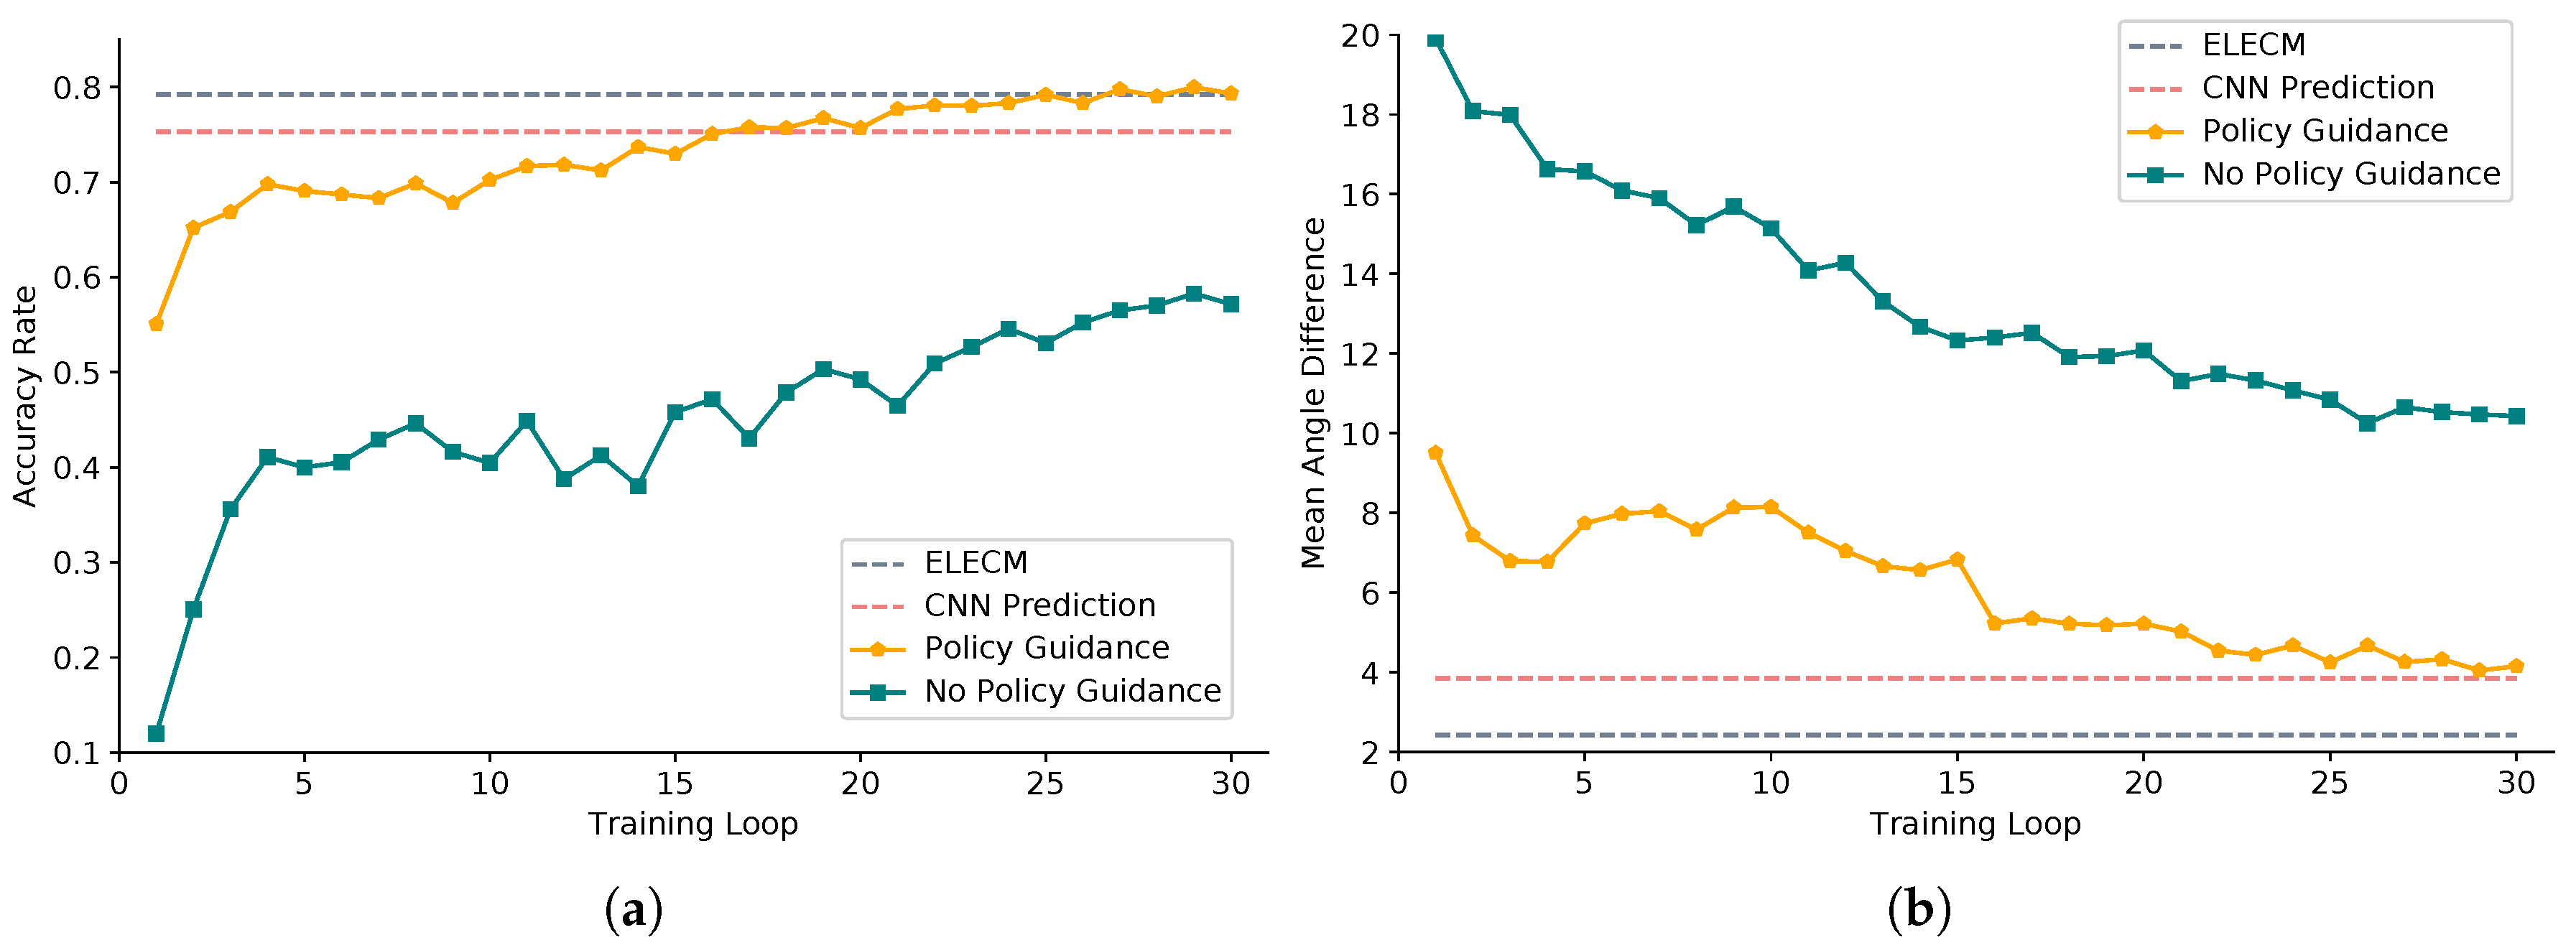
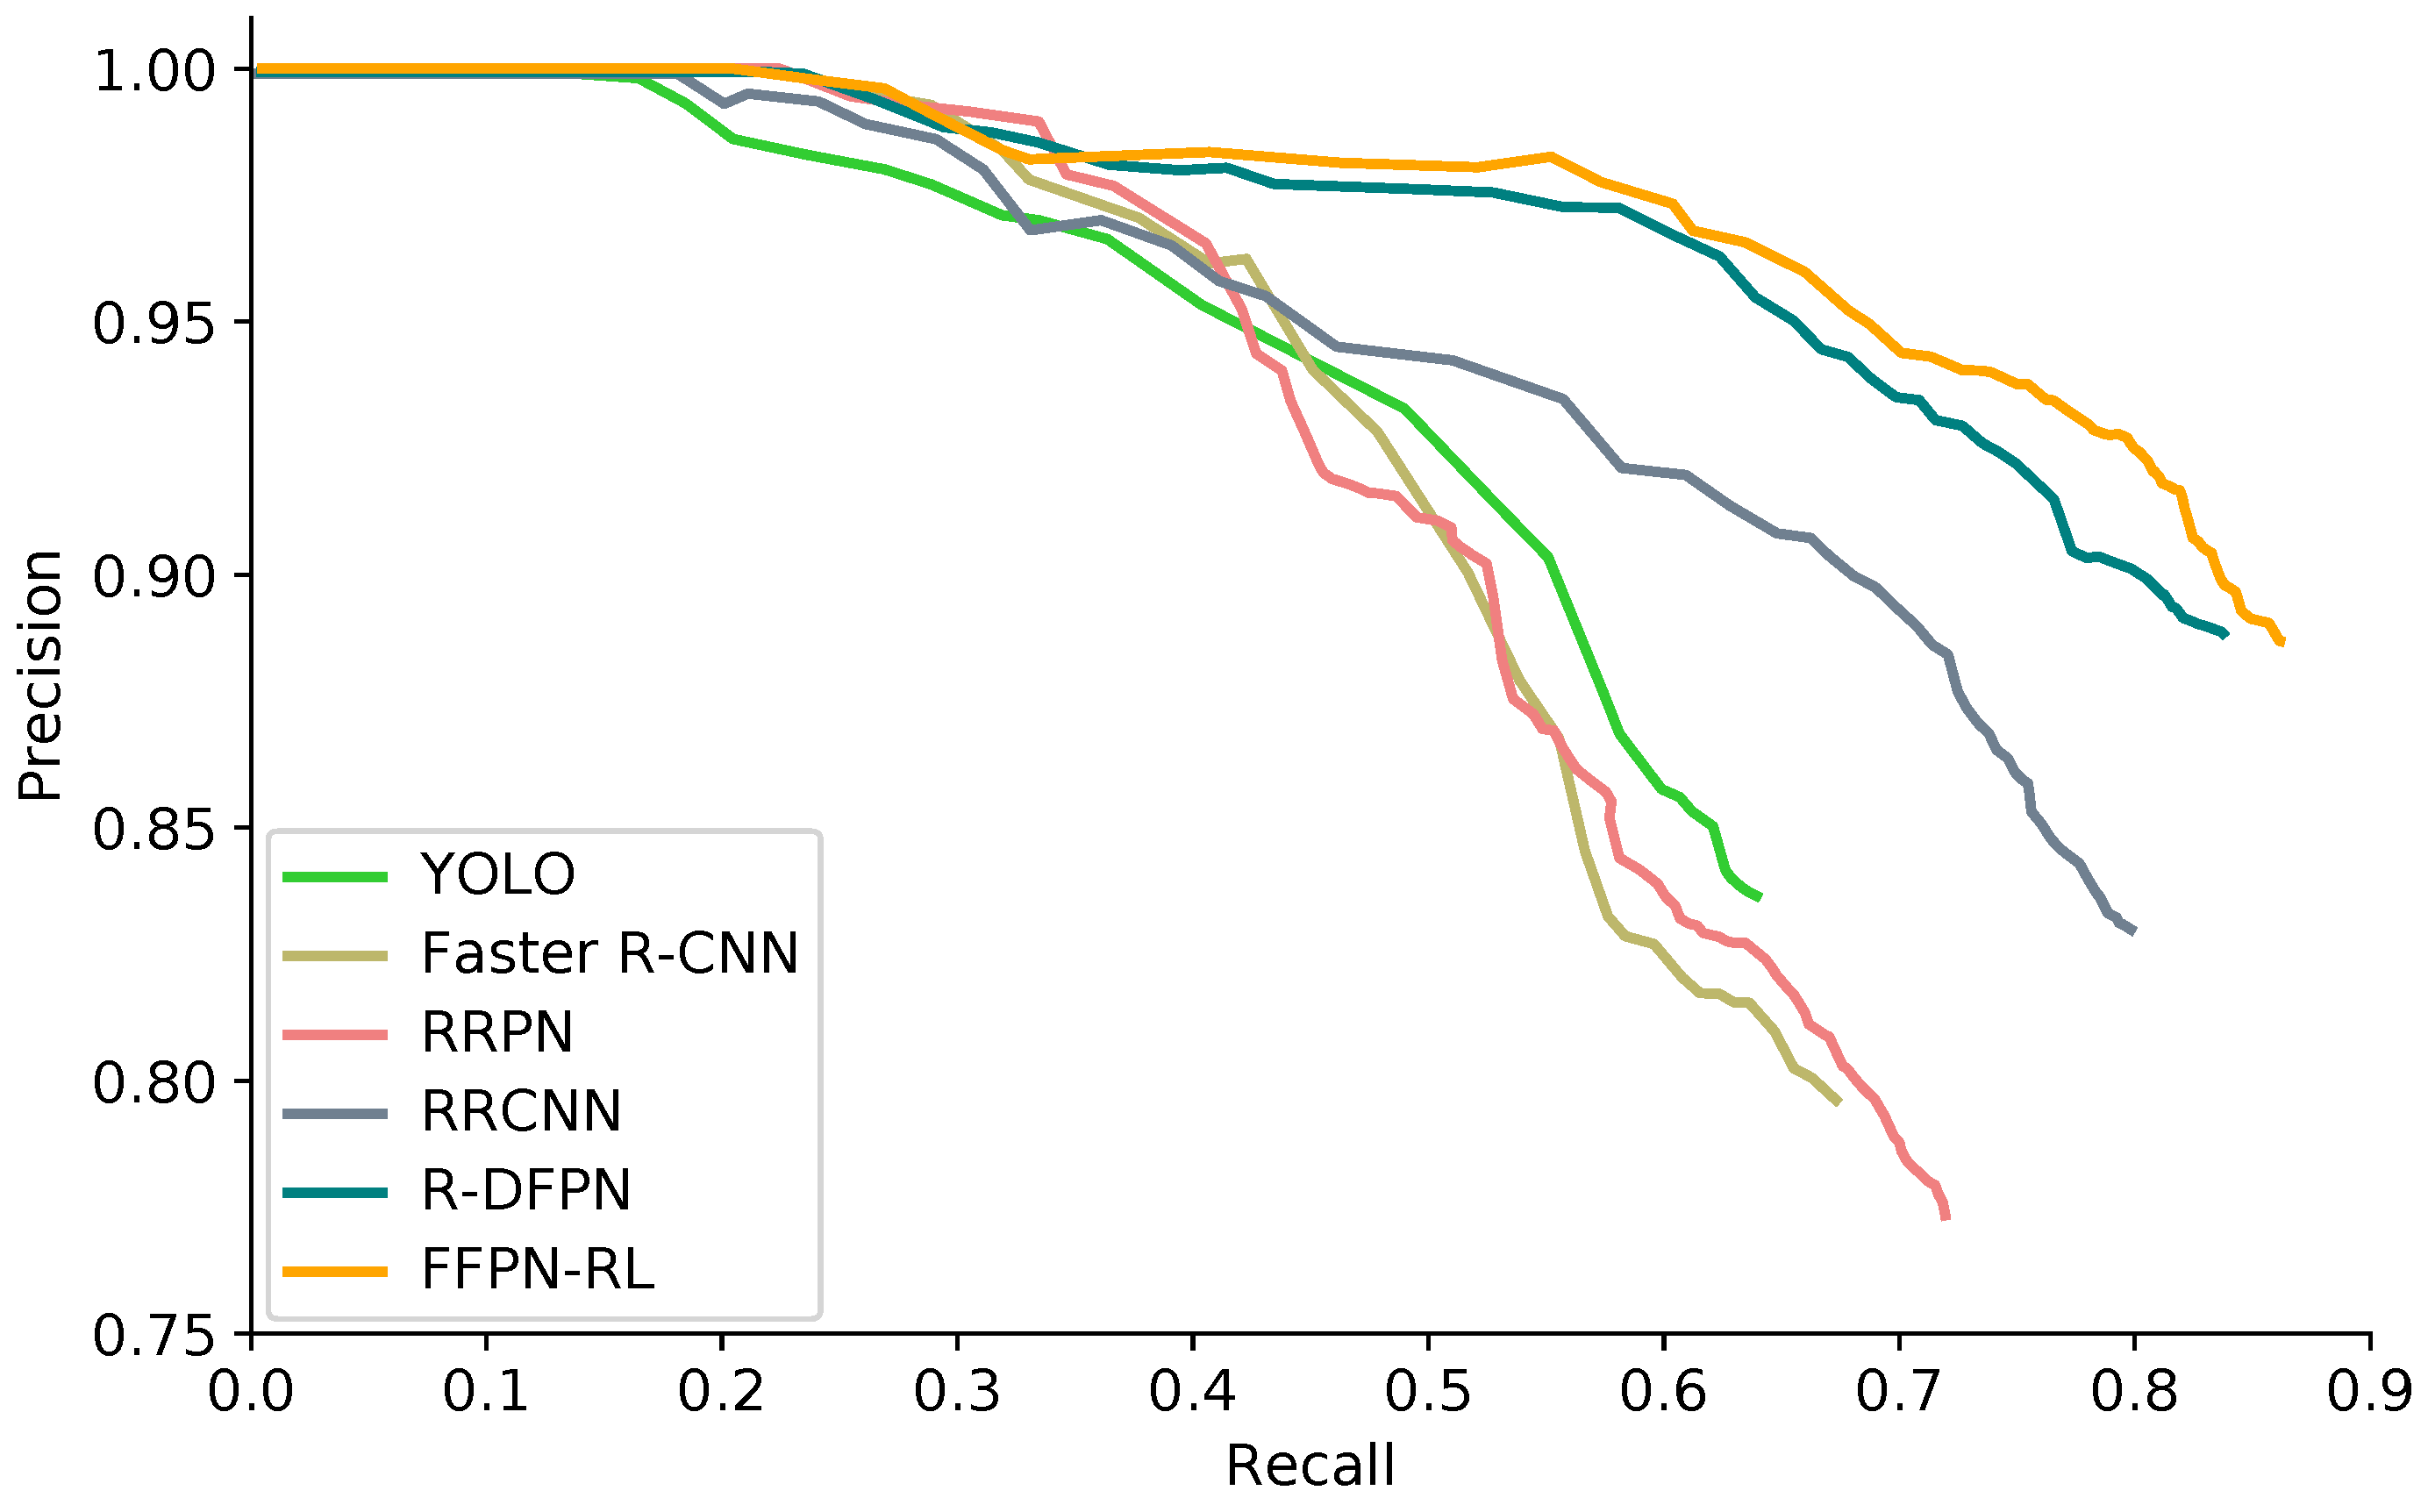
  • Angle is the vital information for the inclined ship detection. In addition, it affects the subsequent suppression processing and overall detection results. Therefore, accurate angle detection is very necessary. We propose using the deep reinforcement learning agent to iteratively predict the ship angle. We use a dueling network structure to approximate the Q value function, and we adopt the policy guidance and long-term training method to make the angle prediction agent learn effectively. Figure 11 and Figure 12 illustrate the validity of the optimized dueling double deep Q learning we proposed in Algorithm 1. Table 2 shows that, compared with the direct regression method, the agent prediction can continuously rotate the ship, and finally obtain the angle information more accurately, which is able to achieve higher Recall and Precision.
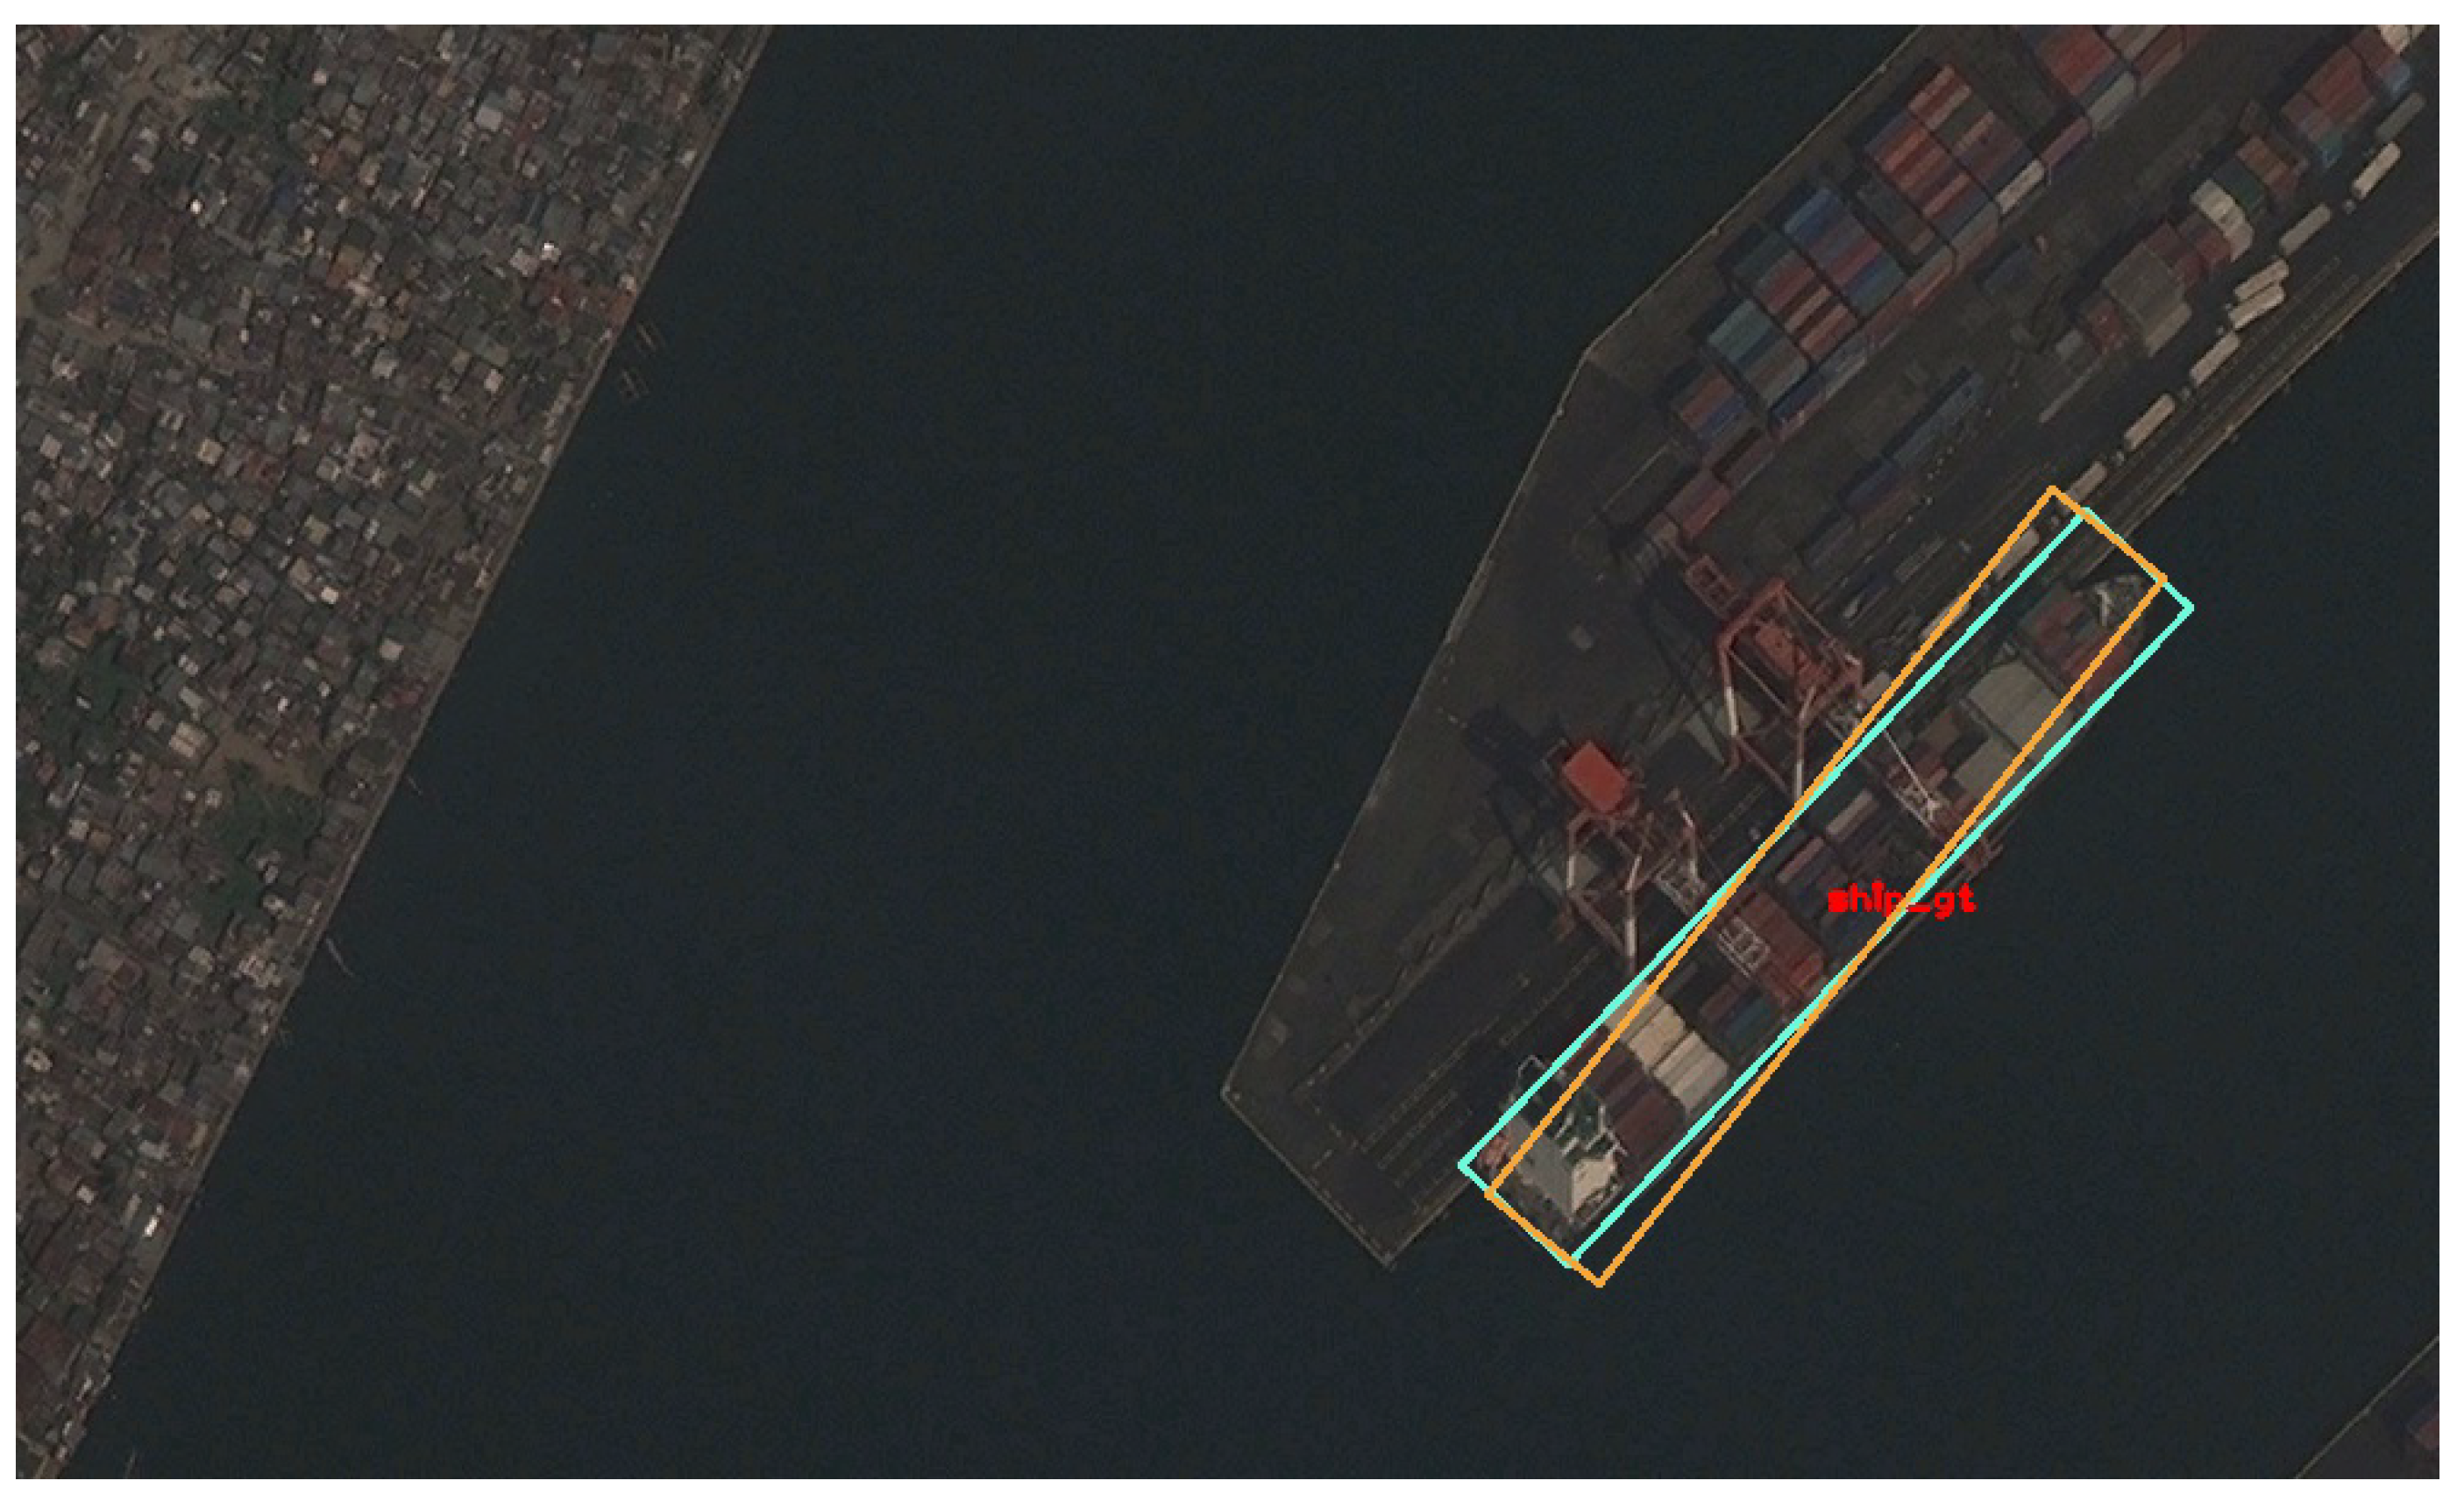
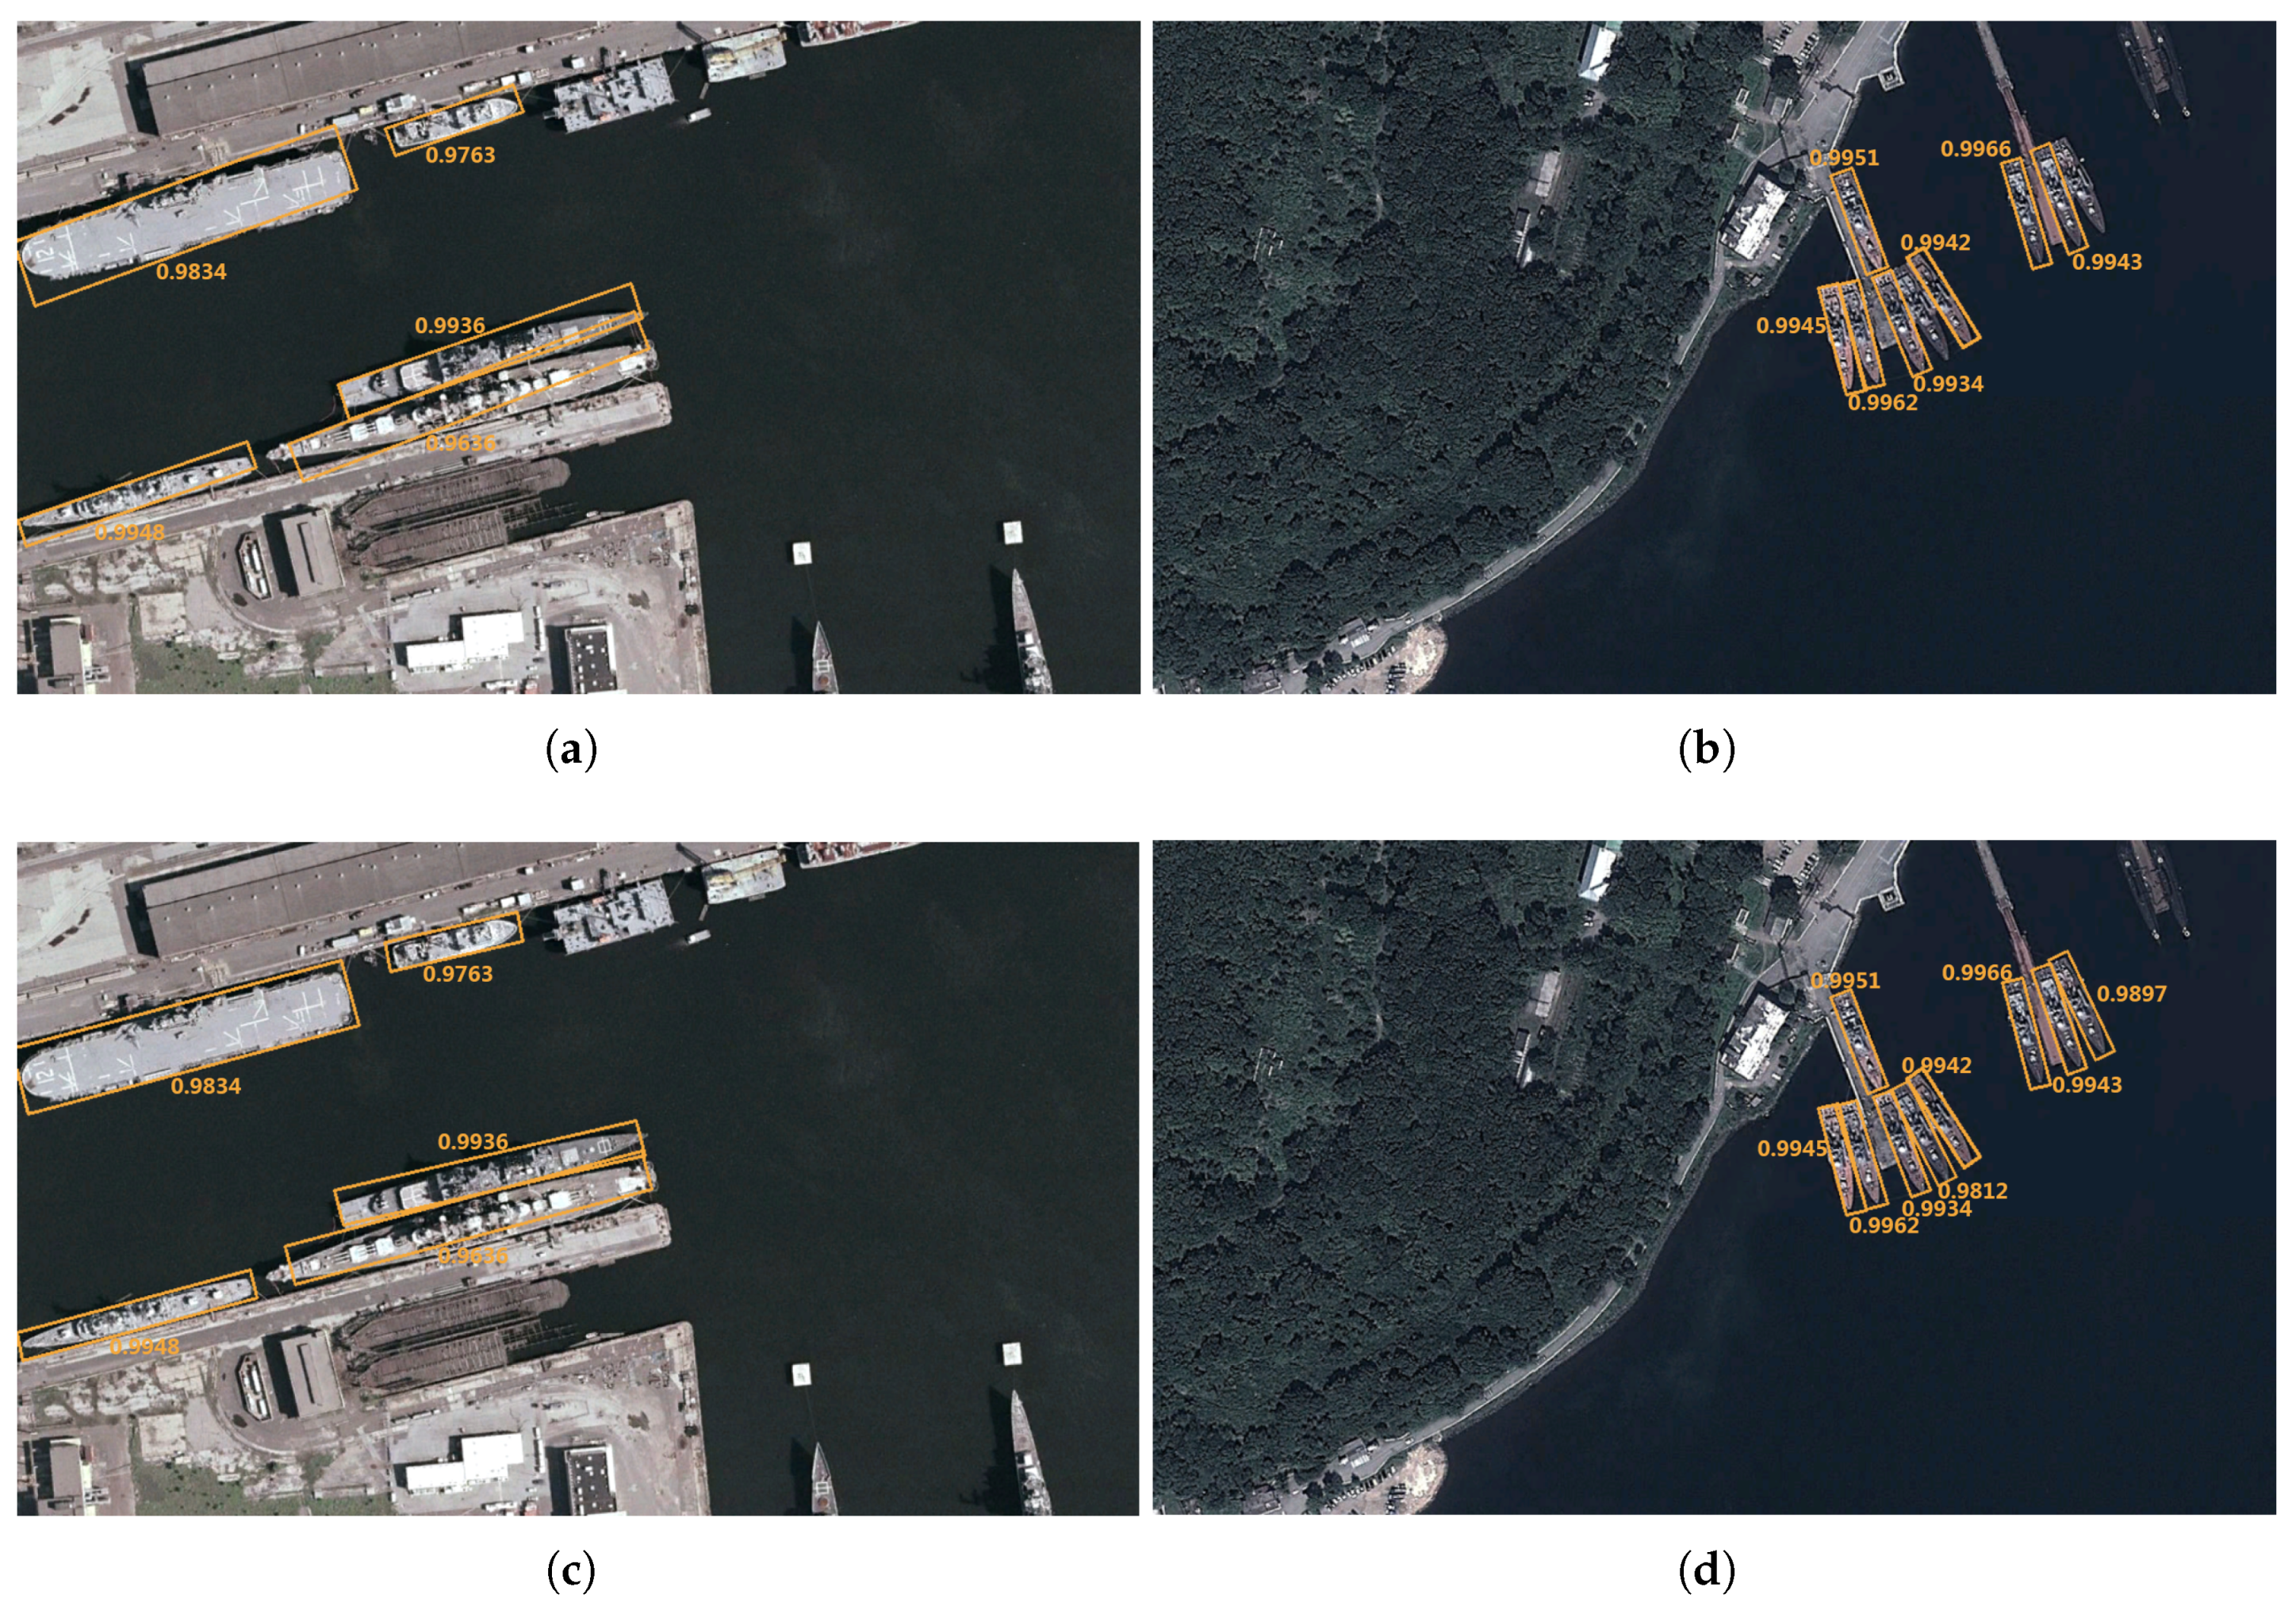
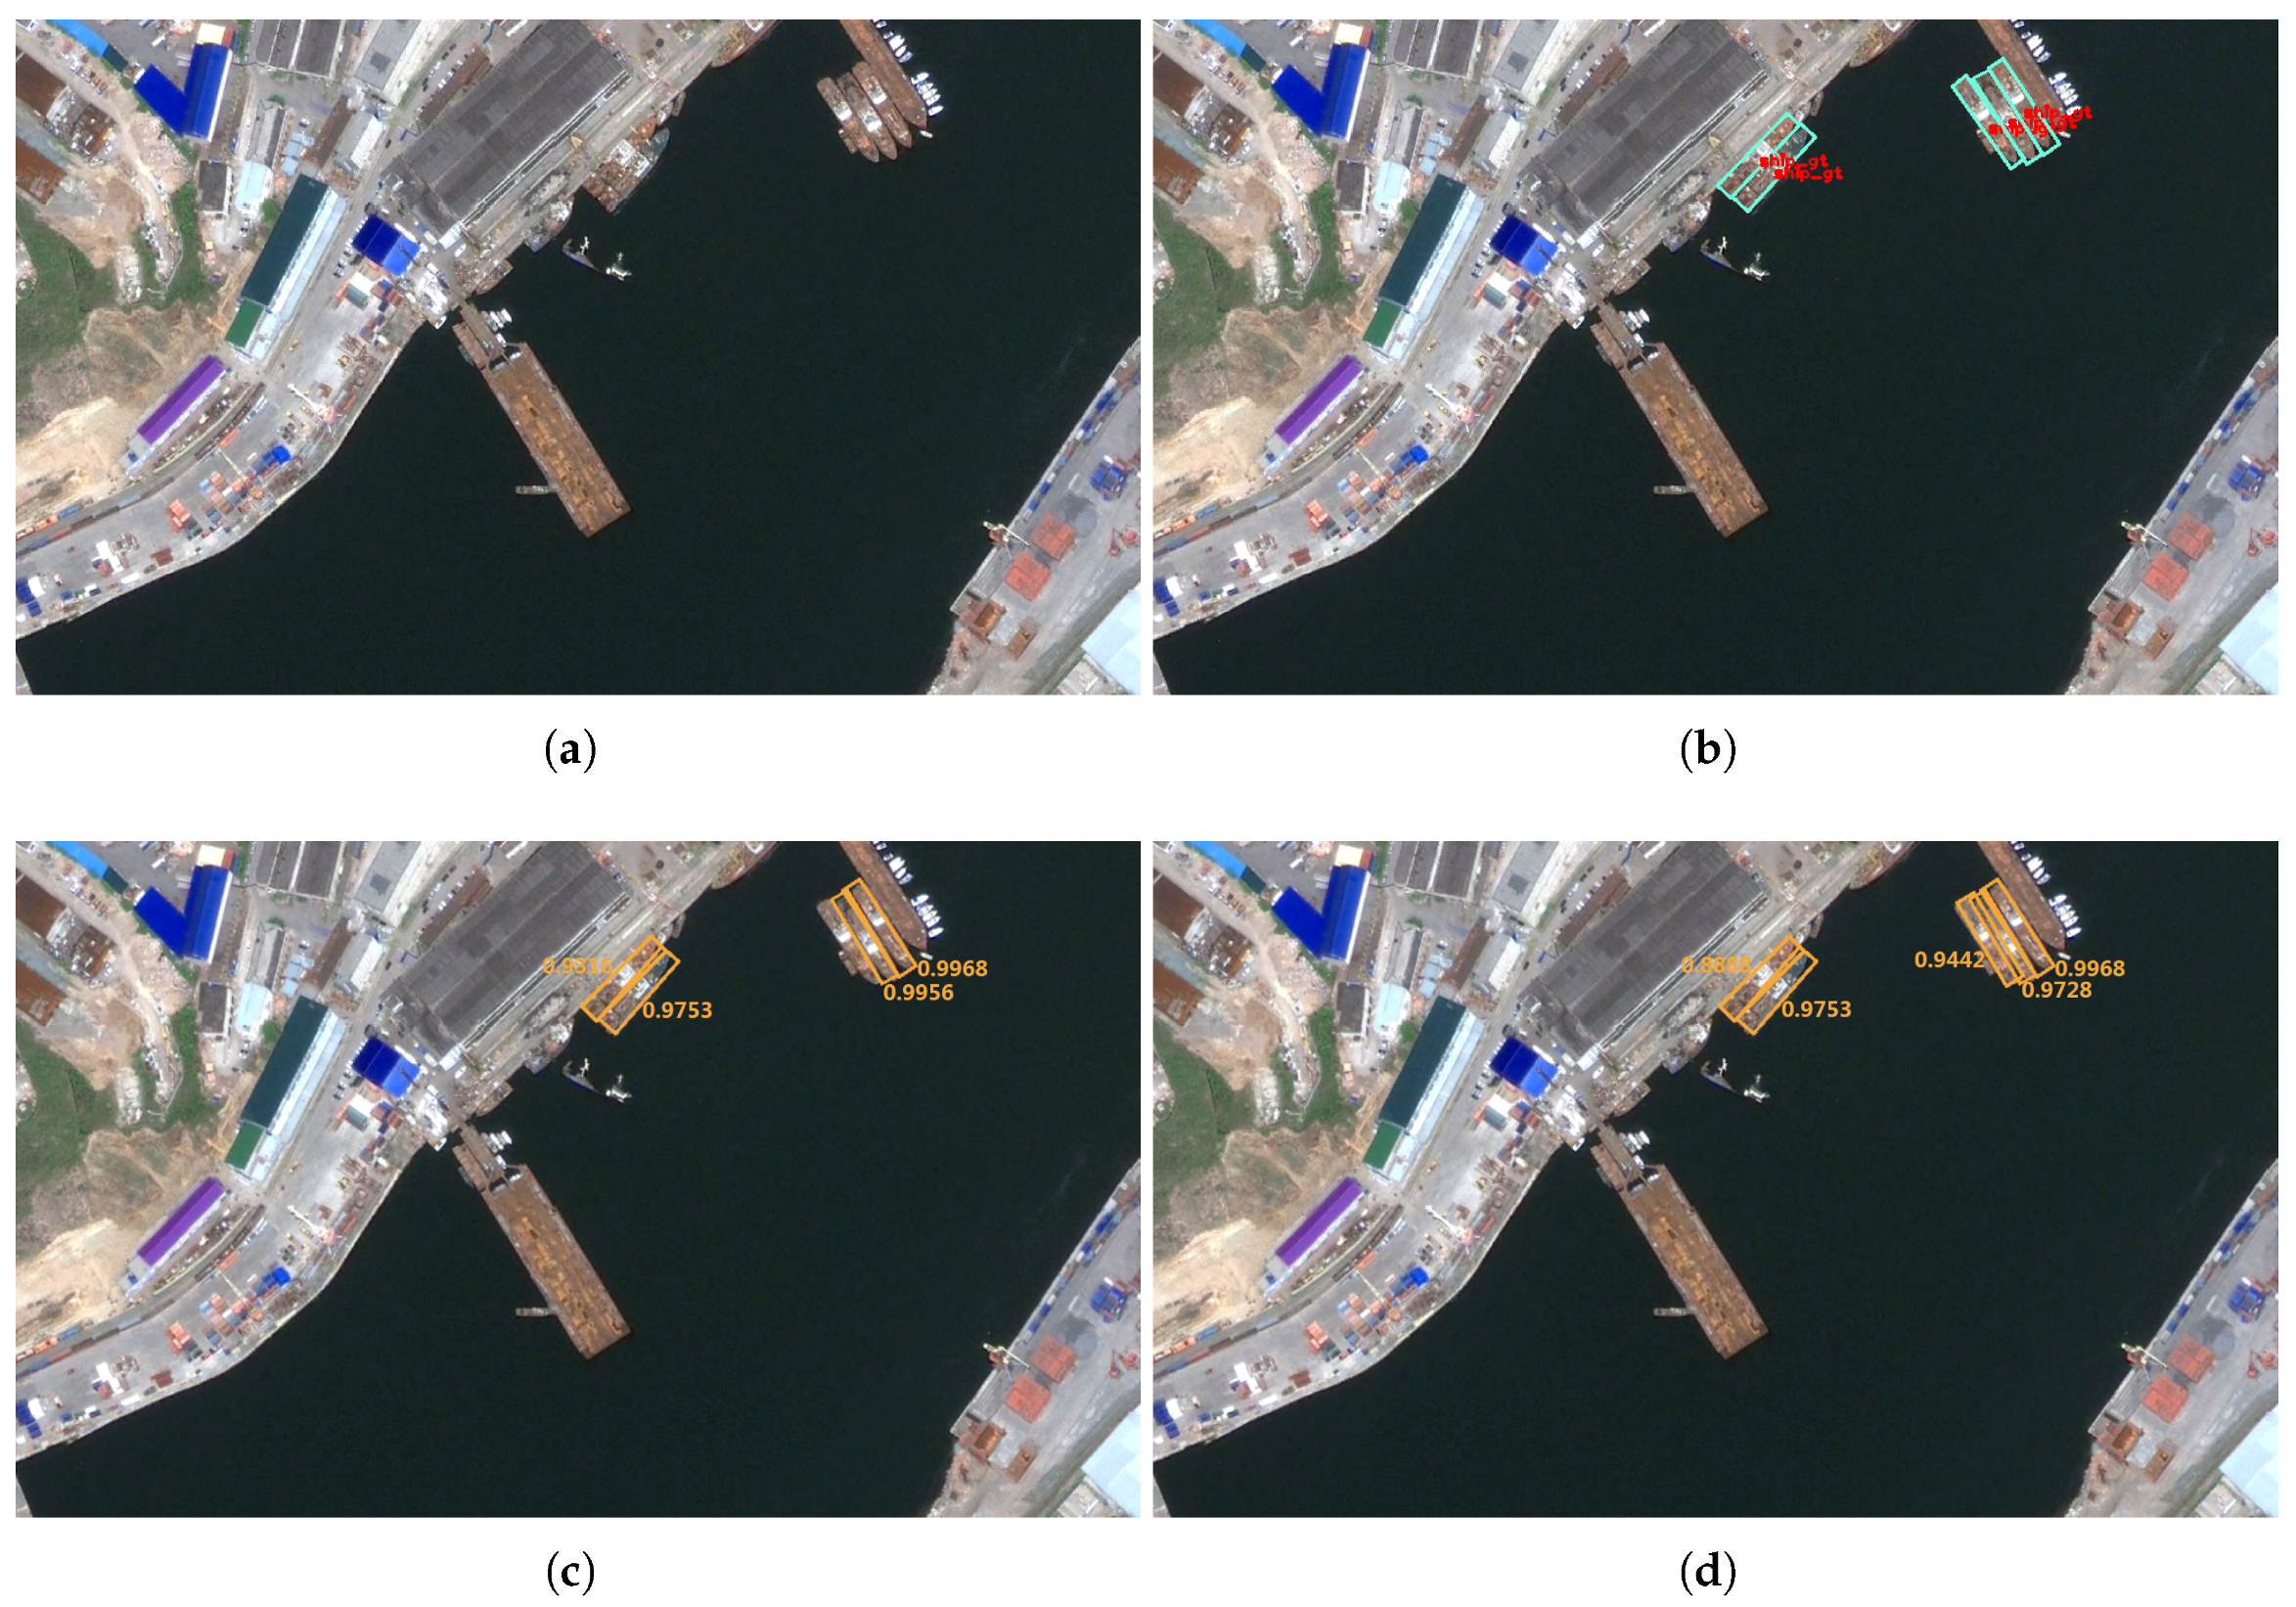
  • Since the detection result is an inclined rectangle with angle information, we adopt a soft strategy in SRNMS to suppress redundant detection results. Different from the traditional NMS, the SRNMS can obtain some detection results that are suppressed in traditional NMS, and further reduce the missed detection, which is shown in Figure 16. This type of processing is advantageous for ship detection in dense parking situations.
As shown in Table 3 and Figure 17, FFPN-RL can achieve perfect performance on the detection evaluation standards and the Precision–Recall curve. Nevertheless, since the ship angle information prediction is independently performed by the deep reinforcement learning agent in our work, it is separated from the location and classification. Therefore, our model has higher time complexity than other direct regression ship detection methods, which is shown in Table 4.

5. Conclusions

In this paper, we propose an effective FFPN-RL ship detection model based on Feature Fusion Pyramid Network and deep reinforcement learning. The Feature Fusion Pyramid Network is contrasted to generate precise location and category information for different scales’ ships through multi scale feature reuse. Then, we train an angle prediction agent through policy guidance and long-term training methods. In addition, the intellectual agent iteratively rotates the ship image clockwise to obtain the correct ship orientation information. Finally, we adopt soft rotation non-maximum suppression to remove redundant inclined results and improve the overall performance while reducing missed detection. Detailed experiments validate that our FFPN-RL model is able to achieve state-of-the-art detection performance for remote sensing ship images in different scenes.
In spite of the robustness and effectiveness of our model, shortcomings still exist. Due to the high time complexity, we will focus on integrating location and angle prediction modules to reduce overall running time in the future. In addition, we will also explore extending our ship detection models to other objects.

Author Contributions

Y.L. (Yang Li) and H.S. designed the experiments; Y.L. (Yang Li) and X.Y. analyzed the data; Y.L. (Yang Li) performed the experiments; Y.L. (Yang Li), X.Y. and H.S. analyzed the experiments; Y.L. (Yang Li) and Y.L. (Yuting Li) made contributions to the article’s organization; Y.L. (Yang Li) wrote the manuscript, H.S. revised the manuscript. In addition, K.F., G.X. and X.S. supervised the study and reviewed this article.

Funding

This work was supported by the National Natural Science Foundation of China under Grants 41501485.

Acknowledgments

This work was partly supported by the National Natural Science Foundation of China under Grant 41501485. The authors would like to thank all the lab colleagues who annotated the image dataset artificially. The authors would also be grateful to anonymous reviewers and academic editors for their constructive comments and helpful suggestions.

Conflicts of Interest

The authors declare no conflict of interest.

References

  1. Long, G.; Chen, X.Q. A Method for Automatic Detection of Ships in Harbor Area in High-Resolution Remote Sensing Image. Comput. Simul. 2007, 5, 53. [Google Scholar]
  2. Jiang, L.B.; Wang, Z.; Wei-Dong, H.U. An AIAC-based Inshore Ship Target Detection Approach. Remote Sens. Technol. Appl. 2007, 22, 88–94. [Google Scholar]
  3. Liu, G.; Zhang, Y.; Zheng, X.; Sun, X.; Fu, K.; Wang, H. A New Method on Inshore Ship Detection in High-Resolution Satellite Images Using Shape and Context Information. IEEE Geosci. Remote Sens. Lett. 2013, 11, 617–621. [Google Scholar] [CrossRef]
  4. Zhou, W.; Sun, Y.; Xu, C.; Guan, J. A Method for Discrimination of Ship Target and Azimuth Ambiguity in Multi-polarimetric SAR Imagery. J. Radars 2015, 4, 84. [Google Scholar] [CrossRef]
  5. Xu, C.; Zhou, W.; Cong, Y.; Guan, J. Ship Analysis and Detection in High-resolution Pol-SAR Imagery Based on Peak Zone. J. Radars 2015, 4, 367. [Google Scholar] [CrossRef]
  6. Li, W.; Fu, K.; Sun, H.; Sun, X.; Guo, Z.; Yan, M.; Zheng, X. Integrated Localization and Recognition for Inshore Ships in Large Scene Remote Sensing Images. IEEE Geosci. Remote Sens. Lett. 2017, 14, 936–940. [Google Scholar] [CrossRef]
  7. Bi, F.; Zhu, B.; Gao, L.; Bian, M. A Visual Search Inspired Computational Model for Ship Detection in Optical Satellite Images. IEEE Geosci. Remote Sens. Lett. 2012, 9, 749–753. [Google Scholar]
  8. Qi, S.; Ma, J.; Lin, J.; Li, Y.; Tian, J. Unsupervised Ship Detection Based on Saliency and S-HOG Descriptor From Optical Satellite Images. IEEE Geosci. Remote Sens. Lett. 2015, 12, 1451–1455. [Google Scholar]
  9. Dao, M.; Kwan, C.; Koperski, K.; Marchisio, G. A Joint Sparsity Approach to Tunnel Activity Monitoring Using High Resolution Satellite Images. In Proceedings of the 2018 9th IEEE Annual Ubiquitous Computing, Electronics and Mobile Communication Conference, New York, NY, USA, 8–10 November 2018. [Google Scholar]
  10. Chen, Y.; Nasrabadi, N.M.; Tran, T.D. Hyperspectral Image Classification Using Dictionary-Based Sparse Representation. IEEE Trans. Geosci. Remote Sens. 2011, 49, 3973–3985. [Google Scholar] [CrossRef]
  11. Huang, X.; Wu, F.; Huang, P. Moving-object Detection Based on Sparse Representation and Dictionary Learning. Aasri Procedia 2012, 1, 492–497. [Google Scholar] [CrossRef]
  12. Xiao, Q.; Hu, X.; Gao, S.; Wang, H. Object Detection Based on Contour Learning and Template Matching. In Proceedings of the 2010 8th World Congress on Intelligent Control and Automation, Jinan, China, 7–9 July 2010; pp. 6361–6365. [Google Scholar]
  13. Krizhevsky, A.; Sutskever, I.; Hinton, G.E. ImageNet classification with deep convolutional neural networks. In Proceedings of the International Conference on Neural Information Processing Systems, Lake Tahoe, NV, USA, 3–6 December 2012; pp. 1097–1105. [Google Scholar]
  14. Simonyan, K.; Zisserman, A. Very Deep Convolutional Networks for Large-Scale Image Recognition. arXiv, 2014; arXiv:1409.1556. [Google Scholar]
  15. Szegedy, C.; Liu, W.; Jia, Y.; Sermanet, P.; Reed, S.E.; Anguelov, D.; Erhan, D.; Vanhoucke, V.; Rabinovich, A. Going Deeper with Convolutions. arXiv, 2014; arXiv:1409.4842. [Google Scholar]
  16. He, K.; Zhang, X.; Ren, S.; Sun, J. Identity Mappings in Deep Residual Networks. arXiv, 2016; arXiv:1603.05027. [Google Scholar]
  17. Huang, G.; Liu, Z.; Weinberger, K.Q. Densely Connected Convolutional Networks. arXiv, 2016; arXiv:1608.06993. [Google Scholar]
  18. Zoph, B.; Vasudevan, V.; Shlens, J.; Le, Q.V. Learning Transferable Architectures for Scalable Image Recognition. In Proceedings of the 2018 Computer Vision and Pattern Recognition, Salt Lake City, UT, USA, 18–22 June 2018. [Google Scholar]
  19. Girshick, R. Fast r-cnn. In Proceedings of the 2015 IEEE International Conference on Computer Vision, Santiago, Chile, 7–13 December 2015; pp. 1440–1448. [Google Scholar]
  20. Ren, S.; He, K.; Girshick, R.; Sun, J. Faster R-CNN: Towards real-time object detection with region proposal networks. In Proceedings of the Advances in Neural Information Processing Systems 28: Annual Conference on Neural Information Processing Systems 2015, Montreal, QC, Canada, 7–12 December 2015; pp. 91–99. [Google Scholar]
  21. Lin, T.; Dollar, P.; Girshick, R.B.; He, K.; Hariharan, B.; Belongie, S.J. Feature Pyramid Networks for Object Detection. In Proceedings of the 2017 Computer Vision and Pattern Recognition, Honolulu, HI, USA, 21–26 July 2017; pp. 936–944. [Google Scholar]
  22. Redmon, J.; Farhadi, A. YOLO9000: Better, Faster, Stronger. In Proceedings of the 2017 Computer Vision and Pattern Recognition, Honolulu, HI, USA, 21–26 July 2017; pp. 6517–6525. [Google Scholar]
  23. Liu, W.; Anguelov, D.; Erhan, D.; Szegedy, C.; Reed, S.; Fu, C.Y.; Berg, A.C. Ssd: Single shot multibox detector. In Proceedings of the European Conference on Computer Vision, Amsterdam, The Netherlands, 11–14 October 2016; Springer: New York, NY, USA, 2016; pp. 21–37. [Google Scholar]
  24. Nguyen, P.; Arsalan, M.; Koo, J.; Naqvi, R.; Truong, N.; Kang, P. LightDenseYOLO: A Fast and Accurate Marker Tracker for Autonomous UAV Landing by Visible Light Camera Sensor on Drone. Sensors 2018, 18, 1315. [Google Scholar] [CrossRef] [PubMed]
  25. Ma, J.; Shao, W.; Ye, H.; Wang, L.; Wang, H.; Zheng, Y.; Xue, X.; Ma, J.; Shao, W.; Ye, H.; et al. Arbitrary-Oriented Scene Text Detection via Rotation Proposals. IEEE Trans. Multimed. 2018, 20, 3111–3122. [Google Scholar] [CrossRef] [Green Version]
  26. Jiang, Y.; Zhu, X.; Wang, X.; Yang, S.; Li, W.; Wang, H.; Fu, P.; Luo, Z. R2CNN: Rotational Region CNN for Orientation Robust Scene Text Detection. arXiv, 2017; arXiv:1706.09579. [Google Scholar]
  27. Yang, X.; Sun, H.; Fu, K.; Yang, J.; Sun, X.; Yan, M.; Guo, Z. Automatic Ship Detection in Remote Sensing Images from Google Earth of Complex Scenes Based on Multiscale Rotation Dense Feature Pyramid Networks. Remote Sens. 2018, 10, 132. [Google Scholar] [CrossRef]
  28. Mnih, V.; Kavukcuoglu, K.; Silver, D.; Graves, A.; Antonoglou, I.; Wierstra, D.; Riedmiller, M.A. Playing Atari with Deep Reinforcement Learning. arXiv, 2013; arXiv:1312.5602. [Google Scholar]
  29. Mnih, V.; Kavukcuoglu, K.; Silver, D.; Rusu, A.A.; Veness, J.; Bellemare, M.G.; Graves, A.; Riedmiller, M.; Fidjeland, A.K.; Ostrovski, G.; et al. Human-level control through deep reinforcement learning. Nature 2015, 518, 529–533. [Google Scholar] [CrossRef] [PubMed]
  30. Van Hasselt, H.; Guez, A.; Silver, D. Deep Reinforcement Learning with Double Q-Learning. In Proceedings of the AAAI, Phoenix, AZ, USA, 12–17 February 2016; pp. 2094–2100. [Google Scholar]
  31. Wang, Z.; Schaul, T.; Hessel, M.; Van Hasselt, H.; Lanctot, M.; De Freitas, N. Dueling network architectures for deep reinforcement learning. In Proceedings of the International Conference on Machine Learning, New York, NY, USA, 19–24 June 2016; pp. 1995–2003. [Google Scholar]
  32. Kulkarni, T.D.; Narasimhan, K.; Saeedi, A.; Tenenbaum, J.B. Hierarchical Deep Reinforcement Learning: Integrating Temporal Abstraction and Intrinsic Motivation. In Proceedings of the Neural Information Processing Systems, Barcelona, Spain, 5–10 December 2016; pp. 3675–3683. [Google Scholar]
  33. Lillicrap, T.P.; Hunt, J.J.; Pritzel, A.; Heess, N.; Erez, T.; Tassa, Y.; Silver, D.; Wierstra, D.P. Continuous control with deep reinforcement learning. In Proceedings of the International Conference on Learning Representations, San Juan, PR, USA, 2–3 May 2016. [Google Scholar]
  34. Yun, S.; Choi, J.; Yoo, Y.; Yun, K.; Choi, J.Y. Action-Decision Networks for Visual Tracking with Deep Reinforcement Learning. In Proceedings of the 2017 IEEE Conference on Computer Vision and Pattern Recognition (CVPR), Honolulu, HI, USA, 21–26 July 2017; pp. 1349–1358. [Google Scholar] [CrossRef]
  35. Lan, X.; Wang, H.; Gong, S.; Zhu, X. Identity Alignment by Noisy Pixel Removal. arXiv, 2017; arXiv:1707.02785. [Google Scholar]
  36. Kendall, A.; Hawke, J.; Janz, D.; Mazur, P.; Reda, D.; Allen, J.; Lam, V.; Bewley, A.; Shah, A. Learning to Drive in a Day. arXiv, 2018; arXiv:1807.00412. [Google Scholar]
  37. Russakovsky, O.; Deng, J.; Su, H.; Krause, J.; Satheesh, S.; Ma, S.; Huang, Z.; Karpathy, A.; Khosla, A.; Bernstein, M.; et al. ImageNet Large Scale Visual Recognition Challenge. Int. J. Comput. Vis. 2015, 115, 211–252. [Google Scholar] [CrossRef] [Green Version]
  38. Kingma, D.P.; Ba, J. Adam: A Method for Stochastic Optimization. In Proceedings of the International Conference on Learning Representations, San Diego, CA, USA, 7–9 May 2015. [Google Scholar]
  39. Quek, A. Ship Orientation Estimation. 2015. Available online: https://alyssaq.github.io/2015/computing-the-axes-or-orientation-of-a-blob/ (accessed on 27 November 2018).
Figure 1. Feature Fusion Pyramid Network and Deep Reinforcement Learning (FFPN-RL) ship detection model.
Remotesensing 10 01922 g001
Figure 2. Feature fusion process in a Feature Fusion Pyramid Network.
Remotesensing 10 01922 g002
Figure 3. C4 feature map fusion process in a Feature Fusion Pyramid Network. (a) the convolution and resizing based on the original feature map C4; (b) the stacking operation based on the intermediate feature maps.
Remotesensing 10 01922 g003
Figure 4. (a) the four points coordinates of quadrilateral ship ground truth; (b) the inclined rectangle ship ground truth in our work.
Remotesensing 10 01922 g004
Figure 5. Ships region proposals of different scales. (a,b) the ground truth bounding boxes of ships; (c,d) the different scales region proposals of multiscale ships generated by region proposal network in our work.
Remotesensing 10 01922 g005
Figure 6. Different inclined rectangle boxes of ships.
Remotesensing 10 01922 g006
Figure 7. The action set and ship rotation process.
Remotesensing 10 01922 g007
Figure 8. The dueling network of angle prediction. The state value and action advantages are estimated in parallel structure of dueling networks.
Remotesensing 10 01922 g008
Figure 9. Some remote sensing ship images in datasets.
Remotesensing 10 01922 g009
Figure 10. Distribution Comparison of anchors with different aspect ratios. (a) scatter plot of ship horizontal boxes (gray dots), scatter plot of anchors (yellow dots), and green lines with 1/2, 1.0 and 2.0 slopes used in traditional object detection; (b) anchor ratios are 1/9, 1/5 1/3, 1/2, 1.0, 2.0, 3.0, 5.0 and 9.0. Scatter plot of ship horizontal boxes (gray dots), scatter plot of anchors (yellow dots), green lines with 1/2, 1.0 and 2.0 slopes, and red lines with 1/9, 1/5, 1/3, 3.0, 5.0 and 9.0 slopes supplemented for object detection of large aspect ratio.
Remotesensing 10 01922 g010
Figure 11. Prediction performance of Eigenvectors with the Largest Eigenvalue of Covariance Matrix (ELECM), Convolutional Neural Network (CNN), Agent with policy guidance and Agent which has no guidance. (a) accuracy rate lines of four models at different training loops; (b) mean angle difference (°) lines of four models at different training loops.
Remotesensing 10 01922 g011
Figure 12. Prediction performance of Eigenvectors with the Largest Eigenvalue of Covariance Matrix (ELECM), Convolutional Neural Network (CNN), Agent trained through step training and Agent trained through long term training. (a) accuracy rate of four models at different training loops; (b) mean angle difference (°) of four models at different training loops.
Remotesensing 10 01922 g012
Figure 13. Different convergence processes of deep Q network loss value during the whole training.
Remotesensing 10 01922 g013
Figure 14. (a,b) detection results whose angles are predicted by neural network direct regression; (c,d) detection results whose angles are obtained through agent prediction.
Remotesensing 10 01922 g014
Figure 15. Curved surfaces of detection evaluation standards with Threshold and Sigma as variables. (a) curved surface of Recall; (b) curved surface of Precision; (c) curved surface of F1 score.
Remotesensing 10 01922 g015
Figure 16. Different results of Rotation Non-Maximum Suppression (RNMS) and Soft Rotation Non-Maximum Suppression (SRNMS). (a) the original remote sensing image; (b) the inclined rectangle ground truths of ships; (c) processing result of RNMS; (d) processing result of SRNMS.
Remotesensing 10 01922 g016
Figure 17. Precision–Recall curves of You Only Look Once Network (YOLO) [22], Faster Regions Convolution Neural Network (Faster R-CNN) [20], Rotation Region Proposal Networks (RRPN) [25], Rotational Region CNN (RRCNN) [26], Rotation Dense Feature Pyramid Networks (R-DFPN) [27] and FFPN-RL ship detection models.
Remotesensing 10 01922 g017
Table 1. Average prediction time on each inclined ship for Eigenvectors with the Largest Eigenvalue of Covariance Matrix (ELECM), Convolutional Neural Network (CNN) direct regression and Agent prediction.
Prediction ModelELECMCNNAgent
Time (s)0.0050.0650.122
Table 2. Performance of models with Original Feature Pyramid Networks (FPN) [21], Dense Feature Pyramid Networks (DFPN) [27] and Feature Fusion Pyramid Network (FFPN). Each of these three models has two different ways to get the angle information, neural network direct regression (DR) and agent prediction (AP). In the DR method, through adding one node at the end of network and supervising learning, the detection model can directly obtain the angle while outputting the location information. In the AP method, the agent independently and iteratively predicts the ship angle.
MethodRecallPrecisionF1
Original FPNDR74.20%79.50%76.76%
AP76.94%82.41%79.58%
DFPNDR78.08%85.15%81.46%
AP79.85%88.08%83.76%
FFPNDR78.99%89.97%84.12%
AP83.42%90.05%86.61%
Table 3. Performance of You Only Look Once Network (YOLO) [22], Faster Regions Convolution Neural Network (Faster R-CNN) [20], Rotation Region Proposal Networks (RRPN) [25], Rotational Region CNN (RRCNN) [26], Rotation Dense Feature Pyramid Networks (R-DFPN) [27] and FFPN-RL ship detection models.
Detection ModelRecallPrecisionF1
YOLO63.53%83.04%71.98%
Faster R-CNN67.31%79.62%72.95%
RRPN71.95%77.34%74.55%
RRCNN79.83%82.99%81.38%
R-DFPN83.74%88.84%86.21%
FFPN-RL86.17%88.69%87.41%
Table 4. Average processing time on each testing image for different ship detection models.
Detection ModelYOLOFaster R-CNNRRPNRRCNNR-DFPNFFPN-RL
Time (s)0.020.130.460.260.510.89

