1. Introduction
A key aspect of both coastal research and environmental impact assessment for coastal development is the mapping of intertidal sediment type. This paper describes the use of a commercially available unmanned aerial system (UAS) to conduct such mapping. The focus of this work is on sands and muds. A key motivation for the work was the potential development of a tidal energy lagoon industry where altered intertidal coverage of sand and mud is perceived to be the primary environmental impact by both regulators and developers [
1]. Gravels and cobbles are less important in this context: such sediment classes make up a much lower percentage of the intertidal in the areas of interest so are not considered a key receptor compared to sands and muds, which provide important benthic habitats. Additionally, the contrast between cobbles and sand is greater and hence they are considered less difficult to identify in remotely sensed data; the authors have previously demonstrated such distinction using terrestrial laser scanners [
2].
Intertidal sediment type is important for two main reasons: benthic habitats and coastal morphodynamics. Grain size dictates the makeup of benthic communities (e.g., [
3,
4,
5,
6]); even temporally varying fine-scale sedimentological variations such as sedimentological differences between peaks and troughs of mega ripples can force differences in community structure [
7]. Therefore, anthropogenically forced variations in grain size can affect community structure [
8,
9]. From a morphodynamic perspective, grain size and cohesive properties not only dictate thresholds of erosion and deposition [
10,
11]—beach profile is related to grain size, as well e.g., [
12,
13]. In an estuarine context, mud levels can influence long-term morphological development [
14]. Episodic coastal mud events have been shown to have impacts on both hydrodynamics and morphodynamics, as well as having societal implications [
15].
Alteration of wave exposure and tidal currents from the pre-existing baseline, whether due to coastal development, climate change or other factors, can lead to changes to baseline sediment coverage [
16,
17]. For example, an area of increased shelter may lead to increased deposition of muds or, vice versa, increased currents may erode finer sediment. To capture any changes, pre- and post-construction monitoring is desirable, particularly for large-scale developments. Seasonal variation in sediment supply or wave and tidal forcing mean that in some areas seasonal changes in sediment coverage may be observable (e.g., [
18]) and hence regular monitoring may be required.
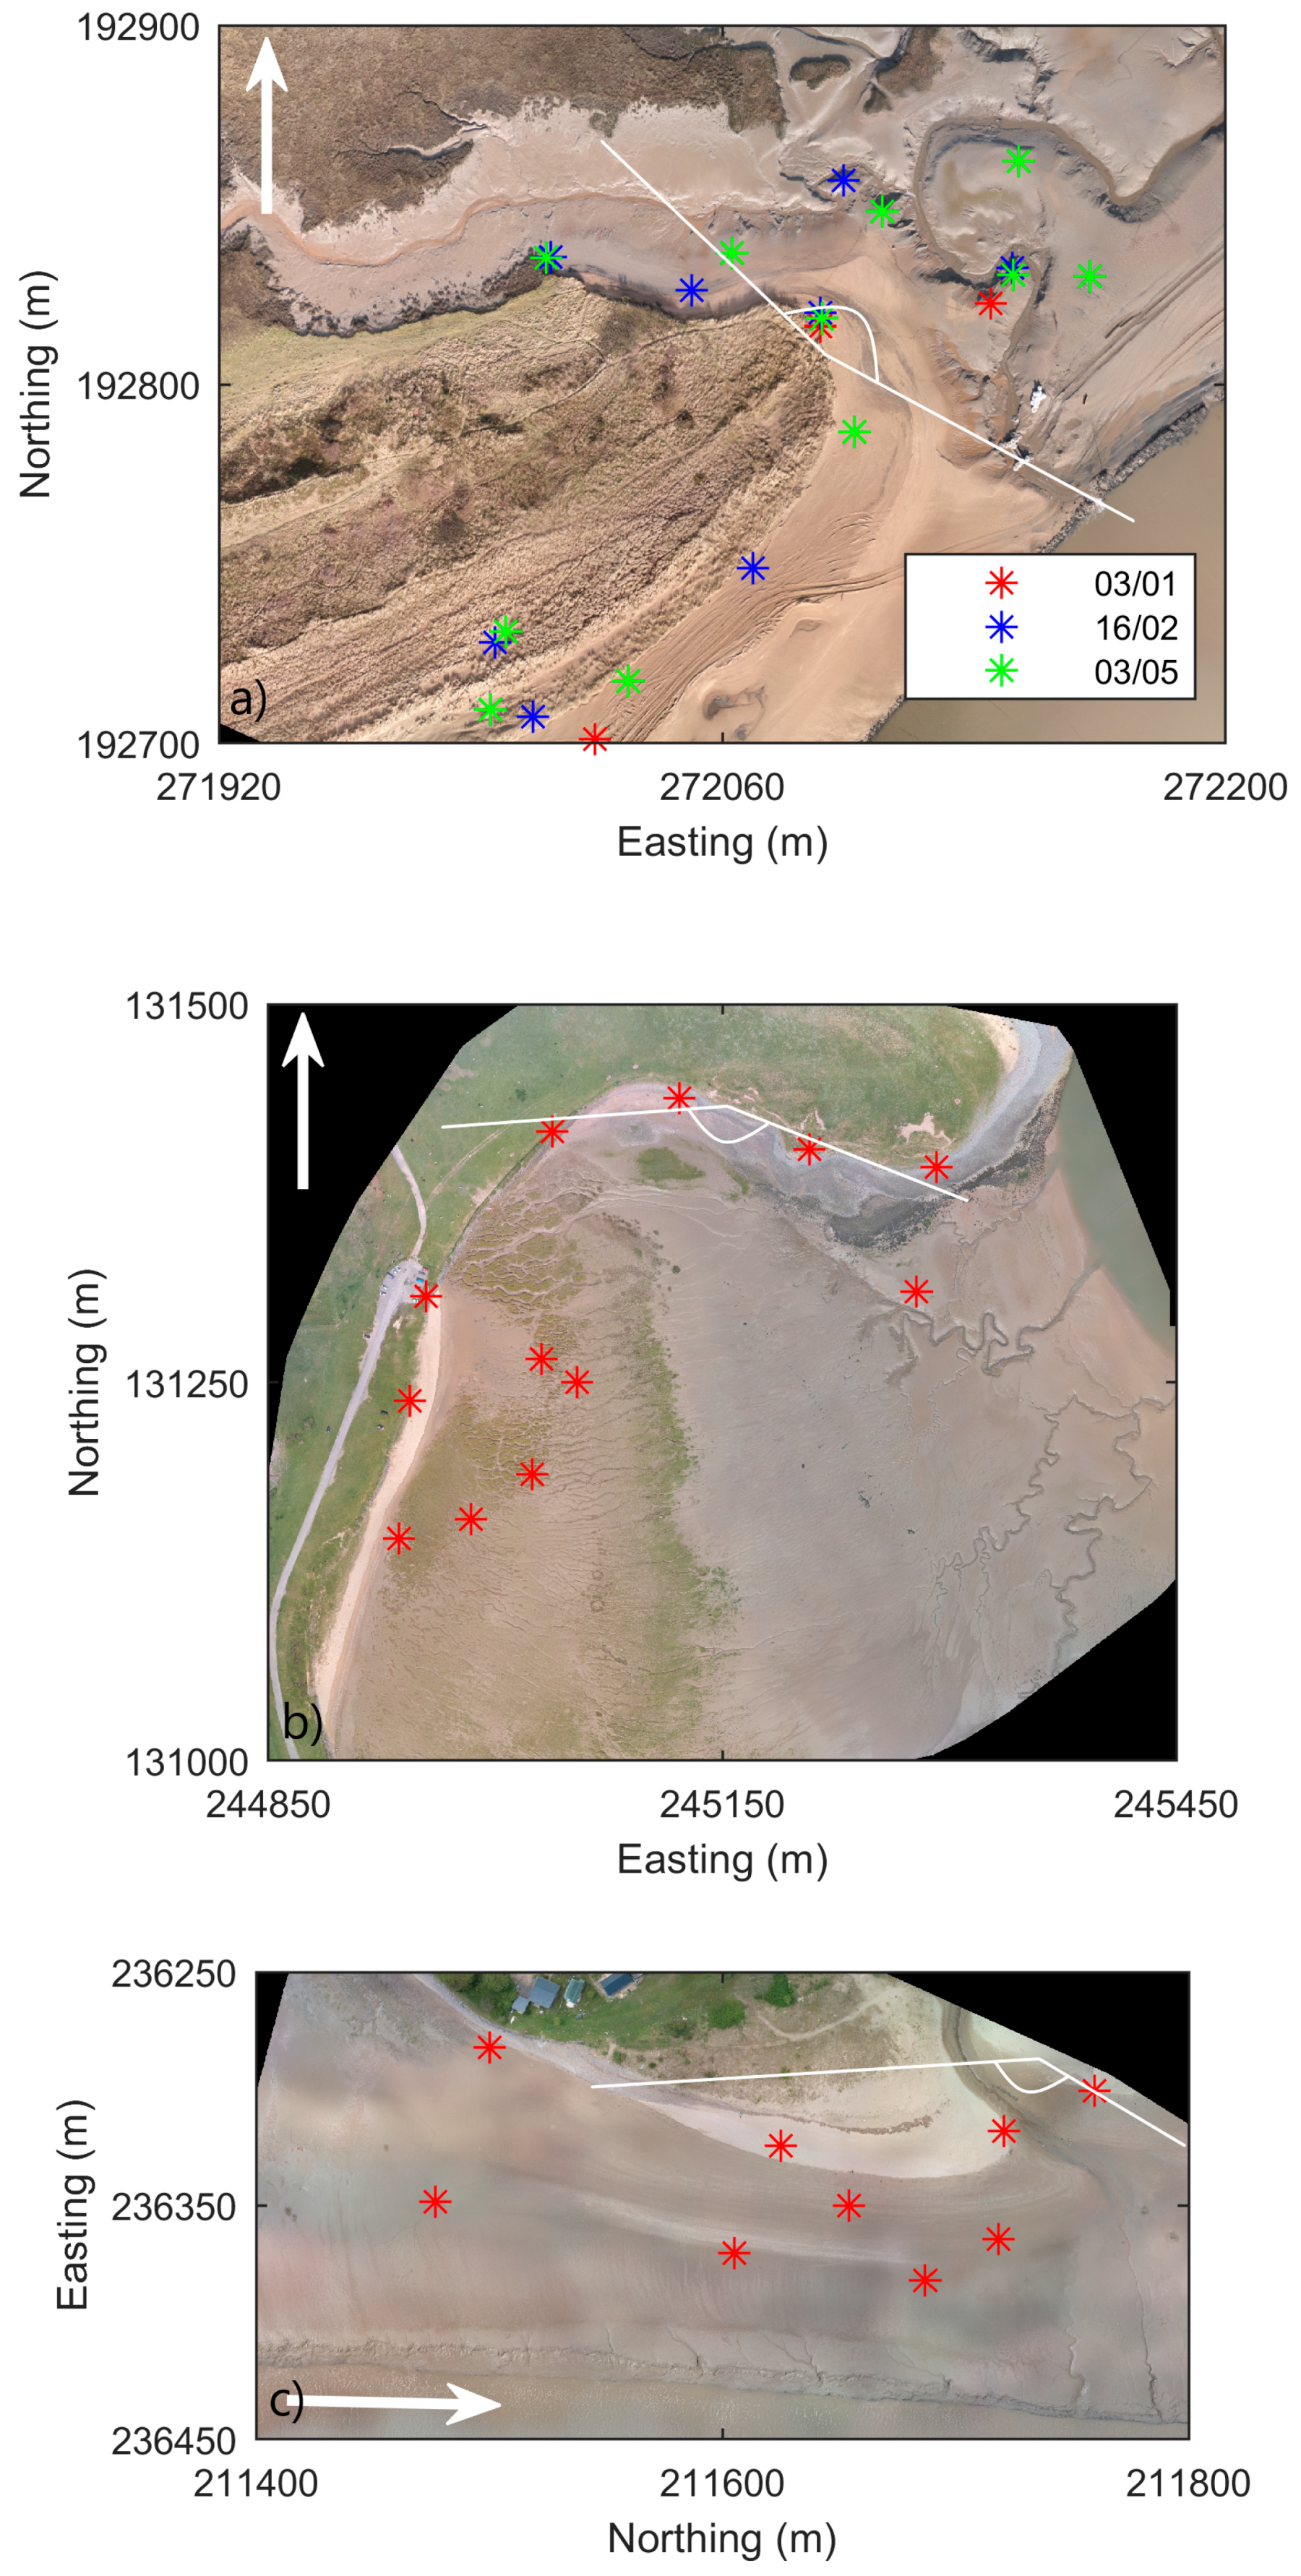
Direct sediment sampling and lab-based analysis is the default methodology for determining grain size and sediment type. For many estuarine areas and areas of high tidal range, the width of the intertidal expanse means that such in-situ monitoring is time consuming. This means mapping is based on a sparse grid of samples that may not accurately represent detailed 2-dimensional spatial patterns of different sediment types. Additionally, some intertidal areas are inaccessible by foot and there are health and safety considerations related to working in unconsolidated sediment and close to the low tide line.
Previously, researchers have demonstrated the use of satellite and aircraft remote sensing to map intertidal sediment with good success. Multispectral and hyperspectral instruments attached to light aircraft have been used to map clay content and intertidal grain size distributions [
19]; to map percentages of sand, clay and silt and hence classify sediment type [
20] or to classify intertidal areas into different classes [
21,
22,
23]. Similarly, a range of satellites has multispectral or hyperspectral sensors that can be used to map intertidal sediment type [
24,
25] or estimate grain size [
26]. These techniques have all been shown to perform well and facilitate classification of large areas of intertidal sediment in a time effective manner. However, the cost of instrumentation and deployment; the large quantities of data; and the specialist knowledge required for processing and interpretation mean they may not be suitable for routine environmental impact assessment work. In such cases, commercial consultancy companies may be more likely to use off-the-shelf tools to acquire data and UAS remote sensing may be more attractive.
In recent years, the use of UAS has proliferated in both academia and industry to facilitate a range of surveys. Typically, this focuses on the use of Red-Green-Blue (RGB) color images to reconstruct digital surface maps, (DSMs), through structure from motion (SfM) techniques. Industrial uptake means a range of off-the-shelf products are available including aircraft, sensors and pre- and post-processing software. One area that has embraced the use of UAS is precision agriculture, which means that relatively low-cost multispectral sensors are available. These are optimized for plant health monitoring and typically include spectral bands in the visible, red-edge (RE), and near-infrared (NIR), regions of the electromagnetic spectrum. Equally, thermal cameras are readily available for tasks such as inspection of solar panels. Past research has shown that thermal signals can be used to classify sediments: sandy sediments have a much stronger response to heating than muddy sediments [
27]. The difference is caused by differences in sediment composition and porosity [
28].
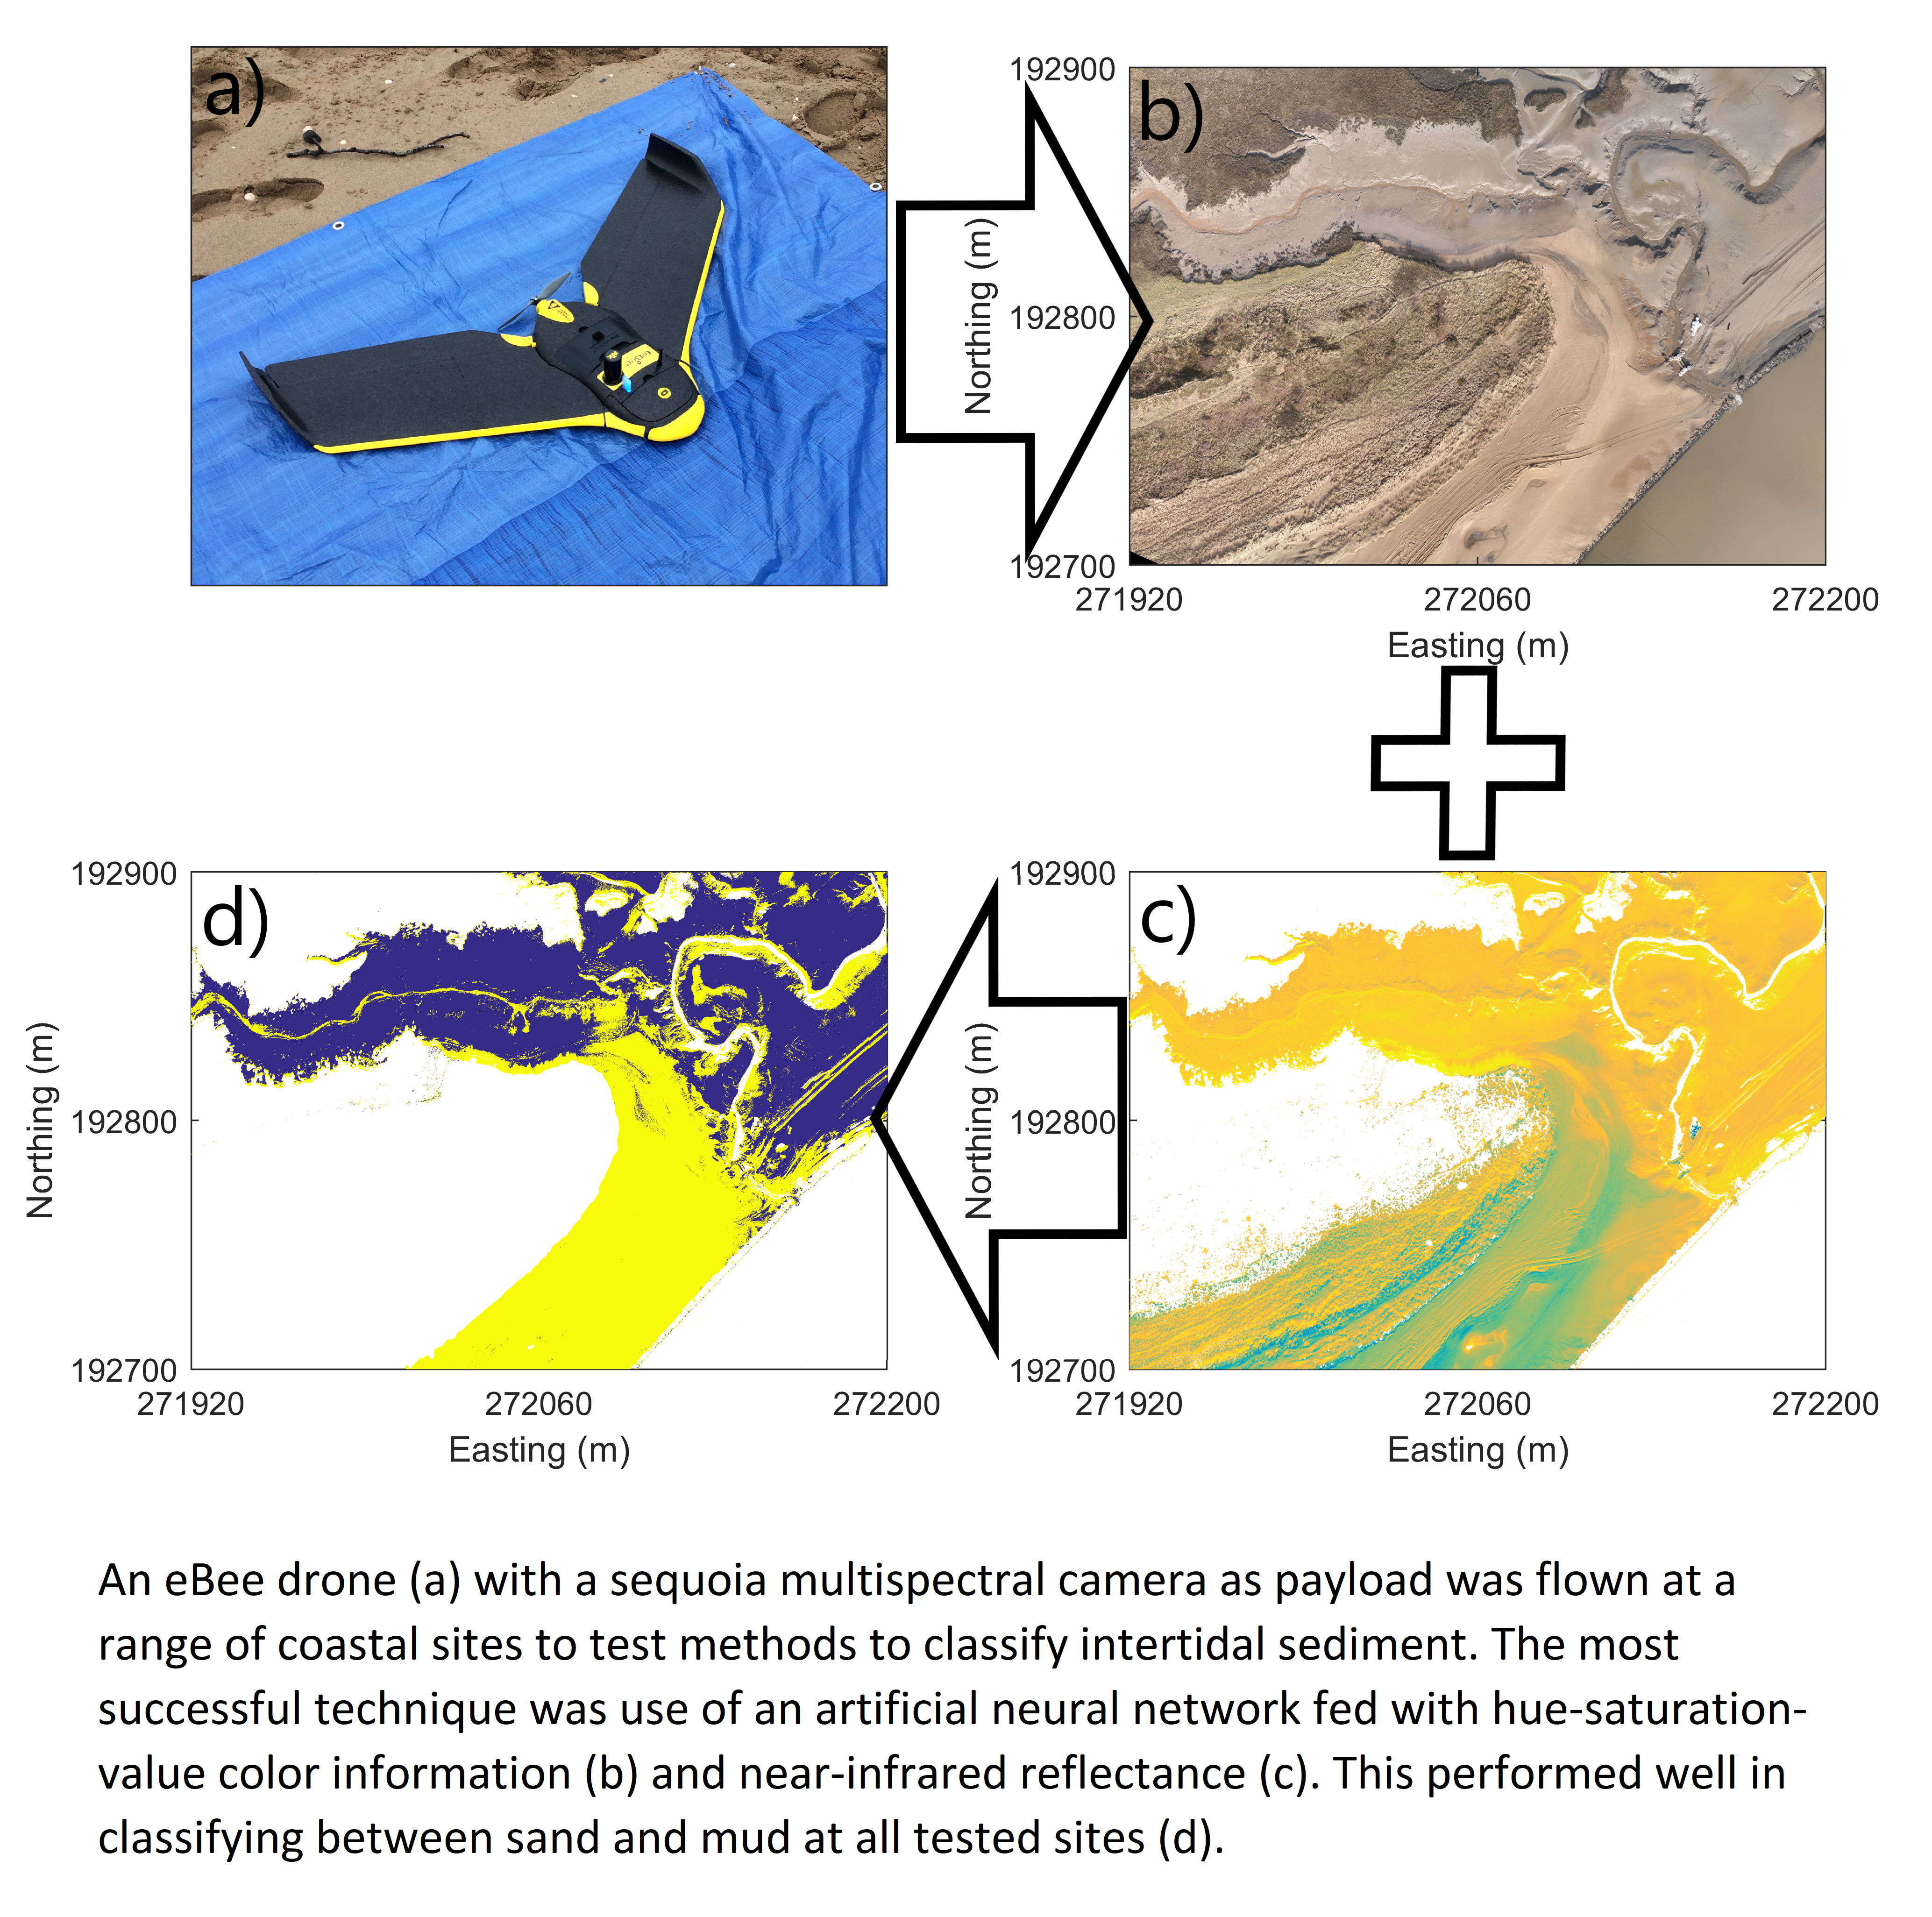
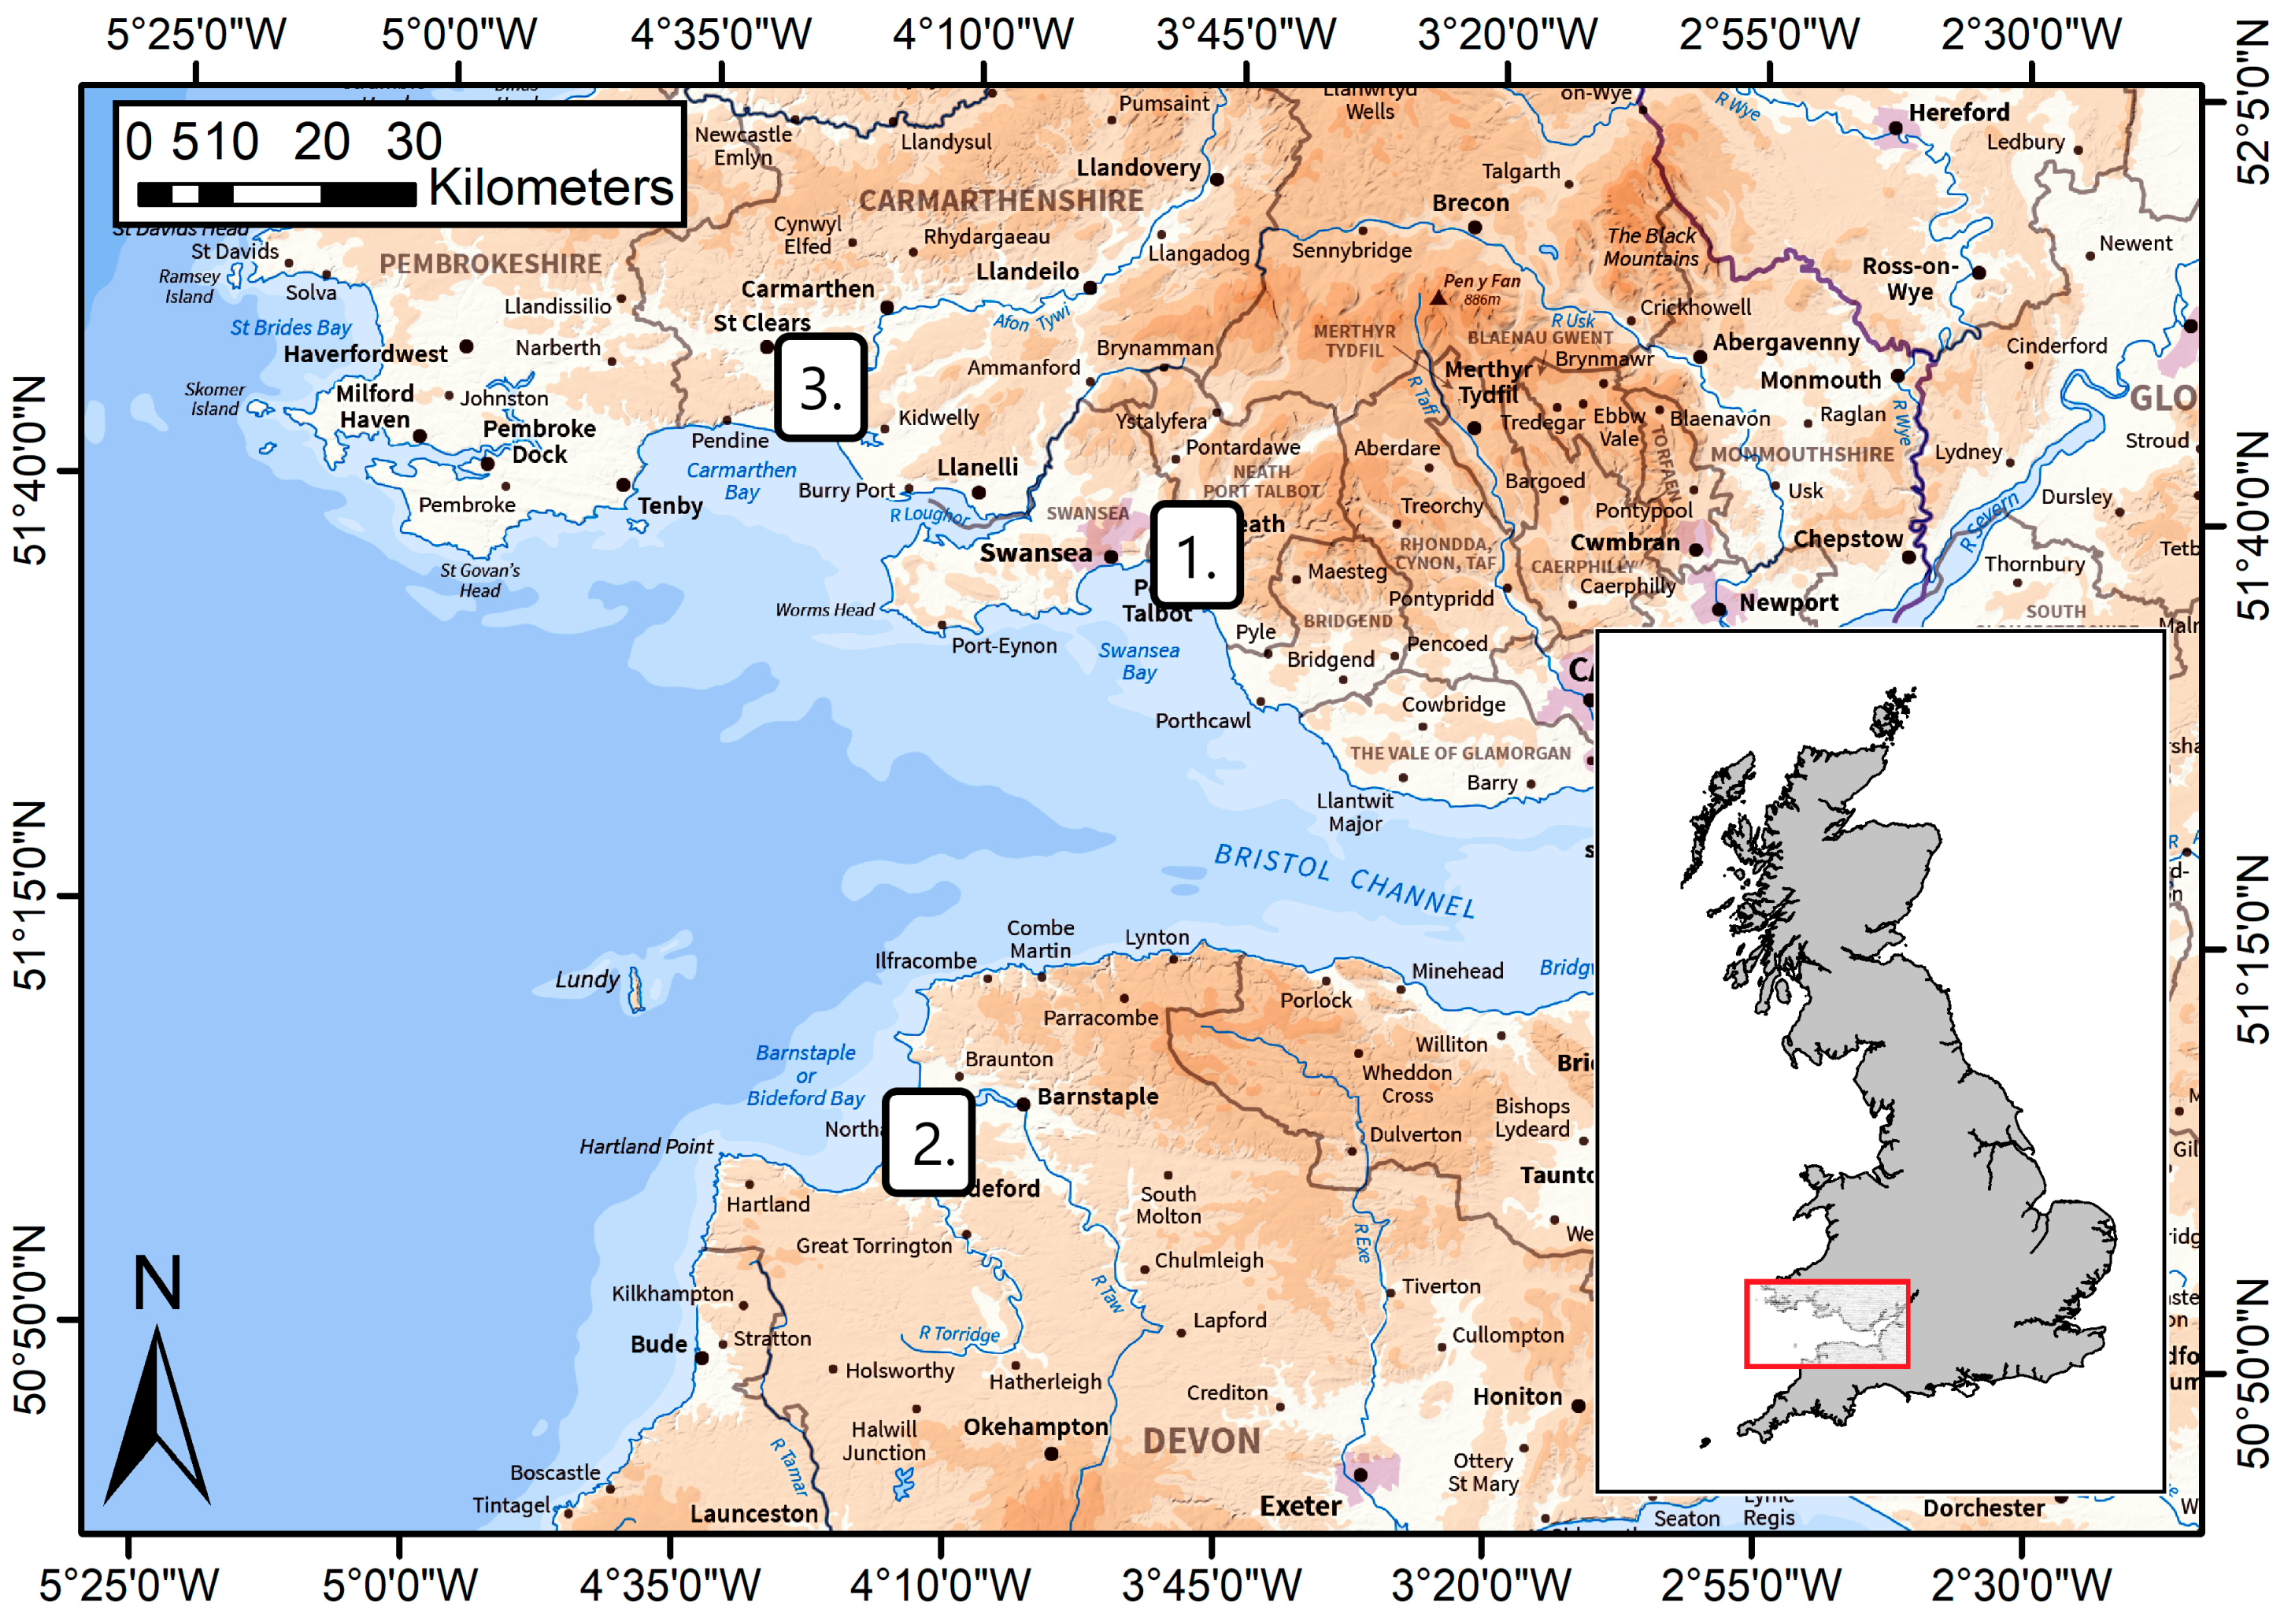
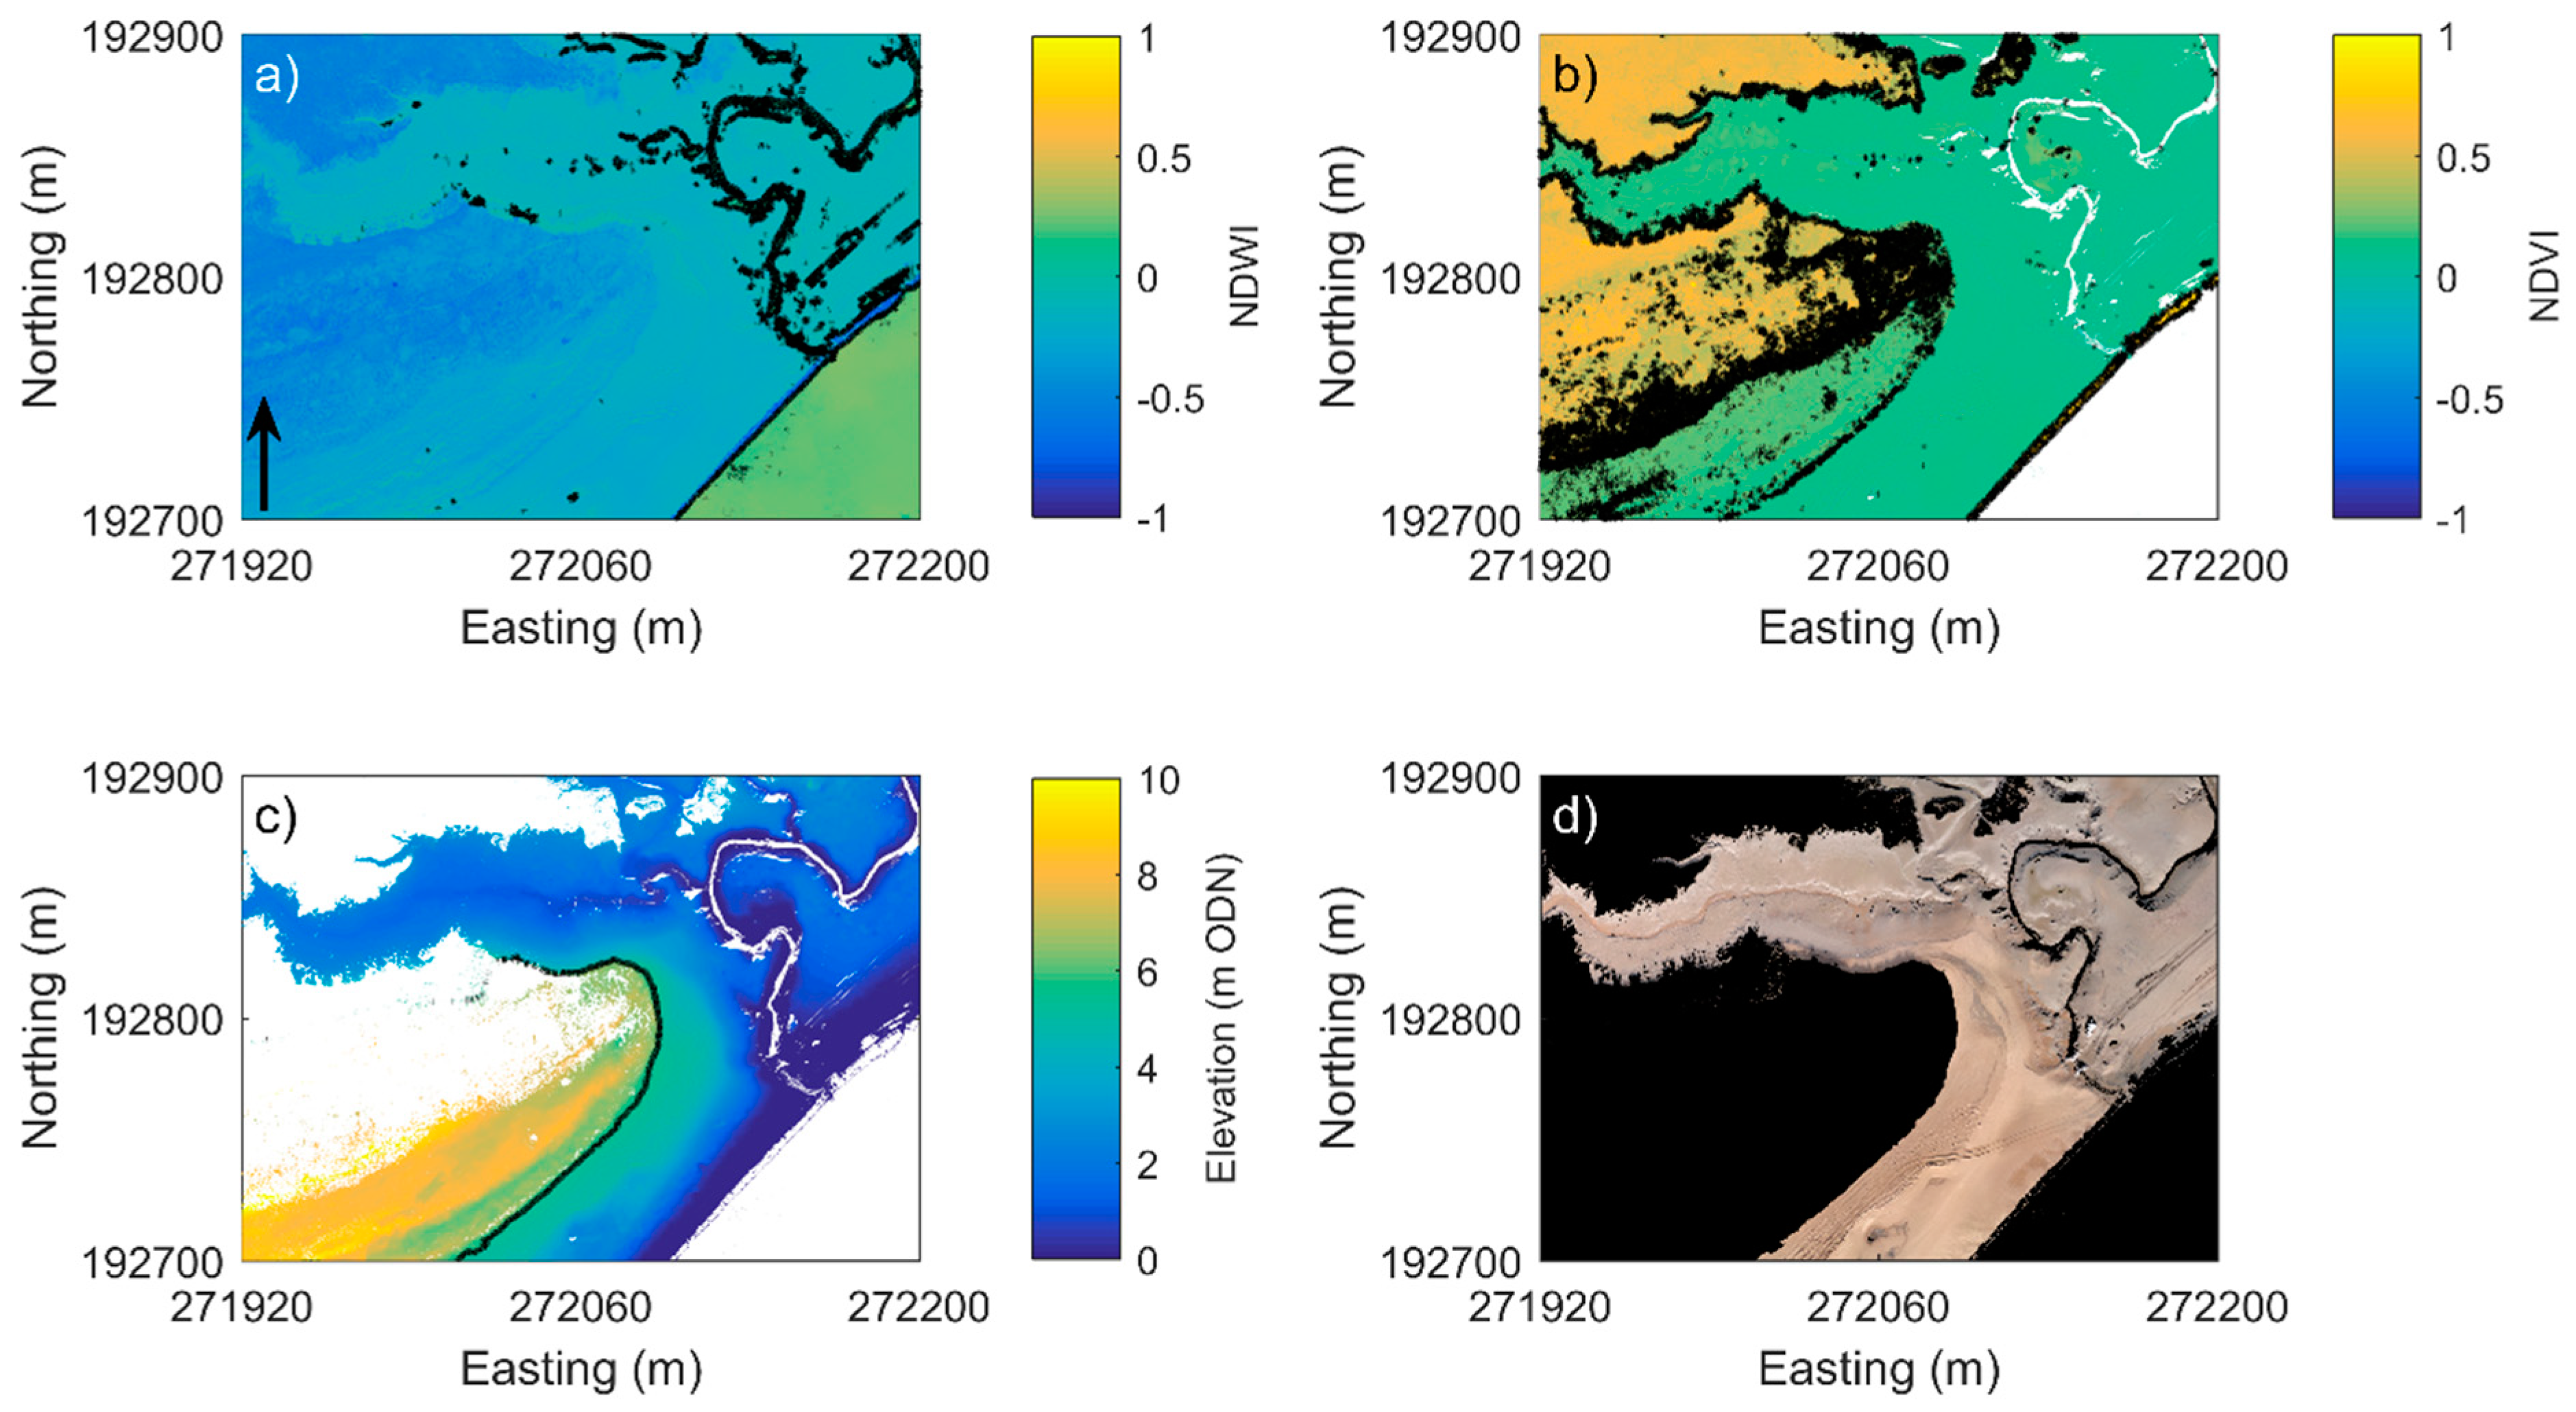
Here, both thermal and an agriculturally focused multispectral sensor were tested at three sites (
Figure 1) on a small fixed wing UAS. Variation of the UAS measured parameters over the intertidal and their relationships with grain size and moisture content is presented. Next, different sets of the measured data channels were passed to three different classification routines. These routines were used to define different sediment type regions; a binary discrimination between ”sand” and ”mud” was considered. The three classification routines tested were: k-means clustering; artificial neural networks (ANNs) and the random forest (RF) approach.
The k-means technique was selected as it provides an example of an unsupervised technique which would allow efficient automation of the process and has previously been applied to sediment classification of intertidal areas [
29]; ANNs were utilized because the authors have previously had success with ANN for sediment discrimination using terrestrial laser scanner data [
2]; while the RF technique has been reported as a useful tool for classification of sediment type in remotely sensed data [
30]. The objective of the study is to demonstrate the potential of low-cost, off-the-shelf UAS to map intertidal sediment type. The motivation is to facilitate the uptake of this new technology for both commercial and research applications.
4. Discussion
This paper has demonstrated the ability to distinguish between sandy and muddy intertidal sediments using a UAS with RGB and multispectral sensors. In this analysis, the optimal classification made use of HSV color and NIR reflectance data. Other research [
33,
34,
35,
36,
37] has demonstrated that HSV is better than RGB for image classification and these results corroborate those findings. The benefits of including NIR reflectance is unsurprising since a positive correlation between median grain size and NIR reflectance was found.
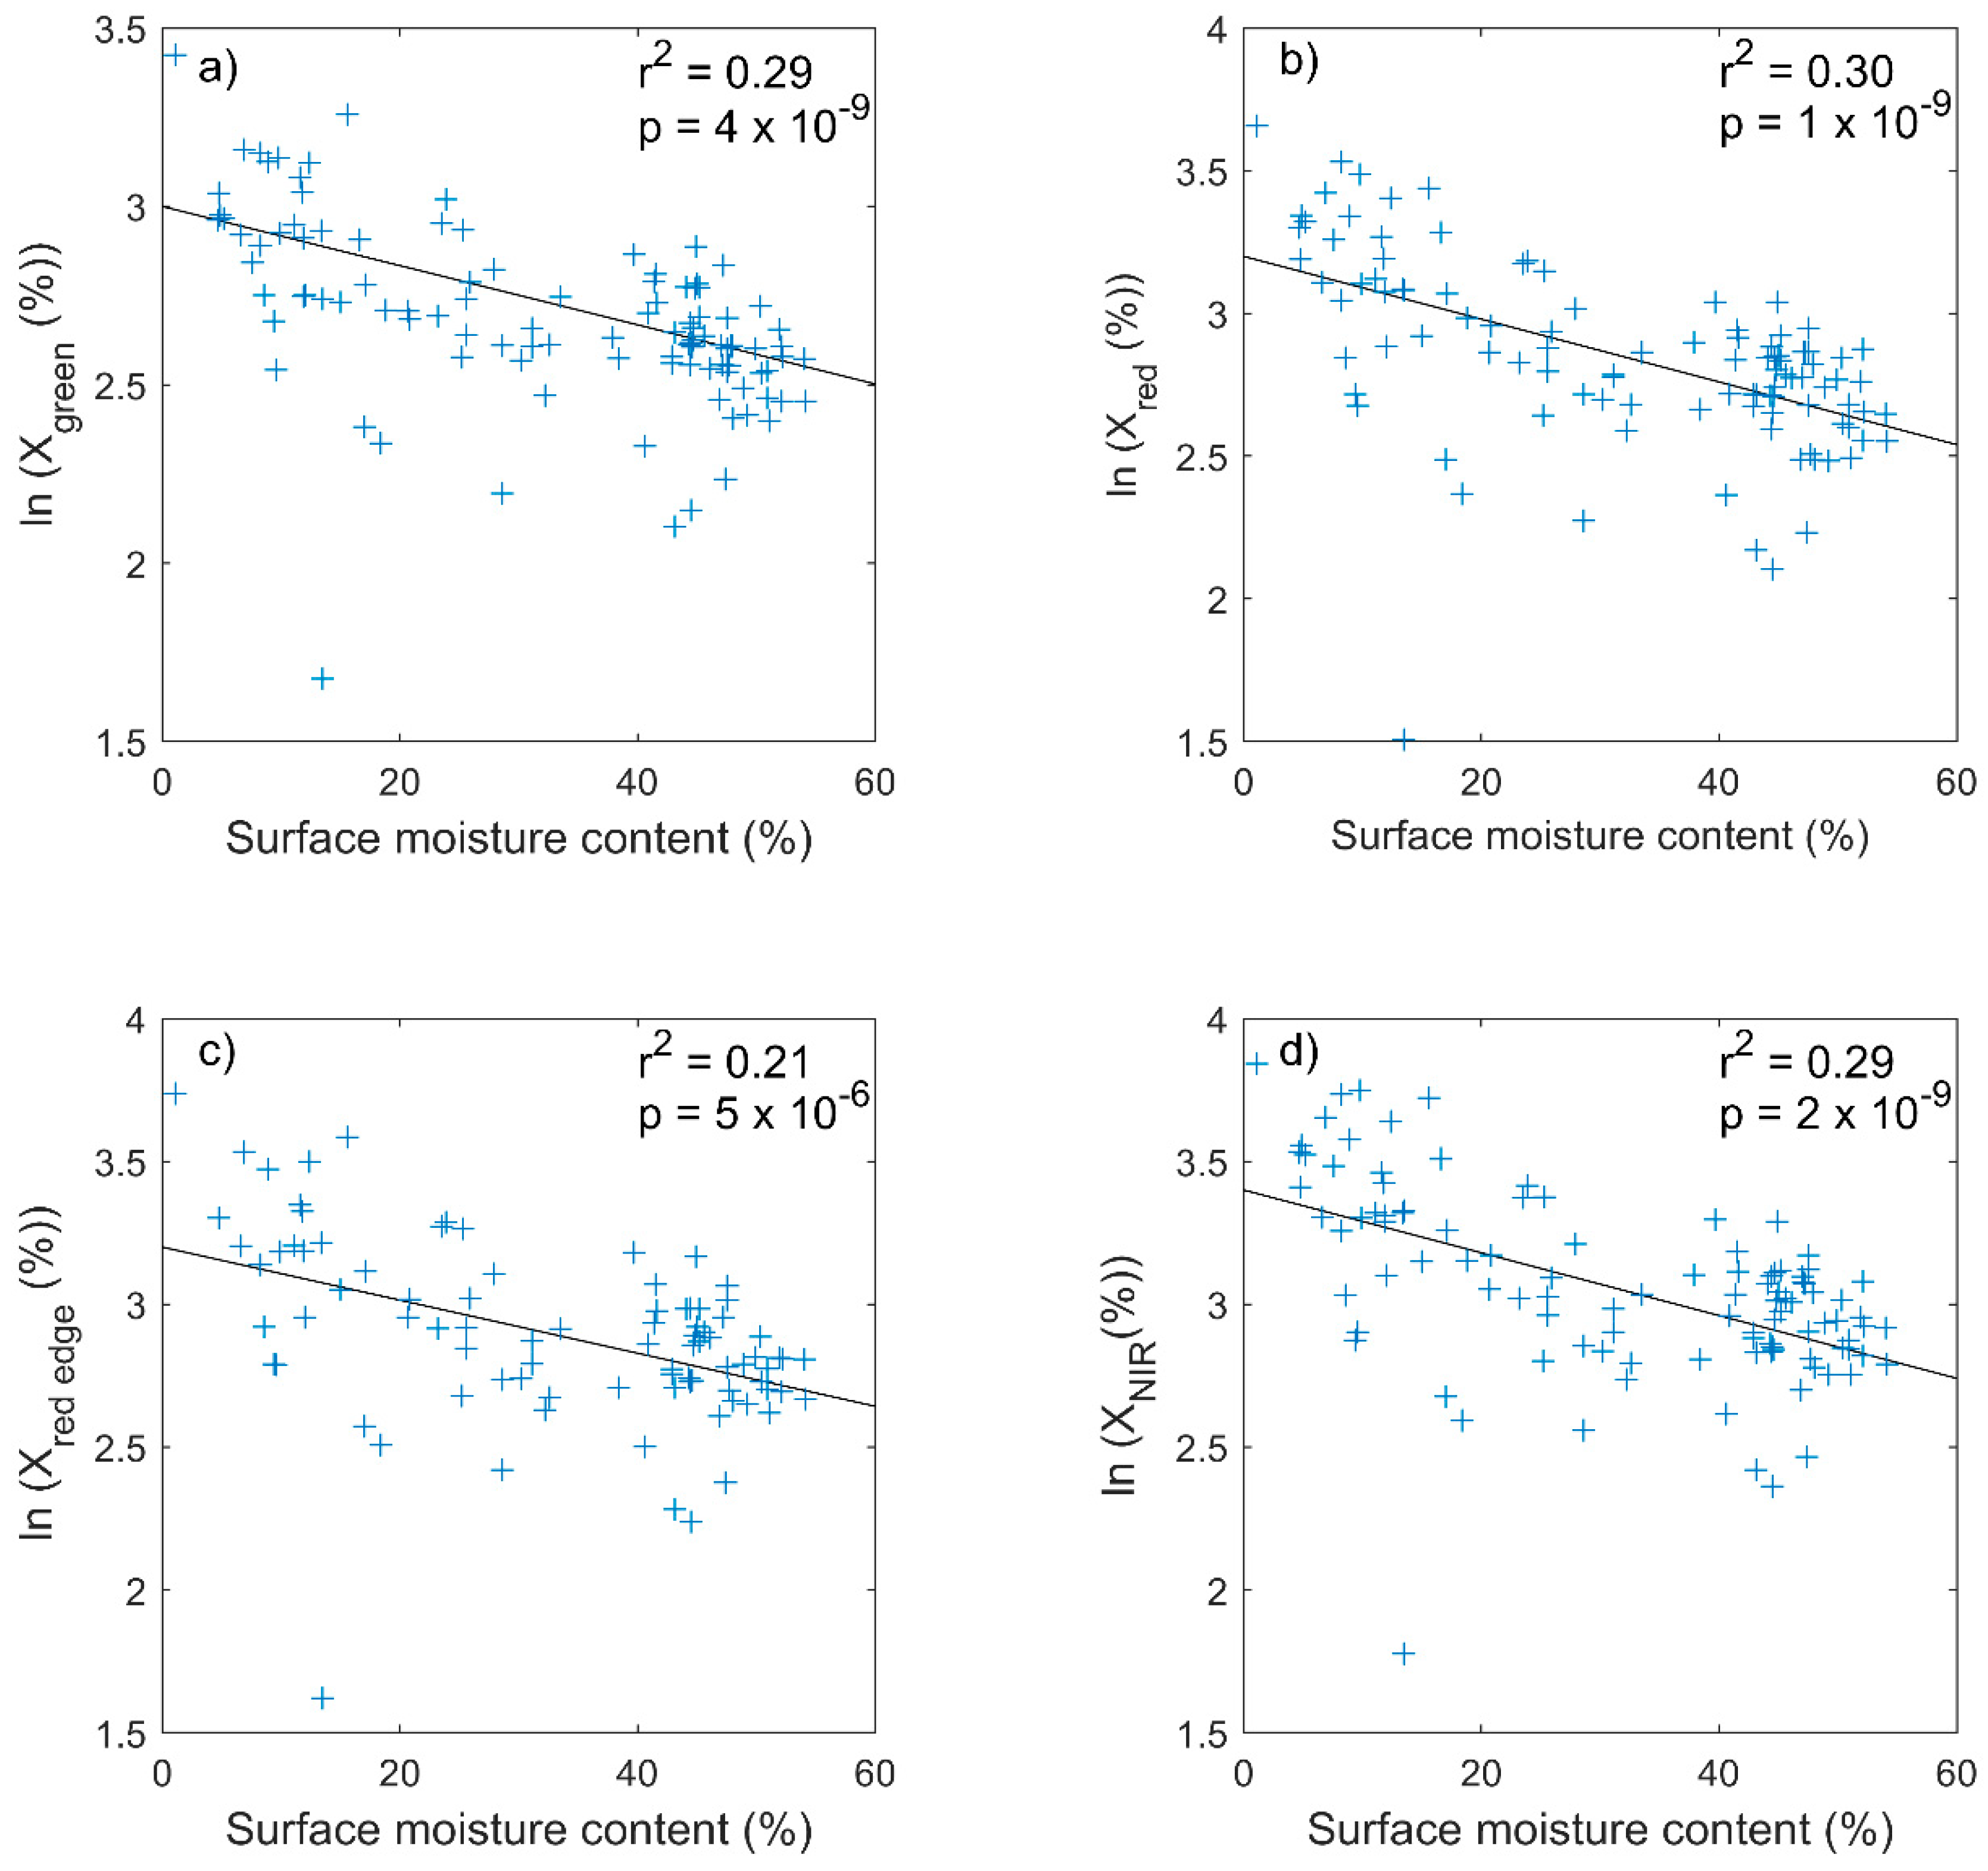
The positive correlation between grain size and multispectral reflectance has been noted by other researchers using satellite remote sensing [
26] and this relationship has been used to map grain size. Future work will conduct more flights and analyze more point sediment samples to widen the grain size parameter space and endeavor to develop similar tools for use with UAS sensors.
Despite the statistically significant positive correlation between multispectral reflectance and values of d50, there was a large amount of scatter in the data. A more statistically likely relationship was noted between multispectral reflectance and surface moisture content. Surface moisture and grain size are related because areas of coarser sediment will typically dewater faster and hence have lower surface moisture values than areas of finer sediment. Over the intertidal area, this is complicated by variation in dewatering affected by elevation and tidal inundation, as well as spatially varying groundwater influences. It is possible that by including elevation maps and time of flight from previous high tide, some correction could be made for this complicating factor. Future work is planned to address this aspect.
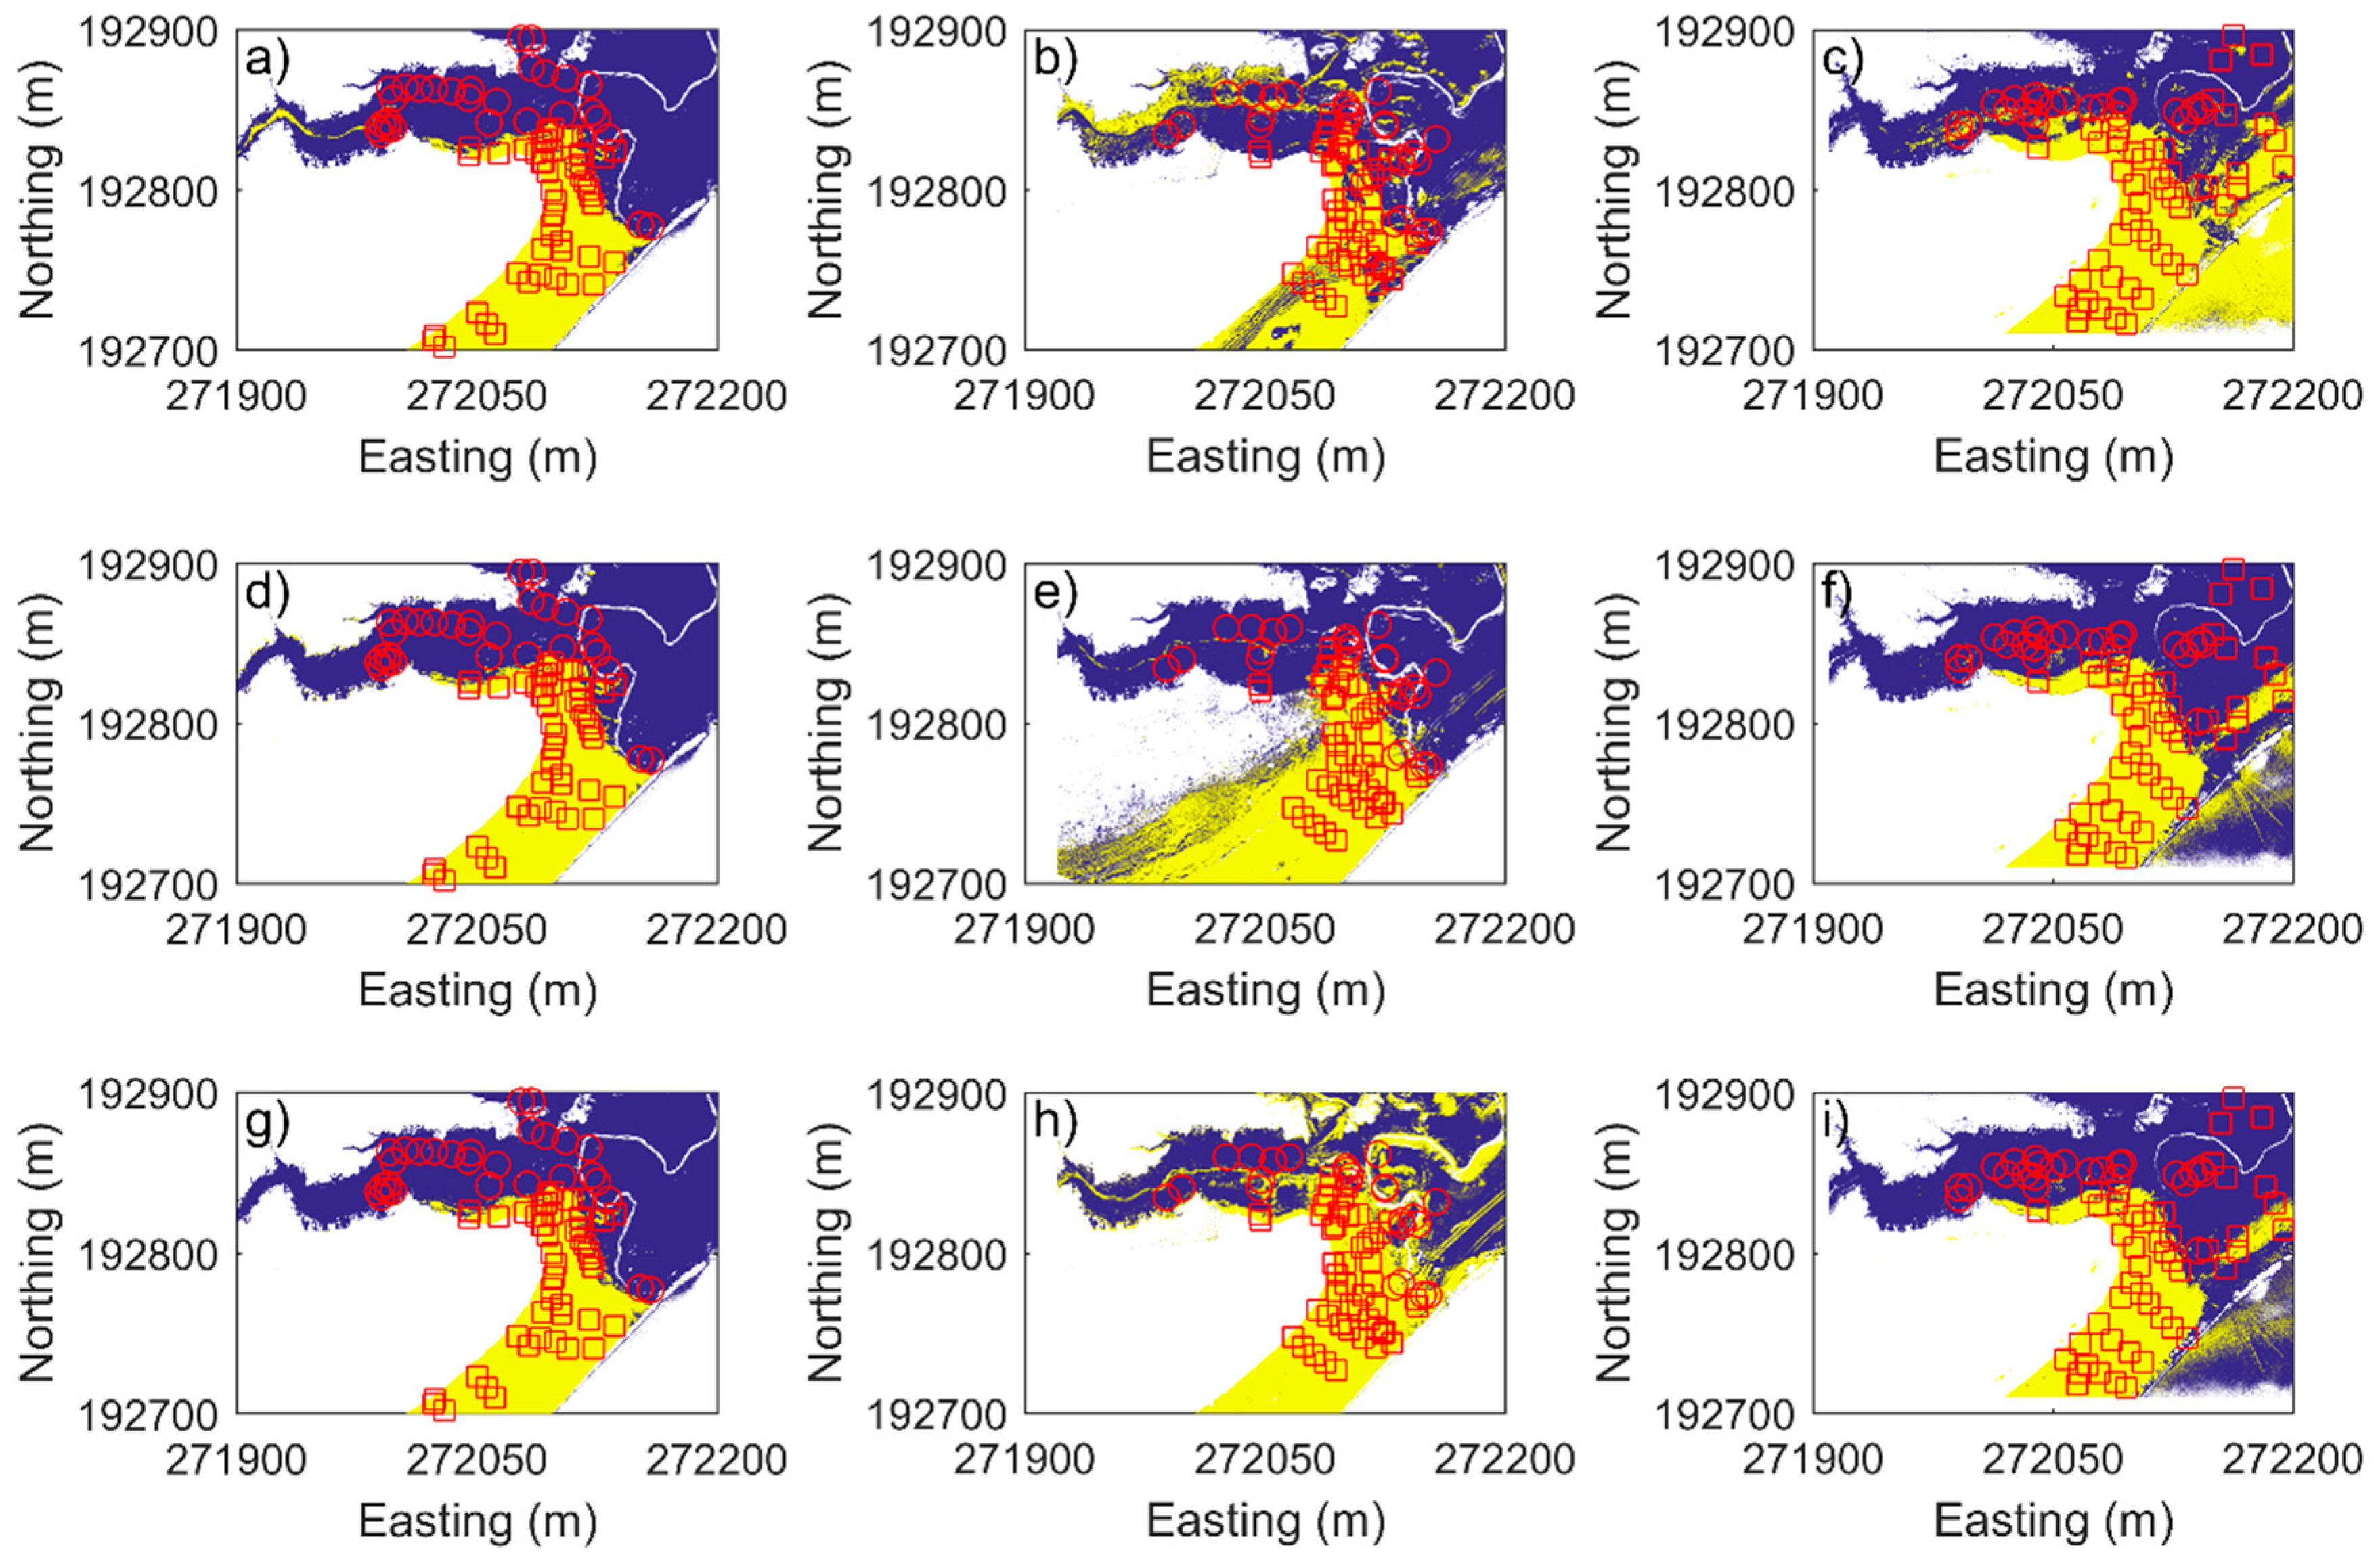
Very similar results were found for all sets of data and classification routines. This is partially due to the data screening prior to classification where both vegetation and open water were removed. The motivation for applying this screening process was that without the screening the unsupervised k-means routine failed to split between sediment types, instead regularly creating one class that was predominantly vegetation and one class predominantly bare sediment. Increasing number of classes did not improve classifications. Therefore, it was deemed a fairer test if only bare sediment was passed to the classification routines. Constraining the classification problem in this way was fast, automatable and transparent (relying on well know indices); therefore, it is not seen as a limitation of the study. Should classification of these regions be of interest, a multi-stage classification could be used to classify (rather than remove) regions of vegetation and water using the method described prior to the sediment classification.
The technique could easily be applied to other broad scale classes such as bedrock and gravel and vegetated intertidal areas can be identified using the NDVI. Future work will consider splitting into more detailed sediment classes. Results from the Neath Estuary where the “mud” portion was actually a mud–sand mixture suggest that there are sufficient differences in UAS measured parameters that this should be feasible. Initial tests suggested that an unsupervised classification of greater than two sediment types did not work well. Therefore, it is likely that performance of classification into multiple classes will depend on ease of defining suitable training datasets.
The multispectral and RGB sensor used, the Sequoia, has a global shutter for the four multispectral sensors but a rolling shutter for the RGB sensor. A rolling shutter leads to inaccuracies in the images when used on a moving platform such as a drone because the sensor will move in between lines of pixels being exposed by the shutter. While the processing software, Pix4D, has a correction algorithm for rolling shutter cameras and errors are minimized by use of GCPs, some errors will remain. In this study, careful comparison of RGB, multispectral and thermal orthomosaics were undertaken to ensure accurate coreferencing away from GCPs and no obvious errors were noted. Therefore, it is believed that the orthomosaics are suitable accurate for the purposes of the study. The DSMs are less likely to be accurate and the product literature cautions against relying on DSMs from the rolling shutter RGB. In this study elevation is only used to screen the supratidal area and little error in this application was noted. Other similar sensors, such as the MicaSense RedEdge-M, are available with global shutter RGB cameras, which would remove this uncertainty. Alternatively, a subsequent flight with a global shutter RGB camera would provide more accurate color information.
Remote sensing of intertidal sediment has several benefits over ground-based sampling, typically undertaken on foot. Most importantly, from a logistical perspective, is the reduction in health and safety risk associated with working in unconsolidated sediment close to the low tide line; additionally, time in the field can be significantly reduced which may reduce survey cost. Spatial resolution is much higher which avoids errors in classification caused by interpolation between a sparse network of samples.
Deployment of UAS fit well within the context of other remote sensing options such as airborne or satellite remote sensing. The technique is much lower cost than methods using manned aircraft which facilitates multiple repeat surveys, as required to capture seasonal change or the rapid adjustment to new coastal developments. The higher pixel resolution, compared to both satellite and manned aircraft solutions, mean smaller scale change could be identified. Additionally, the commercial availability of monitoring solutions is attractive and would make uptake by researchers, industry, governmental and nongovernmental agencies easier. However, the set-up of commercially available sensors is relatively inflexible. Past research has shown that reflectance in the short and medium wave infrared bands is more useful for sediment classification, and that hyperspectral sensors can accurately map geological properties of rock, e.g., [
51]. Recent studies have mounted hyperspectral cameras to drones for a range of purposes [
52,
53]. Such approaches would likely provide better results; however, the sensors are expensive [
52] and flight duration of drones suitable to mount the cameras is low [
52,
53], reducing extent of coverage.
Previous studies identified thermal infrared camera as having good potential for identifying regions of sand and mud [
28]. Thermal cameras did not perform well in this study, however, which highlights the importance of other environmental factors in such discrimination. Areas where there is greater or more uniform solar heating may well show better success.
All UAS use is constrained by technical and regulatory factors. UAS regulations are defined by national aviation authorities. In the UK, regulations mean UAS must be flown within visual line of sight which limits distance of the UAS to 500 m from the operator; this distance can be extended by application for additional permissions, but they are not always granted. Another key regulatory factor is the 150 m separation distance from ”congested areas” which include any area regularly used for commercial, industrial or recreational purposes. Technical factors include takeoff and landing requirements and weather limitations. Fixed wing UAS such as used in this study can cover larger areas than an octocopter-type UAS, but require suitable landing areas such flat grass. In this study, sand areas of the beach were typically used, however this did constrain choice of suitable test sites. Octocopters can take off and land vertically and hence landing areas are not a restriction on site selection. In addition, weather conditions including wind speed, visibility and heavy rain must be considered. An analysis of 10 years of weather data from a station at Mumbles close to the Neath Estuary site showed that conditions were only suitable for flying 40% of the time.
5. Conclusions
This contribution explores the use of UASs to map intertidal sediment type. Flights were conducted with both a thermal infrared camera and a multispectral camera that measured red, green, red edge and near-infrared reflectance as well as RGB color. Use of the thermal camera for sediment mapping was discounted in a northern European context because preliminary study showed that other environmental factors controlled the temperature variation over the intertidal rather than sediment type. Relationships between both color and multispectral reflectance against surface moisture were identified. Importantly, there was also a positive correlation between median grain size and multispectral reflectance, with the best correlation using the near-infrared reflectance (r = 0.6, 99% significance).
Three classification routines (k-means, artificial neural networks and random forests) were tested with nine sets of UAS measured data to broadly discriminate between sand and mud in the intertidal. Prior to classification, the orthomosaics were screened for vegetation and open water, which constrained the problem. Inclusion of multispectral channels improved results over classifications just using color data. The optimum combination was an artificial neural network approach using HSV color and NIR reflectance, where over the 5 flights Youden’s j-index varied between 0.6 and 0.97, (where j = 1 corresponds to perfect classification). This approach was deemed very successful and it shows that UASs are a suitable tool for remote sensing of intertidal sediment.


