Evaluation of Spatial Generalization Characteristics of a Robust Classifier as Applied to Coral Reef Habitats in Remote Islands of the Pacific Ocean


Abstract
1. Introduction
2. Materials and Methods
2.1. Data Used
2.2. Sites
2.2.1. Palmyra Atoll
2.2.2. Kingman Reef
2.2.3. Baker Island Atoll
2.2.4. Howland Island
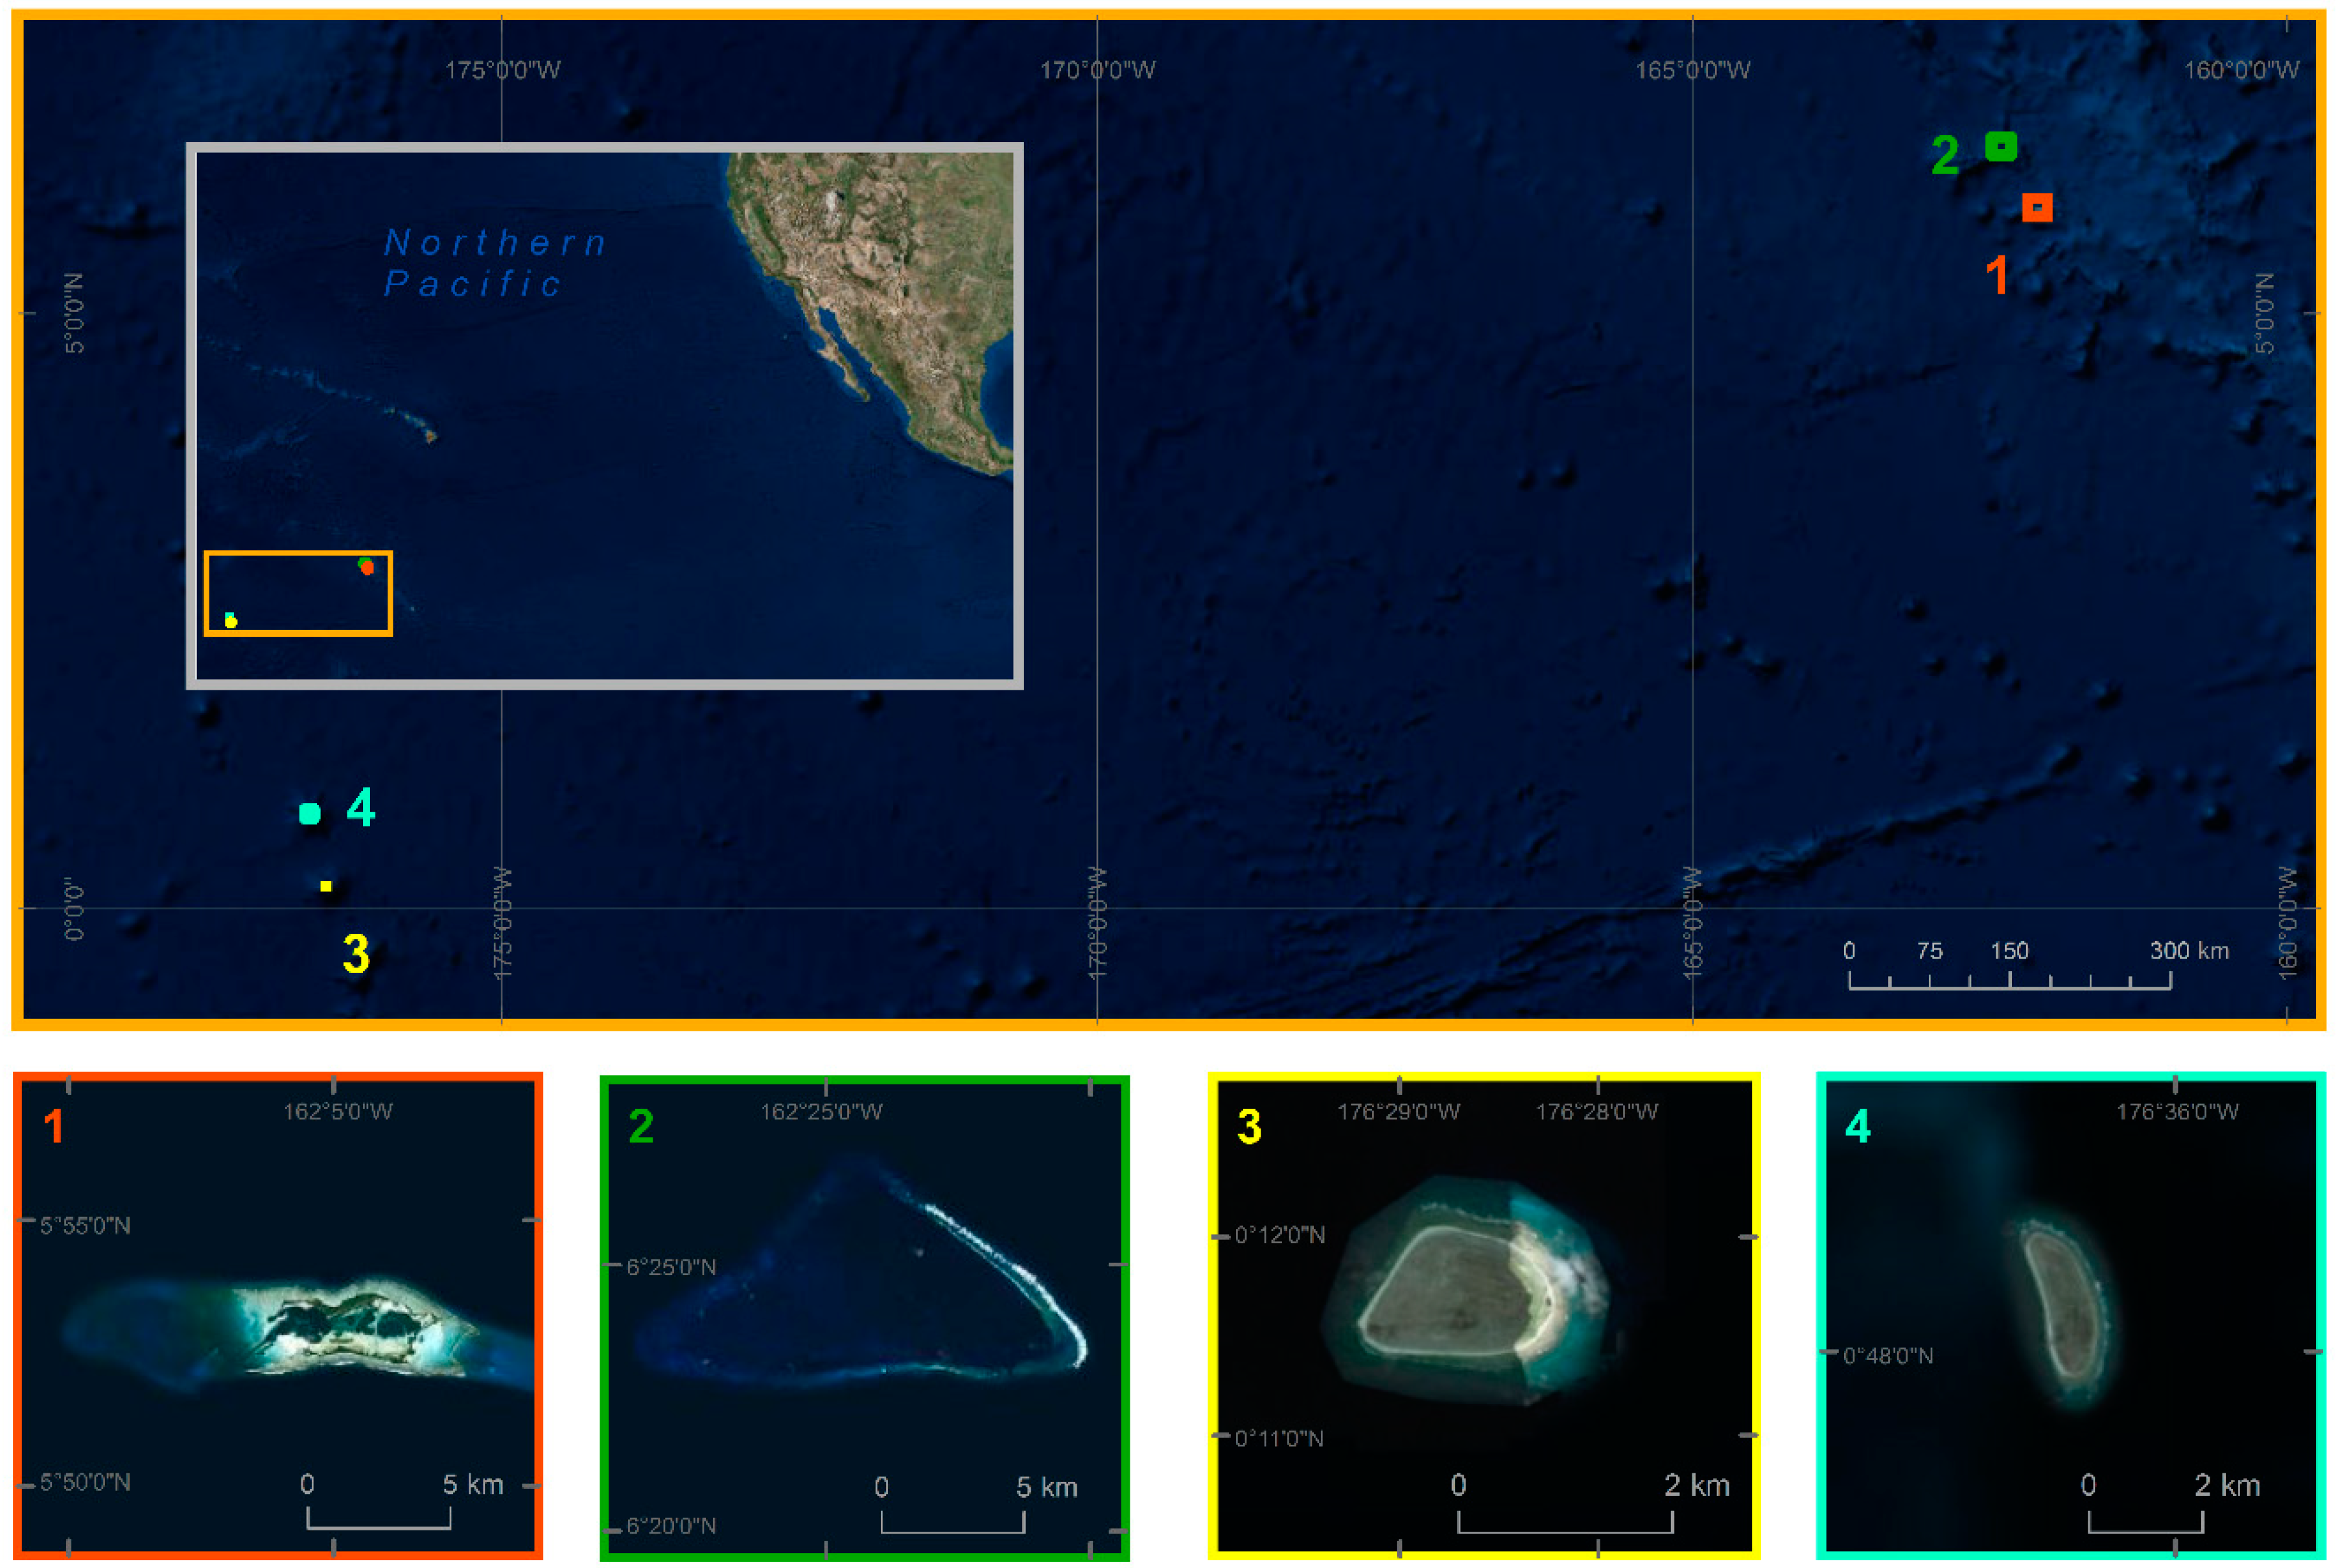
2.3. Methodology
2.3.1. Cloud and Quality Mask
2.3.2. Water Mask
2.3.3. Atmospheric Correction
2.3.4. Water Column Correction
3. Results
3.1. Generalization Performance by Site
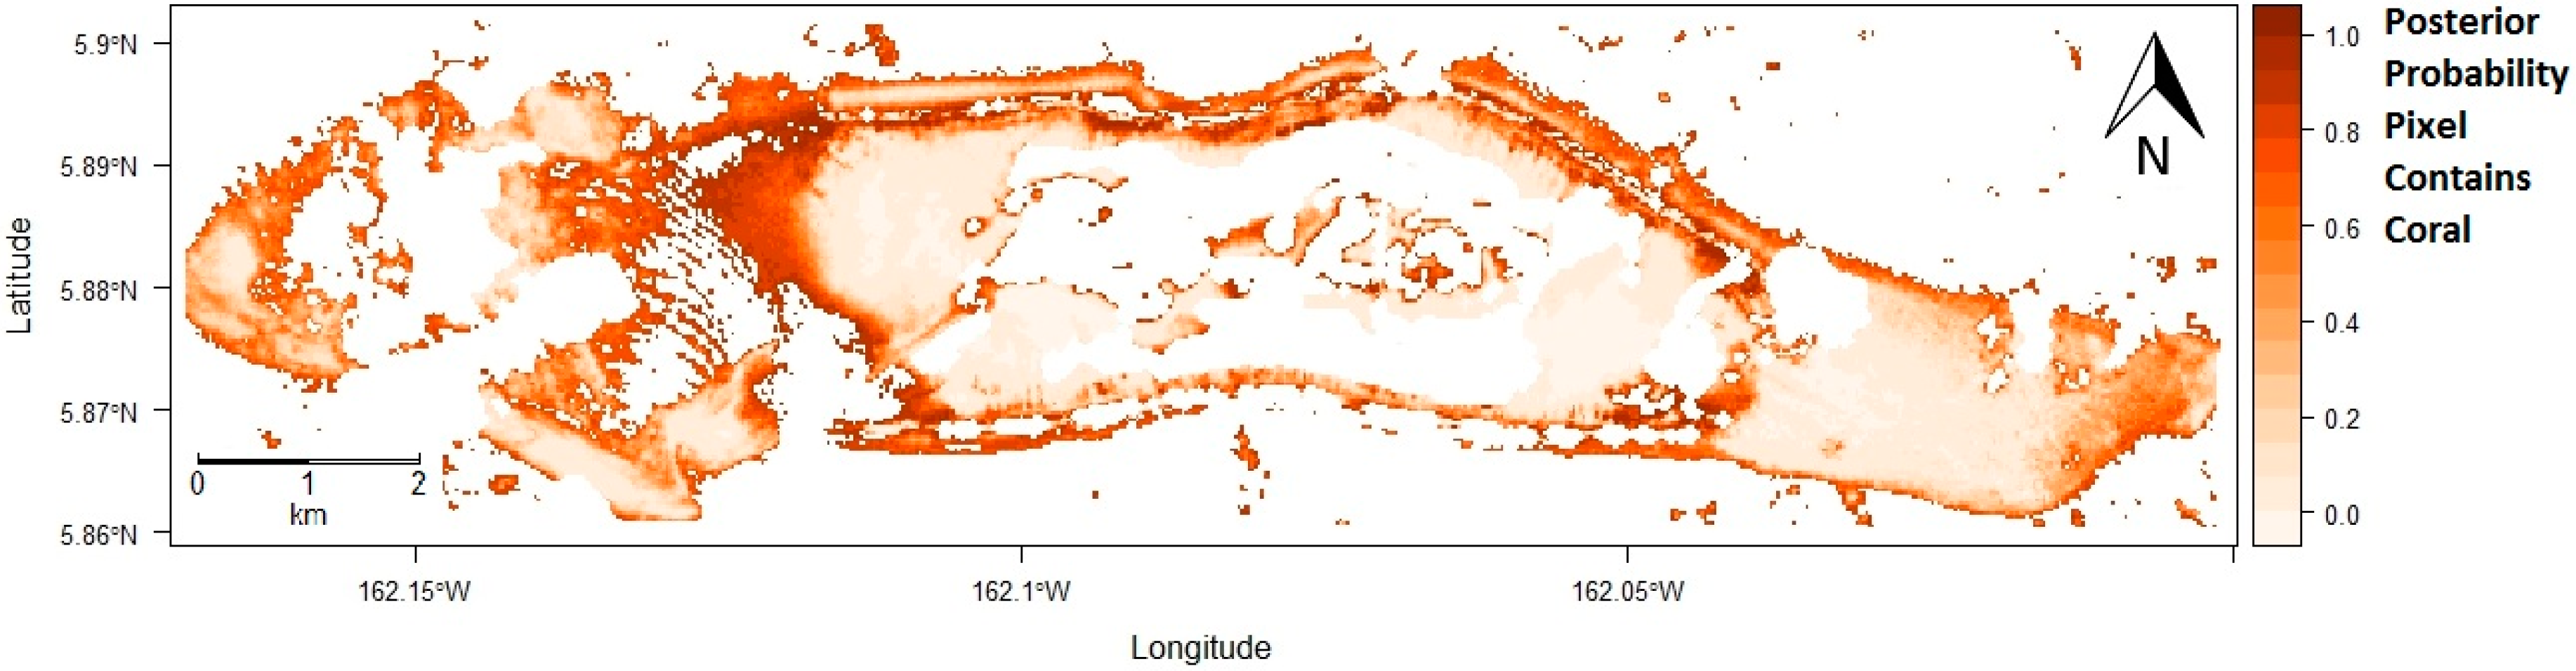
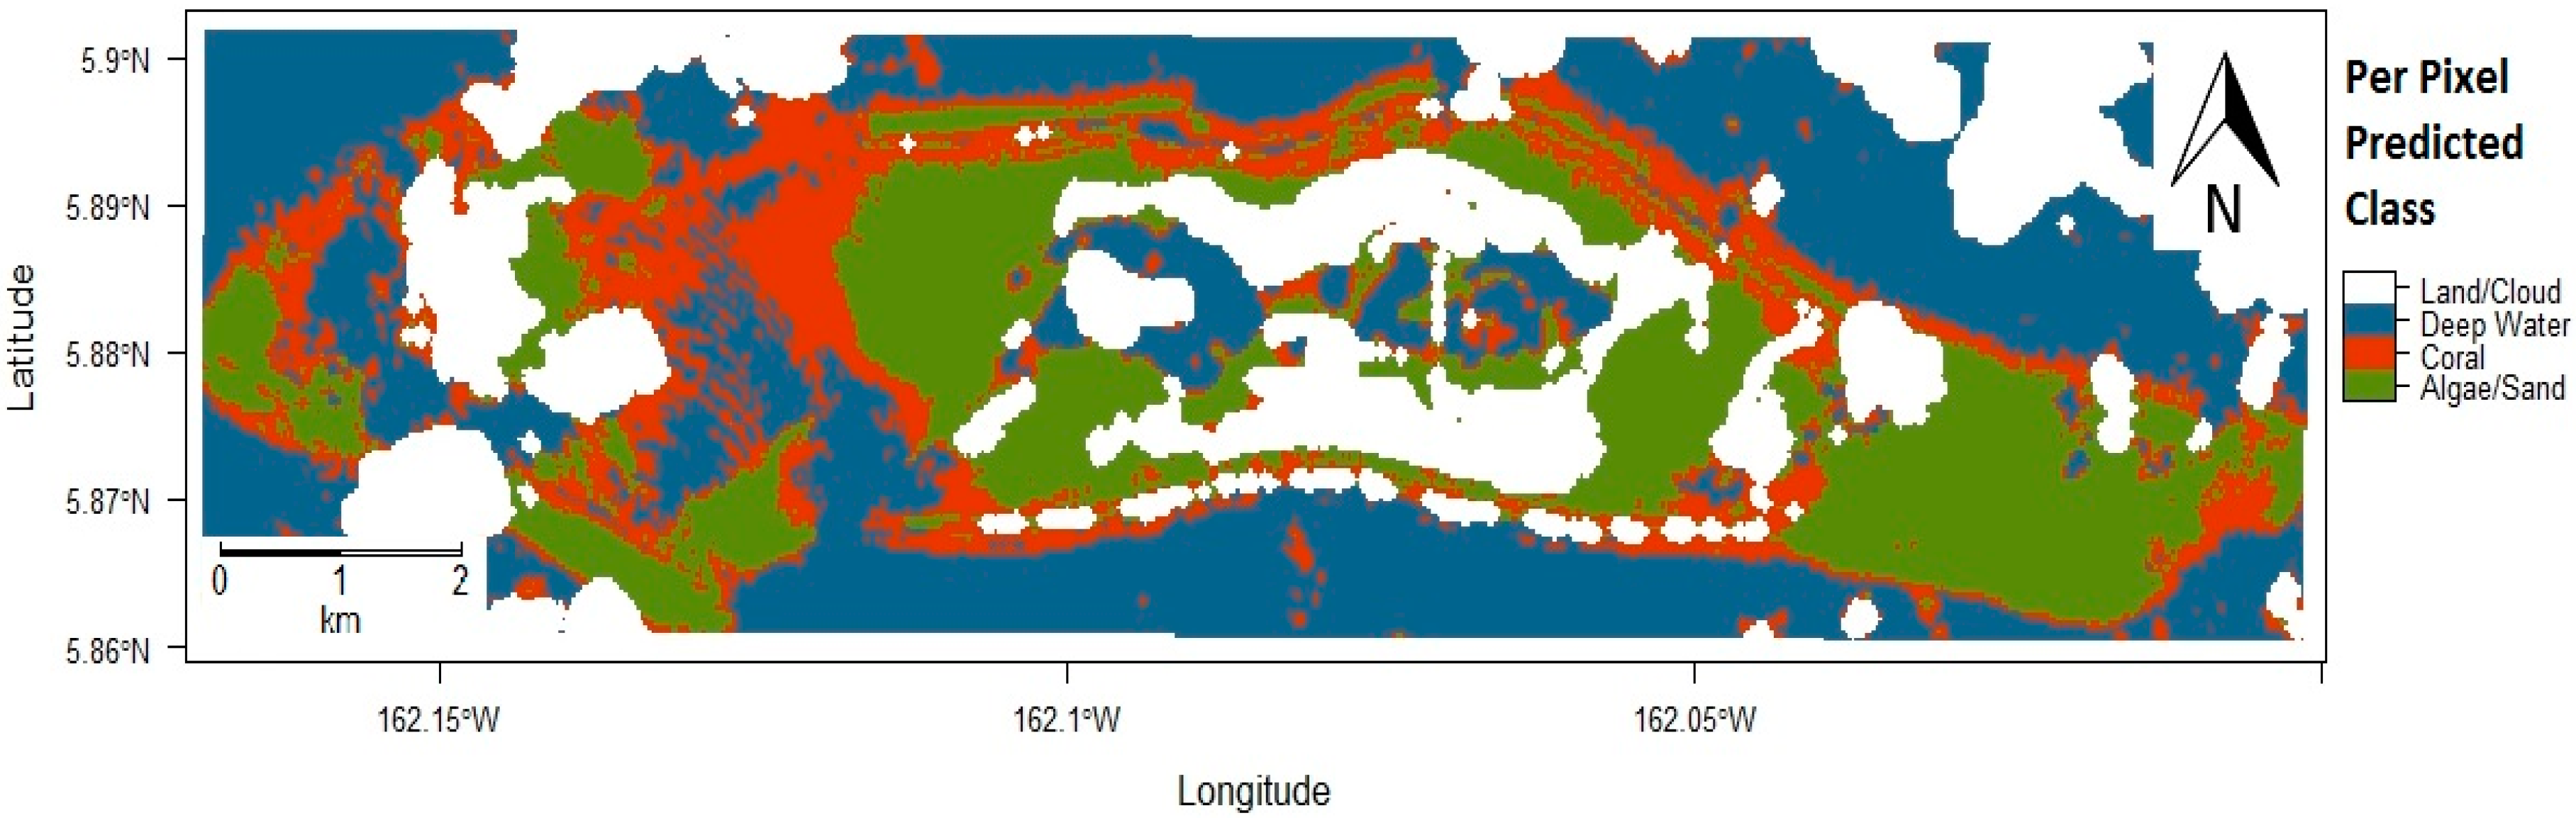
3.1.1. Palmyra Atoll
3.1.2. Kingman Reef
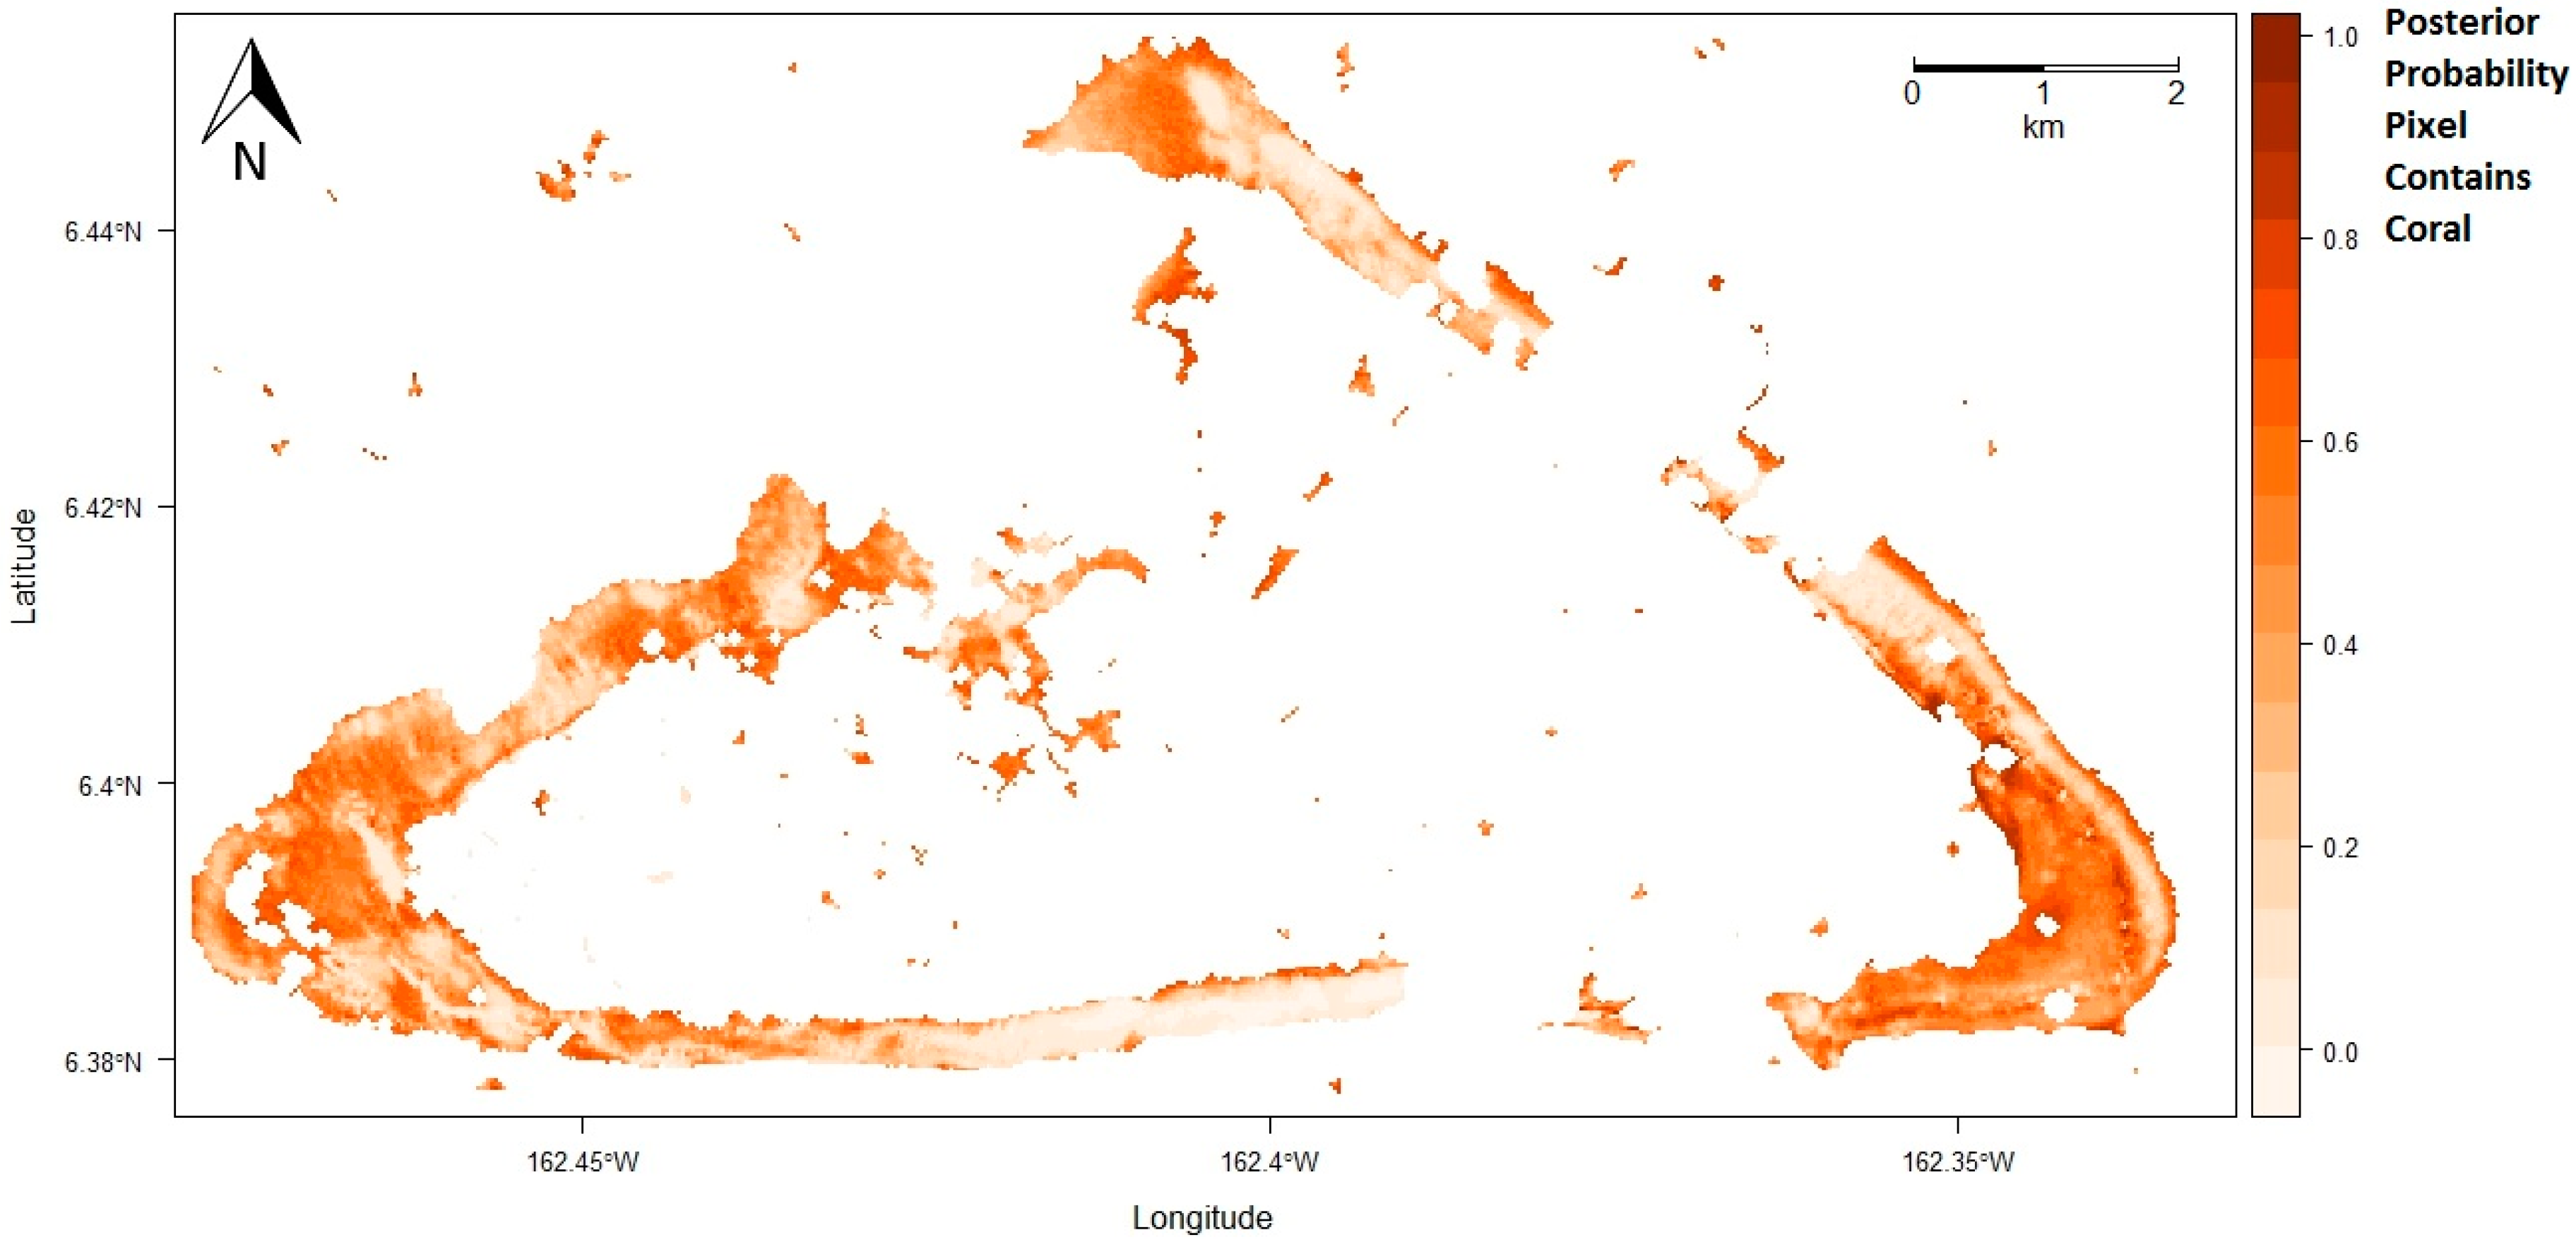
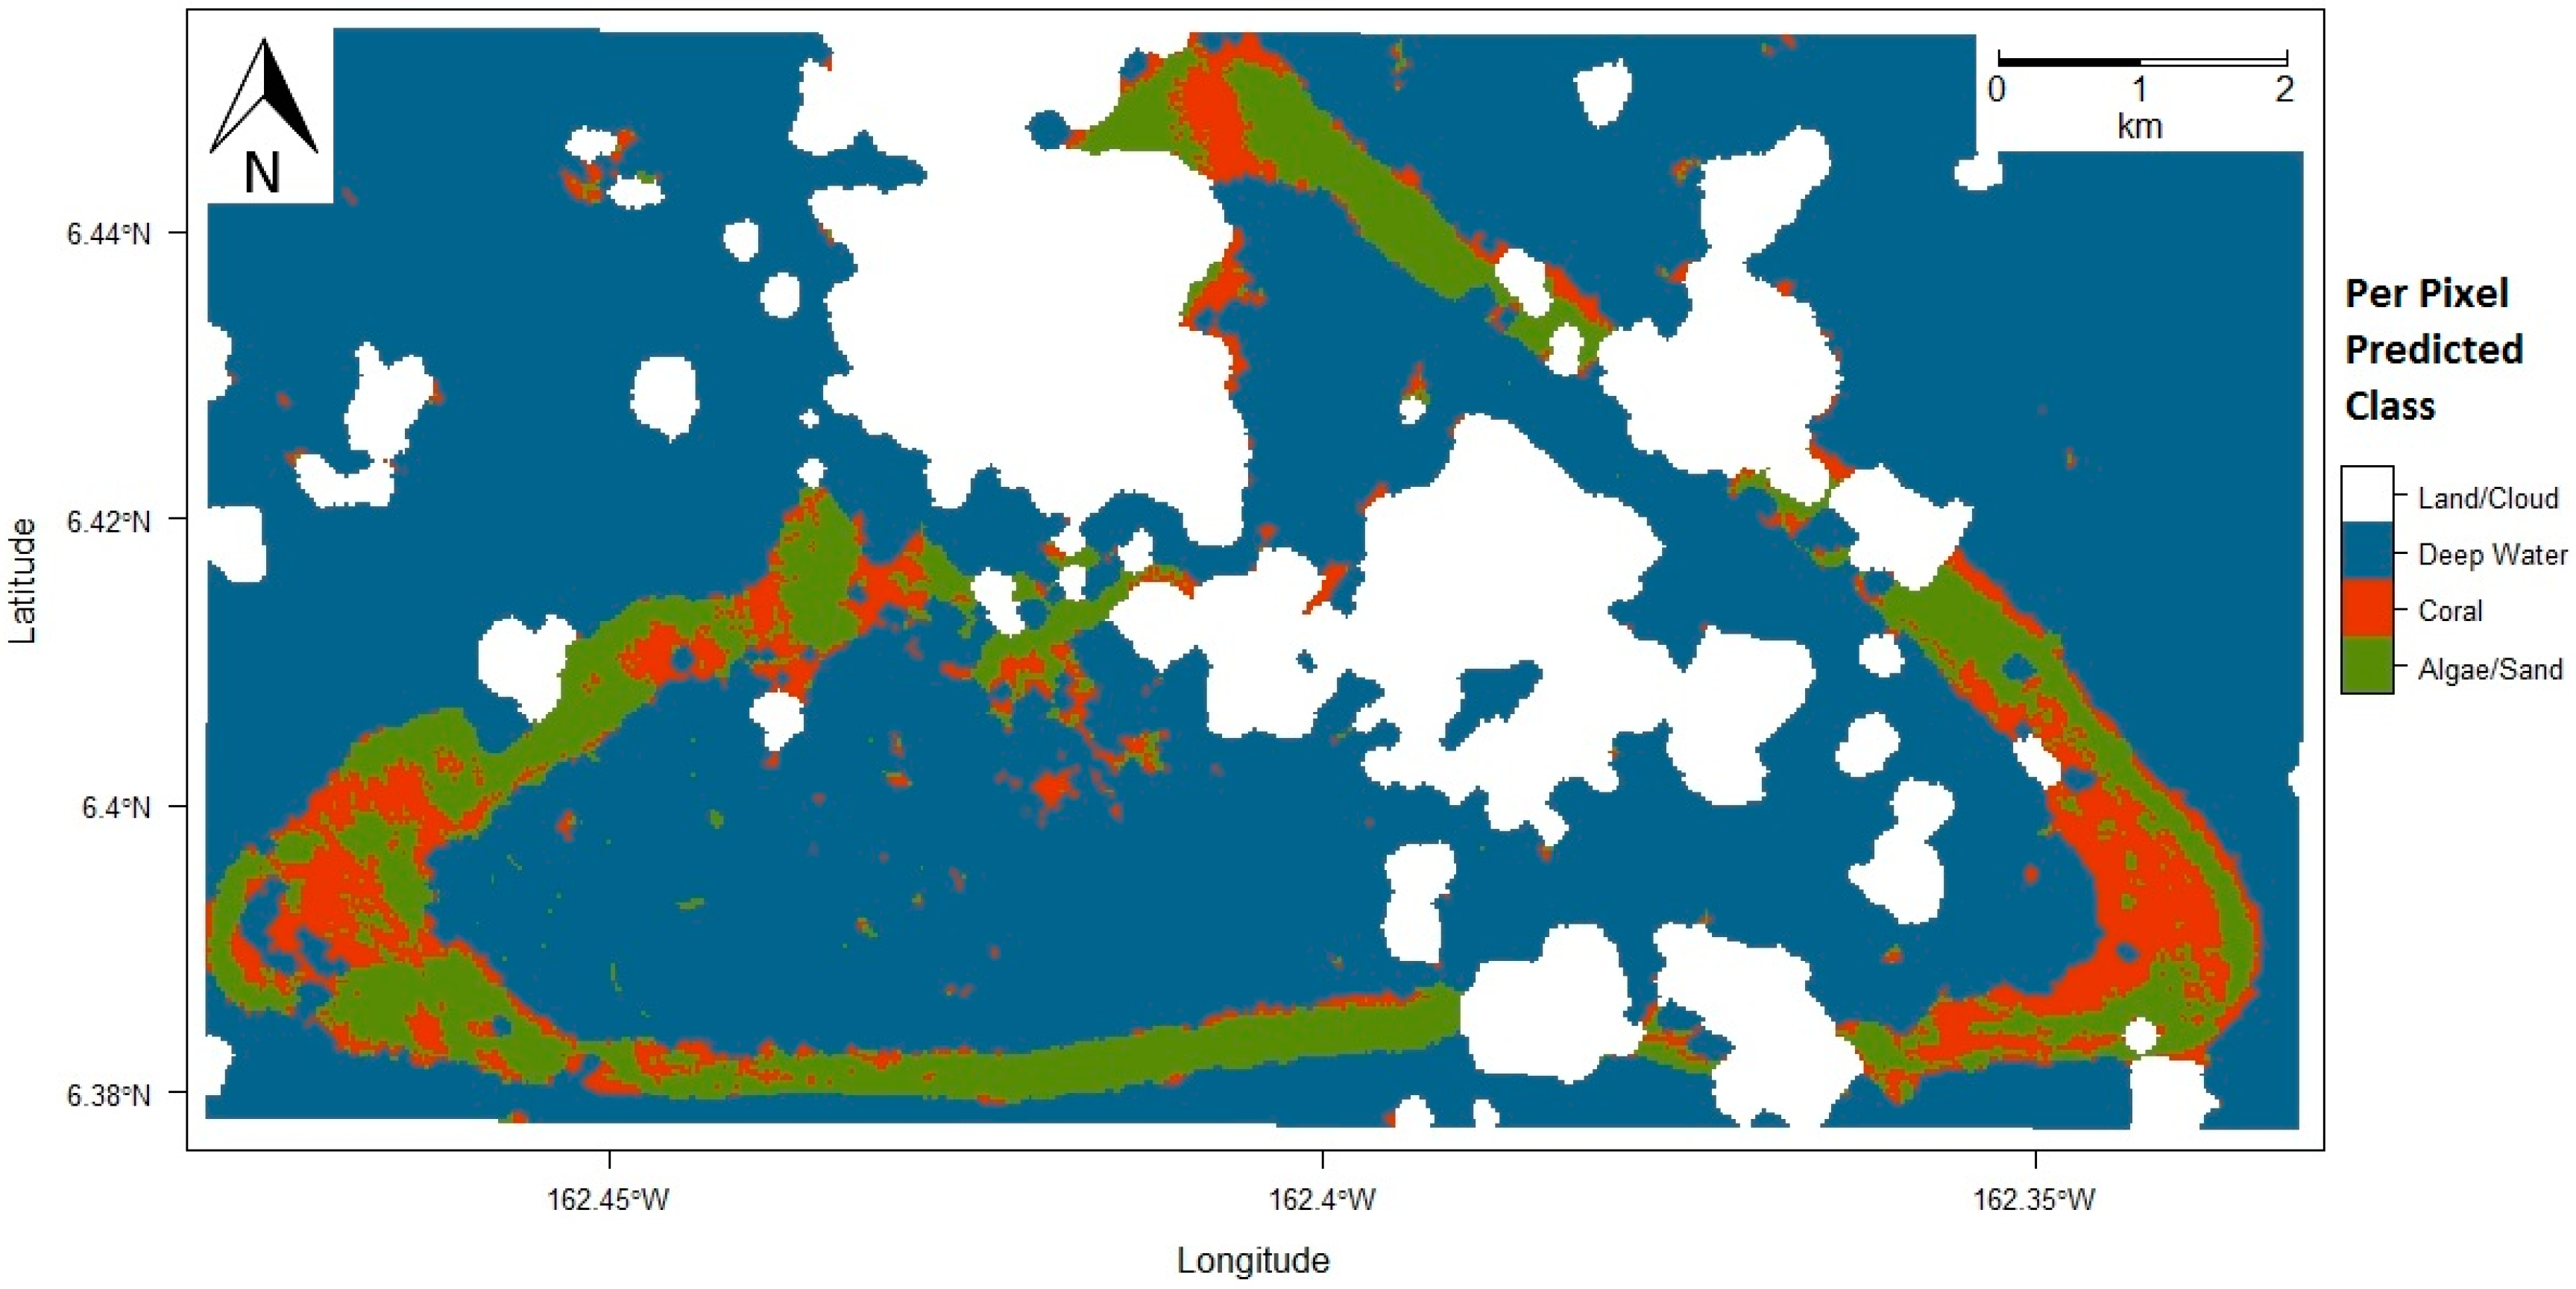
3.1.3. Baker Island Atoll
3.1.4. Howland Island
3.2. Quantitative Assessment of Site Specific Generalization
3.3. Robust Combined Model
4. Discussion
4.1. Spectral Signature Generalization Properties for Coral Reef Classification
4.2. Methodology Benefits and Challenges
4.3. Future Research
5. Conclusions
Author Contributions
Funding
Acknowledgments
Conflicts of Interest
References
- Jessen, C.; Wild, C. Herbivory Effects on Benthic Algal Composition and Growth on a Coral Reef Flat in the Egyptian Red Sea. Mar. Ecol. Prog. Ser. 2013, 476, 9–21. [Google Scholar] [CrossRef]
- Aronson, R.B.; Precht, W.F. White-Band Disease and the Changing Face of Caribbean Coral Reefs. Hydrobiologia 2001, 460, 25–38. [Google Scholar] [CrossRef]
- Glynn, P.W. Coral Reef Bleaching: Ecological Perspectives. Coral Reefs 1993, 12, 1–17. [Google Scholar] [CrossRef]
- McManus, J.W.; Reyes, R.B., Jr.; Nañola, C.L., Jr. Effects of Some Destructive Fishing Methods on Coral Cover and Potential Rates of Recovery. Environ. Manag. 1997, 21, 69–78. [Google Scholar] [CrossRef]
- Pennisi, E. Survey confirms coral reefs are in peril. Science 2002, 297, 1622b–1623b. [Google Scholar] [CrossRef] [PubMed]
- Burke, L.; Reytar, K.; Spalding, M.; Perry, A. Reefs at Risk Revisited; World Resources Institute: Washington, DC, USA, 2011; p. 114. [Google Scholar]
- Mora, C.A. A clear human footprint in the coral reefs of the Caribbean. Proc. R. Soc. Lond. B Biol. Sci. 2008, 275, 767–773. [Google Scholar] [CrossRef] [PubMed]
- Hoegh-Guldberg, O.; Mumby, J.P.; Hooten, J.A.; Steneck, S.R.; Greenfield, P.; Gomez, E. Coral reefs under rapid climate change and ocean acidification. Science 2007, 281, 1737–1742. [Google Scholar] [CrossRef] [PubMed]
- Pandolfi, J.M.; Bradbury, R.H.; Sala, E.; Hughes, T.P.; Bjorndal, K.A.; Cooke, R.G.; McArdle, D.; McClenachan, L.; Newman, M.J.H.; Paredes, G.; et al. Global trajectories of the long-term decline of coral reef ecosystems. Science 2003, 201, 955–958. [Google Scholar] [CrossRef] [PubMed]
- Hedley, J.C.; Roelfsema, I.; Chollett, A.; Harborne, S.; Heron, S.; Weeks, W.; Skirving, A.; Strong, C.; Eakin, T.; Christensen, V.; et al. Remote sensing of coral reefs for monitoring and management: A review. Remote Sens. 2016, 8, 118. [Google Scholar] [CrossRef]
- Wilkinson, C. Status of Coral Reefs of the World; Australian Institute of Marine Science: Townsville, Australia, 2004; p. 301.
- Wilkinson, C. Status of Coral Reefs of the World; Global Coral Reef Monitoring Network and Reef and Rainforest Research Center: Townsville, Australia, 2008; p. 296. [Google Scholar]
- Gardner, T.A.; Cote, I.M.; Gill, J.A.; Grant, A.; Watkinson, A.R. Long-term region-wide declines in Caribbean corals. Science 2003, 301, 958–960. [Google Scholar] [CrossRef] [PubMed]
- Bruno, J.F.; Selig, E.R. Regional decline of coral cover in the Indo-Pacific: Timing, extent, and subregional comparisons. PLoS ONE 2007, 2, e711. [Google Scholar] [CrossRef] [PubMed]
- Jackson, J.B.C.; Donovan, M.K.; Cramer, K.L.; Lam, V.V. Status and Trends of Caribbean Coral Reefs: 1970–2012. In Global Coral Reef Monitoring Network; IUCN Gland: Gland, Switzerland, 2014. [Google Scholar]
- Planetary Coral Reef Foundation Overview Organization (PCRF). Mapping Coral Reefs from Space. 2002. Available online: http://www.pcrf.org/ (accessed on 15 May 2018).
- Atkinson, J.M.; Lucey, P.G.; Taylor, G.J.; Porter, J.; Dollar, S.; Andre, S. CRESPO: Coral Reef Ecosystem Spectro-Photometric Observatory, Concept Study Report to the University Earth System Science Program National Aeronautics and Space Administration; University of Hawaii: Honolulu, HI, USA, 2001. [Google Scholar]
- Hochberg, E.J.; Atkinson, M.J. Capabilities of Remote Sensors to Classify Coral, Algae, and Sand as Pure and Mixed Spectra. Remote Sens. Environ. 2003, 85, 174–189. [Google Scholar] [CrossRef]
- Capolsini, P.; Andréfouët, S.; Rion, C.; Payri, C. A comparison of Landsat ETM+, SPOT HRV, IKONOS, ASTER, and airborne MASTER data for coral reef habitat mapping in South Pacific islands. Can. J. Remote Sens. 2007, 29, 187–200. [Google Scholar] [CrossRef]
- Kobryn, H.T.; Wouters, K.; Beckley, L.E.; Heege, T. Ningaloo reef: Shallow marine habitats mapped using a hyperspectral sensor. PLoS ONE 2013, 8, e70105. [Google Scholar] [CrossRef] [PubMed]
- Phinn, S.R.; Hochberg, E.; Roelfsema, C.M. Airborne photography, multispectral and hyperspectral remote sensing on coral reefs. In Coral Reef Remote Sensing; Goodman, J.A., Phinn, S.R., Purkis, S., Eds.; Springer: Berlin, Germany, 2013; pp. 3–25. [Google Scholar]
- Roelfsema, C.M.; Lyons, M.; Kovacs, E.M.; Maxwell, P.; Saunders, M.I.; Samper-Villarreal, J.; Phinn, S.R. Multi-temporal mapping of seagrass cover, species and biomass: A semi-automated object based image analysis approach. Remote Sens. Environ. 2014, 150, 172–187. [Google Scholar] [CrossRef]
- Hedley, J.D.; Roelfsema, C.; Brando, V.; Giardino, C.; Kutser, T.; Phinn, S.; Mumby, P.J.; Barrilero, O.; Laporte, J.; Koetz, B. Coral reef applications of Sentinel-2: Coverage, characteristics, bathymetry and benthic mapping with comparison to Landsat 8. Remote Sens. Environ. 2018, 216, 598–614. [Google Scholar] [CrossRef]
- Traganos, D.; Aggarwal, B.; Poursanidis, D.; Topouzelis, K.; Chrysoulakis, N.; Reinartz, P. Towards Global-Scale Seagrass Mapping and Monitoring Using Sentinel-2 on Google Earth Engine: The Case Study of the Aegean and Ionian Seas. Remote Sens. 2018, 10, 1227. [Google Scholar] [CrossRef]
- Traganos, D.; Poursanidis, D.; Aggarwal, B.; Chrysoulakis, N.; Reinartz, P. Estimating Satellite-Derived Bathymetry (SDB) with the Google Earth Engine and Sentinel-2. Remote Sens. 2018, 10, 859. [Google Scholar] [CrossRef]
- Kutser, T.; Dekker, A.G.; Skirving, W. Modeling Spectral Discrimination of Great Barrier Reef Benthic Communities by Remote Sensing Instruments. Limnol. Oceanogr. 2003, 48, 497–510. [Google Scholar] [CrossRef]
- Mumby, P.J.; Green, E.P.; Edwards, A.J.; Clark, C.D. The cost-effectiveness of remote sensing for tropical coastal resources assessment and management. J. Environ. Manag. 1999, 55, 157–166. [Google Scholar] [CrossRef]
- Yamano, H. Multispectral Applications. In Coral Reef Remote Sensing: A Guide for Multi-Level Sensing Mapping and Assessment; Goodman, J., Purkis, S., Phinn, S.R., Eds.; Springer: Berlin, Germany, 2013; pp. 51–78. [Google Scholar]
- El-Askary, H.; El-Mawla, S.H.A.; Li, J.; El-Hattab, M.M.; El-Raey, M. Change detection of coral reef habitat using Landsat-5 TM, Landsat 7 ETM+ and Landsat 8 OLI data in the Red Sea. Int. J. Remote Sens. 2014, 35, 2327–2346. [Google Scholar]
- Matsunaga, T.; Hoyano, A.; Mizukami, Y. Monitoring of Coral Reefs on Ishigaki Island in Japan Using Multitemporal Remote Sensing Data. Hyperspectral Remote Sens. Ocean 2001, 4154, 212–222. [Google Scholar] [CrossRef]
- Ahmad, W.; Neil, D.T. An Evaluation of Landsat Thematic Mapper (TM) Digital Data for Discriminating Coral Reef Zonation: Heron Reef (GBR). Int. J. Remote Sens. 1994, 15, 2583–2597. [Google Scholar] [CrossRef]
- Jupp, D.L.B. Background and extensions to depth of penetration (DOP) mapping in shallow coastal waters. In Proceedings of the Symposium on Remote Sensing of the Coastal Zone International Symposium, Gold Coast, Queensland, Australia, 7–9 September 1988. [Google Scholar]
- Mumby, P.J.; Skirving, W.; Strong, A.E.; Hardy, J.T.; LeDrew, E.F.; Hochberg, E.J.; Stumpf, R.P.; David, L.T. Remote Sensing of Coral Reefs and their Physical Environment. Mar. Pollut. Bull. 2004, 48, 219–228. [Google Scholar] [CrossRef] [PubMed]
- Green, E.P.; Mumby, P.J.; Edwards, A.J.; Clark, C.D. Remote Sensing Handbook for Tropical Coastal Management; Edwards, A.J., Ed.; UNESCO: Paris, France, 2000. [Google Scholar]
- Mumby, P.J.; Clark, C.D.; Green, E.P.; Edwards, A.J. Benefits of water column correction and contextual editing for mapping coral reefs. Int. J. Remote Sens. 1998, 19, 203–210. [Google Scholar] [CrossRef]
- Cracknell, A.P.; Ibrahim, M.; McManus, J. Use of satellite and aircraft data for bathymetry studies. In Proceedings of the 13th Annual Conference of the Remote Sensing Society, Nottingham, UK, 7–11 September 1987; pp. 391–402. [Google Scholar]
- Green, E.P.; Mumby, P.J.; Edwards, A.J.; Clark, C.D. A review of remote sensing for the assessment and management of tropical costal resources. Coast. Manag. 1996, 24, 1–40. [Google Scholar] [CrossRef]
- Andréfouët, S.; Hochberg, E.J.; Chevillon, C.; Muller-Karger, F.E.; Brock, J.C.; Hu, C. Multi-scale remote sensing of coral reefs. In Remote Sensing of Coastal Aquatic Environments; Har, R.L., Miller, X., Del Castillo, C.E., Mckee, B.A., Eds.; Springer: Dordrecht, The Netherlands, 2005; pp. 297–315. [Google Scholar]
- Zainal, A.J.M.; Dalby, D.H.; Robinson, I.S. Monitoring of marine ecological changes on the east coast of Bahrain with Landsat TM. Photogramm. Eng. Remote Sens. 1993, 59, 415–421. [Google Scholar]
- Bierwirth, P.N.; Lee, T.J.; Burne, R.V. Shallow sea-floor reflectance and water depth derived by unmixing multispectral imagery. Photogramm. Eng. Remote Sens. 1993, 59, 331–338. [Google Scholar]
- Andréfouët, S.; Muller-Karger, F.E.; Hochberg, E.J.; Hu, C.; Carder, K.L. Change detection in shallow coral reef environments using Landsat 7 ETM+ data. Remote Sens. Environ. 2001, 78, 150–162. [Google Scholar] [CrossRef]
- Andréfouët, S.; Kramer, P.; Torres-Pulliza, D.; Joyce, K.E.; Hochberg, E.J.; Garza-Perez, R.; Mumby, P.J.; Riegl, B.; Yamano, H.; White, W.H.; et al. Multi-sites evaluation of IKONOS data for classification of tropical coral reef environments. Remote Sens. Environ. 2003, 88, 128–143. [Google Scholar] [CrossRef]
- Mumby, P.J.; Edwards, A.J. Mapping marine environments with IKONOS imagery: Enhanced spatial resolution can deliver great thematic accuracy. Remote Sens. Environ. 2002, 82, 248–257. [Google Scholar] [CrossRef]
- Laborte, A.; Maunahan, A.; Hijmans, R. Spectral Signature Generalization and Expansion Can Improve the Accuracy of Satellite Image Classification. PLoS ONE 2010, 5, e10516. [Google Scholar] [CrossRef] [PubMed]
- Coral Reef Ecosystem Program; Pacific Islands Fisheries Science Center. National Coral Reef Monitoring Program: Benthic Cover Derived from Analysis of Benthic Images Collected during Stratified Random Surveys (StRS) across the Pacific Remote Island Areas since 2014. NOAA’s National Center for Environmental Information, 2016. Available online: https://inport.nmfs.noaa.gov/inport/item/36157 (accessed on 15 May 2018).
- Pacific Island Benthic Habitat Mapping Center. Palmyra Atoll. NOAA’s National Center for Environmental Information, 2018. Available online: http://www.soest.hawaii.edu/pibhmc/cms/ (accessed on 12 May 2018).
- Palmyra Atoll National Wildlife Refuge. Ramsar Site Information Services. 2018. Available online: https://www.fws.gov/refuge/Palmyra_Atoll/ (accessed on 15 May 2018).
- Max, L.M.; Hamilton, S.L.; Gaines, S.D.; Warner, R.R. Benthic processes and overlying fish assemblages drive the composition of benthic detritus on a central Pacific coral reef. Mar. Ecol. Prog. Ser. 2013, 482, 181–195. [Google Scholar] [CrossRef]
- Sandin, S.A.; Smith, J.E.; DeMartini, E.E.; Dinsdale, E.A.; Donner, S.D.; Friedlander, A.M.; Konotchick, T.; Malay, M.; Maragos, J.E.; Obura, D.; et al. Baselines and degradation of coral reefs in the Northern Line Islands. PLoS ONE 2008, 3, e1548. [Google Scholar] [CrossRef] [PubMed]
- McCauley, D.J.; Micheli, F.; Young, H.S.; Tittensor, D.P.; Brumbaugh, D.R.; Madin, E.M.P.; Holmes, K.E.; Smith, J.E.; Lotze, H.K.; DeSalles, P.A.; et al. Acute effects of removing large fish from a near-pristine coral reef. Mar. Biol. 2010, 157, 2739–2750. [Google Scholar] [CrossRef] [PubMed]
- Knapp, I.S.; Maragos, J.E.; Vroom, P. Monitoring supports establishment of Pacific Remote Islands Marine National Monument. In Proceedings of the 12th International Coral Reef Symposium, Cainrs, Australia, 9−13 July 2012. [Google Scholar]
- Williams, G.J.; Smith, J.E.; Conklin, E.J.; Gove, J.M.; Sala, E.; Sandin, S.A. Benthic communities at two remote Pacific coral reefs: Effects of reef habitat, depth, and wave energy gradients on spatial patterns. PeerJ 2013, 1, e81. [Google Scholar] [CrossRef] [PubMed]
- Office of Insular Affairs, Department of the Interior. Kingman Reef; Office of Insular Affairs, Department of the Interior: Washington, DC, USA, 2009.
- Friedlander, A.M.; Sandin, S.A.; DeMartini, E.E. Spatial patterns of the structure of reef fish assemblages at a pristine atoll in the central Pacific. Mar. Ecol. Prog. Ser. 2010, 410, 219–231. [Google Scholar] [CrossRef]
- Pacific Remote Islands National Wildlife Refuge Complex. Baker Island National Wildlife Refuge: Draft Comprehensive Conservation Plan and Environmental Assessment; Pacific Remote Islands National Wildlife Refuge Complex: Washington, DC, USA, 2007.
- Maragos, J.; Miller, J.; Gove, J.; Mundy, B.; Friedlander, A.M.; Godwin, S.; Musburger, C.; Timmers, M.; Tsuda, R.; Vroom, P.; et al. US coral reefs in the Line and Phoenix Islands, central Pacific Ocean: History, geology, oceanography and biology. In Coral Reefs of the USA Coral Reefs of the World 1; Riegl, B.M., Dodge, R.E., Eds.; Springer: New York, NY, USA, 2008; pp. 595–641. [Google Scholar]
- Miller, J.; Maragos, J.; Brainard, R.; Vroom, P.S.; Godwin, S.; Hoeke, R.K.; Aeby, G.S.; Moffitt, R.; Lammers, M.; Gove, J.; et al. The state of Coral Reef Ecosystems of the Pacific Remote Island Areas. In The State of Coral Reef Ecosystems of the United States and Pacific Freely Associated States; Waddell, J.E., Clarke, A.M., Eds.; NOAA Technical Memorandum NOS; NCCOS: Silver Spring, MD, USA, 2002; pp. 353–386. [Google Scholar]
- Pacific Remote Islands National Wildlife Refuge Complex. Howland Island National Wildlife Refuge: Draft Comprehensive Conservation Plan and Environmental Assessment; Pacific Remote Islands National Wildlife Refuge Complex: Washington, DC, USA, 2007.
- Edwards, A. Applications of Satellite and Airborne Image Data to Coastal Management; UNESCO: Paris, France, 1999. [Google Scholar]
- Maritorena, S. Remote Sensing of the Water Attenuation in Coral Reefs: A Case Study in French Polynesia. Int. J. Remote Sens. 1996, 17, 155–166. [Google Scholar] [CrossRef]
- Fisher, R.A. The use of multiple measurements in taxonomic problems. Ann. Eugen. 1936, 7, 179–188. [Google Scholar] [CrossRef]
- Hastie, T.; Tibshirani, R.; Friedman, J. The Elements of Statistical Learning: Data Mining, Inference and Prediction, 2nd ed.; Springer: New York, NY, USA, 2009; pp. 106–111. [Google Scholar]
- Core Team R: A Language and Environment for Statistical Computing; R Foundation for Statistical Computing: Vienna, Austria, 2016; Available online: https://www.R-project.org/ (accessed on 15 May 2018).
- Roy, D.P.; Borak, J.S.; Devadiga, S.; Wolfe, R.E.; Zheng, M.; Descloitres, J. The MODIS Land product quality assessment approach. Remote Sens. Environ. 2002, 83, 62–76. [Google Scholar] [CrossRef]
- Ackerman, S.A.; Strabala, K.I.; Menzel, W.P.; Frey, R.A.; Moeller, C.C.; Gumley, L.E. Discriminating clear sky from clouds with MODIS. J. Geophys. Res. 1998, 103, 32141–32157. [Google Scholar] [CrossRef]
- Chavez, P.S., Jr. An improved dark-object subtraction technique for atmospheric scattering correction for multispectral data. Remote Sens. Environ. 1988, 24, 459–479. [Google Scholar] [CrossRef]
- Manavalan, P.; Sathyanath, P.; Rajegowda, G.L. Digital image analysis techniques to estimate waterspreadfor capacity evaluations of reservoirs. Photogramm. Eng. Remote Sens. 1993, 59, 1389–1395. [Google Scholar]
- Gitelson, A.A.; Ya Kondratyev, K. Optical models of mesotrophic and eutrophic water bodies. Int. J. Remote Sens. 1991, 12, 373–385. [Google Scholar] [CrossRef]
- Chavez, P.S., Jr. Image-Based Atmospheric Corrections—Revisited and Improved. Photogramm. Eng. Remote Sens. 1996, 62, 1025–1036. [Google Scholar]
- Tassan, S. Modified Lyzenga’s method for macroalgae detection in water with non-uniform composition. Int. J. Remote Sens. 1996, 17, 1601–1607. [Google Scholar] [CrossRef]
- Gordon, H.R.; Morel, A. Remote Assessment of Ocean Color for Interpretation of Satellite Visible Imagery; Springer: New York, NY, USA, 1983. [Google Scholar]
- Vanderstraete, T.; Goossens, R.; Ghabour, T.K. Coral Reef Habitat Mapping in The Red Sea (Hurghada, Egypt) Based on Remote Sensing. EARSeL eProc. 2004, 3, 191–207. [Google Scholar]
- Armstrong, R.A. Remote sensing of submerged vegetation canopies for biomass estimation. Int. J. Remote Sens. 1993, 14, 621–627. [Google Scholar] [CrossRef]
- Lyzenga, D. Remote Sensing of Bottom Reflectance and Water Attenuation Parameters in Shallow Water Using Aircraft and Landsat Data. Int. J. Remote Sens. 1981, 2, 71–82. [Google Scholar] [CrossRef]
- Lyzenga, D. Passive remote sensing techniques for mapping water depth and bottom features. Appl. Opt. 1978, 17, 379–383. [Google Scholar] [CrossRef] [PubMed]
- Paredes, J.M.; Spero, R.E. Water depth mapping from passive remote sensing data under a generalized ratio assumption. Appl. Opt. 1983, 22, 1134–1135. [Google Scholar] [CrossRef] [PubMed]
- Gould, R.W.; Arnone, R.A., Jr.; Sydor, M. Absorption, Scattering, and Remote Sensing Reflectance Relationships in Coastal Waters: Testing a New Inversion Algorithm. J. Coast. Res. 2001, 17, 328–341. [Google Scholar]
- Le, J.A.; El-Askary, H.M.; Allali, M.; Struppa, D.C. Application of recurrent neural networks for drought projections in California. Atmos. Res. 2017, 188, 100–106. [Google Scholar] [CrossRef]


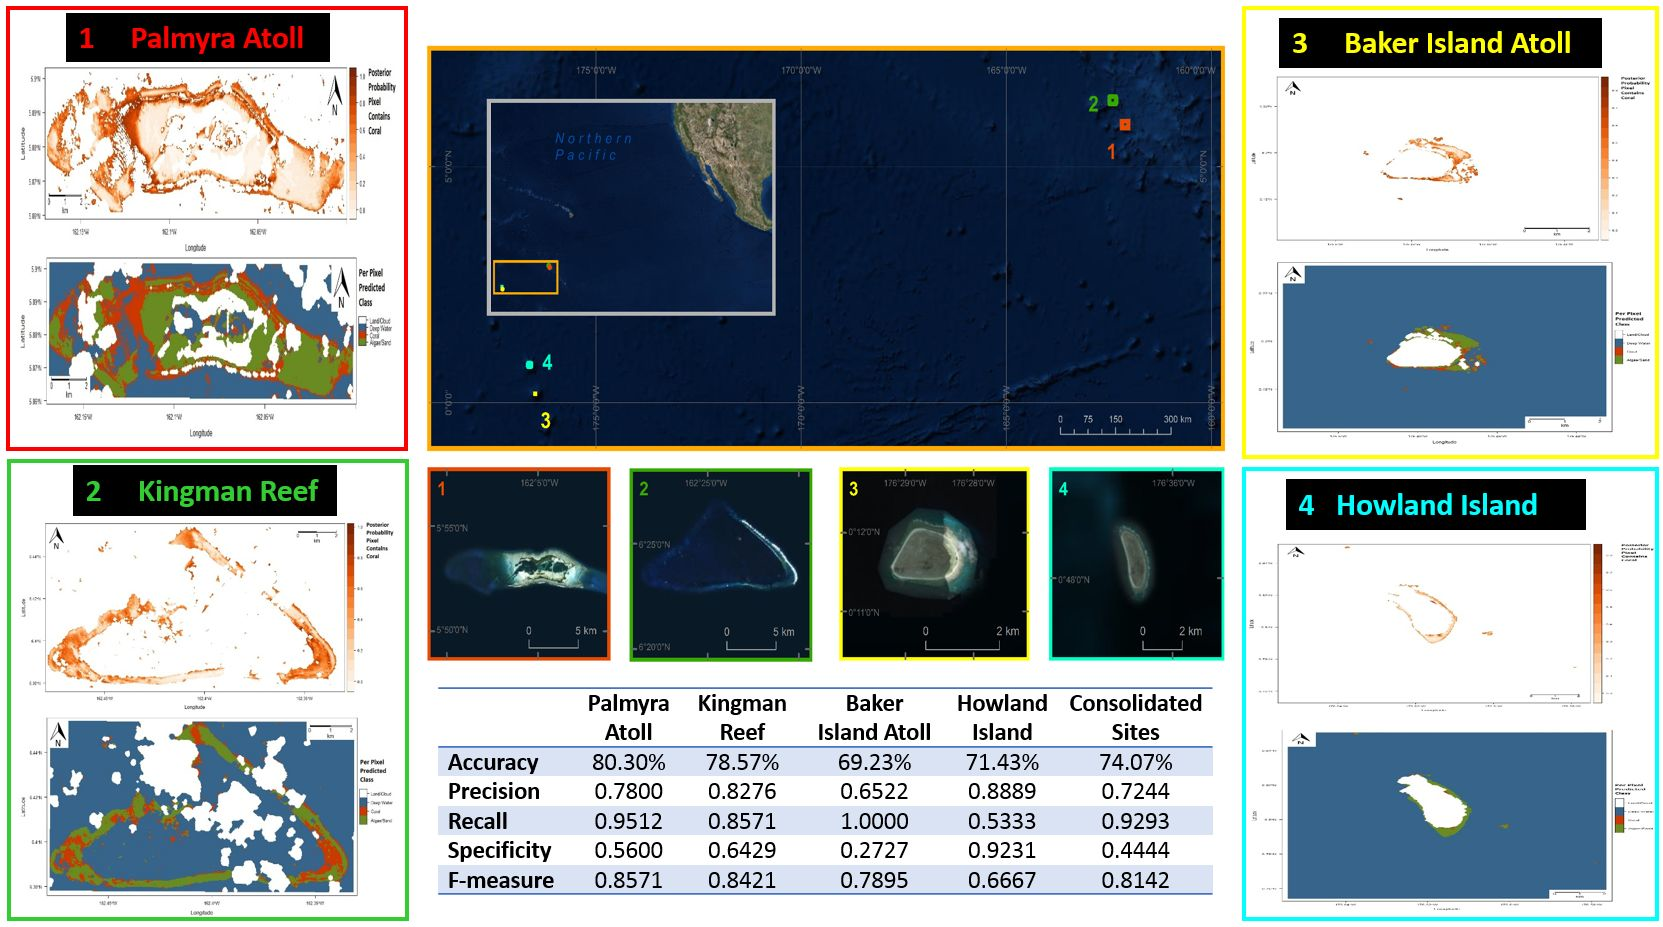
| Location (Figure 1) | Path/Row | Location | Image Capture Date | Area of Interest Size | Number of Observations | Distance from Observation Site (Palmyra Atoll) |
|---|---|---|---|---|---|---|
| 1 | 065/056 | Palmyra Atoll (1) | 27 May 2015 | 19 × 5-km | 82 | – |
| 2 | 065/056 | Kingman Reef (1) | 27 May 2015 | 16 × 8-km | 57 | 67.9-km |
| 3 | 060/073 | Baker Island Atoll (2) | 20 August 2014 | 9 × 11-km | 26 | 1709.6-km |
| 4 | 059/074 | Howland Island (4) | 18 January 2015 | 9 × 8-km | 30 | 1719.6-km |
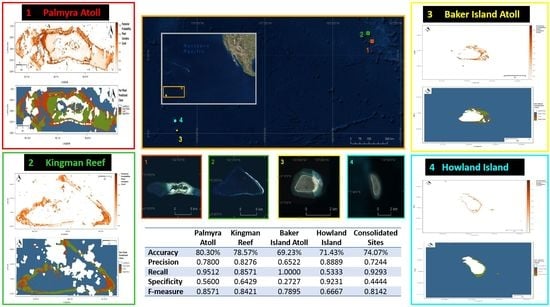
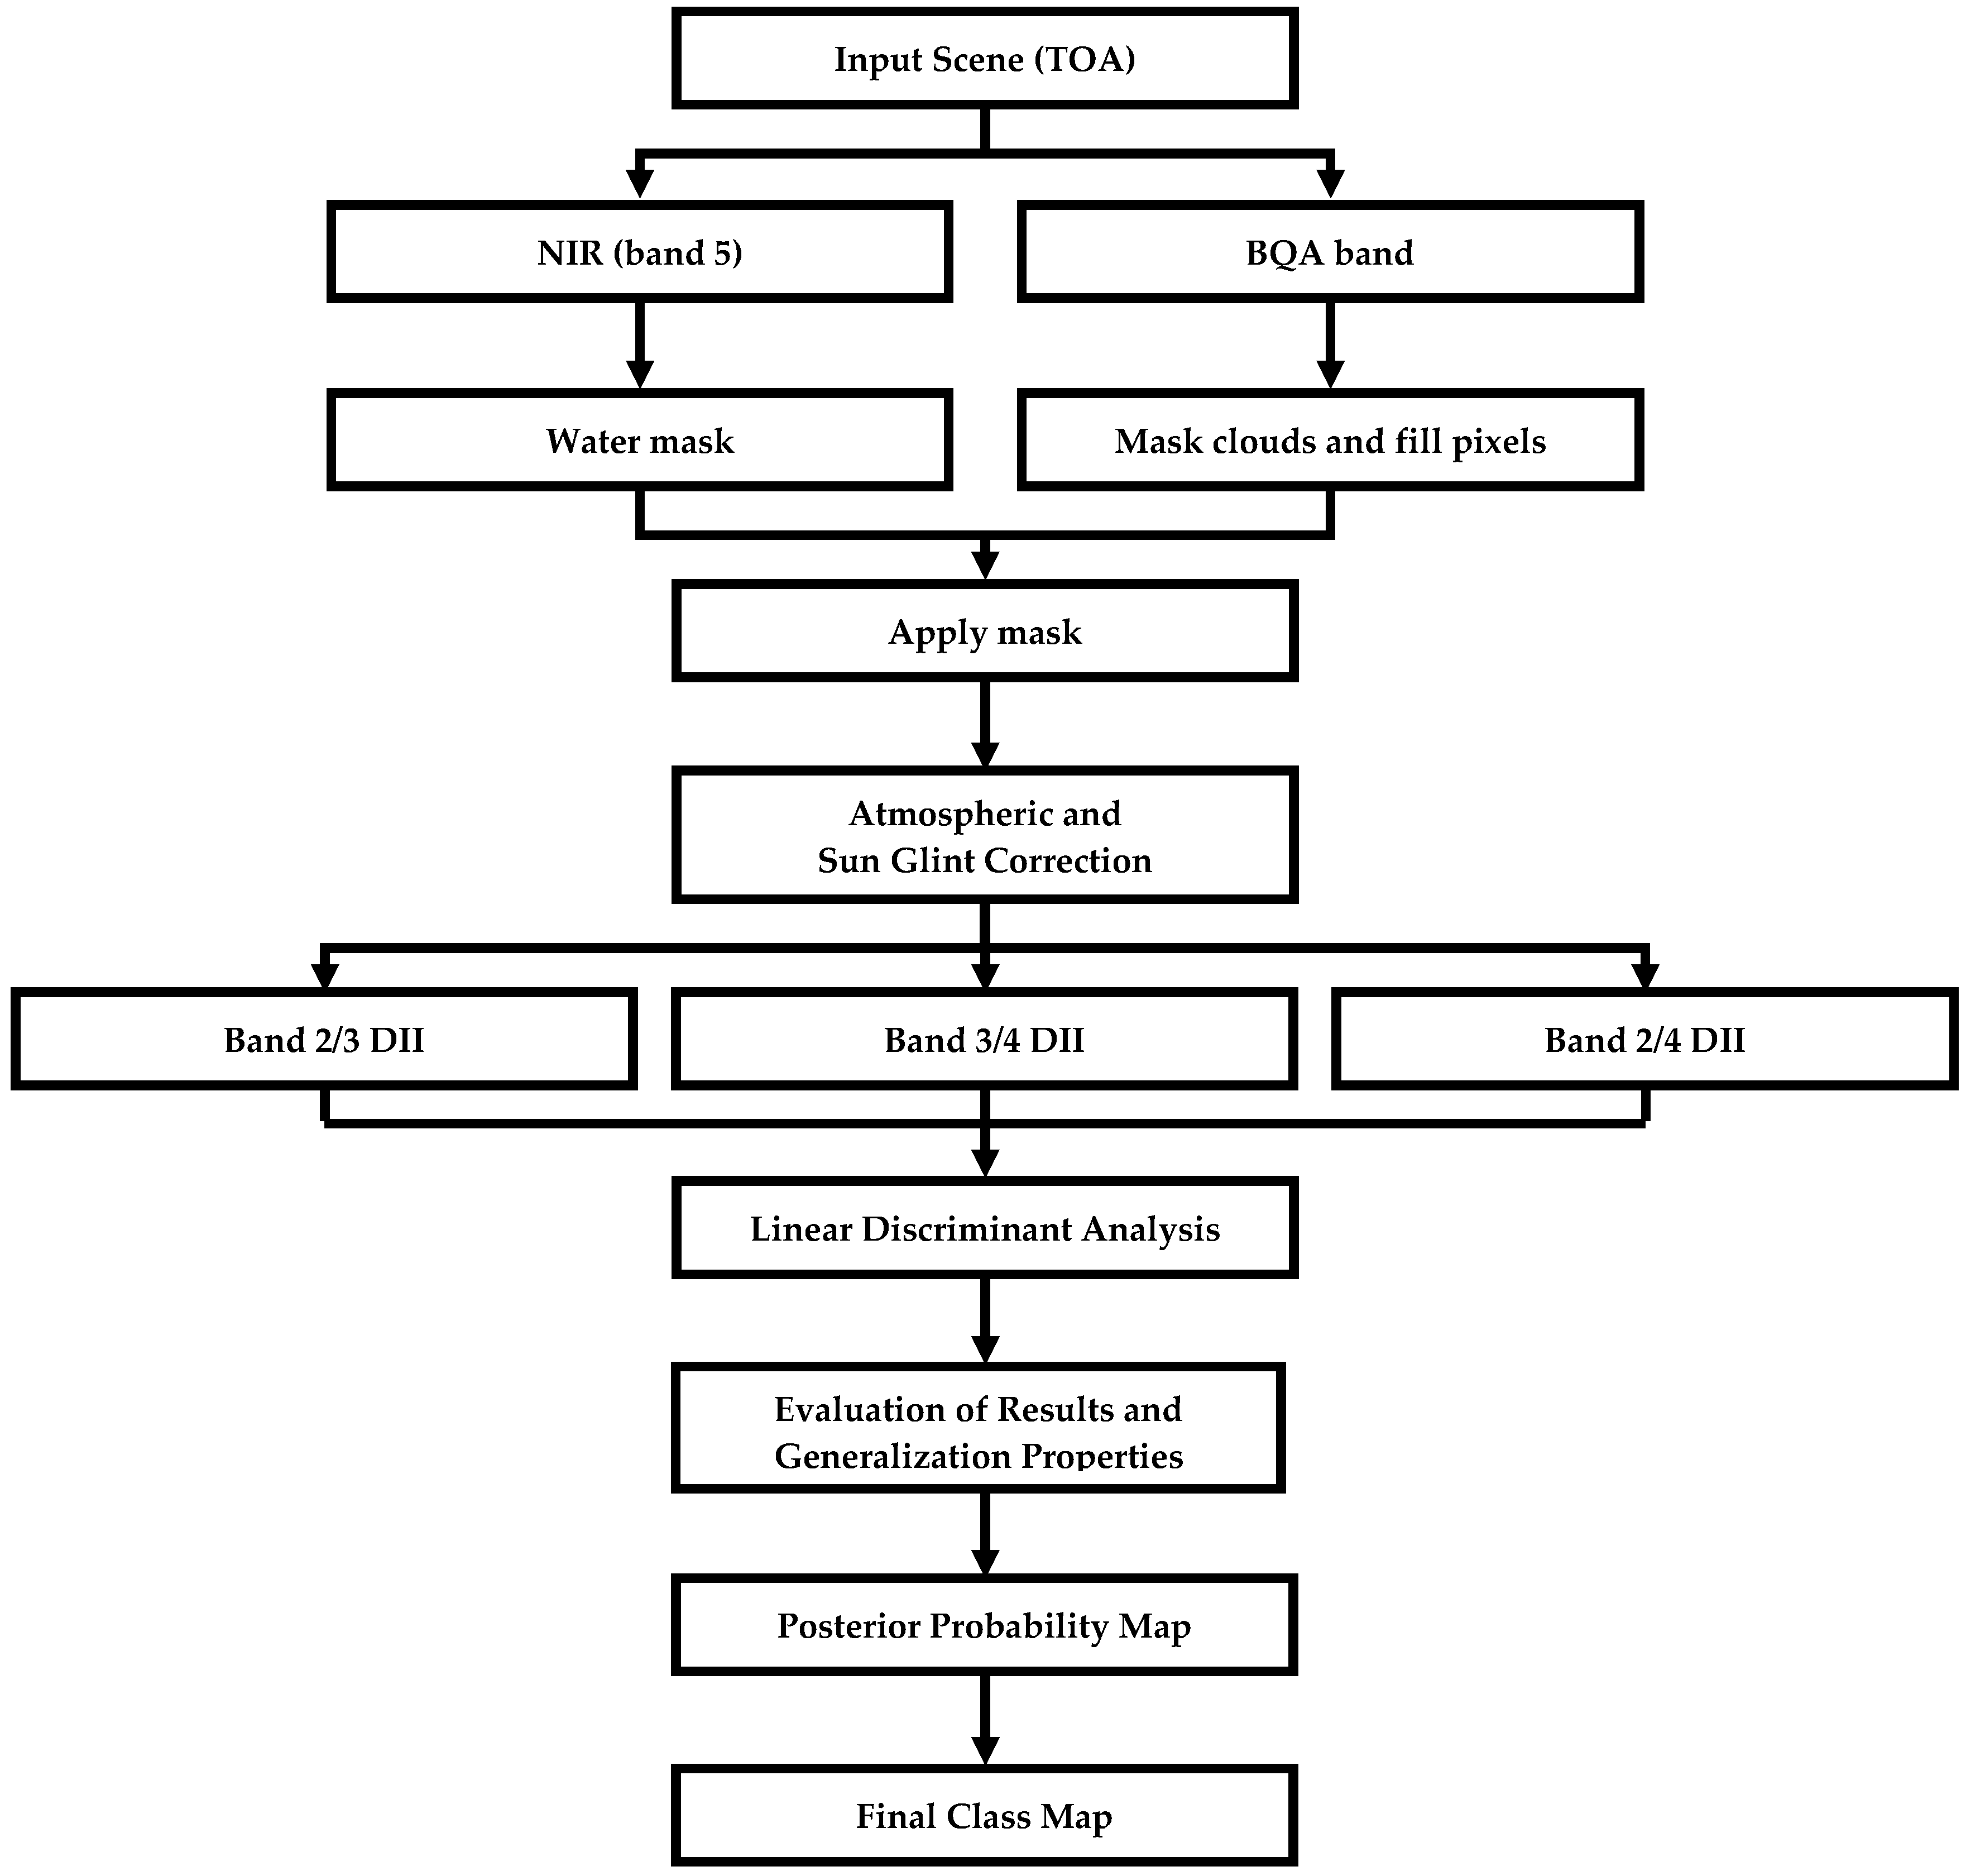
| Palmyra Atoll | Kingman Reef | Baker Island Atoll | Howland Island | Consolidated Sites | |
|---|---|---|---|---|---|
| Accuracy | 80.30% | 78.57% | 69.23% | 71.43% | 74.07% |
| Precision | 0.7800 | 0.8276 | 0.6522 | 0.8889 | 0.7244 |
| Recall | 0.9512 | 0.8571 | 1.0000 | 0.5333 | 0.9293 |
| Specificity | 0.5600 | 0.6429 | 0.2727 | 0.9231 | 0.4444 |
| F-measure | 0.8571 | 0.8421 | 0.7895 | 0.6667 | 0.8142 |
| Ground Truth Labels | |||
|---|---|---|---|
| Coral | Not Coral | ||
| Predicted Class | Palmyra Atoll | ||
| Coral | 39 | 11 | |
| Not Coral | 2 | 14 | |
| Kingman Reef | |||
| Coral | 24 | 5 | |
| Not Coral | 4 | 9 | |
| Baker Island Atoll | |||
| Coral | 15 | 8 | |
| Not Coral | 0 | 3 | |
| Howland Island | |||
| Coral | 8 | 1 | |
| Not Coral | 7 | 12 | |
| Consolidated Sites | |||
| Coral | 92 | 35 | |
| Not Coral | 7 | 28 | |
© 2018 by the authors. Licensee MDPI, Basel, Switzerland. This article is an open access article distributed under the terms and conditions of the Creative Commons Attribution (CC BY) license (http://creativecommons.org/licenses/by/4.0/).
Share and Cite
Gapper, J.J.; El-Askary, H.; Linstead, E.; Piechota, T. Evaluation of Spatial Generalization Characteristics of a Robust Classifier as Applied to Coral Reef Habitats in Remote Islands of the Pacific Ocean. Remote Sens. 2018, 10, 1774. https://doi.org/10.3390/rs10111774
Gapper JJ, El-Askary H, Linstead E, Piechota T. Evaluation of Spatial Generalization Characteristics of a Robust Classifier as Applied to Coral Reef Habitats in Remote Islands of the Pacific Ocean. Remote Sensing. 2018; 10(11):1774. https://doi.org/10.3390/rs10111774
Chicago/Turabian StyleGapper, Justin J., Hesham El-Askary, Erik Linstead, and Thomas Piechota. 2018. "Evaluation of Spatial Generalization Characteristics of a Robust Classifier as Applied to Coral Reef Habitats in Remote Islands of the Pacific Ocean" Remote Sensing 10, no. 11: 1774. https://doi.org/10.3390/rs10111774
APA StyleGapper, J. J., El-Askary, H., Linstead, E., & Piechota, T. (2018). Evaluation of Spatial Generalization Characteristics of a Robust Classifier as Applied to Coral Reef Habitats in Remote Islands of the Pacific Ocean. Remote Sensing, 10(11), 1774. https://doi.org/10.3390/rs10111774