Article

Cross-Validation of Observations between the GPM Dual-Frequency Precipitation Radar and Ground Based Dual-Polarization Radars

by
Sounak Kumar Biswas
* and
V. Chandrasekar
Department of Electrical and Computer Engineering, Colorado State University, Fort Collins, CO 80523, USA
*
Author to whom correspondence should be addressed.
Remote Sens. 2018, 10(11), 1773; https://doi.org/10.3390/rs10111773
Submission received: 16 August 2018 / Revised: 30 October 2018 / Accepted: 30 October 2018 / Published: 9 November 2018
(This article belongs to the Special Issue Remote Sensing of Precipitation)

Abstract

:
The Global Precipitation Measurement (GPM) mission Core Observatory is equipped with a dual-frequency precipitation radar (DPR) with capability of measuring precipitation simultaneously at frequencies of 13.6 GHz (Ku-band) and 35.5 GHz (Ka-band). Since the GPM-DPR cannot use information from polarization diversity, radar reflectivity factor is the most important parameter used in all retrievals. In this study, GPM’s observations of reflectivity at dual-frequency and instantaneous rainfall products are compared quantitatively against dual-polarization ground-based NEXRAD radars from the GPM Validation Network (VN). The ground radars, chosen for this study, are located in the southeastern plains of the U.S.A. with altitudes varying from 5 to 210 m. It is a challenging task to quantitatively compare measurements from space-based and ground-based platforms due to their difference in resolution volumes and viewing geometry. To perform comparisons on a point-to-point basis, radar observations need to be volume matched by averaging data in common volume or by re-sampling data to a common grid system. In this study, a 3-D volume matching technique first proposed by Bolen and Chandrasekar (2003) and later modified by Schwaller and Morris (2011) is applied to both radar data. DPR and ground radar observations and products are cross validated against each other with a large data set. Over 250 GPM overpass cases at 5 NEXRAD locations, starting from April 2014 to June 2018, have been considered. Analysis shows that DPR Ku- and Ka-Band reflectivities are well matched with ground radar with correlation coefficient as high as 0.9 for Ku-band and 0.85 for Ka-band. Ground radar calibration is also checked by observing variation in mean biases of reflectivity between DPR and GR over time. DPR rainfall products are also evaluated. Though DPR underestimates higher rainfall rates in convective cases, its overall performance is found to be satisfactory.

Graphical Abstract

1. Introduction

The Tropical Rainfall Measurement Mission (TRMM) satellite carried the first ever space borne weather radar operating at Ku-Band [1]. It was launched in November 1997 as a joint mission by the NASA (National Aeronautics and Space Administration) and the JAXA (Japan Aerospace Exploration Agency). Its main scientific objective was to provide a global 3-D precipitation map over the tropics which would enable the scientific community in extending their research to better understand Earth’s energy and hydrological cycle [2]. After a successful span of 17 years, on July 2015, the TRMM satellite came to an end. The Global Precipitation Measurement (GPM) mission is a follow-on mission to the TRMM. Launched on 27 February 2014, the GPM Core Observatory is expected to provide next-generation measurements of precipitation over a wide range of latitudes of 65 ° N to 65 ° S [3,4]. The GPM Core Observatory carries a Dual-Frequency Precipitation Radar (DPR), which operates at 13.6 GHz (Ku-Band) and 35.5 GHz (Ka-Band) [5], and a passive microwave radiometer known as GPM Microwave Imager (GMI) [6]. The combined observations of DPR and GMI, extend GPM’s capability over TRMM in accurately measuring light precipitation and snowfall [7,8].
Accurate measurement of precipitation is necessary for profound understanding of Earth’s hydrometeorological cycle. Satellite measurement of Quantitative Precipitation Estimation (QPE), aided by comprehensive ground validation, can provide reliable and consistent global rainfall data sets over oceans and remote regions [9]. Precipitation measurements from GPM can be very challenging, especially at Ka-band, due to non-Rayleigh scattering effects. Moreover, frequencies at Ku- and Ka-band suffers significant amount of attenuation while propagating through precipitation media. The present GPM precipitation retrieval algorithm [10] is expected to have better performance in quantitatively measuring precipitation over TRMM. It is also expected to improve the estimation of light rainfall by using dual-frequency observations. Even though the retrieval algorithms perform effectively [11], cross-validation of the GPM measurements and derived products with polarimetric ground radars is of enormous importance for evaluating and improving algorithm performance. It is also crucial for better understanding sources of uncertainties in measurements, consistency in algorithm performance and for quantifying errors. Since GPM pre-launch era, various validation studies have investigated distinct characteristics of GPM-DPR’s performance. Kubota et al. [12] found that precipitation estimation using at-launch codes would underestimate Ka-band precipitation in comparison to Ku-band and dual-frequency product. Toyoshima et al. [13] studied storm-top heights measured by the DPR and concluded that the Ka-band radar may not be as sensitive to precipitation measurements as expected. Before launch, dual-frequency algorithms were tested and validated on data simulated at Ka-band from the TRMM-PR’s Ku-band measurements [14,15]. Early evaluations showed promising results. In the post-launch period, validation studies of real GPM observations have been conducted with ground radars across the world. Speirs et al. [16] have evaluated GPM-DPR surface rainfall estimate based on different seasons and terrain over Switzerland with C-band radar network. They found the product performs better in flatter terrains and during summer months. In contrast, the performance was significantly degraded over complex terrain, especially in winters. Similar results were also reported by Gabella et al. [17] while evaluating GPM rain-rate products over the Swiss Alps region using ground radar and rain gauge network. Biswas and Chandrasekar [18] performed ground validation of GPM-DPR observations and rainfall rate measurements over the Dallas Fort Worth region in Texas, USA using S-band NEXRAD. They have reported the reflectivities were well matched while rainfall rate product performance was satisfactory. Warren et al. [19] studied ground radar calibration against GPM-DPR Ku-band using 3 operational S-band ground radar near Sydney, Australia. Crisologo et al. [20] also performed studies of calibrating ground radars using GPM over Manila Bay, Philippines and found that DPR-GR bias improved by considering radar beam blockage as a quality filter. Other notable studies have been conducted which deals with validating rainfall estimates from combined GPM-DPR and passive microwave sensor measurements [21,22,23,24]. In this work, a large-scale comparison and validation of GPM Ku-band and Ka-band reflectivity measurements and instantaneous rain-rate products has been presented with ground-based polarimetric radars over the United States.
NASA has developed a Ground Validation (GV) program for doing scale large validation in the United States [25]. At present, the NASA Validation Network (VN) consists of 75 operational NEXRAD sites [26]. This study uses 5 NEXRAD radars located in the southeastern plains of the U.S.A. NEXRAD radars are chosen since they operate at a non-attenuating frequency of S-band. At the same time, GPM undergoes severe attenuation making is difficult for direct comparison. The GPM reflectivity measurements first need to be corrected for attenuation. This is achieved by the algorithm in [10,27]. To minimize errors from temporal mismatch both GR and GPM overpass data are carefully chosen such that the relative time difference is less than 5 min. Both data are volume matched following the procedure mentioned in [25,28]. GPM-DPR reflectivity factor at Ku- and Ka-band along with instantaneous rain-rate product are cross validated using 4-year (April 2014 to June 2018) dataset of GPM overpasses with the mentioned GV sites. Radar reflectivity factor is chosen because it is the fundamental product used to retrieve precipitation from radar. In absence of any attenuation, an ideal relationship between GR S-band, GPM-DPR Ku- and Ka-band frequencies was determined by performing scattering simulations. Results from simulation are used to measure the theoretical deviation in GPM-DPR reflectivity for a given mean GR reflectivity. This in turn is used to access of DPR-GR biases. The main aim of this study is to quantify the difference in reflectivity and to access the performance of instantaneous rain-rate product at a large scale over the United States using GV radars from NASA ground validation network. This article is organized as follows. In Section 2 the data sets from GPM and NEXRAD radars are summarized. Volume matching methodology and the scattering simulations are also presented. Section 3 describes quantitative comparisons of the GPM-DPR measurements with respect to ground radars. Absolute calibration of ground radars against GPM is also studied. Lastly, Section 4 provides a summary of this work along with discussions and conclusions.

2. Instruments, Datasets and Analysis Methodology

2.1. The GPM Satellite: Dual-Frequency Radar

The heart of the GPM core observatory is the DPR and the GMI. The combined radar-radiometer observations are expected to improve precipitation estimates. The DPR consists of two radars namely KuPR operating at 13.6 GHz and KaPR operating at 35.5 GHz. [5] They are capable of providing high-resolution three-dimensional precipitation data. Figure 1a depicts DPR’s observational characteristics. It can be observed that below melting layer significant difference in attenuation suffered at the two frequency channels. One of the main reasons for adding the Ka-band channel is to improve the detection threshold for light rain and snow compared to TRMM’s precipitation radar [3,7]. Non-Rayleigh scattering effects are more pronounced at Ka-band than in Ku-band. This phenomenon coupled with the difference in attenuation makes a feasible parameter for detailed study of precipitation microphysics. Using this dual-frequency information enables improved drop size distribution retrievals [29], accurate melting layer height detection [30] and identification of different hydrometeor phases such as snow [8,31].
Each radar consists of active phased array elements (128 slot array antennas) capable of 49 simultaneous beam formations. The antenna and the pulse repetition time is designed such that the DPR can observe at least 19 Km from the sea level. Figure 1b shows the scan strategy. The KuPR radar scans with all the 49 beams and it known as normal scan (NS). Each footprint has a diameter of approximately 4.9 Km at NADIR which gives a scan swath of 245 Km. The KaPR radar scan is matched across the central 125 Km of the KuPR swath. This scan is called the Matched Scan (MS). The vertical range resolution of both the radars is 250 m. There is another type of scan called the High Sensitivity Scan (HS) where all the 49 beams of the KaPR radar are interlaced with the middle 25 beams of the KuPR radar. During signal processing, the radar echoes are over sampled at twice the rate, giving a vertical resolution of 125 m in the final data. The narrow bandwidth of the KaPR can be accounted for side lobe clutter contamination for large scan angles. A detailed design specification can be found in the work of Senbokuya et al. [5].
The GPM data used in this study is 2ADPR level 2 data, version 5 [32]. It should be noted that there has been changes in DPR calibration, from previous version 4 level 2 data, corresponding to increase in KuPR reflectivity by 1.2 dB and KaPR reflectivity by 1.3 dB [33]. Over 250 DPR overpass data that have been used in this study were downloaded from the STORM online data interface to NASA Precipitation Processing System archive (https://storm.pps.eosdis.nasa.gov). Products from only Normal and MSs are used. Highly sensitive scan data is not considered to avoid complications arising from the geometry of interlaced beams. The key variables used in this work include zFactorMeasured from Preparation Module, zFactorCorrected, precipRate and precipRateNearSurface from Solver Module and typePrecip, qualityTypePrecip, heightBB and flagBB from Classification Module.

2.2. Ground Validation Radar: NEXRAD

The Weather Surveillance Radar, 1988, Doppler or WSR-88D are S-band operational radars used for weather observation and forecasting in the United States. They are also known as the Next-Generation Weather radar or NEXRAD. These radars are operated by National Oceanic and Atmospheric Administration (NOAA) and Department of Defense (DoD). At present there is a deployment of 160 WSR-88D, throughout the continental USA. Recently, NEXRAD radar have been upgraded with the capability of polarization diversity. They operate at the frequency range of 2700 MHz to 3000 MHz. The radar has a range resolution of 250 m. The beam is 1 degree wide. Typical range of NEXRADs is 400 Km. More information on NEXRAD specifications can be found in [34]. During normal operations, the radar conducts a volume coverage pattern (VCP) in which it scans full 360 degree in azimuth and from 0.5 degree to 19.5 degree in elevation in steps of 14 plan position indicator (PPI) scans. There are different variety of VCP which are optimized for specific weather conditions and are deployed by the operational controls according to the observed meteorological event and desired data quality. The radar typically takes around 5 to 6 min. to complete one volume scan. In complex topography, radar observations are associated with several issues such as partial or total beam blockage and beam overshooting. Current operational radars in the United States do not provide accurate measurement of rainfall over mountainous region. [35] Due to this reason NEXRAD radars located in the southeastern plains along the Gulf of Mexico are chosen. Table 1 provides the names and locations of the 5 NEXRAD radars used for validation. All the radars are located from 5 to 210 m in altitude from Mean Sea Level (MSL). NEXRAD level 2 data has been used in this study. Differential reflectivity ( Z D R ) calibration was carried out from observations of Z and Z D R in drizzle following the procedure mentioned in [36]. It is important to ensure accurate rainfall estimation by dual-pol estimators such as R ( Z , Z D R ) and R ( K D P , Z D R ) . Attenuation correction is not necessary since S-band does not suffer attenuation in precipitation medium.

2.3. Theoretical Simulations of Reflectivities at S, Ku, and Ka-Band

In Rayleigh scattering, the particle sizes are much smaller compared to the radar wavelength. In this case, the radar reflectivity factor can be shown approximately equivalent to the sixth moment of the drop size distribution. This assumption is valid for NEXRAD radars operating at a wavelength of about 10 cm. When particle sizes are greater than 10 percent of the radar wavelength, this Rayleigh approximation does not hold true. If raindrop dimensions are compared against GPM-DPR Ku-band (13.6 GHz) and Ka-band (35.5 GHz), non-Rayleigh scattering effects seem to be very evident in GPM observations at these two frequencies. Due to this, even in ideal conditions (with no attenuation), the back scattering cross section from precipitation particles can be quite different at both GPM Ku-band and Ka-band compared to ground radar S-band. This in turn may lead to inconsistency while comparing the reflectivities. Hence to correctly infer the differences in reflectivities, it is useful perform theoretical simulations. In this study, scattering simulations are done using T-Matrix method [37]. It was assumed that the drops were symmetric with orientation canting angle following a Gaussian distribution with zero mean and standard deviation of 5 ° . The drop shape model described in [38] has been used. Mean reflectivities were calculated varying the ranges of normalized intercept parameter, shape parameter and median volume diameter of a normalized gamma distribution model [39]. Equation (1) shows a normalized gamma distribution and Equation (2) shows the ranges of N w , μ and D o used in the simulation.
N ( D ) = N w f ( μ ) D D o μ e Λ D Λ = 3.67 + μ D o f ( μ ) = 6 3.67 4 ( 3.67 + μ ) μ + 4 Γ ( μ + 4 )
10 3 < N w < 10 5 1 < μ < 3 0.5 < D o < 2.5 m m
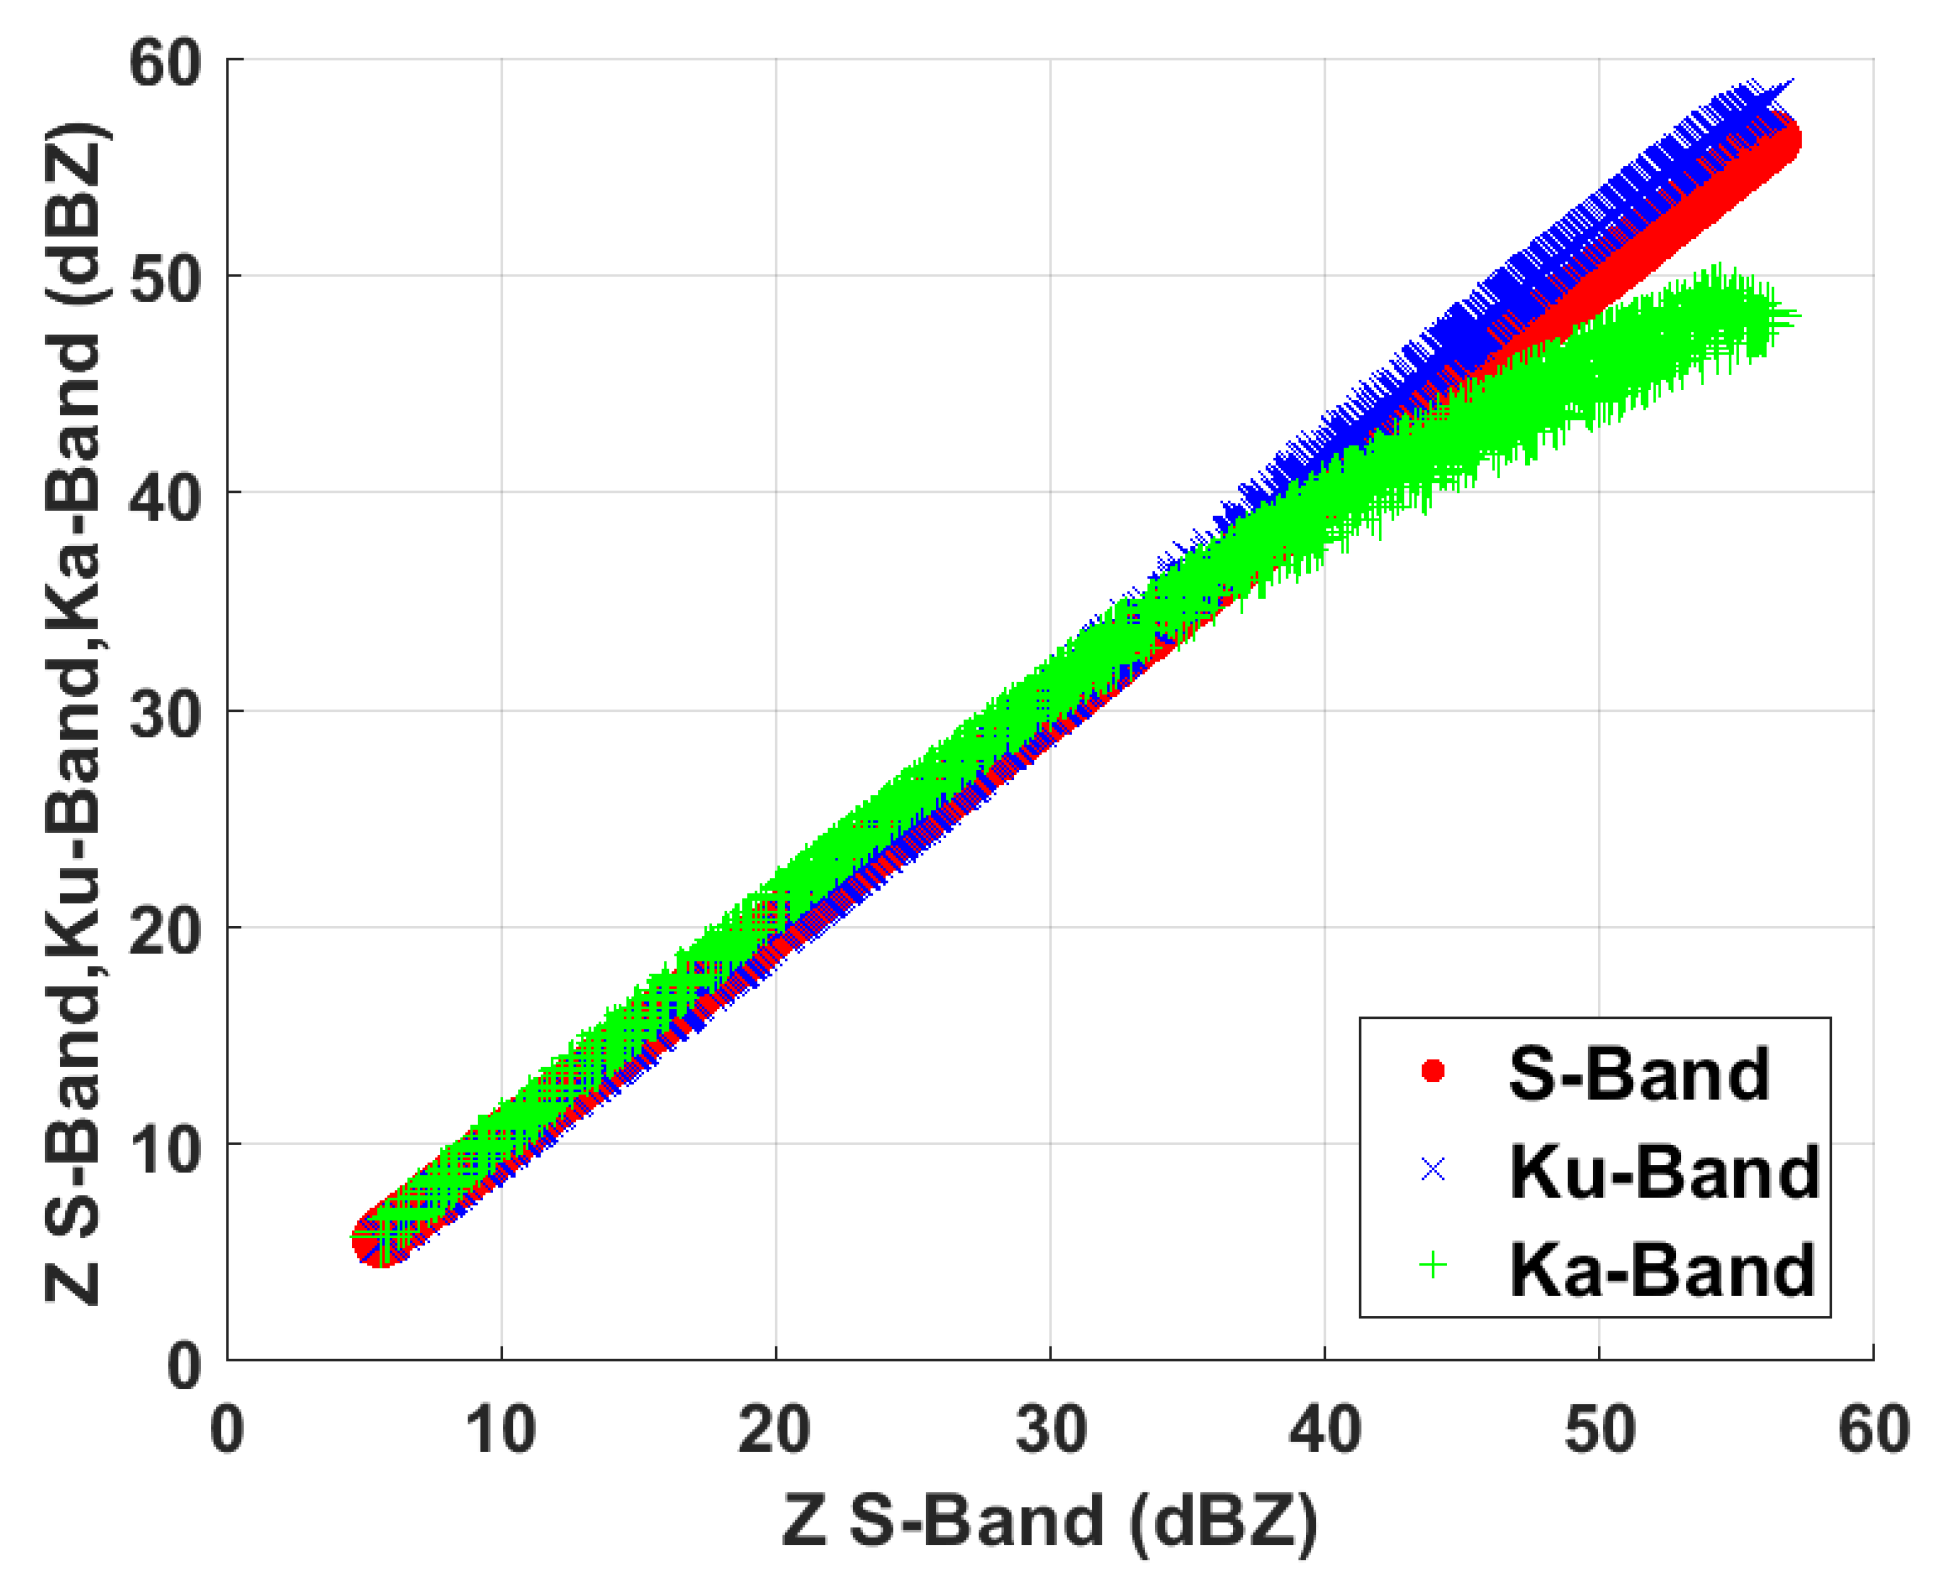
The difference between S, Ku, and Ka-band reflectivities obtained from the simulation is shown in Figure 2. It can be observed that Ku-band reflectivity values up to 35 dBZ are almost equal to S-band while Ka-band reflectivity values are almost 1 dB higher than S-band. From 35 dBZ onward, due to increase in drop size, non-Rayleigh scattering effect start to crop in and thus a deviation can be seen in both Ku-band and Ka-band. Beyond 50 dBZ this deviation becomes more severe. In the region of 35–50 dBZ, Ku-band reflectivity can be 2 to 3 dBZ higher while Ka-band reflectivities can be 5 dBZ lower compared to S-band. These results are consistent with the findings in [40,41].

2.4. Volume Matching Methodology

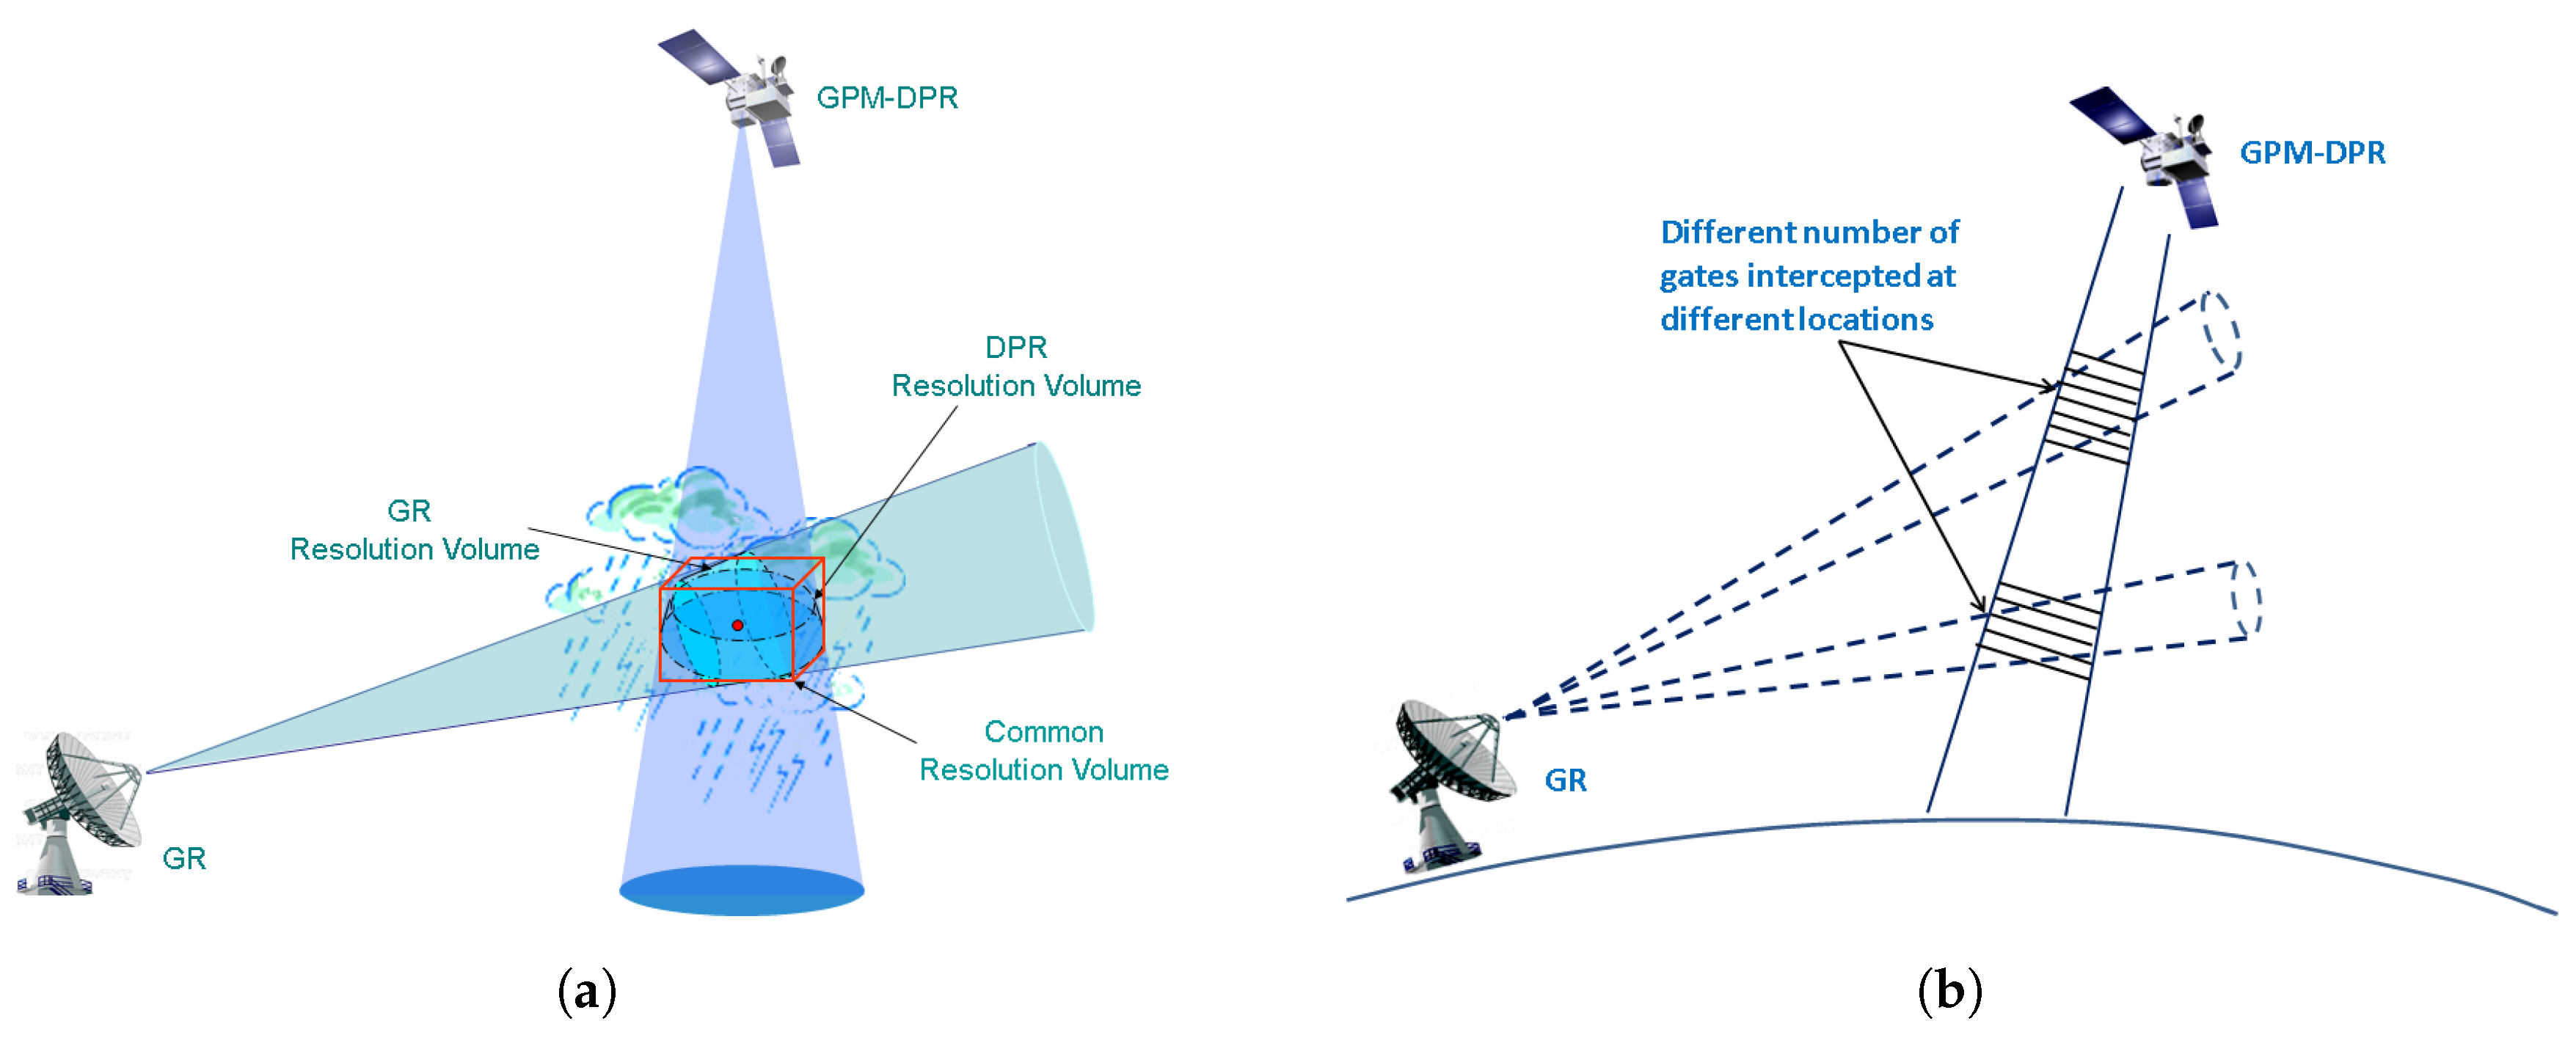
Direct inter-comparisons between the GPM-DPR and ground radar is not possible because of the different viewing geometry of the two systems. The space-based radar is a vertically down looking radar while ground-based radars scan in PPI mode. For point by point comparisons, errors can crop in from observation resolution volume mismatch, spatial alignment, and difference in operating frequency.
Figure 3a,b both show the general concept of DPR and GR observation volumes at the beam intersection locations. It can be observed in Figure 3b that these common volumes at different beam intersections can be different. In literature, several procedures have been proposed for matching and aligning space and ground radar observations [42,43]. In the method, the data from space radar and ground radar are interpolated and re-sampled to a common Cartesian grid. A similar methodology by Bolen and Chandrasekar [28,41] discusses the distortion of reflectivity map from space radar with respect to ground radar and its mitigation by re-sampling them to a common grid by variable volume matching with a polynomial technique for alignment. This method was further developed by Schwaller and Morris [25] where volume matching is performed at each geometric intersection of the space radar and ground radar beams by averaging the reflectivity samples within the volume instead of re-sampling it. It has been shown by the authors that this procedure minimizes error due to interpolation. In this study, the same procedure has been followed. First the intersection locations of DPR’s beam with GR’s elevation sweeps are identified. Only the intersection samples lying within the 100 Km range radius of the ground radar are considered. This is because, at ranges beyond 100 Km, the vertical extend of the GR beam is nearly 2 Km which is considered too coarse for meaningful comparisons. Moreover, due to nonstandard atmospheric refraction the GR beam bends. The vertical resolution of the DPR data is 125 m and the horizontal resolution is 4.9 Km whereas the resolution of GR data is 250m. Thus, DPR gates falling between the half-power GR beam points are linearly averaged in vertical direction. The GR data are averaged in horizontal direction over a circular area centering the intersection of parallax adjusted DPR beam with GR sweeps. The GR gates are weighted with a Barnes [44] type Gaussian inverse distance weighting. Here the distance is measured horizontally from the center of DPR footprint to GR gates’ center. This is necessary to account for the non-uniform power distribution within the DPR beam. Due to this process, vertical resolution of DPR data and horizontal resolution of GR data are both decreased. This procedure produces an output which is a set of vertical profiles aligned along the DPR beam with samples points located at height of each intersection of GR sweep with DPR beam. All variables from GR and DPR are averaged following the same procedure. The reflectivity factors are averaged in linear scale and converted back to logarithmic scale. The minimum detection threshold for both KuPR and KaPR is 18 dBZ [3]. Therefore, reflectivity values above this level are only considered in averaging within the matched volume.

3. Results and discussions

Over a total of 250 GPM overpass cases with NEXRAD radars mentioned in Section 2.2 have been studied. Precipitation data from April 2014 to June 2018 have been used. Reflectivities without attenuation correction from DPR are not considered in the comparison. GPM overpasses are carefully chosen such that enough precipitation was present within the intersection of KuPR swath and 100 Km range of GR. Three statistical indices are selected for evaluating GPM observations and products with respect to GR. Mean Bias (MB) is used to observe systematic bias in measurements. Mean Absolute Error (MAE) is used to quantify the average magnitude of error. Pearson’s correlation coefficient is used to measure how well the two observations match with each other. Mathematically they can be written as
M B = 1 N n = 1 N ( Z D P R n Z G R n )
M A E = 1 N n = 1 N ( Z D P R Z G R )
C o r r = n = 1 N ( Z G R Z G R ¯ ) ( Z D P R Z D P R ¯ ) n = 1 N ( Z G R Z G R ¯ ) 2 ( Z D P R Z D P R ¯ ) 2
where N is the total number of samples and the subscript n implies nth sample. Since Z G R and Z D P R are in logarithm scale, Z G R ¯ = 1 N n = 1 N Z G R n is actually the geometric mean of equivalent reflectivity factor from all GR samples. Similarly, Z D P R ¯ = 1 N n = 1 N Z D P R n is the geometric mean of equivalent reflectivity factor from all samples from DPR.

3.1. Comparison of Radar Reflectivity

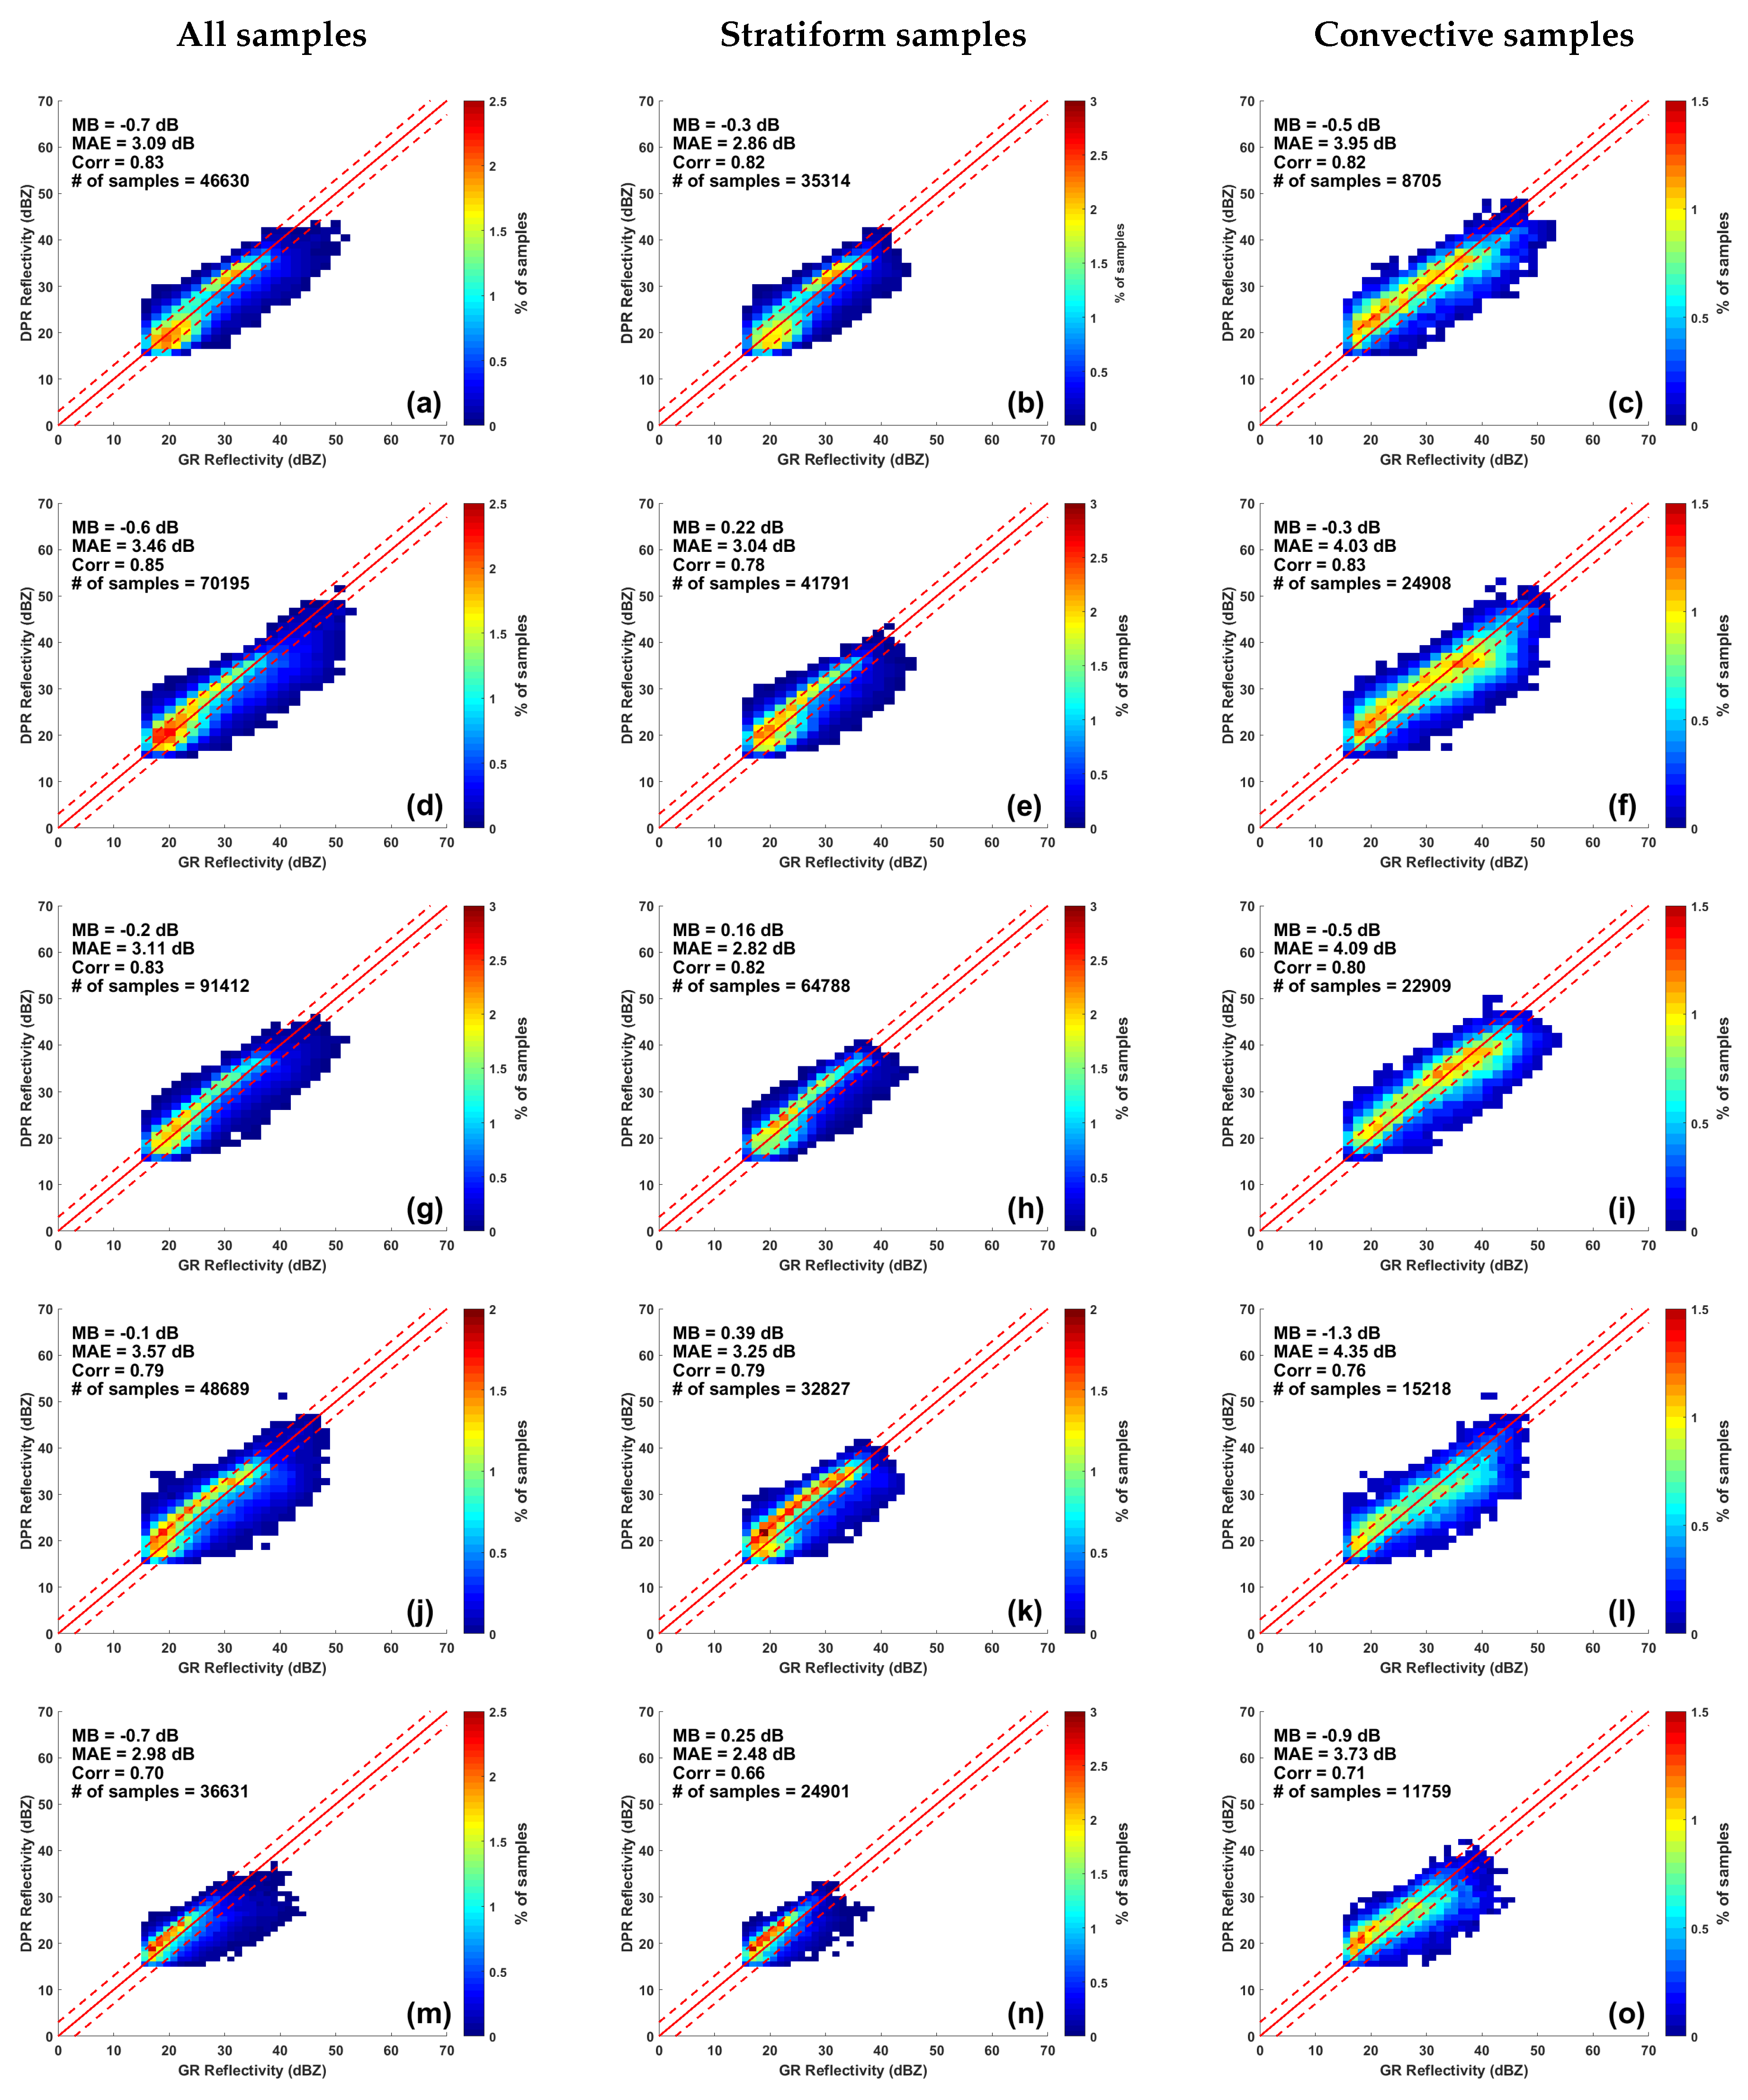
Volume matched reflectivity from NEXRAD radars is compared against volume matched attenuation corrected reflectivity from DPR Ku-band and Ka-band band. Volume matched samples below bright band are chosen so that the comparison is limited to rain region. Figure 4 and Figure 5 shows example of DPR and GR reflectivity scatter diagrams at the 5 NEXRAD location sites for all GPM overpass data samples.
Attenuation in DPR outer swath is corrected by a combination of Surface Reference Technique (SRT) and Hitschfeld and Bordan (HB) method [45] while in inner swath a modified HB-SRT-DFR method [27] is used. These correction methods do not always work well for heavy precipitation [27]. Thus, to better understand the effectiveness of attenuation correction, volume matched samples are further classified into stratiform and convective rain. DPR data are flagged according to the precipType flag from Profile Classification Module of the DPR Level 2 algorithm. A dual-frequency method [46] is applied in the inner swath where both Ku- and Ka-band data are available. In the outer swath, a single frequency approach [47] is adopted.For GR data classification, matched volume samples are chosen according to the DPR classification algorithm. The first column of both Figure 4 shows scatter density plot between attenuation corrected KuPR reflectivity and GR reflectivity when all volume matched samples are considered together. The second and third column are similar but only for stratiform and convective volume matched samples, respectively. Figure 5 is same as Figure 4 but for attenuation corrected KaPR reflectivities. Statistical scores together with the number of samples used are shown on each plot. From both Figure 4 and Figure 5, It can be observed that, even though there are differences between DPR and GR matched samples, data are heavily clustered along the 1:1 line and within the bounds of ± 3 dB lines. Statistical scores shown on the scatter plots are summarized in Table 2.
In Section 2.3, it is shown that Ku-band reflectivities can be 2 to 3 dB greater in rain region. From Table 2, it can be seen, when all samples are considered, for GPM Ku-band an overall positive MB near to zero is observed at each GR site. The MAE lies between 2 and 3 dB. These systematic differences agree with the simulation results. For all radars, the correlation between samples lie around 0.9 which indicate the DPR Ku-band reflectivities are well matched with GR. Similar results for MB and correlation are also reported in [19,20]. When Ka-band is considered, a negative MB can be seen for all radar sites, which means that the overall reflectivities observed at Ka-band is lower than GR S-band. This is also is agreement to the simulation study presented in Section 2.3. The correlation between matched samples at all the radar sites lie between 0.7 and 0.85 implying that with respect to GR, Ka-band samples are not matched as good as Ku-band. The decrease in correlation can be accounted for the attenuation correction algorithm not being as effective as it is for Ku-band. Lower correlations also affected the MAE for Ka-band which are larger compared to Ku-band and lies in the range of 3 to 3.5 dB. However, the errors are still within bounds for the Ka-band and S-band reflectivity difference reported in Section 2.3. When rain profile classification is considered, the correlations between DPR Ku-band and GR matched stratiform samples at all radar sites is observed to be almost similar to that of convective samples. However, the mean correlation considering all radar sites is found to differ by a small margin of 0.03. Similar trend can be observed at Ka-band. The mean biases of Ku-band stratiform samples at all radar sites is positive whereas, two deviations can be observed for Ku-band convective samples for radars KHGX and KMLB. Both these radars are located at sea level and experiences heavy convective events resulting from tropical storms. The attenuation correction may be underestimating the true reflectivity giving rise to negative biases. It is interesting to note that the mean biases of convective samples at Ka-band are negative whereas they show a positive trend in case of stratiform samples other than at KFWS radar site. In case of stratiform rain, reflectivity at S-band is generally lower than 35 dBZ. The scattering simulation presented in Section 2.3 shows that Ka-Band reflectivity can be up to 1 dBZ higher corresponding to S-band range of 15 dBZ to 35 dBZ. This can be correlated with the positive trend. The MAE of both DPR Ku-band and Ka-band for both types of rain are within the difference limit as noted from scattering simulation results. It is also worthwhile to mention that the GPM profile classification algorithm also classifies rain into a third category named “other” for profiles which are neither stratiform nor convective [46]. In this study, the ‘all samples’ case contains samples from these 3 types of rainfall. Case study for ‘other’ type classification is not shown separately since this type contributes a very small percentage to the total rainfall profiles. However, nevertheless, when considered together with the other two types, correlation is improved by a very small factor in most cases.

3.2. Absolute Calibration of Ground Radars with Respect to DPR

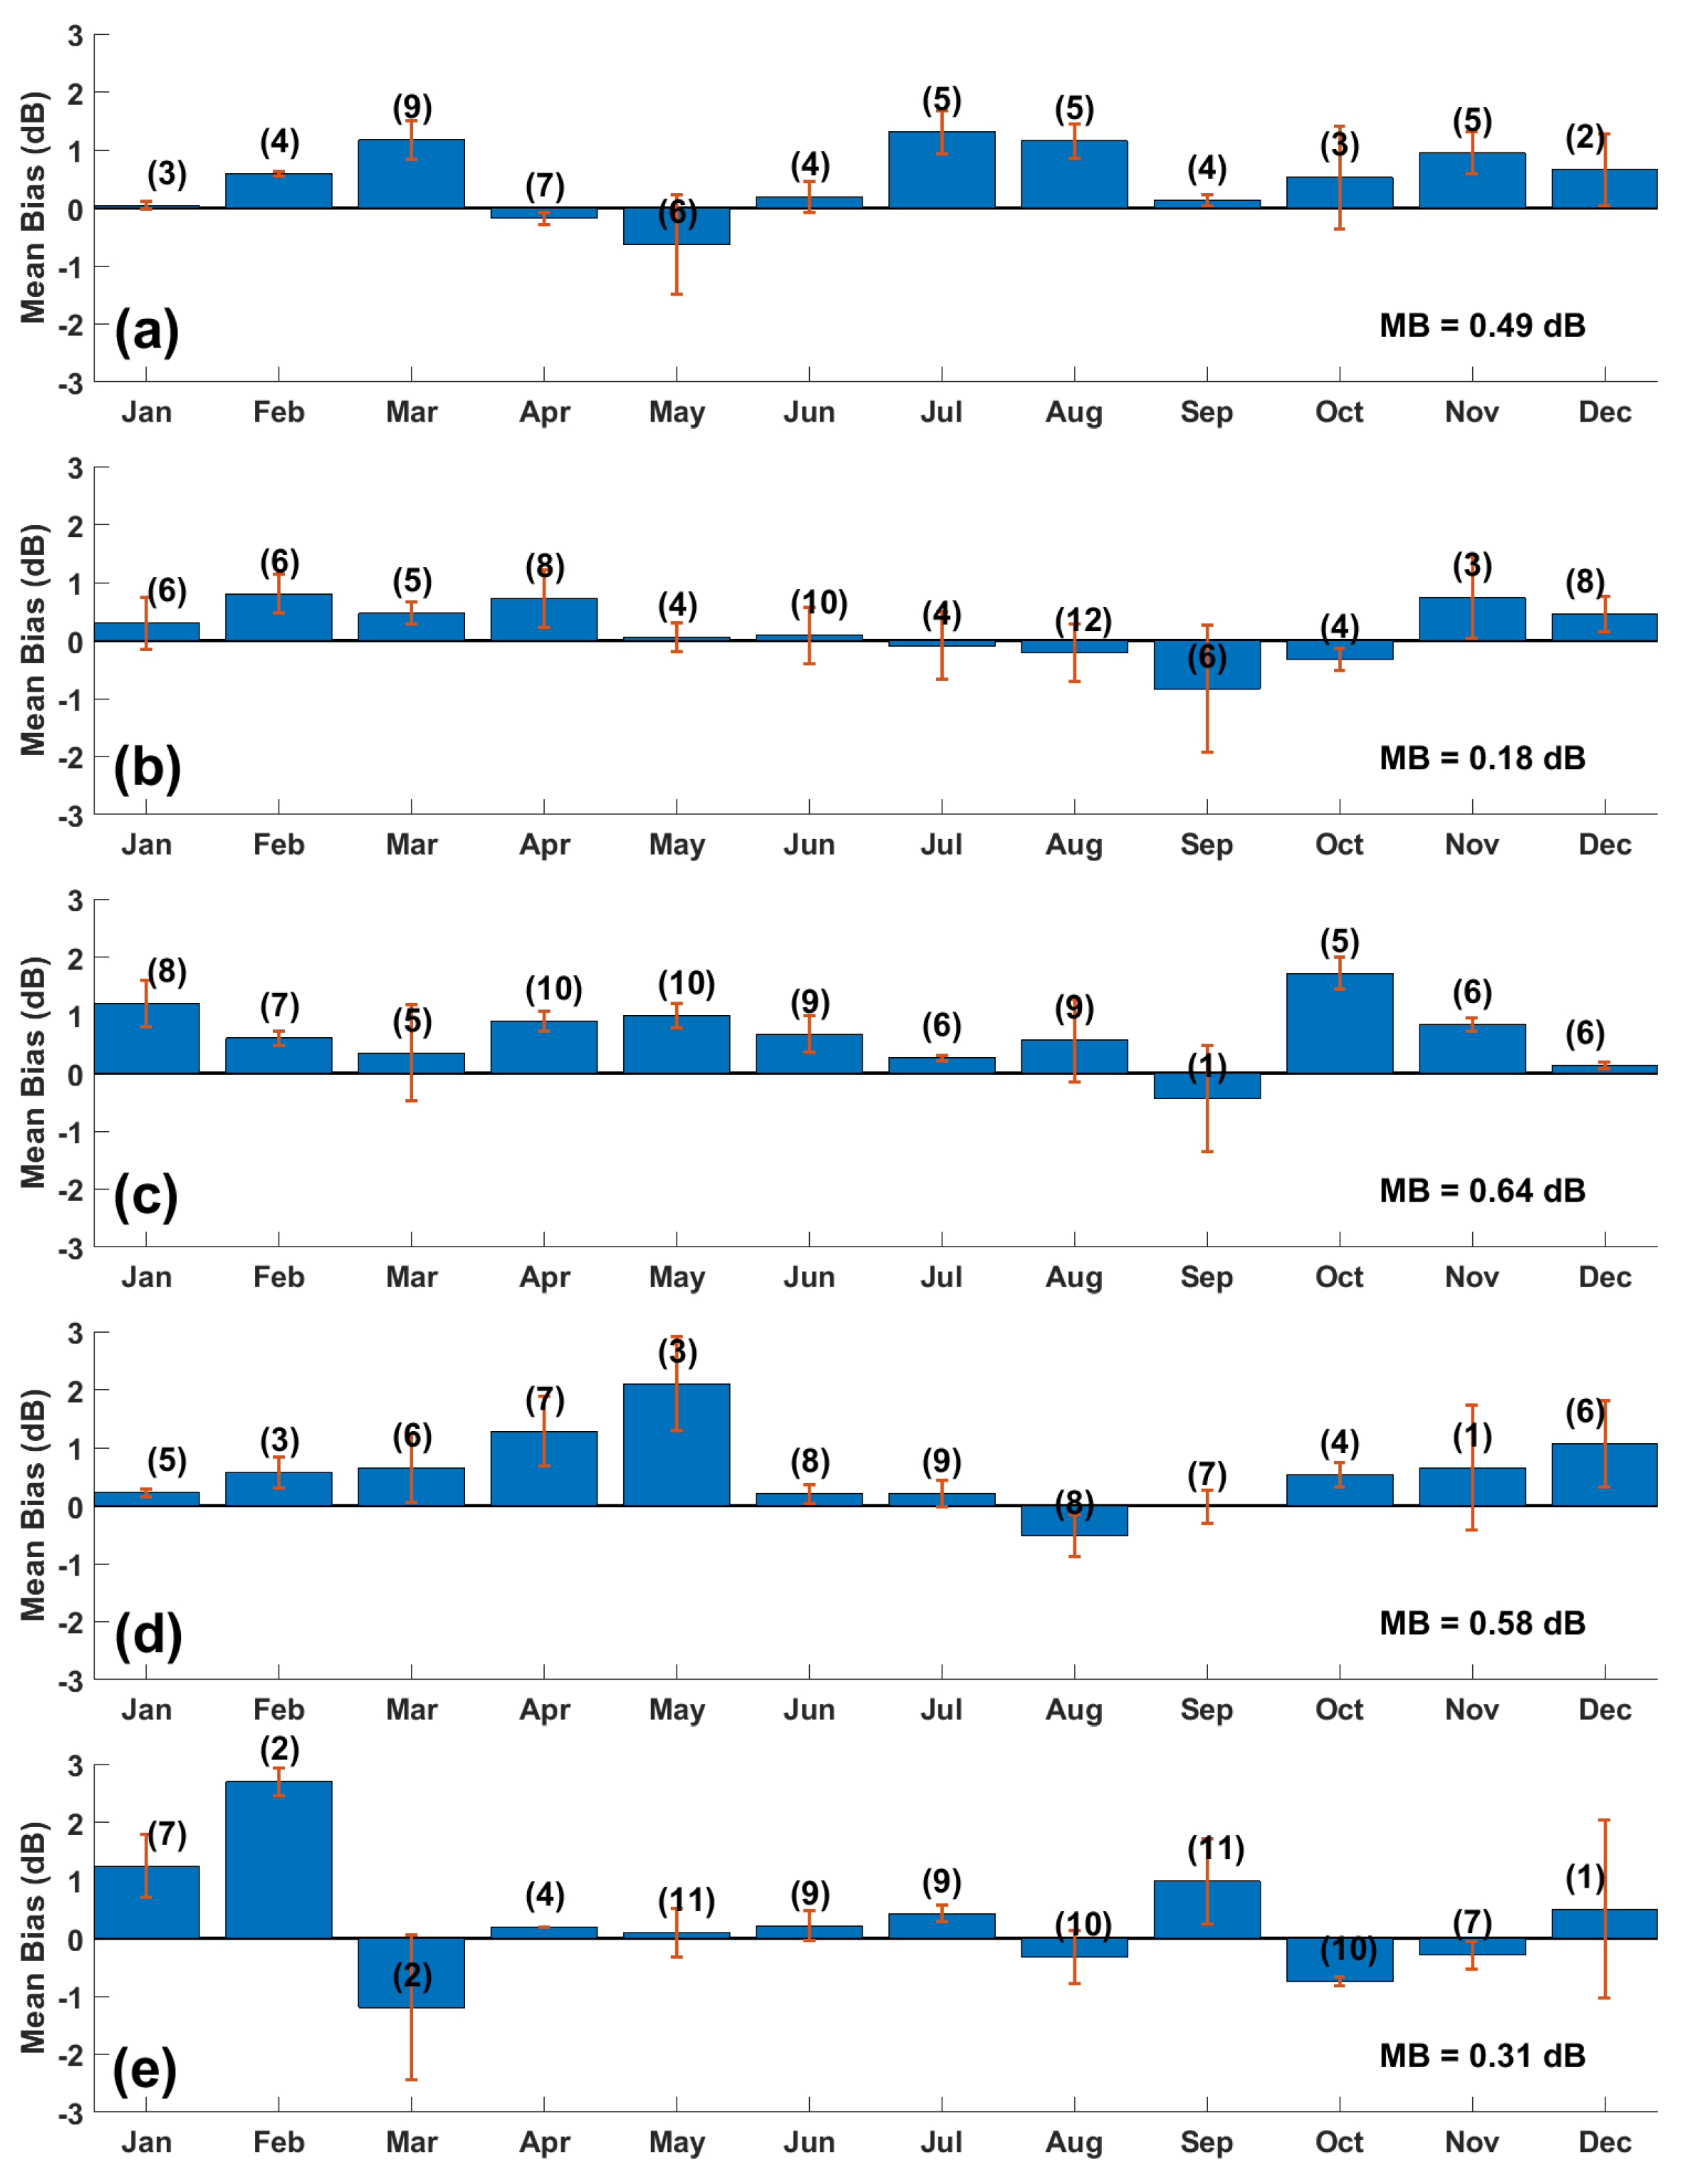
One of the potential useful applications of the GPM-DPR data is to track the absolute calibration of ground radars over time. In this study, calibration errors of ground radars are studied with respect to the DPR Ku-band measurements. Figure 6 presents the DPR-GR mean difference for each month for all 5 NEXRAD radars over a period of year 2014 to 2018. When considering bias month wise, the Ka-band sample size can be very low in each case. It is very difficult to have GPM overpasses which has significant amount of precipitation present in the inner swath. Moreover, in many cases, the inner swath falls outside the 100 Km range of GR. Due to these reasons along with the performance issues of attenuation correction at Ka-band, only Ku-band has been considered for studying the time series of monthly bias.
In Figure 6, MB for each radar over the months are shown in blue bars with red lines on top representing standard deviation. It can be seen that the calibration of all radars is relatively stable over the time period with occasional jumps of a few dB at some radar sites. The MB is seen to vary from −1.1 dB to 2.5 dB. Other than factors such as difference in back scattered power at higher frequency and DPR attenuation correction algorithm performance, rainfall climatology can be a significant factor for the variability of MB over different months. The southeastern part of USA experiences a wide range of weather events, from severe thunderstorms, wide spread stratiform and mesoscale convective systems to tropical cyclones. During spring, sharp changes in temperature gradient along with varying humidity facilitate development of hail producing thunderstorms. The summer season is typically warm and moist and characterized by frequent convective thundershowers. During late summer, tropical cyclones also cause torrential rainfall upon interacting with frontal systems [48]. During the cooler months, it experiences comparatively light rainfall from widespread stratiform events. The DPR-GR bias is mostly positive and near to zero during this season which can be noticed in case of KFWS, KSHV and KLIX radars. The KMLB radar shows an exception of high positive bias for the month of February. It should be noted that there are only two overpasses for this month which might not be sufficient for truly capturing the nature of the bias. Also, in convective precipitation, when the Ku-band signal attenuation is significant the correction algorithm can sometime change the raw radar reflectivity by a factor of 10 compared to the corrected value (Iguchi et al. 2000). During light rain events, the DPR’s SRT can sometimes yield negative amount of attenuation correction (Schwallar and Morris 2011). This might be a reason of negative DPR-GR bias which can be noticed for some of the cool season months for radars KHGX, KLIX and KMLB. A noticeable deviation can be observed in case of KFWS radar which shows negative bias for the month of May. The Dallas Fort Worth region is known for observing damaging hail storms during the summer. This can be the cause for the heavy attenuation of Ku-band signal and poor performance of the attenuation correction algorithm. Nevertheless, errors in GR hardware systems during these overpass events can be another cause for sudden jumps in biases.

3.3. Comparison of Instantaneous Rainfall Rate

Volume matched samples of instantaneous rainfall rate product from GPM-DPR are compared against volume matched samples of retrieved rainfall rate from ground radar. Rainfall rate retrieval from DPR is based on the algorithm described in [10,11]. In the outer swath Ku-only retrieval process [10] is used similar to TRMM whereas in the inner swath a dual-frequency approach [10,29] is adopted. The algorithm used to retrieve rainfall from ground radars is based on [49] which is a blended product of different dual-pol estimators. More detailed description of the algorithm can be found in [49]. This algorithm has been developed for precipitation characteristic in the southern and southeastern plains. This algorithm’s high performance with respect to rain gauges is also shown in [49].
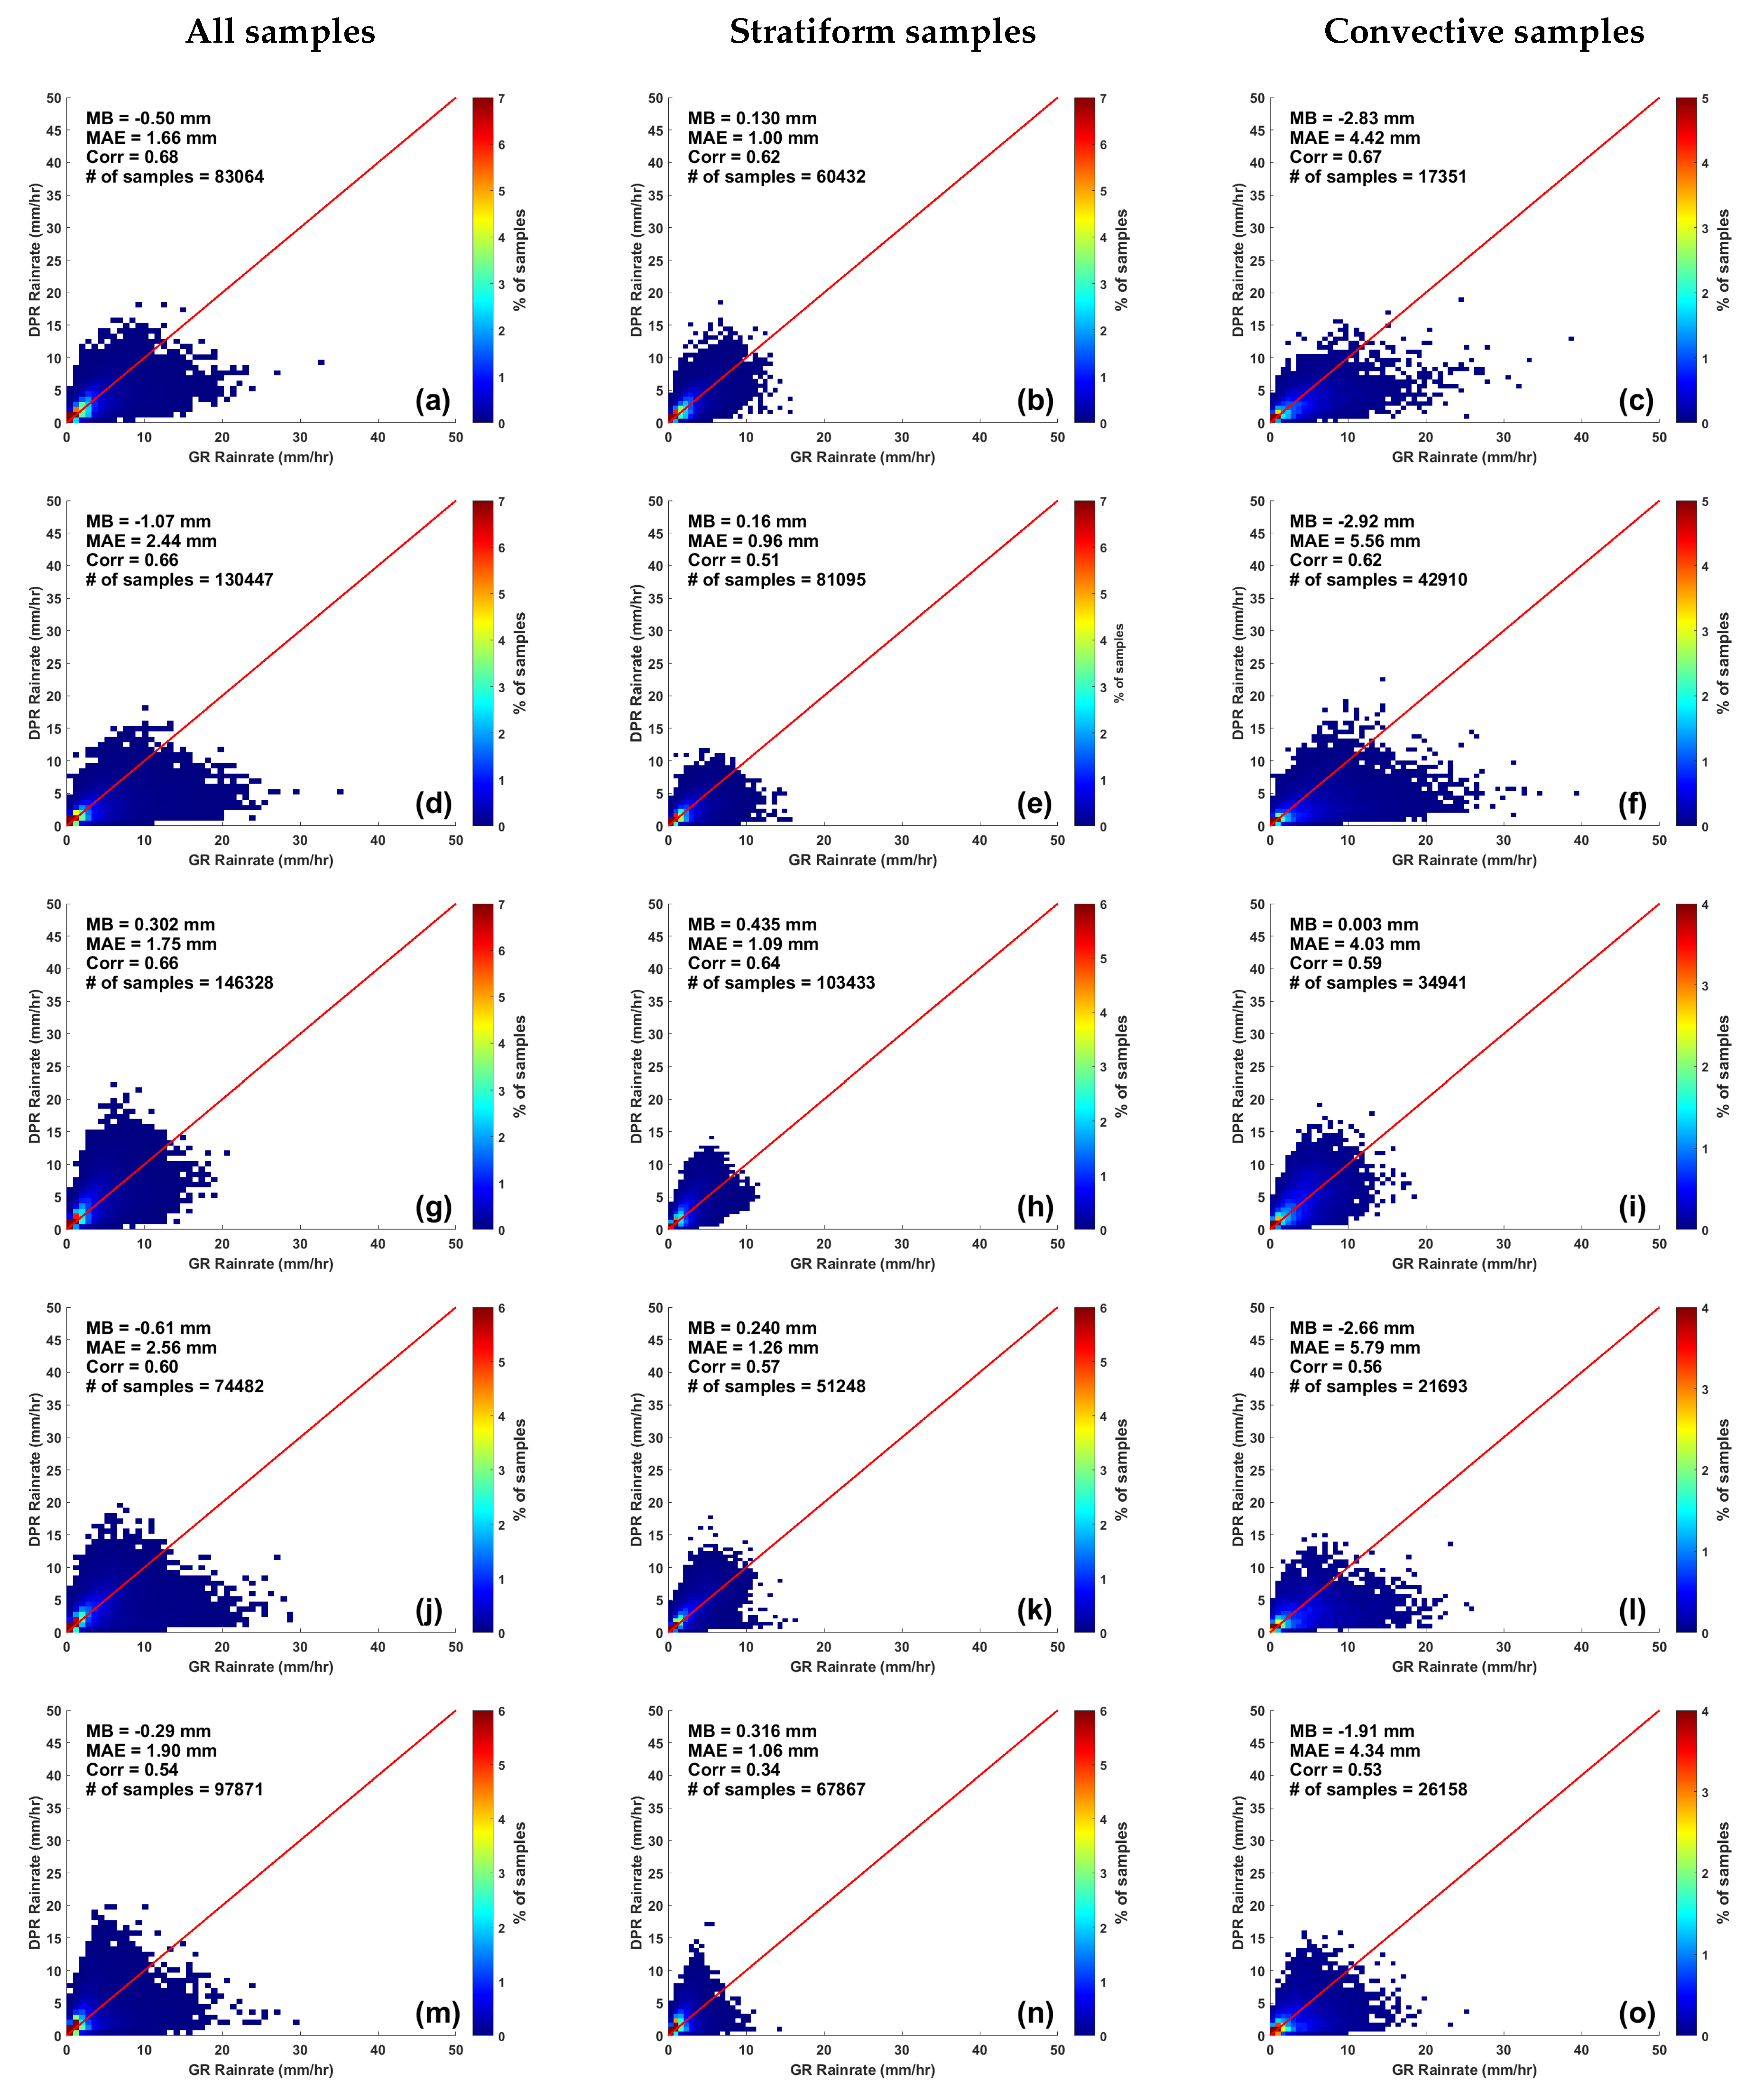
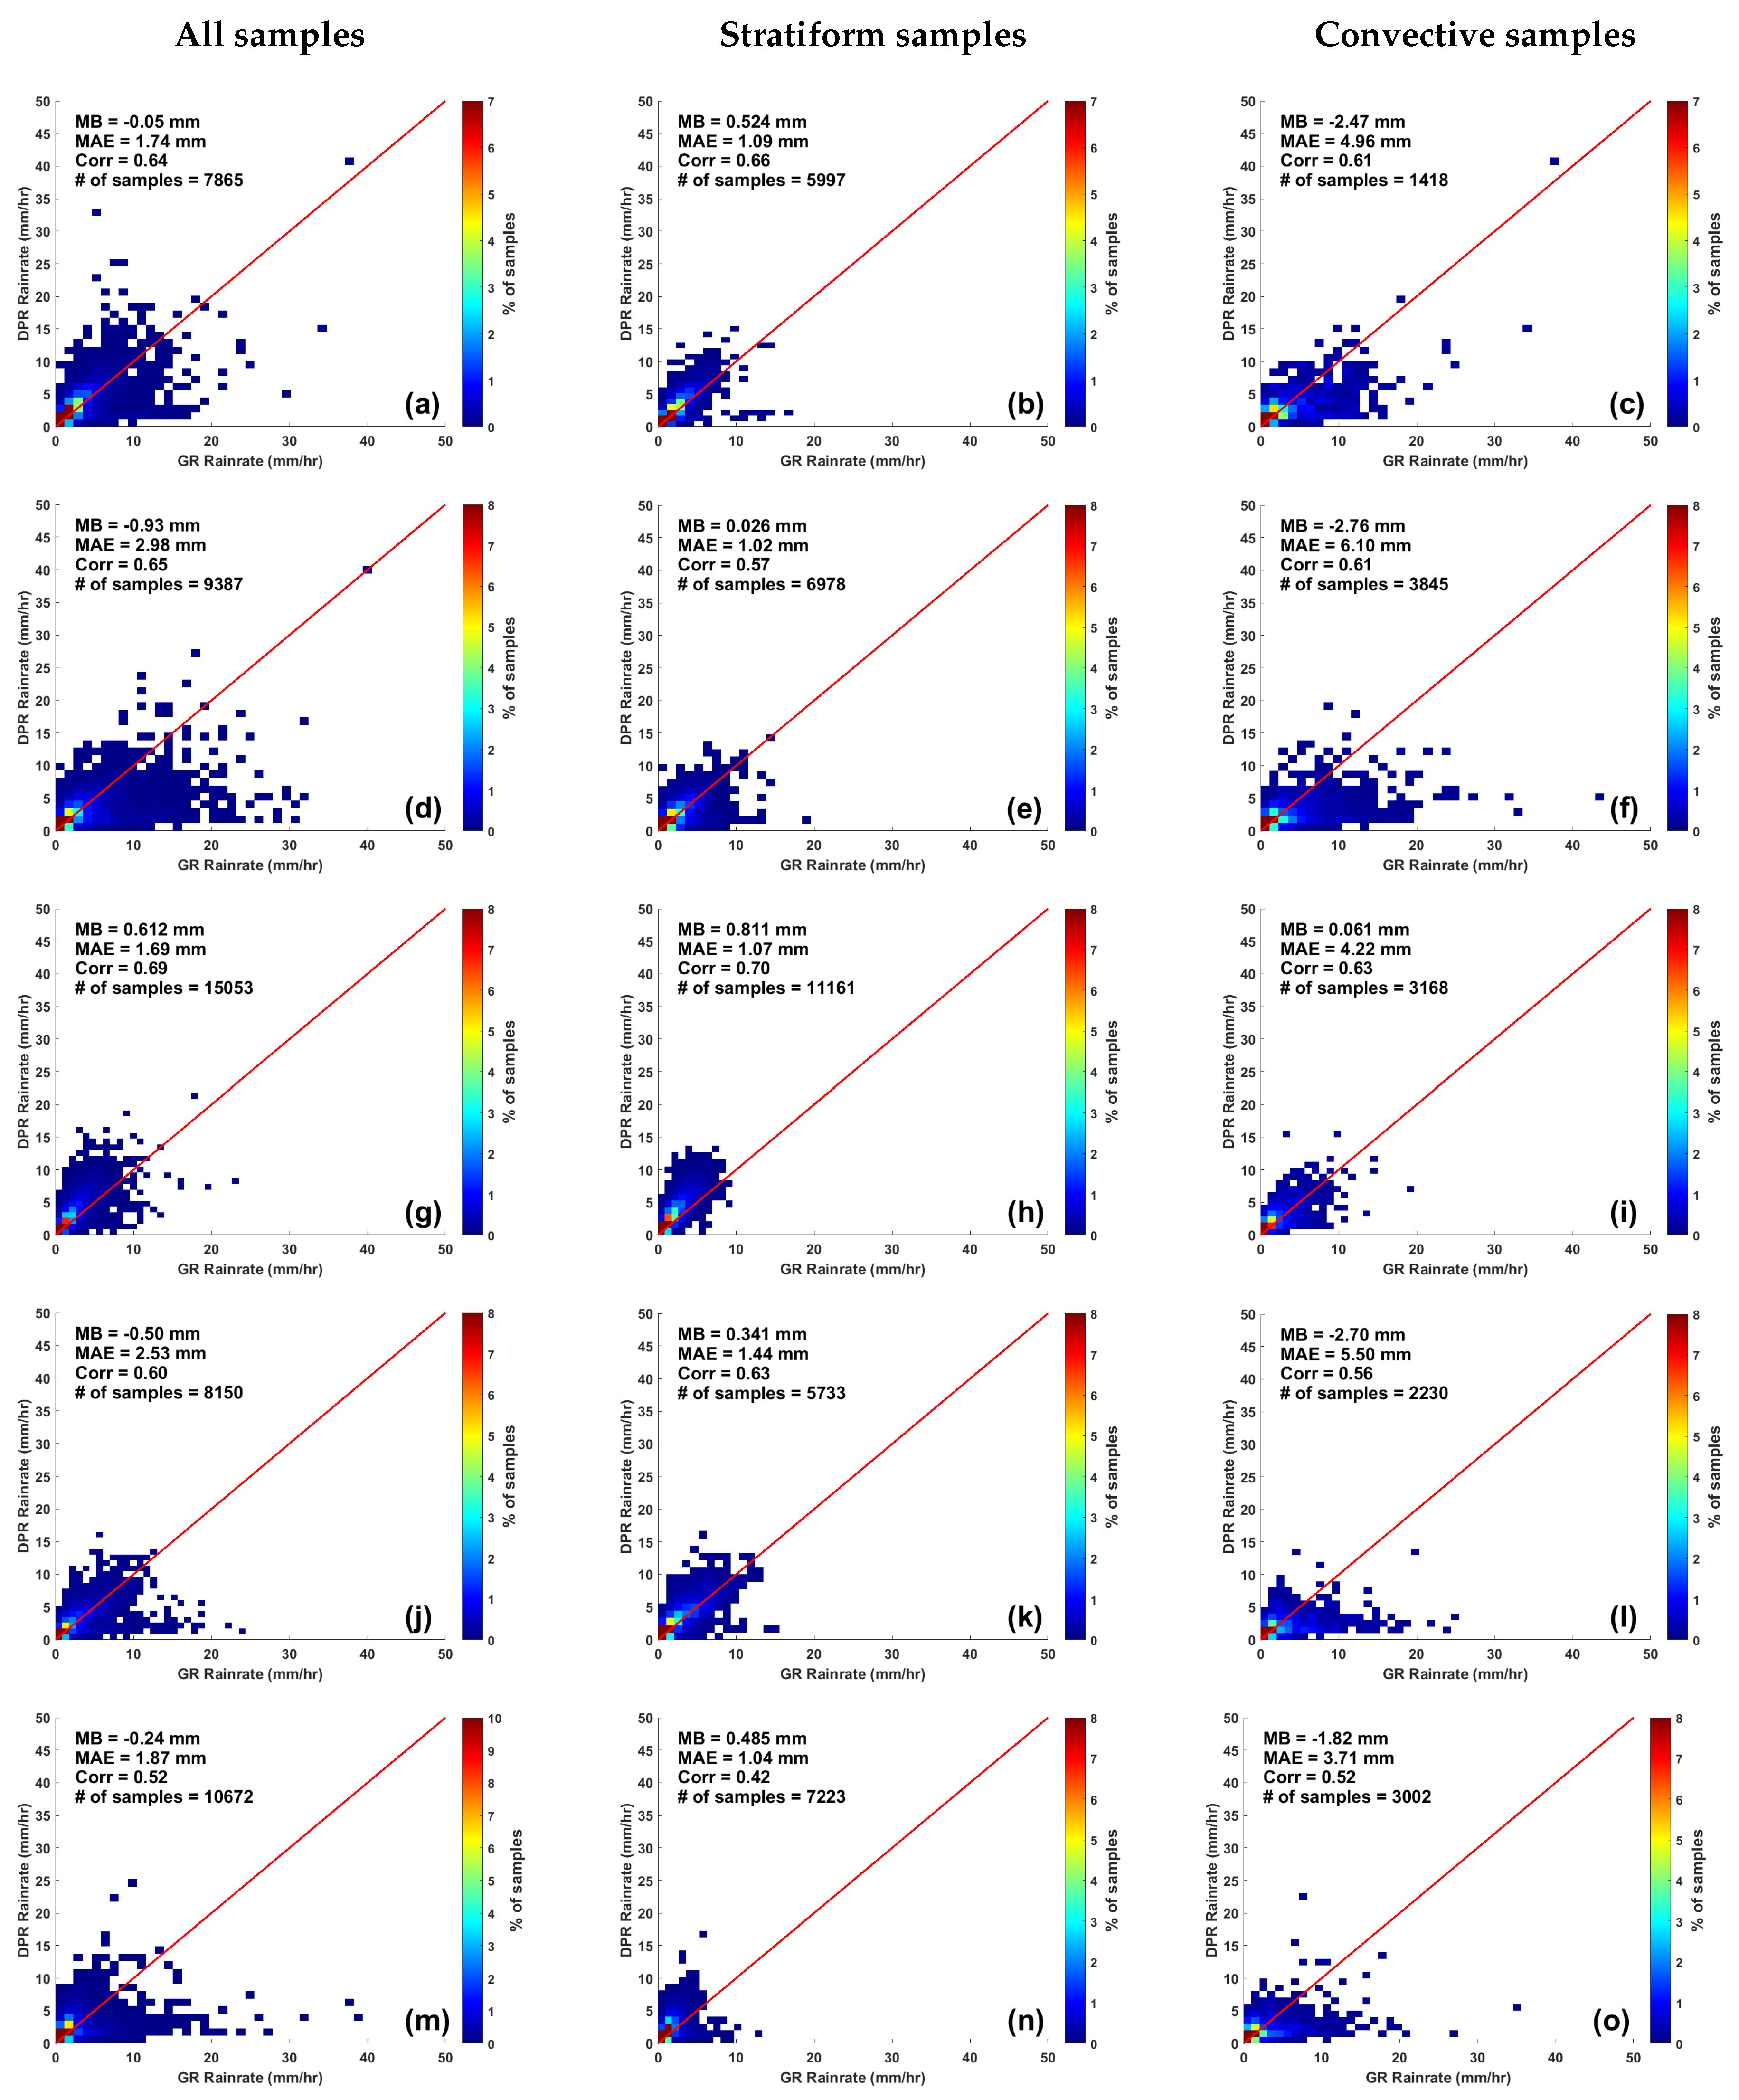
Figure 7 shows the scatter density plots between matched samples of DPR Ku-only rain-rate and GR rain-rate at each GR site. Figure 8 also shows scatter density plots of matched rain-rates samples but with DPR dual-frequency product. The samples are again classified according to rain type. The first column of both Figure 7 and Figure 8 represents scatter plots from all matched samples, while the second column and third column represent stratiform and convective samples, respectively. It can be seen that lower rain-rate samples (0.1 to 3 mm/h) are more clustered around the 1:1 line. For higher rain-rates the samples diverge from 1:1 line. Statistical induces are summarized in Table 3. Mean biases for the Ku-only product varies between −1.7 to 0.3 mm/h. The corresponding mean biases for the dual-frequency product decreased for all the radar sites except KSHV. Overall, this implies that both DPR Ku-only and dual-frequency underestimates rainfall expect at KSHV site. The MAE for Ku-only product varies between 1.66 to 2.56 mm/h whereas for dual-frequency product the error magnitude increases which is from 1.69 to 2.98 mm/h. The correlation of the matched samples for both products varies in the range of 0.5 to 0.7. This result, particularly for Ku-only product, is consistent with findings from [50,51,52]. When considering stratiform samples alone, mean biases are found to decrease. They are in the range of 0.13 to 0.43 mm/h for Ku-only product and 0.02 to 0.81 mm/h for dual-frequency products. The MAEs are also lower and are in range of 1 to 1.5 mm/h. However, for convective cases both products do not show satisfactory performance compared to GR rain-rate estimates. The error magnitude is as high as 5.56 mm/h for Ku-only product and 6.10 mm/h for dual-frequency product. Except at the KSHV radar site, mean biases for both products are also seen to increase towards negative indicating high underestimation of DPR rainfall rates. At KSHV radar site, for all cases, the MB is found to be positive indicating the GR rainfall estimates are low compared to DPR products. This might be due to under performance of the dual-pol retrieval algorithm at this site. The overall poor performance of DPR rainfall products in convective case can be due several factors such as DPR attenuation error and non-uniform beam filling effect at Ku- and Ka-bands. Moreover, convective precipitation can be very localized resulting in precipitation cells smaller than the DPR horizontal resolution of 5 Km. This adds additional uncertainty in rainfall estimation.

4. Summary and Conclusions

In this study, GPM-DPR’s reflectivity measurements at both Ku- and Ka-band and rainfall rate products are cross validated against 5 dual-pol ground-based radar from the GPM GV network. Ground radars located in the plains are chosen to avoid difficulties in precipitation observation over complex terrain. Over 250 GPM overpasses from April 2014 to June 2018 containing significant precipitation are studied. To reduce temporal mismatch, GR data is chosen such that the time difference between GR sweeps and the DPR overpass time is less than 5 min. Scattering simulation has also been performed to get an idea of ideal relationship between S-band, Ku-band, and Ka-band reflectivities in rain. The comparison procedure requires a volume matching technique to be applied on data from both GPM-DPR and ground radar. The methodology averages gates within a common volume at each DPR beam with GR sweeps. DPR data is only linearly averaged vertically along the beam whereas the GR data is inverse weighted averaged within DPR’s footprint which is about 4.9 Km in diameter. Outcome of this methodology is matched DPR and GR samples located at each intersection points. The advantage of this technique over a common grid re-sampling are that there is no interpolation or extrapolation of the data. So, both DPR and GR have matched data taken at locations of actual observation.
Comparison study of matched DPR and GR reflectivity samples showed good agreement with correlation up to 0.9 at Ku-band and 0.85 at Ka-band. To better understand the correlation, samples are divided into stratiform rain and convective rain. The study revealed that stratiform samples are more correlated compared to convective samples. This is due to under performance of DPR attenuation correction algorithm in heavy precipitation. At all radar locations, mean biases for Ku-band is found to be positive while for Ka-band it is found to be negative. This is in well agreement to the simulated results. The MAEs are also within the difference limit found from simulations which is up to 3 dB for Ku-band and up to 5 dB for Ka-band. Though simulation results confirm the cause of difference in reflectivities, other factors such as attenuation correction, nonstandard GR beam refraction and errors in geometric match-up process should be considered as well. Other potential source of error is the time difference between DPR and GR samples. It can be reduced by applying advection correction to the GR data, but it has not been attempted in the present study. Next, absolute calibration of the 5 ground radars are tracked over the months using all GPM overpass data used in this study. Periods of relative stability in calibration have been observed with occasional variation in mean biases which can accounted for precipitation type variability across all seasons. Sudden jumps in MB is particularly noticeable in radars KSHV, KLIX and KMLB. The cause can be a combination of attenuation correction error and fewer GPM overpass for that specific month. Comparison of the volume matched rainfall rate samples revealed that the performance of DPR Ku-only product and dual-frequency product are similar for all the radars with correlation ranging from 0.52 to 0.69. The magnitude of error is higher for dual-frequency product compared to Ku-only product. It is also noticed that with higher rain rates the correlation of both Ku-only and dual-frequency product falls. Upon comparing samples classified by rain type, it is observed both DPR products greatly underestimate heavy convective rainfall by a margin of 5 to 6 mm/h at specific radar sites. In case of stratiform rain error magnitudes lying within 1.5 mm/h suggest far better performance of DPR products compared to convective rain. When considering all samples, the overall rainfall performance is found to be satisfactory. Although the GPM attenuation correction algorithm has performance issues and looking at reasonable agreement between reflectivities, it can be said that there are issues in the conversion of reflectivity into rainfall rate which could be improved to achieve more accurate rainfall estimation from GPM-DPR.

Author Contributions

Formal Analysis, Software, Writing and Original Draft Preparation was done by S.K.B. Conceptualization, Supervision, Validation, Editing and Review was done by V.C.

Funding

This project is funded by the NASA GPM program.

Acknowledgments

The authors acknowledge the data sources from the GPM program and the NOAA for the ground radar.

Conflicts of Interest

The authors declare no conflict of interest.

References

  1. Kummerow, C.; Barnes, W.; Kozu, T.; Shiue, J.; Simpson, J. The tropical rainfall measuring mission (TRMM) sensor package. J. Atmos. Ocean. Technol. 1998, 15, 809–817. [Google Scholar] [CrossRef]
  2. Liu, Z.; Ostrenga, D.; Teng, W.; Kempler, S. Tropical Rainfall Measuring Mission (TRMM) precipitation data and services for research and applications. Bull. Am. Meteorol. Soc. 2012, 93, 1317–1325. [Google Scholar] [CrossRef]
  3. Hou, A.Y.; Kakar, R.K.; Neeck, S.; Azarbarzin, A.A.; Kummerow, C.D.; Kojima, M.; Oki, R.; Nakamura, K.; Iguchi, T. The global precipitation measurement mission. Bull. Am. Meteorol. Soc. 2014, 95, 701–722. [Google Scholar] [CrossRef]
  4. Furukawa, K.; Nio, T.; Konishi, T.; Oki, R.; Masaki, T.; Kubota, T.; Iguchi, T.; Hanado, H. Current status of the dual-frequency precipitation radar on the global precipitation measurement core spacecraft. In Sensors, Systems, and Next-Generation Satellites XIX; International Society for Optics and Photonics: Bellingham, MA, USA, 2015; Volume 9639. [Google Scholar]
  5. Senbokuva, Y.; Satoh, S.; Furukawa, K.; Koiima, M.; Hanado, H.; Takahashi, N.; Iguchi, T.; Nakamura, K. Development of the spaceborne dual-frequency precipitation radar for the Global Precipitation Measurement mission. In Proceedings of the 2004 IEEE International Geoscience and Remote Sensing Symposium, IGARSS’04, Anchorage, AK, USA, 20–24 September 2004; IEEE: Piscataway, NJ, USA, 2004; Volume 5. [Google Scholar]
  6. Draper, D.W.; Newell, D.A.; Wentz, F.J.; Krimchansky, S.; Skofronick-Jackson, G.M. The global precipitation measurement (GPM) microwave imager (GMI): Instrument overview and early on-orbit performance. IEEE J. Sel. Top. Appl. Earth Obs. Remote Sens. 2015, 8, 3452–3462. [Google Scholar] [CrossRef]
  7. Liao, L.; Meneghini, R. A study on the feasibility of dual-wavelength radar for identification of hydrometeor phases. J. Appl. Meteorol. Climatol. 2011, 50, 449–456. [Google Scholar] [CrossRef]
  8. Le, M.; Chandrasekar, V.; Biswas, S. An algorithm to identify surface snowfall from gpm dpr observations. IEEE Trans. Geosci. Remote Sens. 2017, 55, 4059–4071. [Google Scholar] [CrossRef]
  9. Chandrasekar, V.; Hou, A.; Smith, E.; Bringi, V.N.; Rutledge, S.A.; Gorgucci, E.; Petersen, W.A.; Jackson, G.S. Potential role of dual-polarization radar in the validation of satellite precipitation measurements: Rationale and opportunities. Bull. Am. Meteorol. Soc. 2008, 89, 1127–1146. [Google Scholar] [CrossRef]
  10. Iguchi, T.; Seto, S.; Meneghini, R.; Yoshida, N.; Awaka, J.; Kubota, T. GPM/DPR Level-2 Algorithm Theoretical Basis Document; Tech. Rep.; NASA Goddard Space Flight Center: Greenbelt, MD, USA, 2010.
  11. Iguchi, T.; Seto, S.; Meneghini, R.; Yoshida, N.; Awaka, J.; Kubota, T.; Kozu, T.; Chandra, V.; Le, M.; Liao, L.; et al. An overview of the precipitation retrieval algorithm for the dual-frequency precipitation radar (DPR) on the global precipitation measurement (GPM) mission’s core satellite. In Earth Observing Missions and Sensors: Development, Implementation, and Characterization II; International Society for Optics and Photonics: Bellingham, MA, USA, 2012; Volume 8528. [Google Scholar]
  12. Kubota, T.; Yoshida, N.; Urita, S.; Iguchi, T.; Seto, S.; Meneghini, R.; Awaka, J.; Hanado, H.; Kida, S.; Oki, R. Evaluation of precipitation estimates by at-launch codes of GPM/DPR algorithms using synthetic data from TRMM/PR observations. IEEE J. Sel. Top. Appl. Earth Obs. Remote Sens. 2014, 7, 3931–3944. [Google Scholar] [CrossRef]
  13. Toyoshima, K.; Masunaga, H.; Furuzawa, F.A. Early evaluation of Ku-and Ka-band sensitivities for the global precipitation measurement (GPM) dual-frequency precipitation radar (DPR). Sola 2015, 11, 14–17. [Google Scholar] [CrossRef]
  14. Khajonrat, D.; Chandrasekar, V. Simulation of spaceborne radar observations of precipitation: Application to GPM-DPR. In Proceedings of the IEEE International Geoscience and Remote Sensing Symposium, IGARSS 2008, Boston, MA, USA, 7–11 July 2008; IEEE: Piscataway, NJ, USA, 2008; Volume 4. [Google Scholar]
  15. Chandrasekar, V.; Khajonrat, D. Simulation of space-borne radar observations of precipitation at ku and ka band. Preprints. In Proceedings of the 34th Conference on Radar Meteorology, Williamsburg, VA, USA, 5–9 October 2009; Volume 7. [Google Scholar]
  16. Speirs, P.; Gabella, M.; Berne, A. A comparison between the GPM dual-frequency precipitation radar and ground-based radar precipitation rate estimates in the Swiss Alps and Plateau. J. Hydrometeorol. 2017, 18, 1247–1269. [Google Scholar] [CrossRef]
  17. Gabella, M.; Speirs, P.; Hamann, U.; Germann, U.; Berne, A. Measurement of Precipitation in the Alps Using Dual-Polarization C-Band Ground-Based Radars, the GPM Spaceborne Ku-Band Radar, and Rain Gauges. Remote Sens. 2017, 9, 1147. [Google Scholar] [CrossRef]
  18. Biswas, S.K.; Chandrasekar, V. Cross validation of observations from GPM dual-frequency precipitation radar with S-band ground radar measurements over the Dallas—Fort worth region. In Proceedings of the 2017 IEEE International Geoscience and Remote Sensing Symposium (IGARSS), Fort Worth, TX, USA, 23–28 July 2017. [Google Scholar]
  19. Warren, R.A.; Protat, A.; Siems, S.T.; Ramsay, H.A.; Louf, V.; Manton, M.J.; Kane, T.A. Calibrating ground-based radars against TRMM and GPM. J. Atmos. Ocean. Technol. 2018, 35, 323–346. [Google Scholar] [CrossRef]
  20. Crisologo, I.; Warren, R.A.; Mühlbauer, K.; Heistermann, M. Enhancing the consistency of spaceborne and ground-based radar comparisons by using beam blockage fraction as a quality filter. Atmos. Meas. Tech. 2018, 11, 5223–5236. [Google Scholar] [CrossRef]
  21. Panegrossi, G.; Casella, D.; Dietrich, S.; Marra, A.C.; Sanò, P.; Mugnai, A.; Baldini, L.; Roberto, N.; Adirosi, E.; Cremonini, R.; et al. Use of the GPM constellation for monitoring heavy precipitation events over the Mediterranean region. IEEE J. Sel. Top. Appl. Earth Obs. Remote Sens. 2016, 9, 2733–2753. [Google Scholar] [CrossRef]
  22. Kidd, C.; Matsui, T.; Chern, J.; Mohr, K.; Kummerow, C.; Randel, D. Global precipitation estimates from cross-track passive microwave observations using a physically based retrieval scheme. J. Hydrometeorol. 2016, 17, 383–400. [Google Scholar] [CrossRef]
  23. Derin, Y.; Anagnostou, E.; Anagnostou, M.N.; Kalogiros, J.; Casella, D.; Marra, A.C.; Panegrossi, G.; Sanò, P. Passive microwave rainfall error analysis using high-resolution x-band dual-polarization radar observations in complex terrain. IEEE Trans. Geosci. Remote Sens. 2018, 56, 2565–2586. [Google Scholar] [CrossRef]
  24. Anagnostou, M.N.; Kalogiros, J.; Nikolopoulos, E.; Derin, Y.; Anagnostou, E.N.; Borga, M. Satellite rainfall error analysis with the use of high-resolution X-band dual-polarization radar observations over the Italian Alps. In Perspectives on Atmospheric Sciences; Springer: Cham, Switzerland, 2017; pp. 279–286. [Google Scholar]
  25. Schwaller, M.R.; Morris, K.R. A ground validation network for the global precipitation measurement mission. J. Atmos. Ocean. Technol. 2011, 28, 301–319. [Google Scholar] [CrossRef]
  26. NASA/JAXA. Precipitation Measurement Missions: Global Precipitation Mission (GPM) Ground Validation System. 2015. Available online: https://pmm.nasa.gov/sites/default/files/document_files/Val_Network_Users_Guide_Vol_2_Nov2015.pdf (accessed on 31 July 2018).
  27. Seto, S.; Iguchi, T. Intercomparison of attenuation correction methods for the GPM dual-frequency precipitation radar. J. Atmos. Ocean. Technol. 2015, 32, 915–926. [Google Scholar] [CrossRef]
  28. Bolen, S.M.; Chandrasekar, V. Methodology for aligning and comparing spaceborne radar and ground-based radar observations. J. Atmos. Ocean. Technol. 2003, 20, 647–659. [Google Scholar] [CrossRef]
  29. Le, M.; Chandrasekar, V. Raindrop size distribution retrieval from dual-frequency and dual-polarization radar. IEEE Trans. Geosci. Remote Sens. 2012, 50, 1748–1758. [Google Scholar] [CrossRef]
  30. Le, M.; Chandrasekar, V.; Biswas, S. Evaluation and Validation of GPM Dual-Frequency Classification Module after Launch. J. Atmos. Ocean. Technol. 2016, 33, 2699–2716. [Google Scholar] [CrossRef]
  31. Biswas, S.K.; Le, M.; Chandrasekar, V. Identification of Snow from GPM-DPR observations and cross validation with S-Band Ground Radar dual polarization measurements. In Proceedings of the 2017 XXXIInd General Assembly and Scientific Symposium of the International Union of Radio Science (URSI GASS), Montreal, QC, Canada, 19–26 August 2017. [Google Scholar]
  32. NASA/JAXA. Global Precipitation Measurement Precipitation Processing System: File Specification for GPM Products. 2018. Available online: https://pps.gsfc.nasa.gov/Documents/filespec.GPM_V5.pdf (accessed on 31 July 2018).
  33. NASA/JAXA. Global Precipitation Measurement Precipitation Processing System: Release Notes for the DPR V5 Level 2 Products. 2017. Available online: https://pps.gsfc.nasa.gov/Documents/V05ReleaseNotes/Caveats_DPRL2_productV05.pdf (accessed on 31 July 2018).
  34. Klazura, G.E.; Imy, D.A. A description of the initial set of analysis products available from the NEXRAD WSR-88D system. Bull. Am. Meteorol. Soc. 1993, 74, 1293–1312. [Google Scholar] [CrossRef]
  35. Maddox, R.A.; Zhang, J.; Gourley, J.J.; Howard, K.W. Weather radar coverage over the contiguous United States. Weather Forecast. 2002, 17, 927–934. [Google Scholar] [CrossRef]
  36. Ryzhkov, A.V.; Giangrande, S.E.; Melnikov, V.M.; Schuur, T.J. Calibration issues of dual-polarization radar measurements. J. Atmos. Ocean. Technol. 2005, 22, 1138–1155. [Google Scholar] [CrossRef]
  37. Waterman, P.C. Symmetry, unitarity, and geometry in electromagnetic scattering. Phys. Rev. D 1971, 3, 825. [Google Scholar] [CrossRef]
  38. Thurai, M.; Huang, G.J.; Bringi, V.N.; Randeu, W.L.; Schönhuber, M. Drop shapes, model comparisons, and calculations of polarimetric radar parameters in rain. J. Atmos. Ocean. Technol. 2007, 24, 1019–1032. [Google Scholar] [CrossRef]
  39. Testud, J.; Oury, S.; Black, R.A.; Amayenc, P.; Dou, X. The concept of “normalized” distribution to describe raindrop spectra: A tool for cloud physics and cloud remote sensing. J. Appl. Meteorol. 2001, 40, 1118–1140. [Google Scholar] [CrossRef]
  40. Baldini, L.; Chandrasekar, V.; Moisseev, D. Microwave radar signatures of precipitation from S band to Ka band: application to GPM mission. Eur. J. Remote Sens. 2012, 45, 75–88. [Google Scholar] [CrossRef] [Green Version]
  41. Bolen, S.M.; Chandrasekar, V. Quantitative Cross Validation of Space-Based and Ground-Based Radar Observations. J. Appl. Meteorol. 2000, 39, 2071–2079. [Google Scholar] [CrossRef]
  42. Anagnostou, E.N.; Morales, C.A.; Dinku, T. The use of TRMM precipitation radar observations in determining ground radar calibration biases. J. Atmos. Ocean. Technol. 2001, 18, 616–628. [Google Scholar] [CrossRef]
  43. Liao, L.; Meneghini, R.; Iguchi, T. Comparisons of rain rate and reflectivity factor derived from the TRMM precipitation radar and the WSR-88D over the Melbourne, Florida, site. J. Atmos. Ocean. Technol. 2001, 18, 1959–1974. [Google Scholar] [CrossRef]
  44. Barnes, S.L. A technique for maximizing details in numerical weather map analysis. J. Appl. Meteorol. 1964, 3, 396–409. [Google Scholar] [CrossRef]
  45. Meneghini, R.; Iguchi, T.; Kozu, T.; Liao, L.; Okamoto, K.I.; Jones, J.A.; Kwiatkowski, J. Use of the surface reference technique for path attenuation estimates from the TRMM precipitation radar. J. Appl. Meteorol. 2000, 39, 2053–2070. [Google Scholar] [CrossRef]
  46. Le, M.; Chandrasekar, V. Precipitation type classification method for dual-frequency precipitation radar (DPR) onboard the GPM. IEEE Trans. Geosci. Remote Sens. 2013, 51, 1784–1790. [Google Scholar] [CrossRef]
  47. Iguchi, T.; Kozu, T.; Meneghini, R.; Awaka, J.; Okamoto, K.I. Rain-profiling algorithm for the TRMM precipitation radar. J. Appl. Meteorol. 2000, 39, 2038–2052. [Google Scholar] [CrossRef]
  48. Konrad, C.E.; Perry, L.B. Relationships between tropical cyclones and heavy rainfall in the Carolina region of the USA. Int. J. Climatol. 2010, 30, 522–534. [Google Scholar] [CrossRef]
  49. Chen, H.; Chandrasekar, V. The quantitative precipitation estimation system for Dallas–Fort Worth (DFW) urban remote sensing network. J. Hydrol. 2015, 531, 259–271. [Google Scholar] [CrossRef] [Green Version]
  50. Omranian, E.; Sharif, H.; Tavakoly, A. How well can global precipitation measurement (GPM) capture hurricanes? Case study: Hurricane Harvey. Remote Sens. 2018, 10, 1150. [Google Scholar] [CrossRef]
  51. Omranian, E.; Sharif, H.O. Evaluation of the Global Precipitation Measurement (GPM) Satellite Rainfall Products over the Lower Colorado River Basin, Texas. JAWRA J. Am. Water Resour. Assoc. 2018, 54, 882–898. [Google Scholar] [CrossRef]
  52. Islam, T.; Rico-Ramirez, M.A.; Han, D.; Srivastava, P.K.; Ishak, A.M. Performance evaluation of the TRMM precipitation estimation using ground-based radars from the GPM validation network. J. Atmos. Sol.-Terr. Phys. 2012, 77, 194–208. [Google Scholar] [CrossRef]
Figure 1. (a) Concept of DPR dual-frequnecy observation. Image source: Senbokuya et al. [5]; (b) GPM-DPR scan strategy. Image taken from GPM Level 2 algorithm theoretical basis document [10].
Remotesensing 10 01773 g001
Figure 2. Relationship between reflectivities simulated at S, Ku, and Ka-band for raindrops using T-Matrix method.
Remotesensing 10 01773 g002
Figure 3. Diagram illustrating viewing geometry of DPR and GR. (a) Intersection of DPR and GR common volumes. (b) Cartoon showing different number of DPR gates at common intersection locations for different GR sweeps. Image adapted from [25].
Remotesensing 10 01773 g003
Figure 4. Scatter density plots of volume matched reflectivity between GPM-DPR Ku-Band and NEXRADs. Solid red line is 1:1 line. Dotted red lines are ±3 dB lines. (ac) KFWS radar; (df) KHGX radar; (gi) KSHV radar; (jl) KLIX radar; (mo) KMLB radar.
Remotesensing 10 01773 g004
Figure 5. Same as Figure 4 but for GPM-DPR Ka-Band.
Remotesensing 10 01773 g005
Figure 6. Bar diagram of monthly DPR-GR mean reflectivity bias with standard deviation for the years 2014 to 2018. Numbers in round brackets signify total number of overpasses for that month from April 2014 to June 2018. (a) KFWS radar; (b) KHGX radar; (c) KSHV radar; (d) KLIX radar; (e) KMLB radar.
Remotesensing 10 01773 g006
Figure 7. Scatter density plots of volume matched rainfall rate between GPM-DPR single frequency product and NEXRADs dual-pol product. Solid red line is 1:1 line. (ac) KFWS radar; (df) KHGX radar; (gi) KSHV radar; (jl) KLIX radar; (mo) KMLB radar.
Remotesensing 10 01773 g007
Figure 8. Same as Figure 7 but for GPM-DPR dual-frequency product.
Remotesensing 10 01773 g008
Table 1. NEXRAD radar stations’ name, location, and altitude (MSL).
NameLocationLat (deg.)Lon (deg.)Altitude (m)
KFWSDallas/Ft. Worth, TX32.5731−97.3031208.17
KHGXHouston/Galveston, TX29.4719−95.07925.48
KSHVShreveport, LA32.4508−93.841483.21
KLIXNew Orleans, LA30.3367−89.82567.31
KMLBMelbourne, FL28.1133−28.654210.66
Table 2. Table summarizing different error statistics for comparison of DPR Ku-band and Ka-band reflectivity vs NEXRAD S-band reflectivity.
All SamplesStratiform SamplesConvective Samples
Ku Band (dBZ)Ka Band (dBZ)Ku Band (dBZ)Ka Band (dBZ)Ku Band (dBZ)Ka Band (dBZ)
RadarMBMAECorrMBMAECorrMBMAECorrMBMAECorrMBMAECorrMBMAECorr
KFWS0.492.380.90−0.73.090.830.672.210.89−0.32.860.820.163.040.88−0.53.950.82
KHGX0.182.440.91−0.63.460.850.392.100.880.223.040.78−0.33.080.89−0.34.030.83
KSHV0.642.400.90−0.23.110.830.612.060.900.162.820.820.03.260.85−0.54.090.80
KLIX0.582.670.88−0.13.570.790.672.300.890.393.250.790.453.490.84−1.34.350.76
KMLB0.312.580.87−0.72.980.700.662.310.830.252.480.66−0.43.280.86−0.93.730.71
Table 3. Table summarizing different error statistics for comparison of DPR single and dual-frequency rainfall rate product vs NEXRAD dual-pol product.
All SamplesStratiform SamplesConvective Samples
Single Frequency
Product (mm/h)
Dual Frequency
Product (mm/h)
Single Frequency
Product (mm/h)
Dual Frequency
Product (mm/h)
Single Frequency
Product (mm/h)
Dual Frequency
Product (mm/h)
RadarMBMAECorrMBMAECorrMBMAECorrMBMAECorrMBMAECorrMBMAECorr
KFWS−0.501.660.68−0.051.740.640.131.000.620.521.090.66−2.834.420.67−2.474.960.61
KHGX−1.072.440.66−0.932.980.650.160.960.510.021.020.57−2.925.560.62−2.766.100.61
KSHV0.301.750.660.611.690.690.431.090.640.811.070.70.004.030.590.064.220.63
KLIX−0.612.560.60−0.52.530.60.241.260.570.341.440.63−2.665.790.56−2.705.500.56
KMLB−0.291.900.54−0.241.870.520.311.060.340.481.040.42−1.914.340.53−1.823.710.52