Article

Comparison of the Vegetation Effect on ET Partitioning Based on Eddy Covariance Method at Five Different Sites of Northern China

1
Department of Hydraulic Engineering, State Key Laboratory of Hydroscience and Engineering, Tsinghua University, Beijing 100084, China
2
Institute of Remote Sensing and Digital Earth, Chinese Academy of Sciences, Beijing 100094, China
3
Department of Geography and Geographic Information Science, University of Illinois at Urbana-Champaign, Urbana, IL 61801, USA
4
China Institute of Water Resources and Hydropower Research, Beijing 100038, China
*
Author to whom correspondence should be addressed.
Remote Sens. 2018, 10(11), 1755; https://doi.org/10.3390/rs10111755
Submission received: 9 October 2018 / Revised: 28 October 2018 / Accepted: 1 November 2018 / Published: 7 November 2018
(This article belongs to the Special Issue Observations, Modeling, and Impacts of Climate Extremes)

Abstract

:
Vegetation exerts profound influences on evapotranspiration (ET) partitioning. Many studies have demonstrated the positive impact of vegetation cover on the ratio of transpiration (T) to ET. Whether it is universally true with regard to different vegetation types and different sites is understudied. In this study, five sites in Northern China with different vegetation types were selected for comparison study.ET partitioning is conducted using an approach based on the concept of the underlying water use efficiency with eddy covariance measurements. The results show various patterns of vegetation’s effects over ET partitioning and, when compared with existing studies, also reveal a new relationship between the T/ET ratio and Normalized Difference Vegetation Index (NDVI) at some of the sites. At the alpine meadow site, the T/ET ratio gradually increase when NDVI is low and rapidly increase as NDVI go beyond a certain value, whereas at the arid shrub site, the T/ET ratio rapidly increase when NDVI is low and plateaus at a certain value when NDVI reaches a relatively high value. In deciduous forest, the T/ET ratio becomes unresponsive to NDVI beyond a threshold value. This study also reveals that irrigation schemes play a major role in determining the correlation between the T/ET ratio and NDVI because the T/ET ratio becomes well correlated with NDVI in case of flood irrigation and irrelevant to NDVI in the case of mulch drip irrigation. Furthermore, this study helps us to understand ET partitioning under different sites and different human activities such as irrigation. These findings can help policymakers to better understand the connection between vegetation and climate change or human activities and provide significant information for water management policy.

1. Introduction

ET, a key process for connecting water, carbon, and energy across various ecosystems [1], consists of evaporation (E) and T from wet surfaces and vegetation through the stomata. Partitioning of ET into biological component T and non-biological component E is of great significance in order to improve our understanding of abiotic and biotic ecosystem processes, such as vegetation water use efficiency, interaction of water, and carbon cycles [2,3,4,5,6]. Terrestrial vegetation has significant impacts on ET partitioning owing to the fact that transpiration accounts for the major portion of ET and is intrinsically linked to photosynthesis or plant productivity [7,8]. Furthermore, how vegetation responds to climate change is complex, particularly under climate extremes such as drought, which makes the relationship between vegetation and ET partitioning more complicated [9,10].
Previously, many efforts have been devoted to investigating the relationship between vegetation and ET partitioning on different spatial and temporal scales [11,12,13,14]. It has been reported that the T/ET ratio fluctuates among different vegetation types [15] and normally increases from grass to shrub to trees. For instance, Moran et al. [16] estimated the T/ET ratio in a grassland and shrub site within the Walnut Gulch Experimental Watershed in southeast Arizona, USA. The outcomes showed that T/ET is higher for the grass-dominated site compared to the shrub-dominated site. Furthermore, some studies also revealed that the T/ET ratio is higher for deep-rooted trees as compared to grasses. Apart from vegetation type, ET partitioning is also significantly associated with vegetation index. The majority of studies in the past stated that T/ET ratio is positively correlated to leaf area index (LAI). For instance, Raz-Yaseef et al. [17] found that the expansion of LAI leads to the increase of transpiration and the decrease of soil evaporation. The isotopic analysis by Wang et al. [12] revealed increments from 0.6 to 0.83 in the T/ET as the vegetation cover increases from 25% to 83%. Zhou et al. [18] found a linear relationship between T/ET and enhanced vegetation index (EVI). Several studies also found that the influence of LAI on ET partitioning is distinctive with different levels of LAI. Liu et al. [19] illustrated that the increase of LAI led to an increase in the T/ET ratio; however, when LAI is over a specific range, the T/ET ratio is insensitive to the change in LAI. In a word, although it is reported that the T/ET ratio and vegetation have a positive correlation in the existing studies, whether it is universally true with regard to different vegetation types and different sites is understudied.
ET partitioning can be commonly achieved by combining different in situ measurements [20], such as EC measurements [21,22,23,24], Bowen ratio [25,26], sap flow [27,28], plant weighing lysimeters [29,30,31], soil chamber measurements [32,33], CO2 and isotopic labeling [34,35,36,37,38], however, there is still huge uncertainty in ET partitioning due to the uncertainty of stomata behavior and a lack of high-density observation [39]. Recently, EC measurement has demonstrated its potential for ET partitioning [40,41,42]. The EC-based approach has several advantages that make it suitable for ET partitioning. First, due to its high frequency, it is capable of capturing small eddies, contributing to the turbulent transfer [43]. Secondly, it measures continuously and could provide long-term measurements, which is valuable for ET partitioning on multiple time scales.
Therefore, the present study aims to examine the relationship between vegetation and T/ET ratio among different sites and vegetation types. For this, five different sites situated in Northern China are selected for the comparison of ET partitioning. ET partitioning is conducted using an approach based on the concept of the underlying water use efficiency with eddy covariance measurements. MODIS-determined NDVI is utilized to represent vegetation dynamics to investigate the relationship of vegetation and ET partitioning. The outcome of this study is also significant as ET partitioning is a crucial process for understanding how vegetation responds to environmental change.

2. Materials and Methods

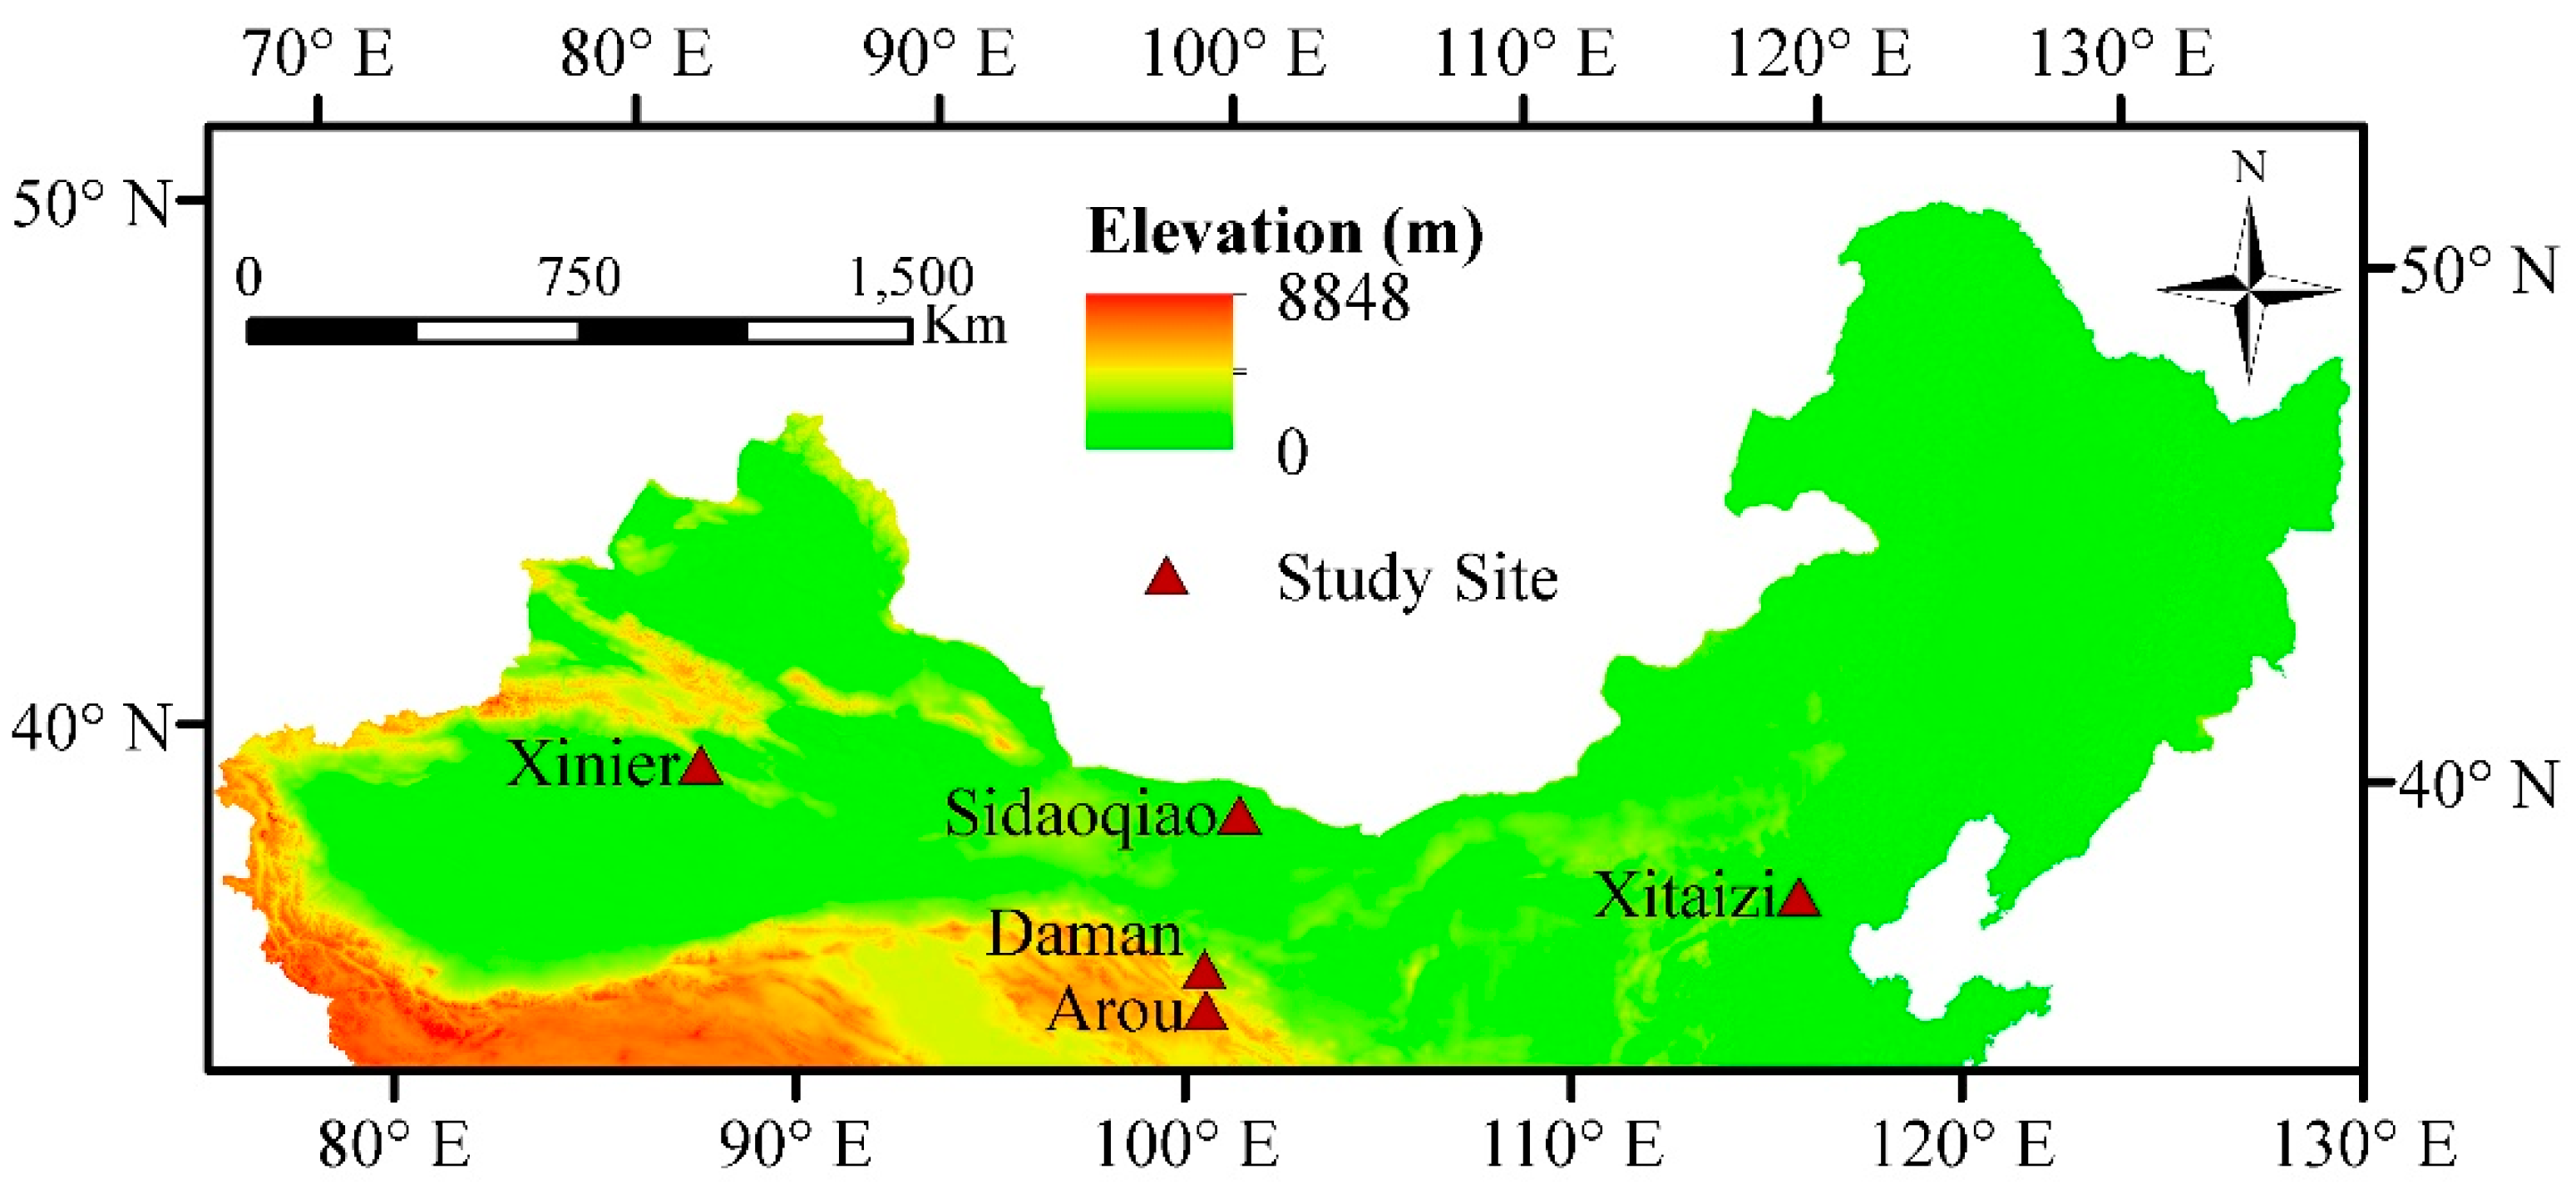
2.1. Description of the Study Area

This study is conducted at five sites in Northern China with different vegetation types, viz., typical arid, semi-arid, and semi-humid ecosystems, and located around 40°N with annual precipitation ranging from 62.0 to 541.0 mm and annual mean temperature varying between −5.0 and 12.5 °C. Alpine meadow, arid shrub, deciduous forest, and crops are the four vegetation types chosen for the present study (Table 1).
Arou is located in a river valley highland on the south of Babao River, upstream of Heihe River (Figure 1) [44]. The climate of this site is a typical highland continental climate characterized by temperature variation. The average annual temperature, precipitation, and evapotranspiration are −5.0 °C, 445.0 mm, and 1300.0 mm, respectively. The site mainly consists of grassland, comprising alpine and mountain meadow. The height of the meadow varies during the year, with 20−30 cm in summer and several centimeters in other periods. The surface and the deeper soil are composed of clay and sandy clay loam, respectively; however, permafrost and seasonally frozen soil also exist in this area.
Daman is a typical irrigation district and lies in an artificial oasis of the middle Heihe River watershed. The average annual temperature and precipitation over the past five decades (1961–2010) are around 5.4 °C and 204.0 mm, respectively, with the annual potential evaporation of 2365.0 mm [45]. Spring wheat and maize (C4 plant) are the major crops in this site, of which spring wheat is generally sown in late March and harvested in the middle 10 days of July, while maize is sown in late April and harvested in the middle 10 days of September [46]. The maximum canopy height and the maximum LAI are 2.1 m and about 5.6 m2m−2, respectively. Flood irrigation is conducted several times during the growing season. The soil is characterized by silty clay loam and silt loam for the surface and deeper layer, respectively.
Sidaoqiao is located in the Ejin Banner desert-oasis downstream of Heihe River watershed. This site represents an extremely arid region with scarce precipitation (116.8 mm per year) and high potential evapotranspiration. The potential evaporation is approximately 3755.0 mm per year and the average temperature is about 9.6 °C per year, with a frost-free period of 165 days [46]. Vegetation covers ranging from 15% to 20% and consists of desert shrubs comprising Populuseuphratica, Tamarix, and other arid region species. The soil is mainly composed of unconsolidated sand and grains and is highly susceptible to wind erosion [47].
Xinier lies on the alluvial plain of the Kaidu‒Kongqi River under the southern foot of Tianshan Mountain and northeast edge of Taklimakan Desert. It is characterized by a typical continental desert climate with average temperature of 12.5 °C and scarce precipitation of 62.0 mm. Annual mean potential evaporation measured with evaporation pan is 2788.0 mm [48]. The major crop of the study area is cotton, which is the main economic crop in Xinjiang Province, China. Cotton is planted in April and harvested from September to November 2012 [49]. Mulched drip irrigation is applied in this site, including surface drip irrigation and film mulching techniques. The depth of frozen soil is approximately 60 cm and the texture of the soil is loam, consisting of 30% sand, 5% silt, and 65% loam.
Xitaizi is located in the headwater area of Miyun Reservoir, the drinking water source for Beijing, China. This site has a continental monsoon sub-humid continental climate, with a hot/humid summer and a cold/dry winter [50]. The annual precipitation is about 541.0 mm and the annual average temperature is 7.5 °C. This site is covered by mixed deciduous forest with aspen (Populusdavidiana) as the major species. The overstory canopy averages a height of 12–13 m and the understory vegetation has a height of 0–1.5 m. Xitaizi site is mostly surrounded by the mountainous region of North China and the main soil types are brown earth and cinnamon soil with a depth of 0–1.5 m.

2.2. Flux Data

Carbon dioxide (CO2) and water vapor fluxes for the five sites were measured by an eddy flux system, while meteorological instruments are used for monitoring precipitation, temperature pressure, and wind speed. The measurements of Arou, Daman, and Sidaoqiao were collected from Heihe Watershed Allied Telemetry Experimental Research (HiWATER) [44]. These three sites are equipped with the instruments placed on a height of 3.15 m, including Campbell LI-COR 7500 for CO2 flux, LI-COR Li7500 for latent heat flux and a Campbell CSAT3 for sensible heat flux. The meteorological tower is equipped with instrumentation including Campbell CS105 for pressure, Vaisala HMP45C for air temperature and relative humidity, Campbell TE525 for precipitation, MetOne for wind speed and wind direction, etc. In Xinier and Xitaizi, eddy covariance measurements were taken during our own experiments. The two sites have an eddy covariance system with the same equipment, which consists of a fast-response 3D sonic anemometer (CSAT3A, Campbell Scientific Instruments, Logan, UT, USA) for latent heat flux, a fast-response open-path infrared gas analyzer (EC150, Campbell Scientific Instruments) for CO2 and water (H2O) flux, an air temperature and humidity sensor (HMP155A, Vaisala Inc., Woburn, MA, USA), and a micrologger (CR3000, Campbell Scientific Instruments).
The half-hourly data are processed and quality controlled using the Eddypro software as per the method described in Liu et al. [51]. The half-hourly EC data are processed using the REddyProc software [52,53]. Data during the growing season are selected for ET partitioning and analysis. Growing season is defined using the logarithmic model, which is illustrated in Section 2.4.

2.3. Satellite Data

To analyze the influence of vegetation on ET partitioning, Vegetation Index (VI) is applied to represent vegetation dynamics and to identify growing season. The Moderate Resolution Imaging Spectroradiometer (MODIS) NDVI product (MOD 13), which has a spatial resolution of 250 m and time resolution of sixteen days with the same period of flux data, was downloaded from National Aeronautics and Space Administration (NASA) website (https://modis.gsfc.nasa.gov/data/). This NDVI product is calculated from reflectance near-infrared channel and red channel using the following equation:
NDVI = ρ n i r ρ r e d ρ n i r + ρ r e d ,
where ρ n i r and ρ r e d are the reflectance of near-infrared channel and red channel, respectively.
The NDVI of each site is the NDVI value of the pixel within which the flux site is located. In order to identify the growing season, 16-day NDVI data is then filtered and interpolated to daily NDVI data.

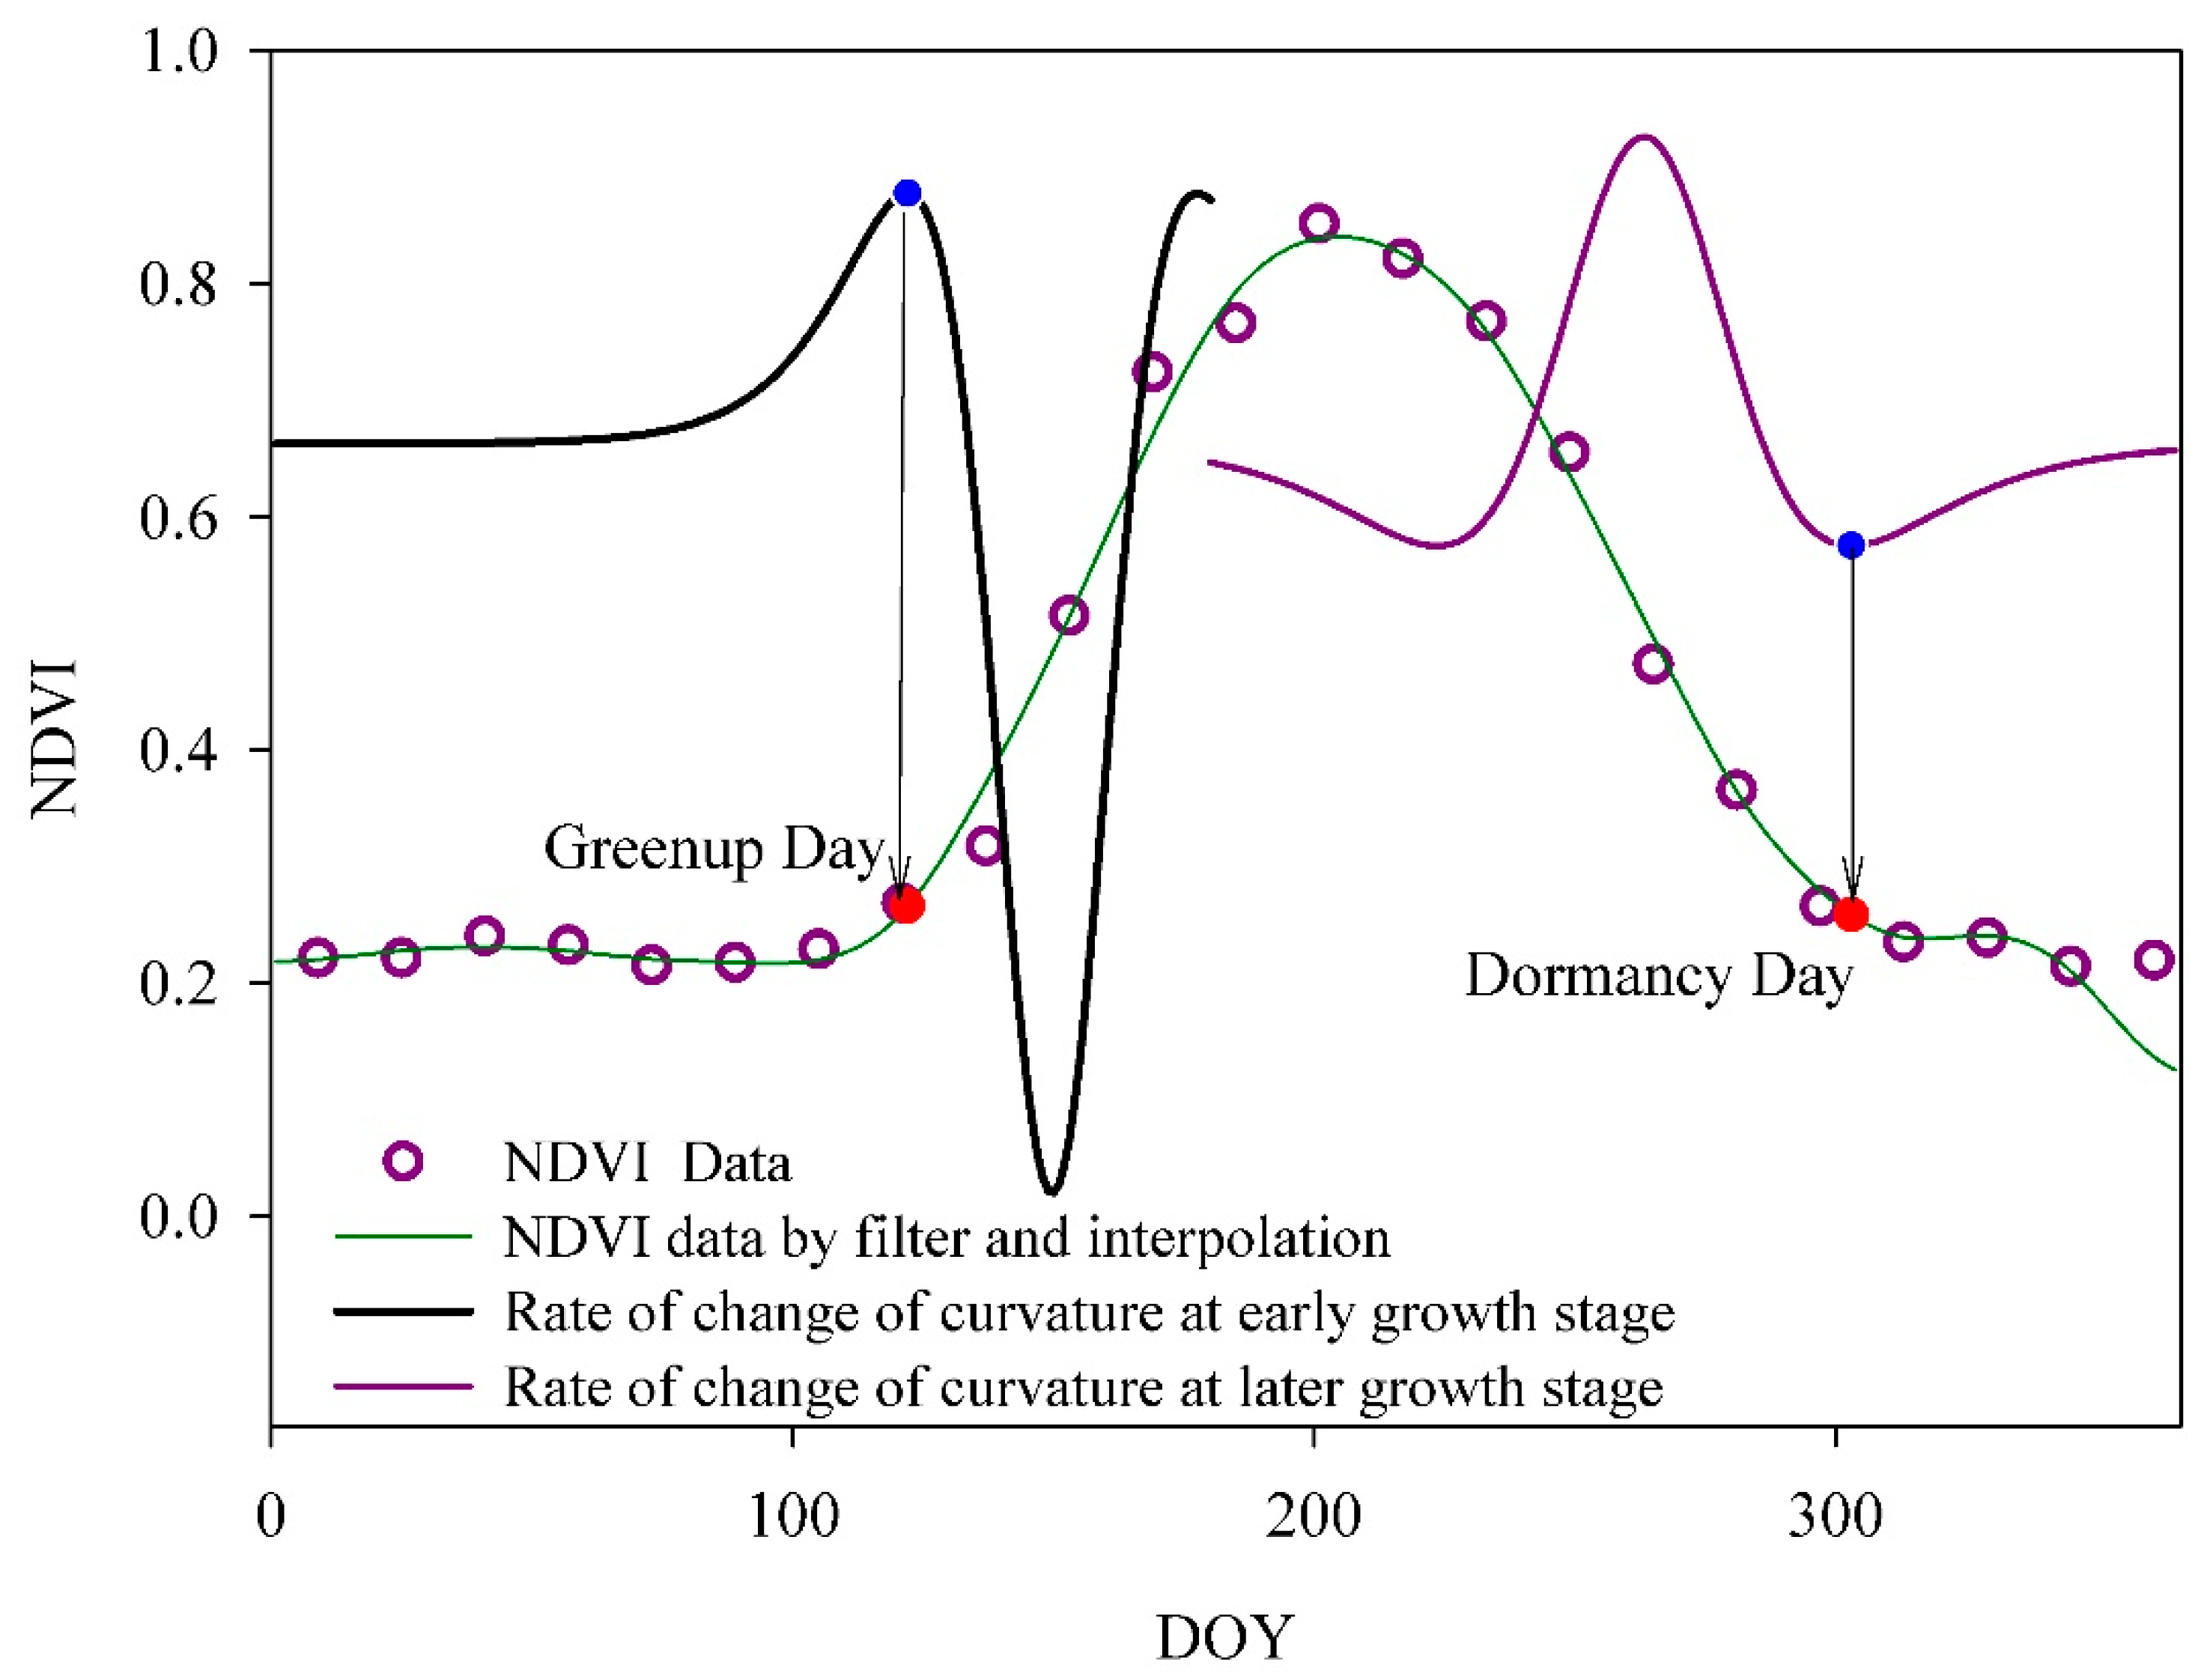
2.4. Identification of Growing Season

Growing season is identified according to a logarithmic model based on the daily NDVI data [54]. The model assumed that Green-Up Date (GUD) is the point when the NDVI time series begin to increase rapidly. GUD is defined as the day when the derivative of NDVI’s curvature reaches local maximum value for the first time (Figure 2). Similarly, dormancy day is defined as the day when the curvature reaches its local minimum value.
A logistic model with four parameters [54] is applied to fit the NDVI dynamic:
NDVI ( t ) = c / ( 1 + e a + b t ) + d ,
where t is DOY; NDVI(t) is the NDVI at time t; a and b are parameters; c + d is the maximum value of NDVI; d is the background value of NDVI, which is the minimum value of NDVI.
Based on the fitted logistic model of NDVI (Equation (2)), the curvature is calculated as follows:
K = b 2 c z ( 1 z ) ( 1 + z ) 3 / [ ( 1 + z ) 4 + ) ( b c z ) 2 ] 1.5 ,
where z is equal to e a + b t .

2.5. ET Partitioning

ET partitioning is carried out according to the approach based on uWUE [18]. In this method, maximum potential underlying water use efficiency (uWUEp) is related to transpiration, while the apparent underlying water use efficiency (uWUEa) is related to evapotranspiration. On an ecosystem scale, the relationship is defined as follows:
μ W U E p = G P P V P D T
μ W U E a = G P P V P D E T ,
where uWUEp is the potential water use efficiency; uWUEa is the apparent water use efficiency; GPP is the gross primary productivity, which represents carbon assimilation on an ecosystem scale; and VPD is the atmosphere vapor pressure deficit.
The T/ET ratio can be determined as follows:
T E T = μ W U E a μ W U E p .
GPP, VPD, and ET can be observed from eddy covariance measurements, whereas uWUEa and uWUEp can be observed through regression analysis.
In this approach, it is assumed that T/ET follows a single-peak diurnal pattern, and the diurnal peak is close to 1 when vegetation coverage is high and soil evaporation can be negligible. Under such circumstances, uWUEp is equal to the maximum value of uWUEa. uWUEp is assumed to be constant for each site for each year. Bremnes [55] and Wang et al. [56] reported that extreme quantiles such as 5% and 95% are widely used to describe the lower and upper limits, respectively, for the regression slope. Therefore, in this study, 95th percentile quantile regression is applied to derive the upper slope of GPP VPD0.5 over ET and uWUEp. For each site, an annual uWUEp for a given year is derived using half-hourly GPP, ET, and VPD data with an intercept of zero. For instance, at the Arou site, we can see from Figure 3 that the slope of the 95th percentile quantile regression (red line) with the annual uWUEp is 12.25 g C hPa0.5/kg H2O.
uWUEa is estimated using linear regression with half-hourly GPP, ET, and VPD measurements for two particular periods of one month and one week. The regression slope of GPP VPD0.5 over ET with an intercept of zero represents the uWUEa for each site of given period. As shown in Figure 4, for the Arou site, the linear regression slope is 7.56 g C hPa0.5/kg H2O in August and 3.73 g C hPa0.5/kg H2O in the 23rd week in 2015. Therefore, the T/ET is 0.62 (=7.56/12.25) for August and 0.30 (=3.73/12.25) for the 23rd week in 2015. The performance of linear regression is evaluated using R2 and p-value.

3. Results and Discussion

3.1. Evaluation of Regression Performance

The reliability of the results estimated from the regression model needs to be evaluated before interpretation of the results. According to the significance test, the p-value of the regression for each site is less than 0.001 on a monthly scale whereas almost all of the P value is less than 0.001 on ca weekly scale except for the 39th week at Sidaoqiao and Daman. This indicates that the association between the dependent and the independent variables is statistically significant at the level of 0.001.
R2 is a statistical value to measure how close the dependent and the independent variables are fitted on the regression line. Figure 5 shows the frequency distribution of R2 for each site on the monthly and weekly scale. Overall, the value of R2 on the weekly scale is higher than that of the monthly scale for each site because the minimum value of R2 of each site on the monthly scale is lower than that of the weekly scale and the range of R2 for each site is much narrower on the weekly scale. This indicates that there is a strong linear relationship of ET and GPP VPD0.5 on a weekly scale, and therefore the weekly uWUEa results are utilized for analysis in the present study.

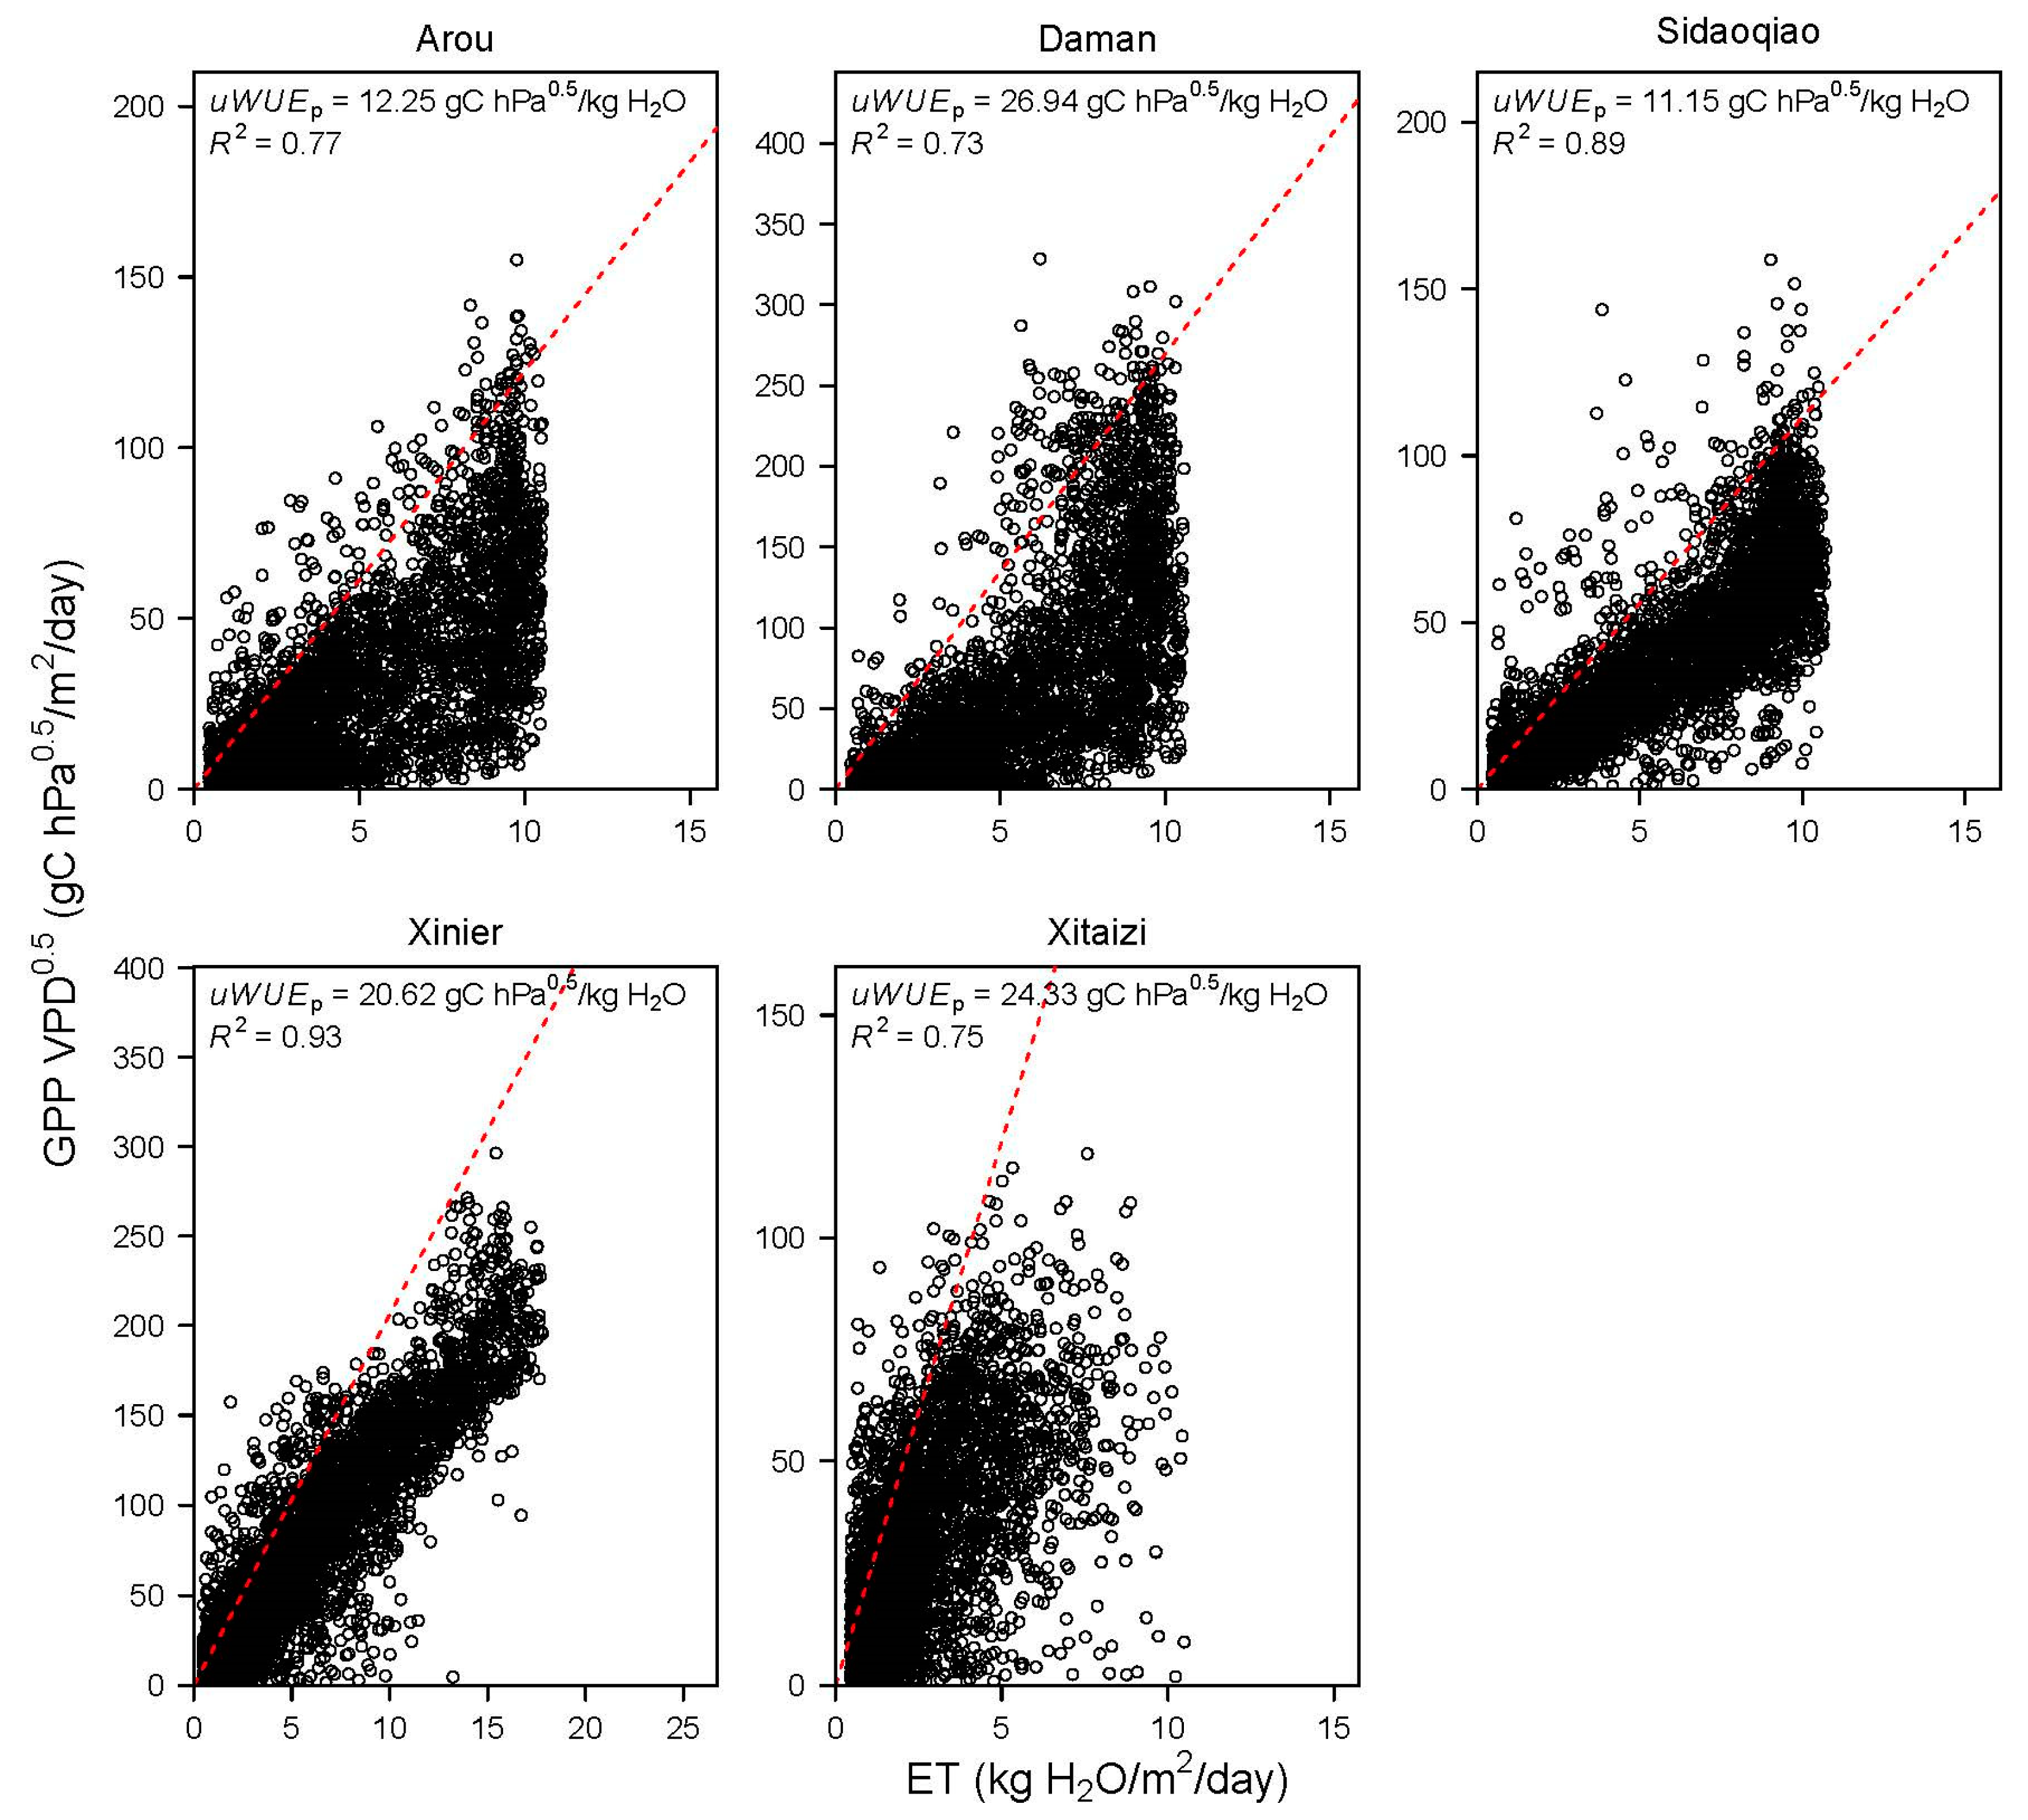
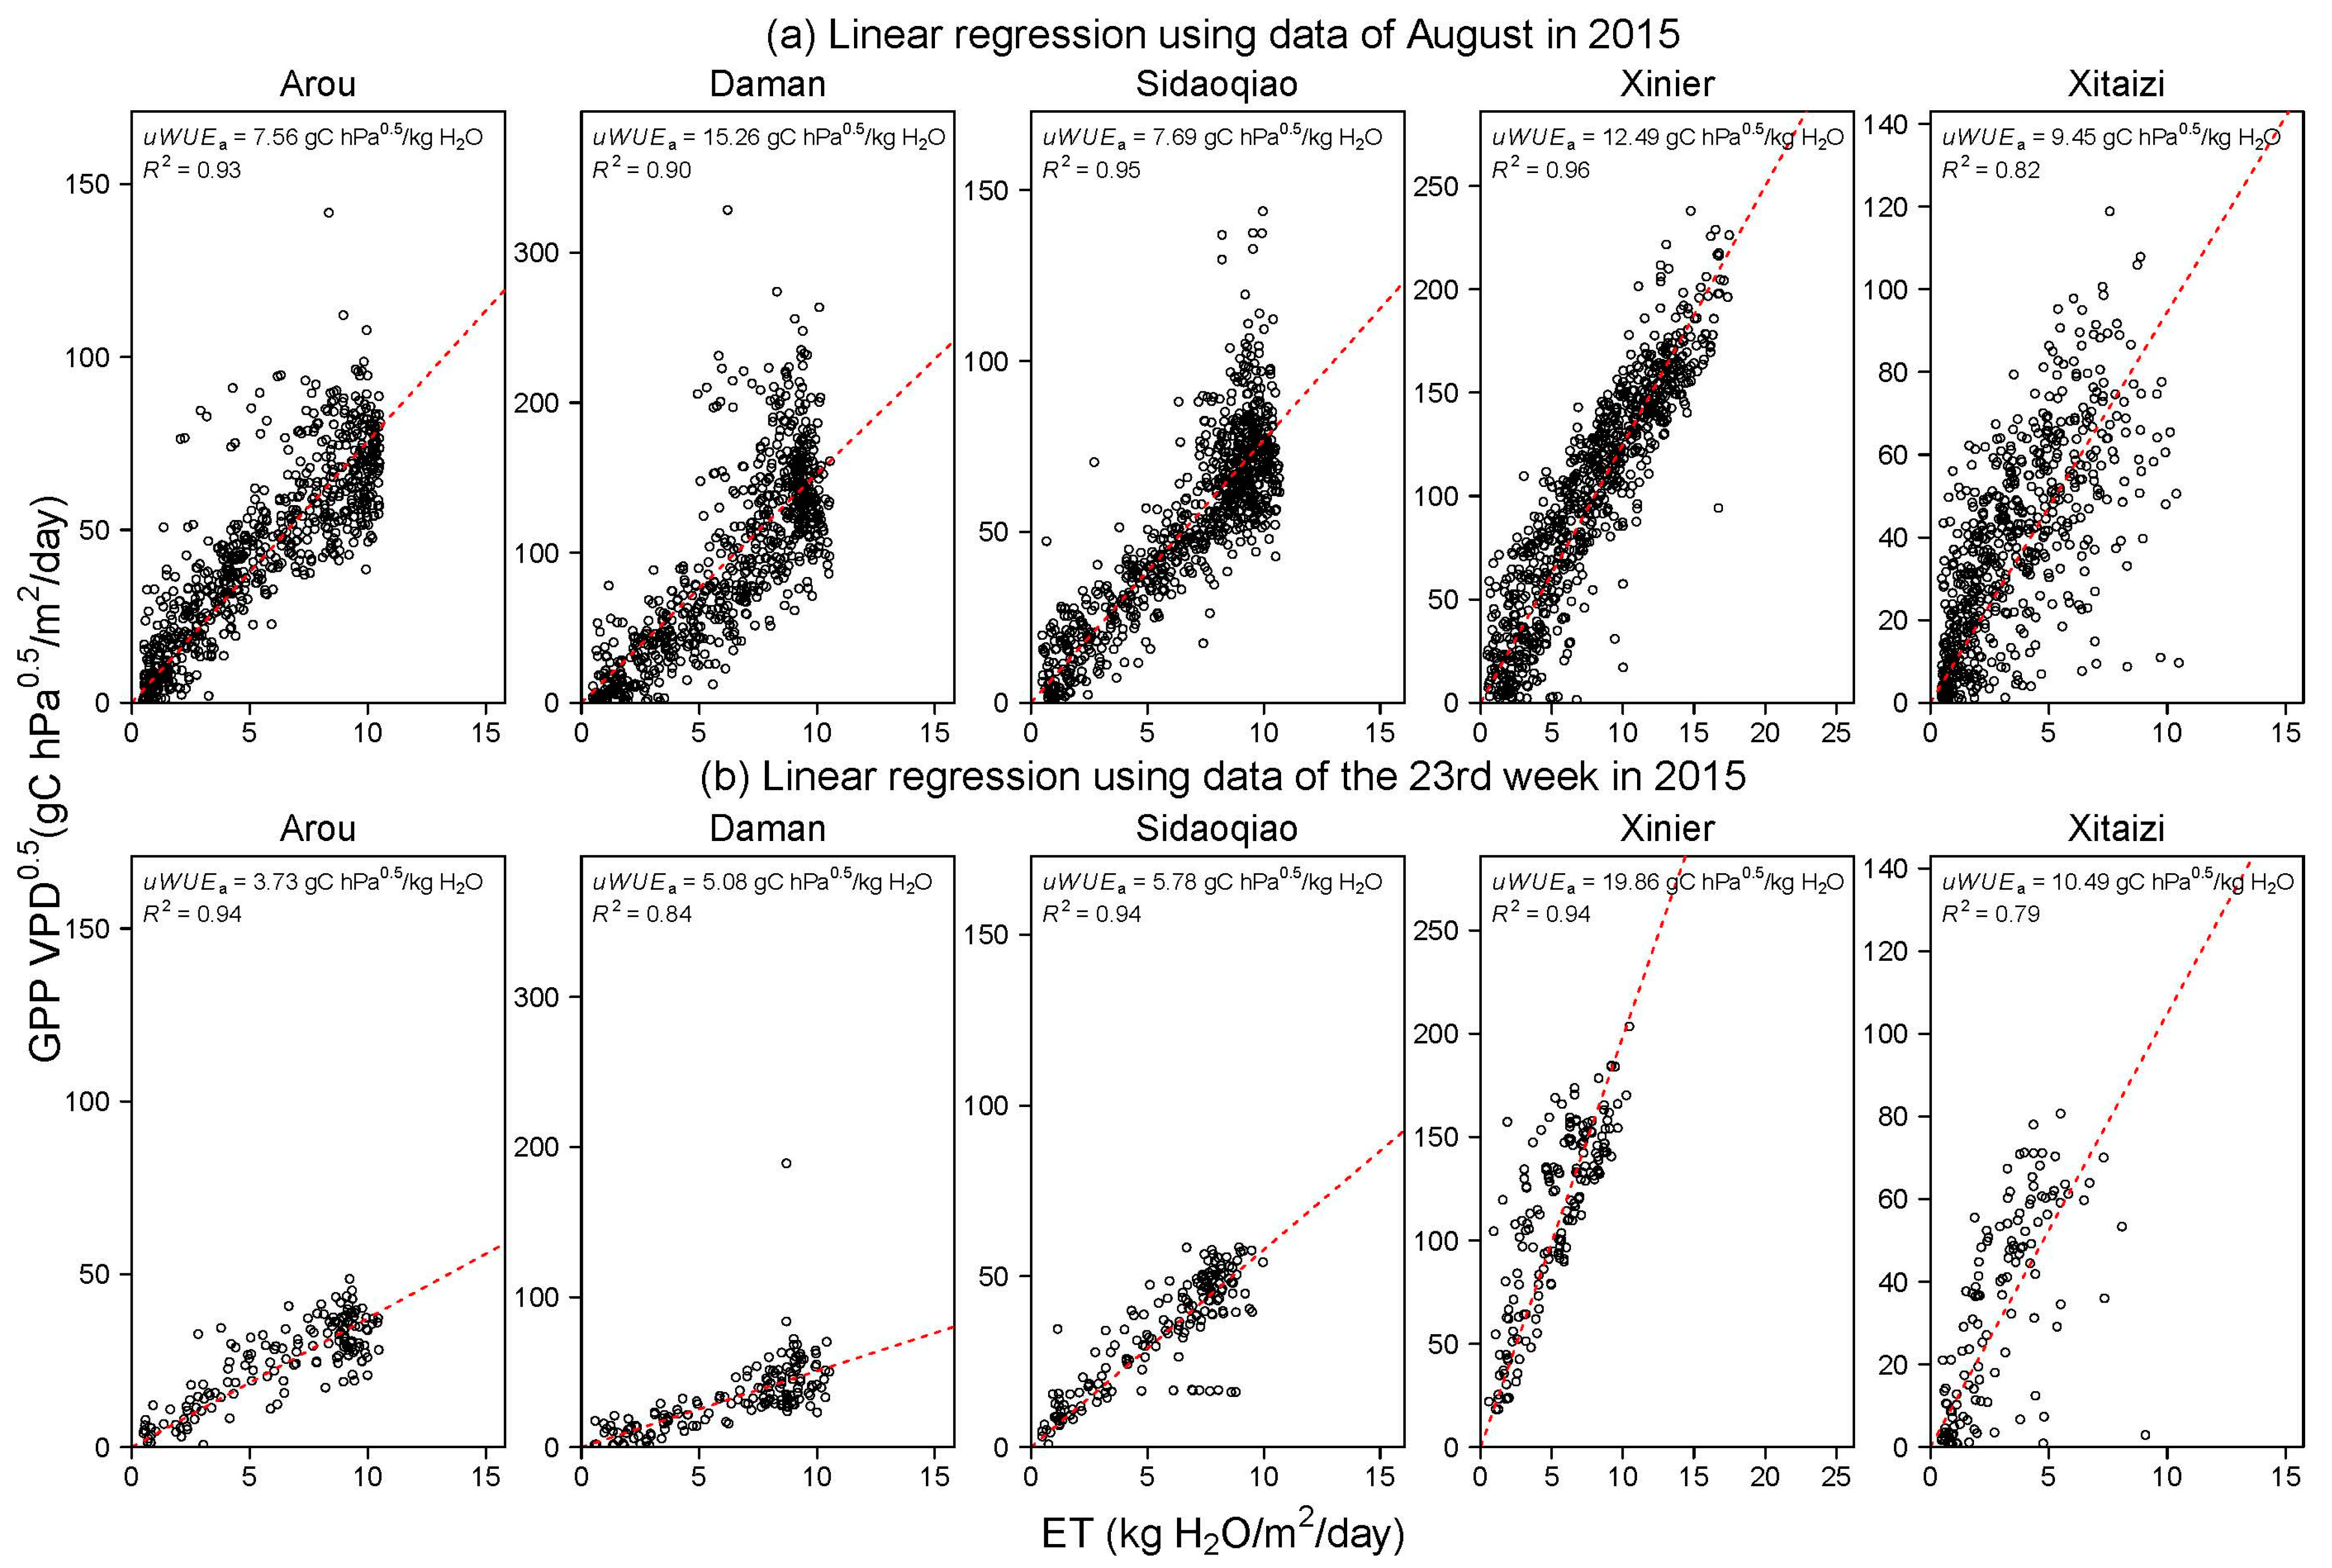
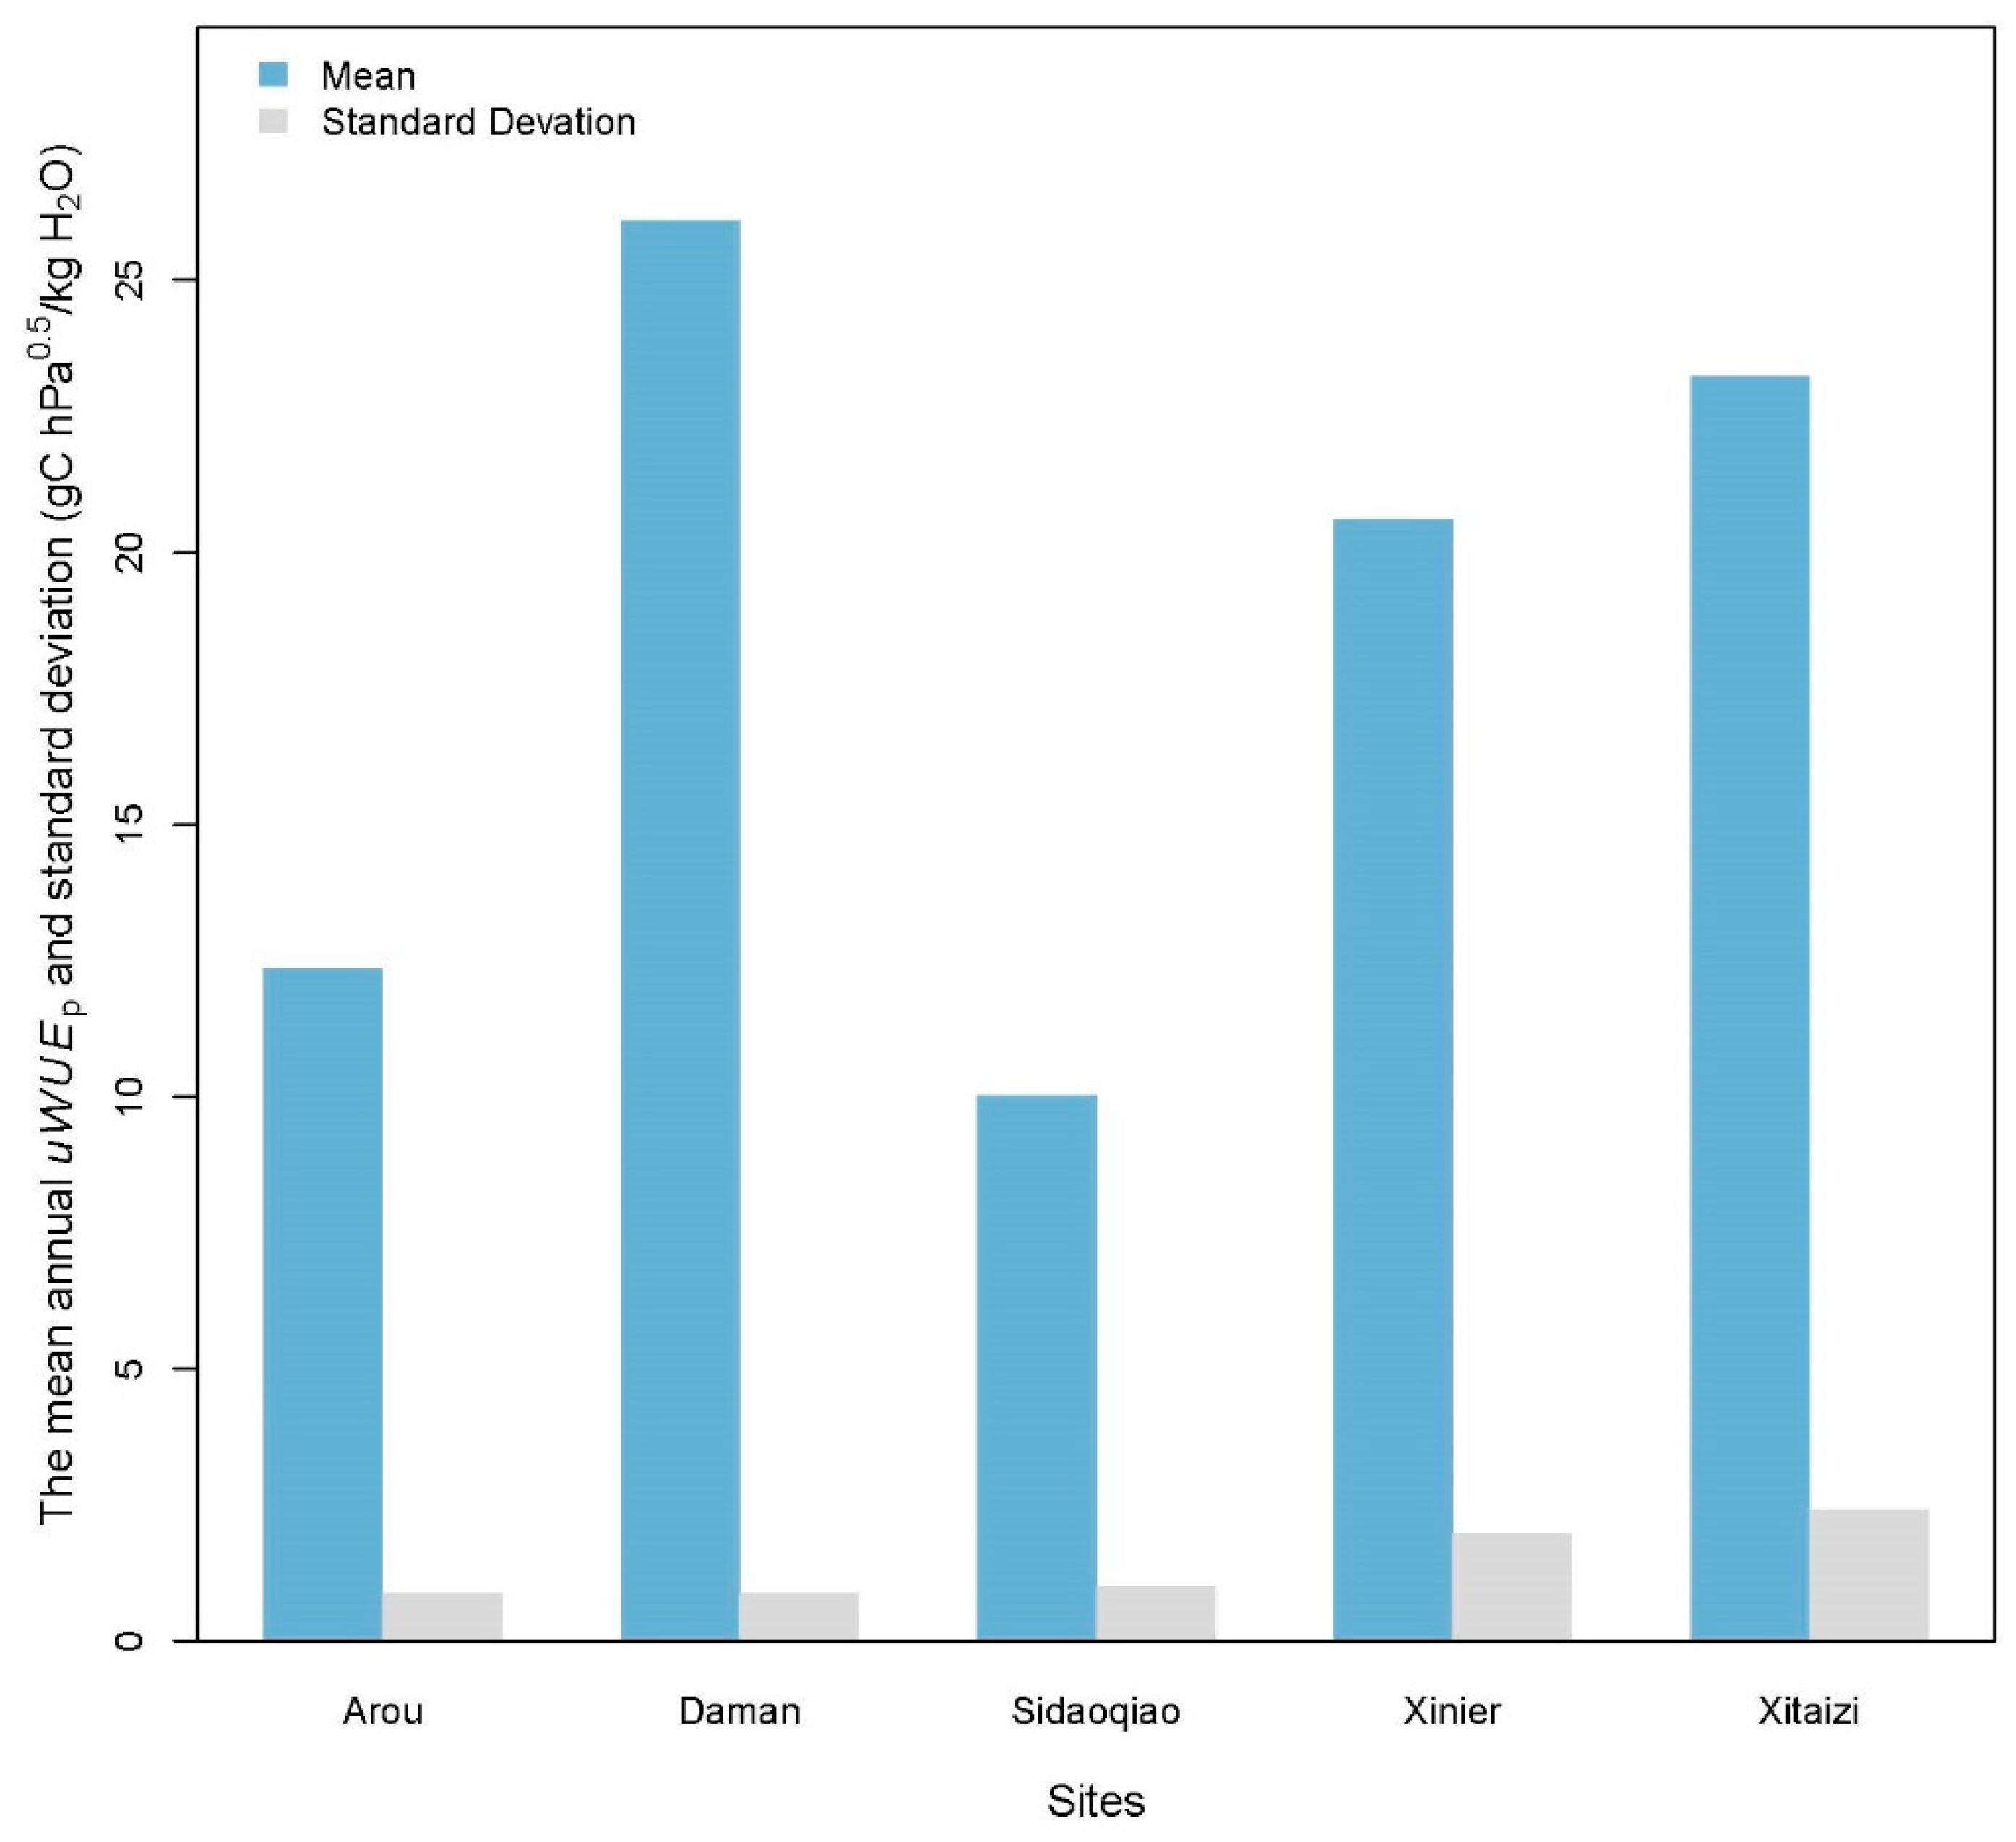
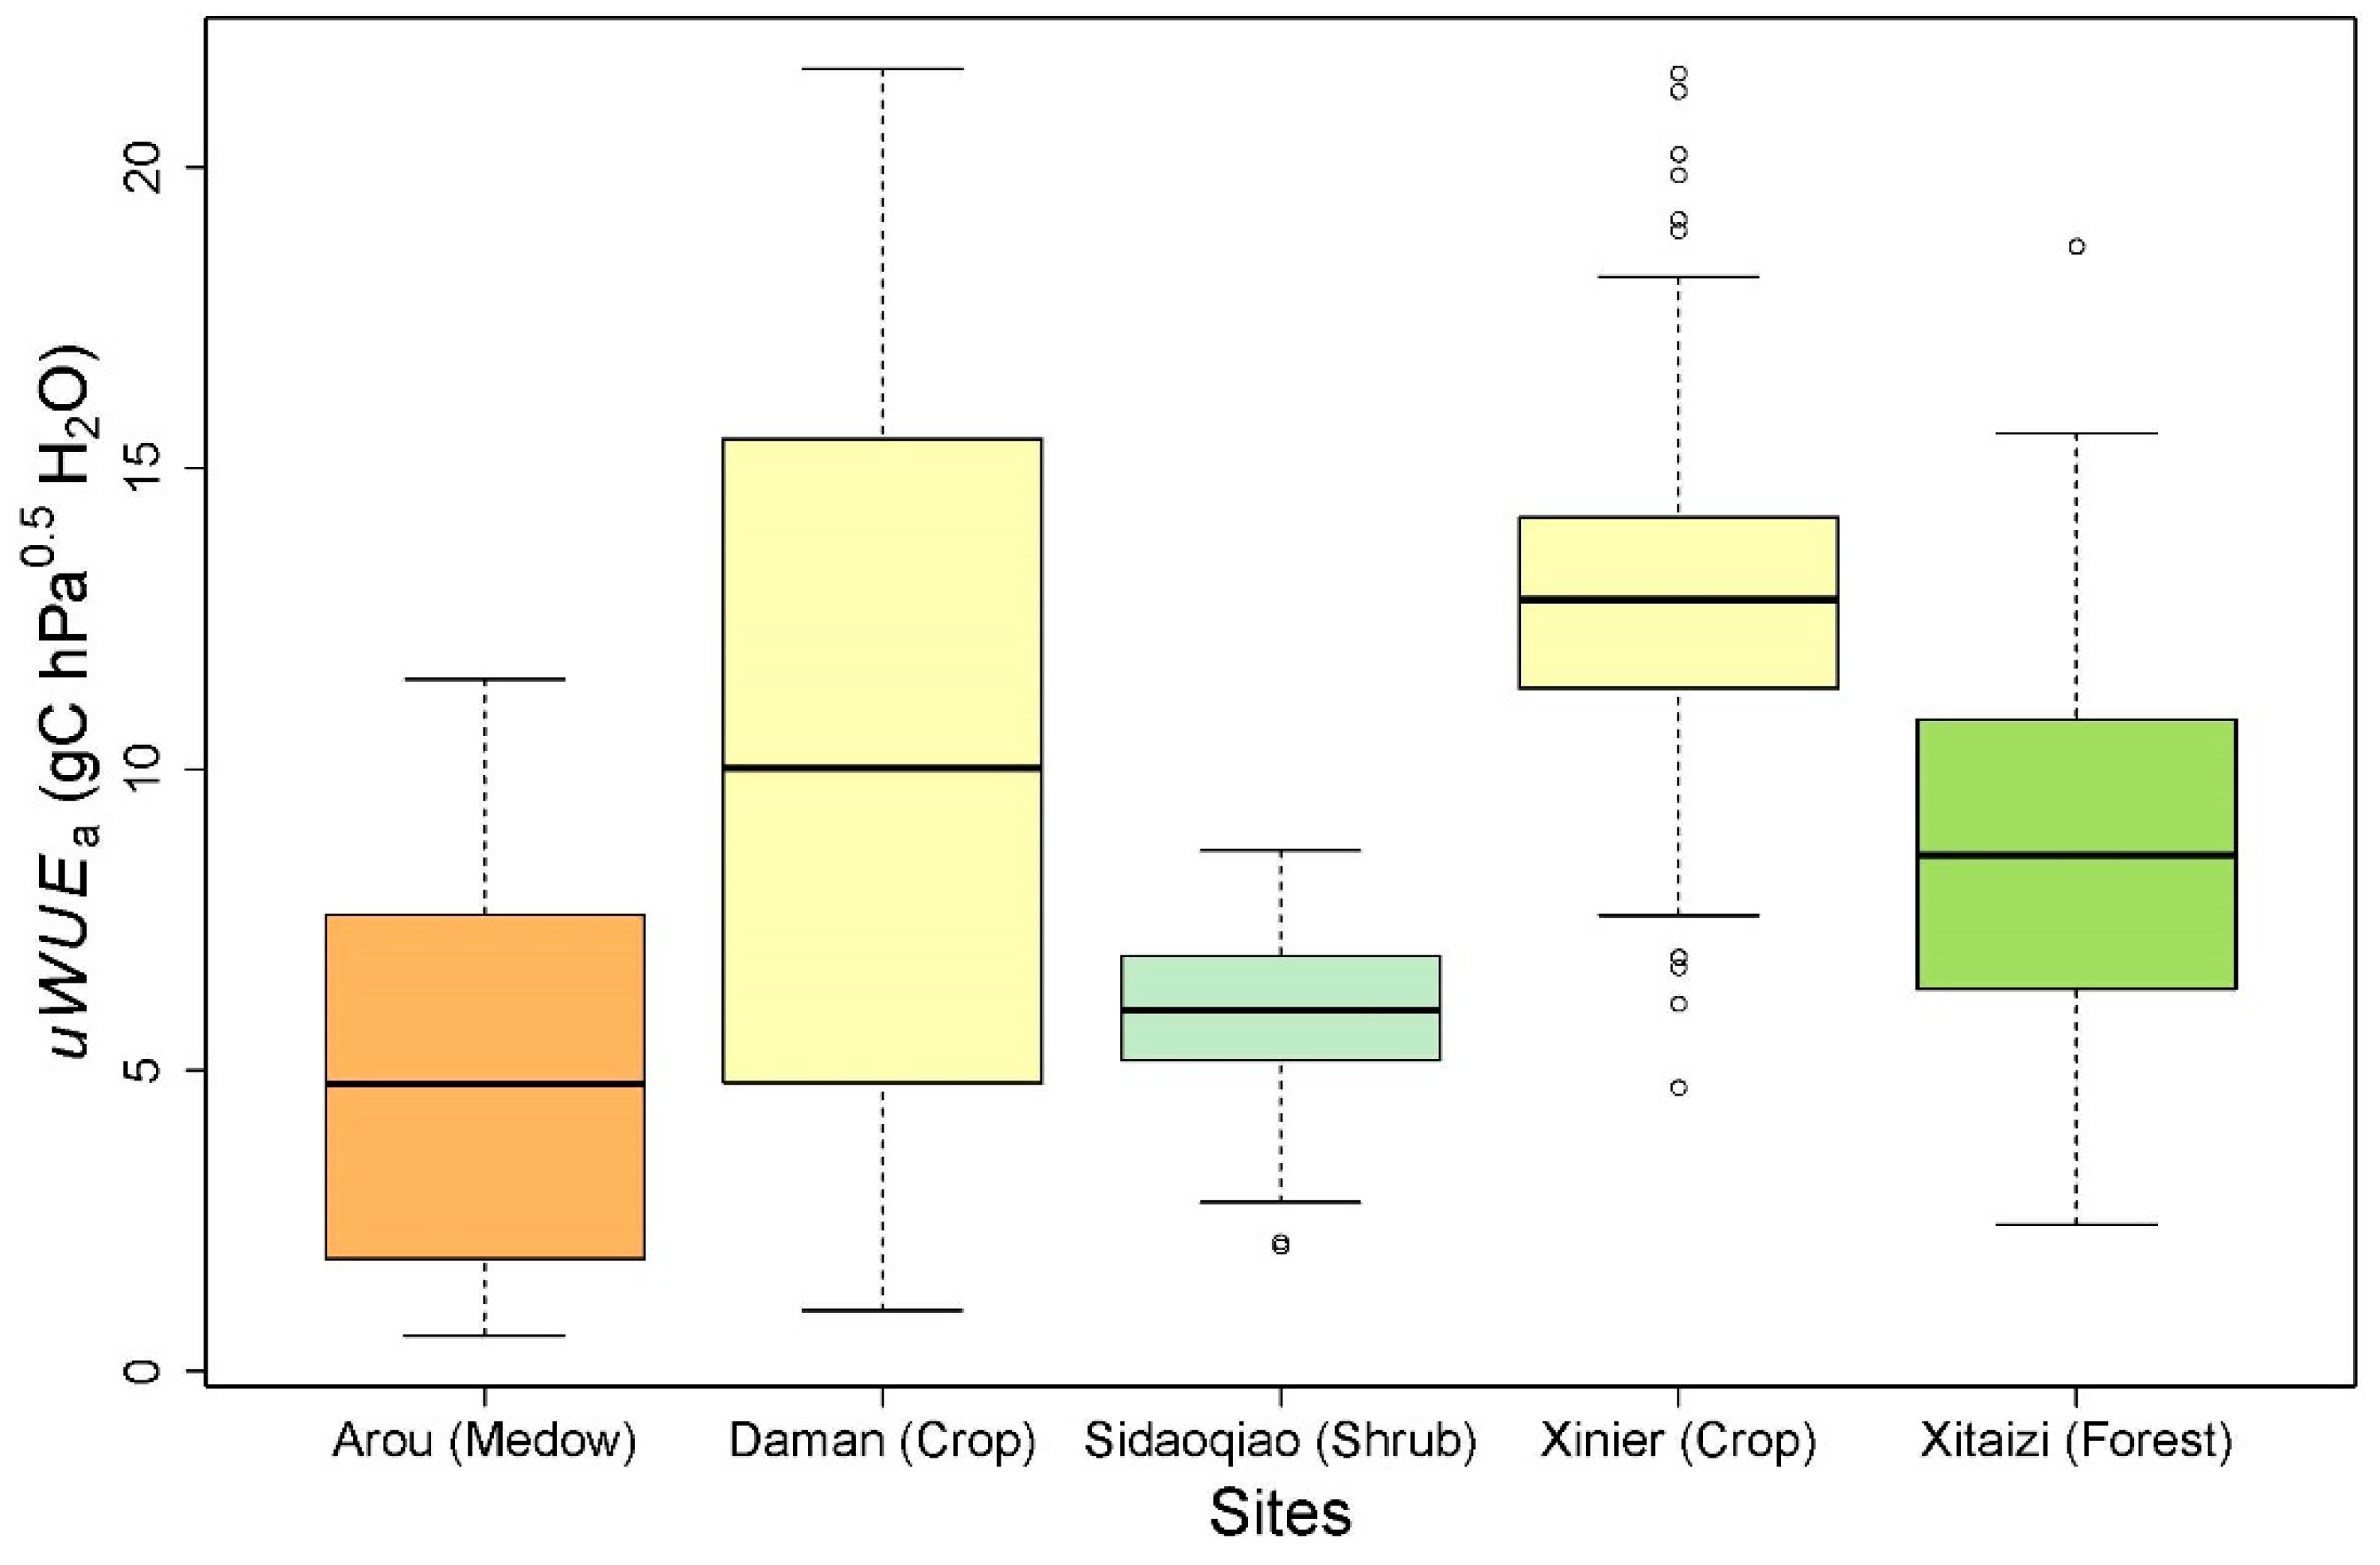
3.2. Potential and Apparent Underlying Water Use Efficiency

Table 2 shows the annual uWUEp for the five sites. It is evident from Table 2 that among the three natural vegetation sites, Xitaizi shows the highest average annual uWUEp value of 23.22 g C hPa0.5/kg H2O, followed by Arou and Sidaoqiao with an average annual uWUEp value of 12.34 g C hPa0.5/kg H2O and 10.02 g C hPa0.5/kg H2O, respectively (Figure 6).
The weekly uWUEa of Xitaizi ranges from 2.44 to 18.67 g C hPa0.5/kg H2O, with an average of 9.54 g C hPa0.5/kg H2O, the highest among the three vegetation sites when compared with Arou and Sidaoqiao, which range from 1.01 to 21.63 g C hPa0.5/kg H2O with an average of 10.15 g C hPa0.5/kg H2O and 2.07 to 8.65 g C hPa0.5/kg H2O with an average of 5.95 C hPa0.5/kg H2O, respectively (Figure 7). From the results, it is clear that the annual uWUEp and weekly uWUEa are higher for the deciduous broadleaf forest as compared to grass and shrub. Apart from the difference in vegetation types among the three sites, the difference in precipitation also contributes to the variation in annual uWUEp and weekly uWUEa for the three sites. From Table 1, it is seen that the long-term average annual precipitation is highest at Xitaizi (541.0 mm), followed by Arou (445.0 mm) and Sidaoqiao (116.8 mm). Annual uWUEp and weekly uWUEa are positively related to precipitation, as higher precipitation is associated with higher net primary productivity (NPP), leading to higher water use efficiency.
The average annual uWUEp for Daman site is 26.08 g C hPa0.5/kg H2O, which is much higher than the 20.61 g C hPa0.5/kg of Xinier site. However, the average weekly uWUEa is 10.15 g C hPa0.5/kg for Daman, which is lower than the 12.82 g C hPa0.5/kg at Xinier and might be due to the difference in irrigation schemes between the two sites (Figure 7). In Daman, flood irrigation is conducted only four times during the growing season, which causes a dramatic distinction in soil water and ET between irrigated days and non-irrigated days and leads to a high inter-annual variation of uWUEa. In contrast, mulch drip irrigation is applied at Xinier during the growing season once a week or less than once a week (during the boll stage), comprising 11 irrigation events in total. Consequently, the variation in soil water and ET at the Xinier site is much smaller compared to the Daman site, which leads to a lower variation in uWUEa.

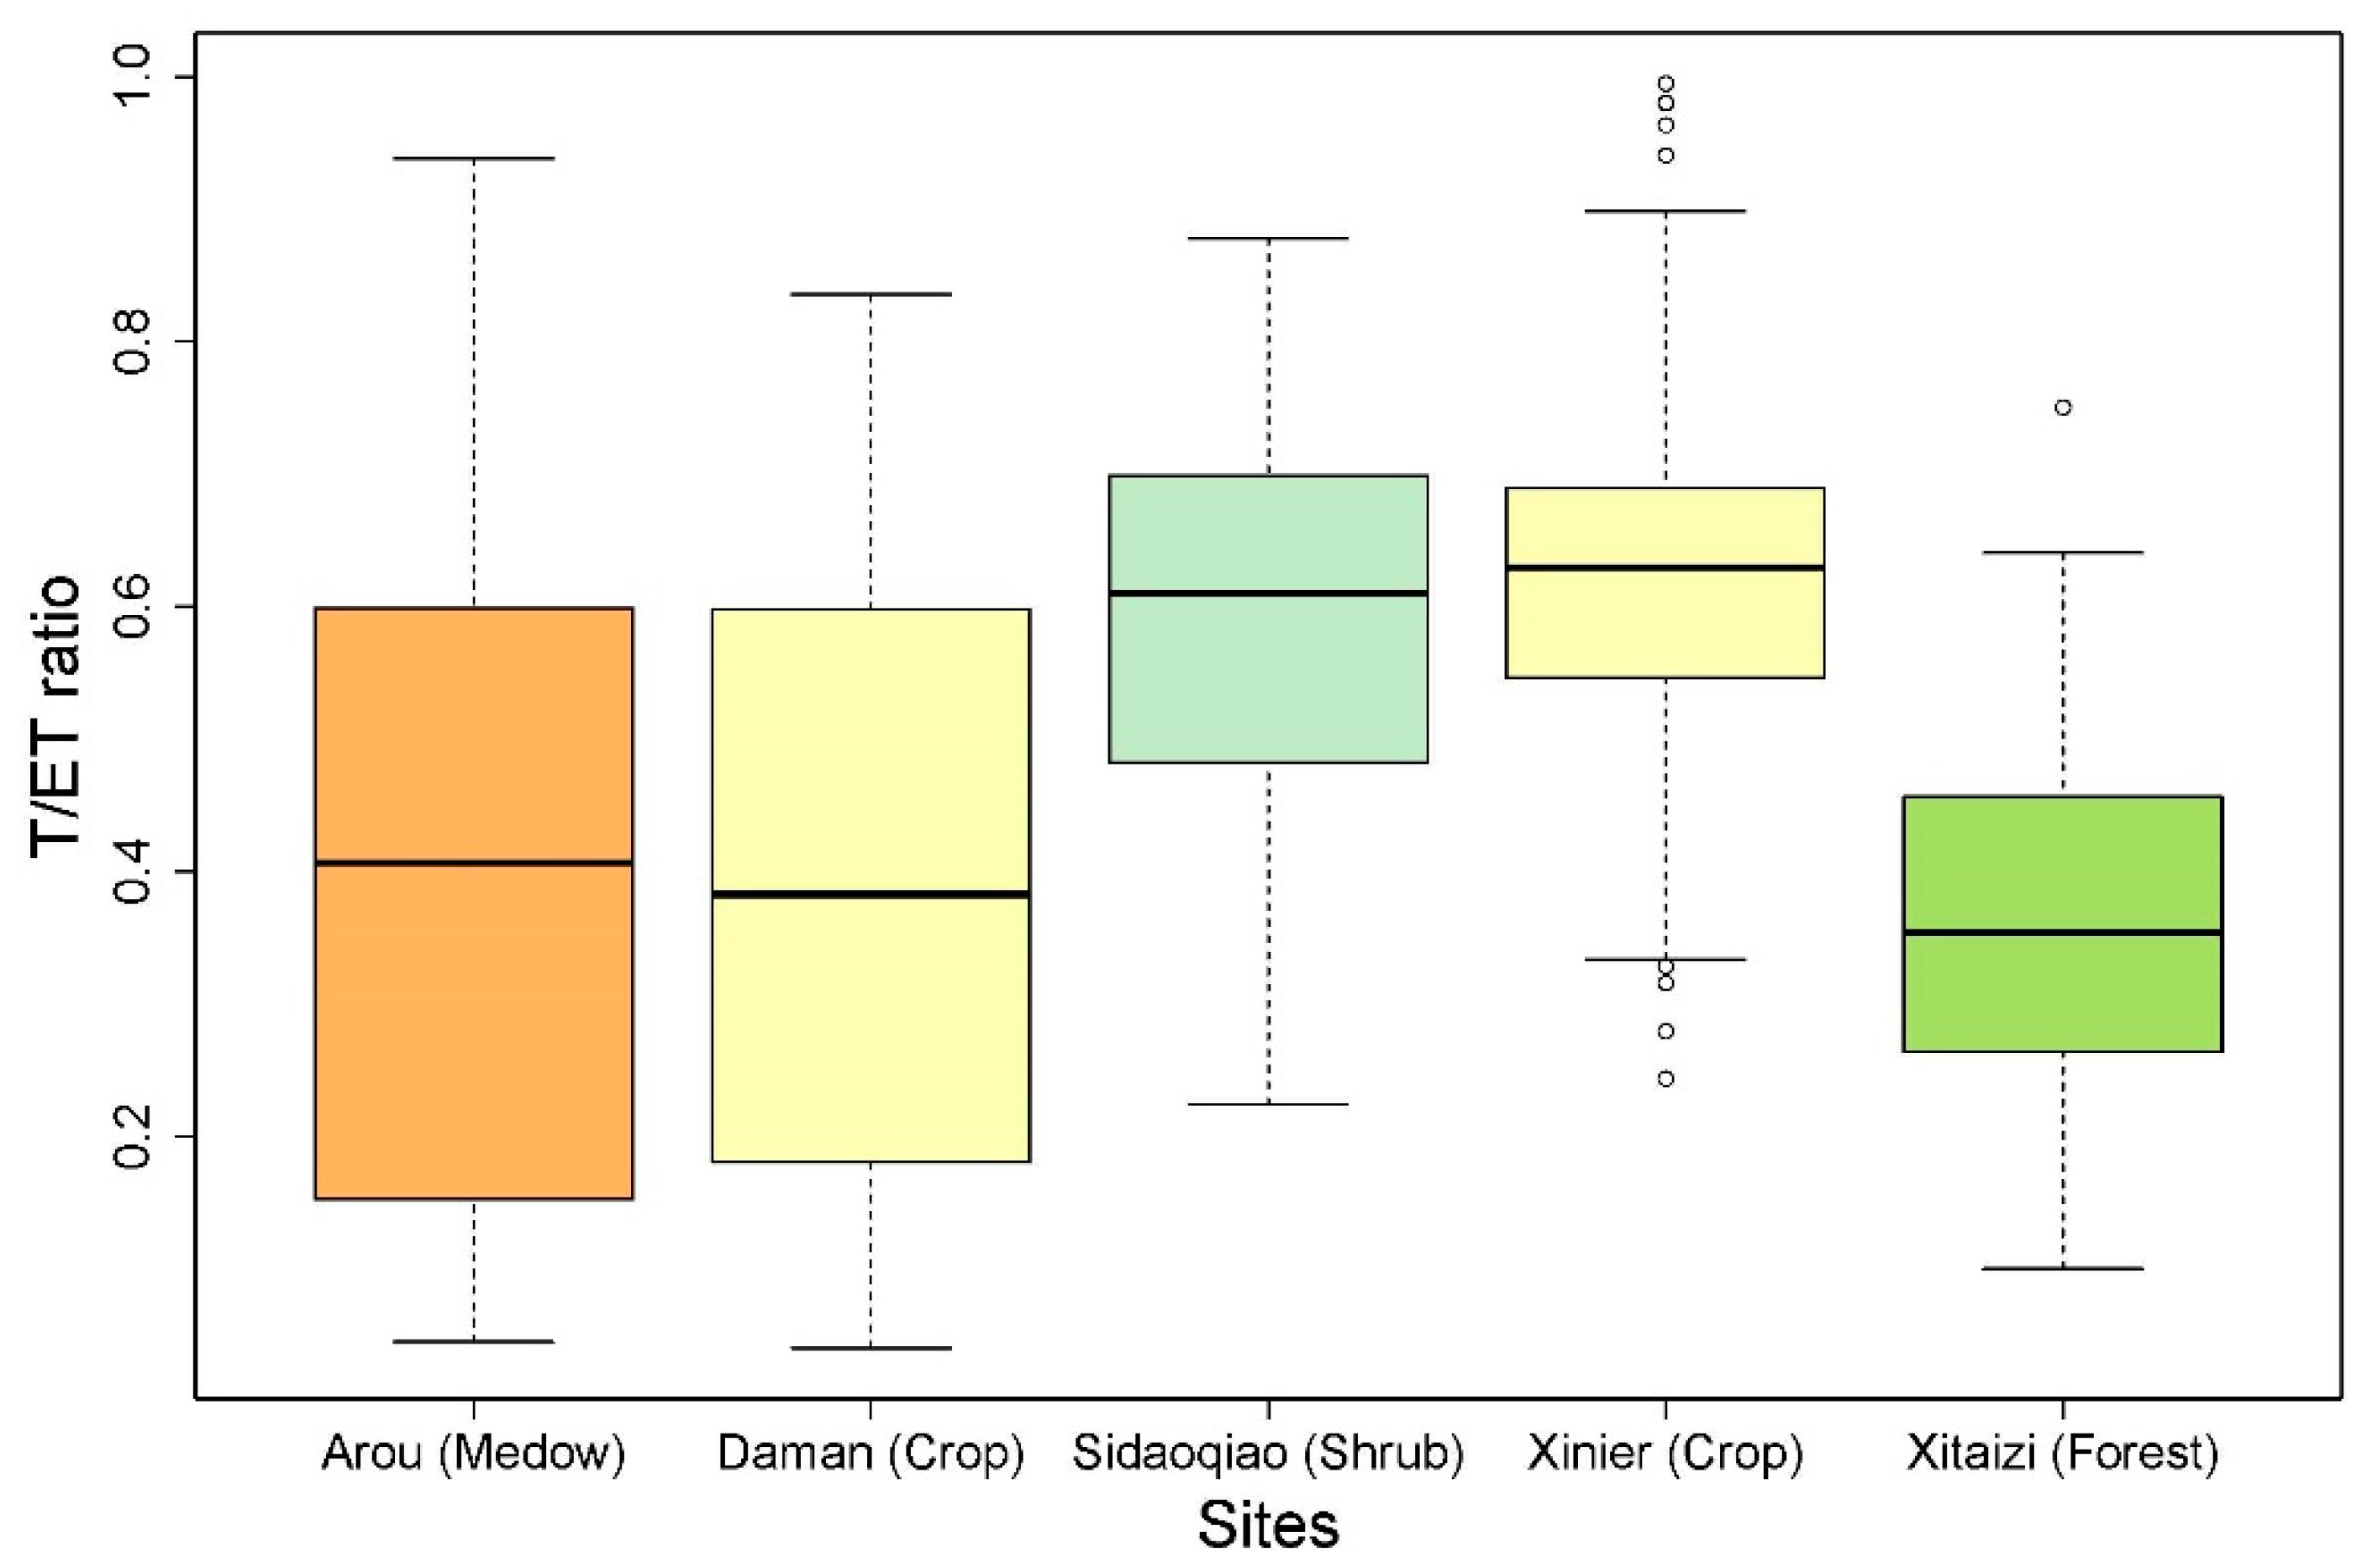
3.3. ET Partitioning

Figure 8 shows the variation in T/ET ratio for five different sites. Of the three natural vegetation sites, the average weekly T/ET ratio is highest for Sidaoqiao (0.59) and lowest for Xitaizi (0.36). In contrast, the averaged uWUEa of Sidaoqiao is the lowest, whereas that of Xitaizi is relatively high. It is also observed that the T/ET ratio is negatively related to precipitation for the three sites; for instance, a site with lower annual precipitation has a higher T/ET ratio. It is also evident from Figure 8 that the T/ET ratio of the three sites shows a different level of variation: Arou has a larger variation range from 0.04 to 0.93 compared with the other two sites, whereas Sidaoqiao shows the lowest level of variation in T/ET ratio, ranging from 0.22 to 0.88.
Xinier has a higher averaged weekly T/ET ratio (0.63) than the Daman site (0.39), mainly due to the difference in irrigation scheme for the two sites (Figure 8). At the Xinier site, mulch drip irrigation is applied, which delivers water precisely to the root zone of crops and consequently soil water is low in the inter-film zone, resulting in a high fraction of transpiration and low soil evaporation. This result is similar to the finding of Tian et al. [57]. At the Daman site, flood irrigation is conducted and, as a result, there is no obvious difference in soil water under root zone and inter-film zone. Soil evaporation contributes a high portion of ET and consequently the T/ET ratio is lower at Daman.

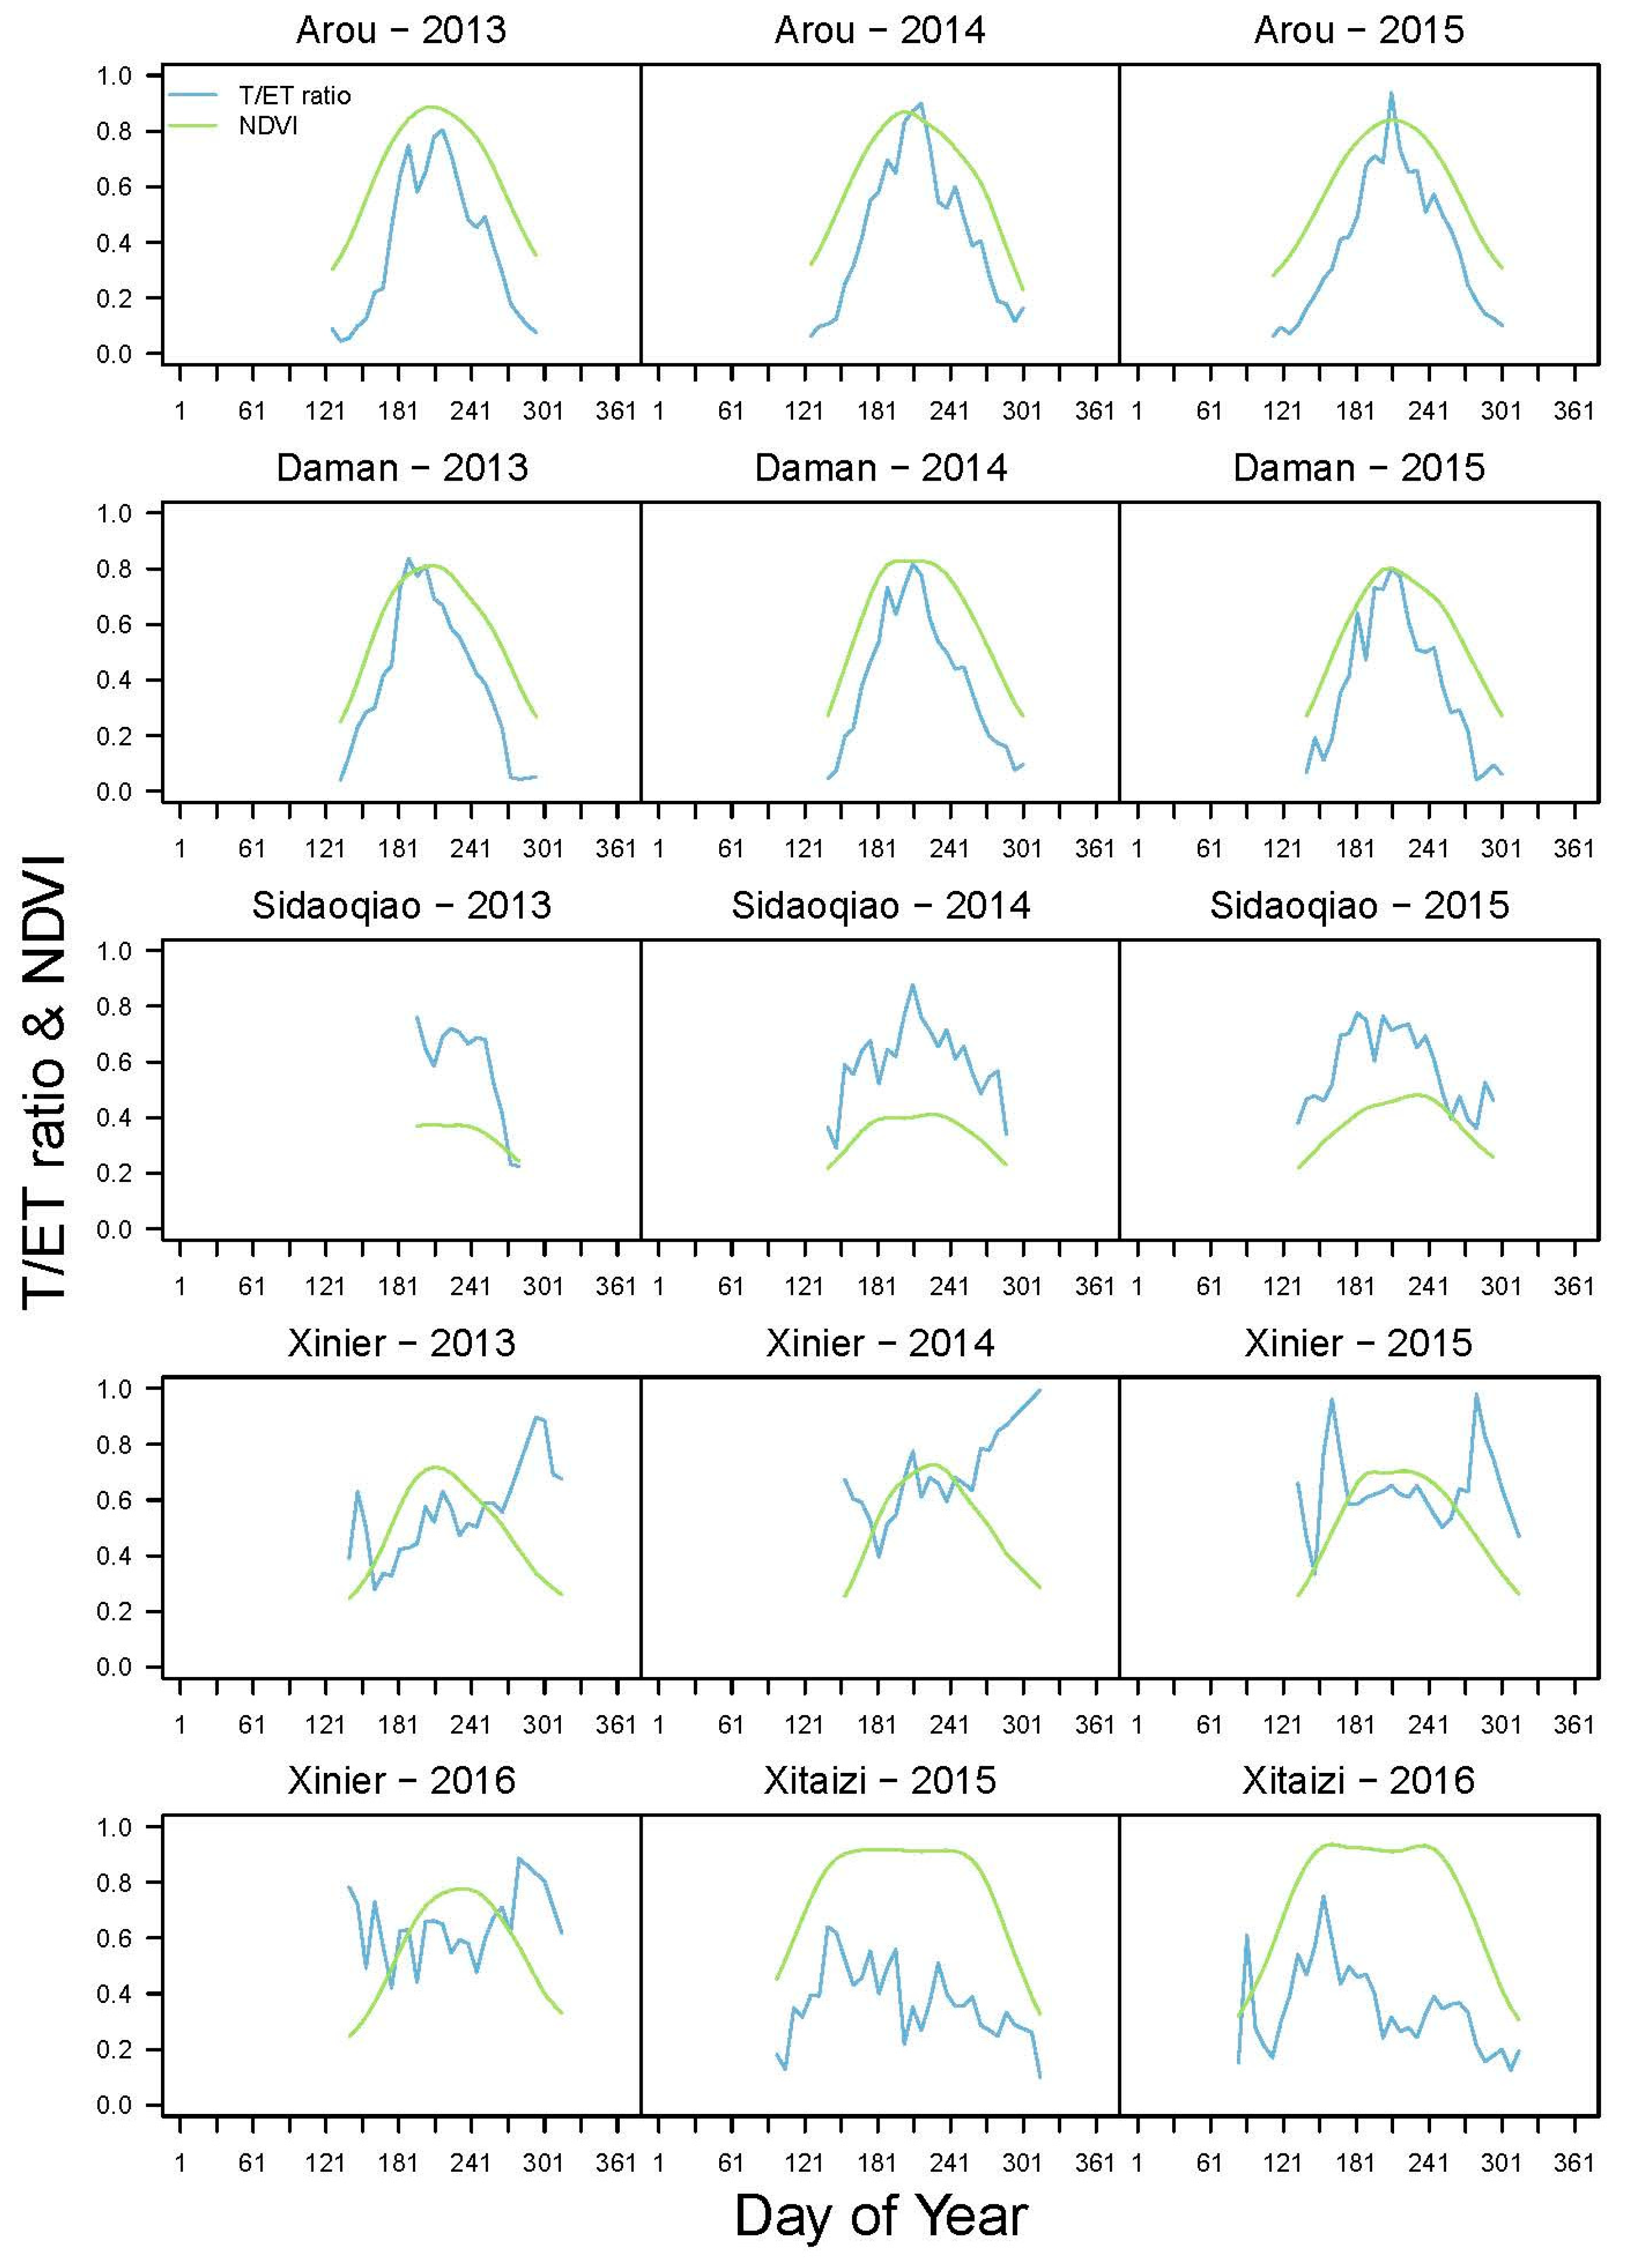
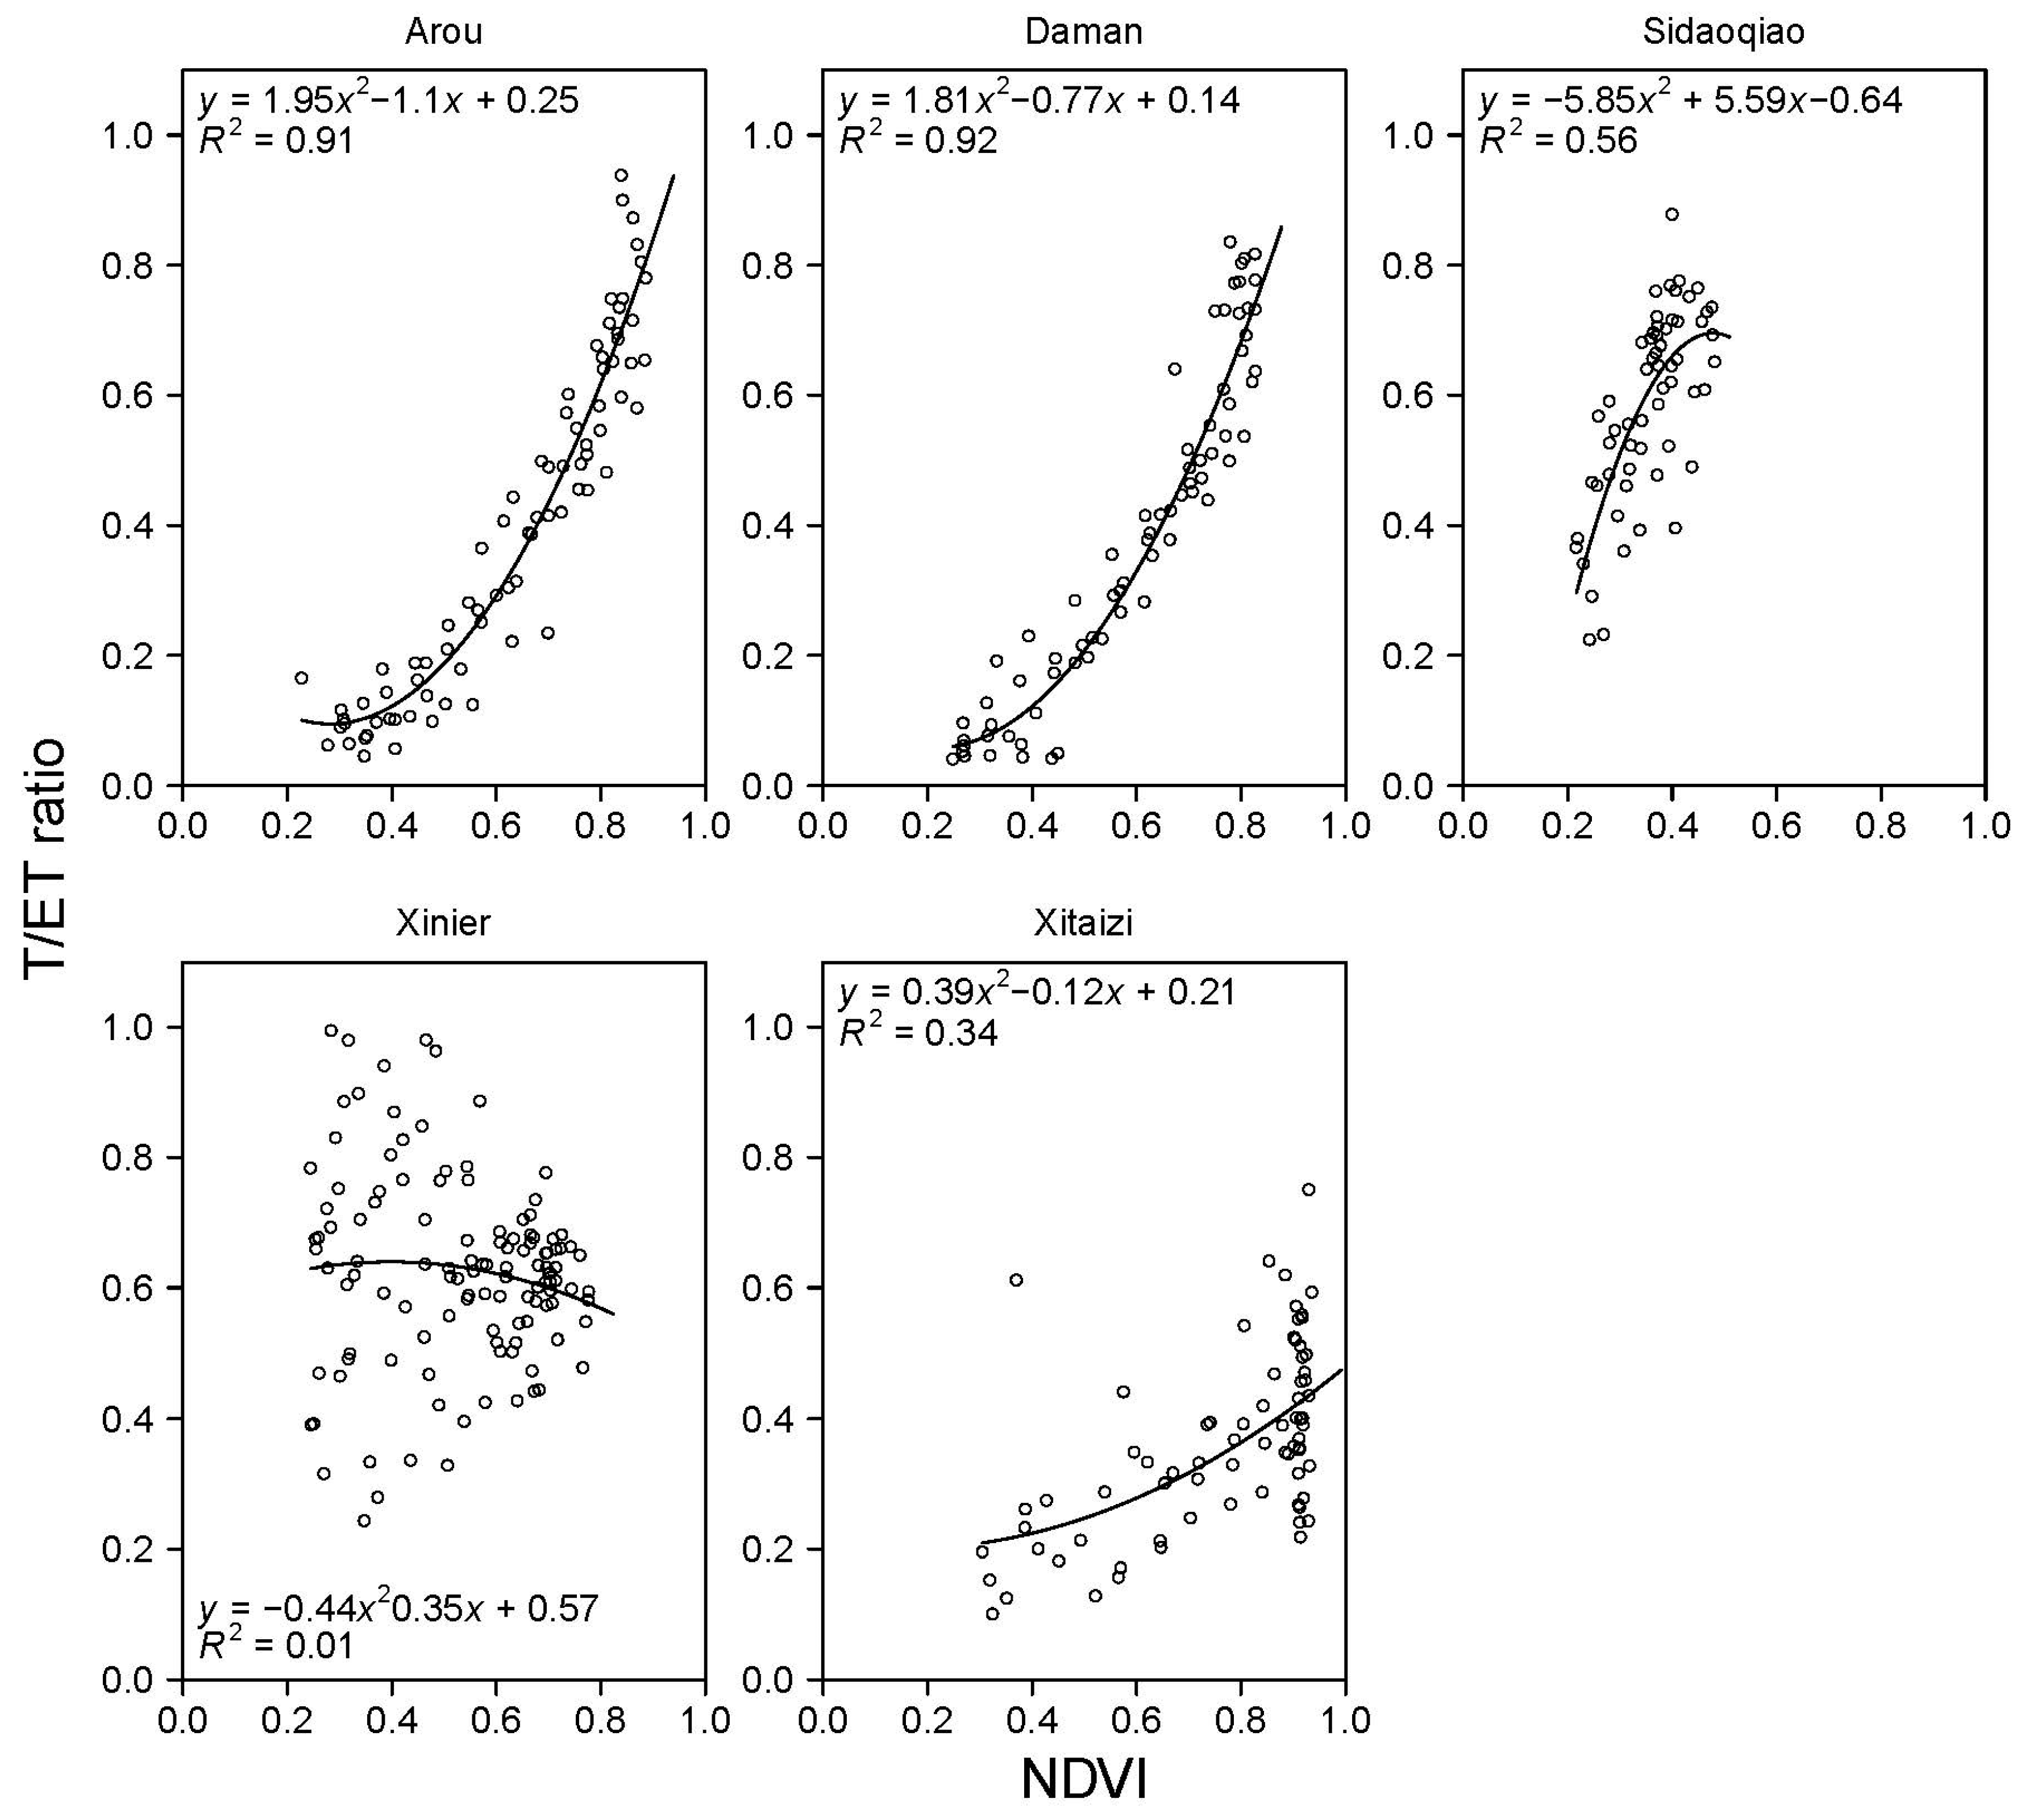
3.4. Relationship between T/ET Ratio and Vegetation

All the sites show different patterns of relationships between T/ET ratio and vegetation index (Figure 9). Arou and Daman represent the synchronous variation of T/ET ratio and NDVI as T/ET ratio grows and decline with increase and decrease of NDVI, respectively. The seasonal dynamic of T/ET ratio and NDVI are both single peak curve and spiked simultaneously. A similar synchronous variation in T/ET ratio and NDVI is shown by Sidaoqiao and Xitaizi at the beginning and end of the growing season when compared with Arou and Daman; however, NDVI remains at a certain level while the T/ET ratio fluctuates in the middle of the growing season. In the case of the Xinier site, the relationship between the T/ET ratio and NDVI is quite different in that the variation of T/ET ratio seems to be irrelevant to NDVI.
In general, four out of five sites show a positive and significant correlation between NDVI and T/ET ratio (Figure 9). Arou and Daman demonstrate an incredibly strong correlation between NDVI and T/ET ratio, with R2 values of 0.91 and 0.92, respectively, which indicates that vegetation has a very strong controlling impact on ET partitioning. Sidaoqiao also shows a positive correlation between T/ET ratio and NDVI with an R2 value of 0.56.
At Arou site, the strong positive correlation between NDVI and T/ET ratio can be well fitted with a quadratic function, indicating a strong controlling impact of NDVI over T/ET ratio. When NDVI is low, the increase in NDVI leads to a slow increase in T/ET ratio; however, when NDVI reaches a certain value (about 0.4), the T/ET ratio increases rapidly with the increase of NDVI. Arou site is covered by alpine and mountain meadow and characterized by intermediate precipitation and low temperature. Grass grows slowly at the beginning of the growing season due to the low temperature and consequently there is low vegetation cover; most of the precipitation is allocated to soil evaporation and the T/ET ratio increases slowly at the beginning of growing season. However, grass develops rapidly as temperature increases, resulting in a rapid increase in the T/ET ratio.
In the case of Sidaoqiao, the T/ET ratio increases with the increase of NDVI but with a different pattern compared with Arou site. From Figure 10, it is seen that the T/ET ratio increases rapidly and slowly when NDVI is lower and higher than a certain value (around 0.4), respectively. Sidaoqiao is located in an extremely arid region where precipitation is the main factor driving plant growth. Once there is sufficient soil moisture accumulation for plant growth, the sparse desert shrubs on this site recover quickly, leading to a rapid increase in transpiration. However, as the amount of precipitation is low in this site, it cannot afford a high density of vegetation. Consequently, when NDVI reaches a certain value, shrub growth is constrained; thereby transpiration is limited and increases slowly or remains at a certain level. This is also consistent with the study of Scott et al. [9], which stated that in semi-arid areas the increase in woody plants often results in a decrease in vegetation cover, which leads to a decrease in T to ET.
When NDVI is low, the Xitaizi site shows an increase in T to ET with an increase of NDVI; however, the T/ET ratio becomes insensitive when NDVI is beyond a certain range (Figure 10). This is shown in Figure 10 when the NDVI is about 0.95. The T/ET ratio shows a high level of variation, ranging from 0.2 to 0.8. This might be the reason for the low NDVI, due to which the potential canopy transpiration determined by environmental factors is much higher than the physiological factors, which also indicates that canopy transpiration is limited by physiological factors under low NDVI conditions. Therefore, the canopy transpiration increases linearly with the increase in NDVI, consequently leading to a rapid increase of T/ET ratio. However, when NDVI is higher than a threshold value, the potential canopy transpiration determined by physiological factors is much higher than the environmental factors. In such a situation, the potential canopy transpiration is constrained by environmental conditions rather than plant physiological factors and thus the T/ET ratio is insensitive to the variation in NDVI. A similar pattern was found by Tie [50] during an assessment of the relationship between LAI and sap flow density (SFD), which concluded that there is a threshold effect associated with the controlling impact of LAI on SFD.
The relationship between T/ET ratio and NDVI is relatively different in the case of the Daman and Xinier sites (Figure 10). The T/ET ratio is highly correlated to NDVI with an R2 value of 0.9 at the Daman site, whereas the T/ET ratio is irrelevant to NDVI at the Xinier site due to seasonal variation. This is because both sites are irrigated during the growing season but the type of irrigation and schedule are relatively different. At Daman, flood irrigation is applied about four times during the growing season and soil evaporation contributes a high portion of ET. Transpiration is confined to the amount of water that the crop absorbed from the soil, which depends on the density of roots and vegetation cover; therefore, transpiration is mainly determined by physiological factors. In contrast, Xinier is mainly governed by mulched drip irrigation, which is applied in the growing season, from June to August. As drip irrigation transports a very limited amount of water directly to the crop root zone, the soil water in the inter-film zone is very low; as a result, soil evaporation only contributes a small portion to ET when irrigation takes place. Transpiration is highly related to irrigation events, so, even with the same NDVI, transpiration could be quite different with or without irrigation, which leads to an inconsistent relationship between NDVI and T/ET ratio.

4. Conclusions

In this study, an ET partitioning approach based on the concept of underlying water use efficiency is used to calculate T/ET ratio and then compare the vegetation’s impact on T/ET ratio at five sites in Northern China with different vegetation types. Half-hourly flux eddy covariance data are applied to derive the uWUEp, uWUEa, and T/ET ratio. The effect of vegetation on the T/ET ratio is examined using NDVI data by MODIS. The results reveal that the uWUEp and T/ET ratio vary among different sites with different vegetation types and irrigation schemes, and the vegetation effect over ET partitioning shows different type of patterns.
In an alpine meadow site, the T/ET ratio increases gradually when NDVI is low, whereas it increases rapidly as NDVI becomes high.
In arid shrubland, the T/ET ratio grows rapidly when NDVI is low and the T/ET ratio is constrained to a certain value when NDVI reaches a relatively high value.
In deciduous forest, the T/ET ratio becomes insensitive to NDVI variation beyond the threshold value.
For the two crop sites, it is observed that the correlation between T/ET ratio and NDVI is determined by irrigation schemes. The T/ET ratio shows a positive correlation with NDVI variation during flood irrigation, whereas it proves irrelevant to NDVI variation during mulch drip irrigation.
In addition, the correlation of T/ET ratio and NDVI becomes more complex when we consider the impact of anthropogenic factors such as irrigation. This study can be extended by taking into account ET partitioning at different sites and under different human activities. This work will help policy makers to better understand the relationship between vegetation and climate change or human activities, and also provide significant information for policy-making on water management.

Author Contributions

Conceptualization, H.H., F.T. and L.C., methodology, H.H., L.C. and H.L.; writing—original draft preparation, H.H. and L.C.; writing—review and editing, all authors.

Funding

This research was funded by the National Science Foundation of China, grant number “51879136”, “91647205” and the National Key Research and Development Program of China, grant number “2016YFC0402701”, “2017YFD050540503”.

Acknowledgments

Lajiao Chen (201704910065) would like to acknowledge the fellowship from the China Scholarship Council (CSC).

Conflicts of Interest

The authors declare no conflict of interest.

References

  1. Fisher, J.B.; Melton, F.; Middleton, E.; Hain, C.; Anderson, M.; Allen, R.; Mccabe, M.F.; Hook, S.; Baldocchi, D.; Townsend, P.A. The future of evapotranspiration: Global requirements for ecosystem functioning, carbon and climate feedbacks, agricultural management, and water resources. Water Resour. Res. 2017, 53, 2618–2626. [Google Scholar] [CrossRef] [Green Version]
  2. Oki, T.; Kanae, S. Global hydrological cycles and world water resources. Science 2006, 313, 1068–1072. [Google Scholar] [CrossRef] [PubMed]
  3. Lawrence, D.M.; Thornton, P.E.; Oleson, K.W.; Bonan, G.B. The partitioning of evapotranspiration into transpiration, soil evaporation, and canopy evaporation in a GCM: Impacts on land-atmosphere interaction. J. Hydrometeorol. 2007, 8, 862–880. [Google Scholar] [CrossRef]
  4. Wilcox, B.P.; Turnbull, L.; Young, M.H.; Williams, C.J.; Ravi, S.; Seyfried, M.S.; Bowling, D.R.; Scott, R.L.; Germino, M.J.; Caldwell, T.G.; et al. Invasion of shrublands by exotic grasses: Ecohydrological consequences in cold versus warm deserts. Ecohydrology 2012, 5, 160–173. [Google Scholar] [CrossRef]
  5. Wang, K.; Dickinson, R.E. A review of global terrestrial evapotranspiration: Observation, modeling, climatology, and climatic variability. Rev. Geophys. 2012, 50, RG2005. [Google Scholar] [CrossRef]
  6. Maxwell, R.M.; Condon, L.E. Connections between groundwater flow and transpiration partitioning. Science 2016, 353, 377–380. [Google Scholar] [CrossRef] [PubMed] [Green Version]
  7. Jasechko, S.; Sharp, Z.D.; Gibson, J.J.; Birks, S.J.; Yi, Y.; Fawcett, P.J. Terrestrial water fluxes dominated by transpiration. Nature 2013, 496, 347–350. [Google Scholar] [CrossRef] [PubMed]
  8. Schlesinger, W.H.; Jasechko, S. Transpiration in the global water cycle. Agric. For. Meteorol. 2014, 189, 115–117. [Google Scholar] [CrossRef]
  9. Scott, R.L.; Huxman, T.E.; Cable, W.L.; Emmerich, W.E. Partitioning of evapotranspiration and its relation to carbon dioxide exchange in a Chihuahuan Desert shrubland. Hydrol. Process. 2006, 20, 3227–3243. [Google Scholar] [CrossRef] [Green Version]
  10. Chen, L.J.; Sun, L.Y.; Liu, W.J.; Wang, L.Z.; Wu, H.; Zhu, A.X.; Luo, Y.Q. Evapotranspiration partitioning using an optimality-based ecohydrological model in a semiarid shrubland. Int. J. Digit. Earth 2018. [Google Scholar] [CrossRef]
  11. Young, M.H.; Caldwell, T.G.; Meadows, D.G.; Fenstermaker, L.F. Variability of soil physical and hydraulic properties at the Mojave Global Change Facility, Nevada: Implications for water budget and evapotranspiration. J. Arid Environ. 2009, 73, 733–744. [Google Scholar] [CrossRef]
  12. Wang, L.; Caylor, K.K.; Villegas, J.C.; Barron-Gafford, G.A.; Breshears, D.D.; Huxman, T.E. Partitioning evapotranspiration across gradients of woody plant cover: Assessment of a stable isotope technique. Geophys. Res. Lett. 2010, 37, L09401. [Google Scholar] [CrossRef]
  13. Wang, L.; Good, S.P.; Caylor, K.K. Global synthesis of vegetation control on evapotranspiration partitioning. Geophys. Res. Lett. 2014, 41, 6753–6757. [Google Scholar] [CrossRef] [Green Version]
  14. Wei, Z.; Yoshimura, K.; Okazaki, A.; Kim, W.; Liu, Z.; Yokoi, M. Partitioning of evapotranspiration using high-frequency water vapor isotopic measurement over a rice paddy field. Water Resour. Res. 2015, 51, 3716–3729. [Google Scholar] [CrossRef] [Green Version]
  15. Raz-Yaseef, N.; Yakir, D.; Schiller, G.; Cohen, S. Dynamics of evapotranspiration partitioning in a semi-arid forest as affected by temporal rainfall patterns. Agric. For. Meteorol. 2012, 157, 77–85. [Google Scholar] [CrossRef]
  16. Moran, M.S.; Scott, R.L.; Keefer, T.O.; Emmerich, W.E.; Hernandez, M.; Nearing, G.S.; O’Neill, P.E. Partitioning evapotranspiration in semiarid grassland and shrubland ecosystems using time series of soil surface temperature. Agric. For. Meteorol. 2009, 149, 59–72. [Google Scholar] [CrossRef]
  17. Raz-Yaseef, N.; Rotenberg, E.; Yakir, D. Effects of spatial variations in soil evaporation caused by tree shading on water flux partitioning in a semi-arid pine forest. Agric. For. Meteorol. 2010, 150, 454–462. [Google Scholar] [CrossRef]
  18. Zhou, S.; Yu, B.; Zhang, Y.; Huang, Y.; Wang, G. Partitioning evapotranspiration based on the concept of underlying water use efficiency. Water Resour. Res. 2016, 52, 1160–1175. [Google Scholar] [CrossRef]
  19. Liu, Y.; Xiao, J.; Ju, W.; Zhou, Y.; Wang, S.; Wu, X. Water use efficiency of China’s terrestrial ecosystems and responses to drought. Sci. Rep. 2015, 5, 13799. [Google Scholar] [CrossRef] [PubMed] [Green Version]
  20. Kool, D.; Agam, N.; Lazarovitch, N.; Heitman, J.L.; Sauer, T.J.; Ben-Gal, A. A review of approaches for evapotranspiration partitioning. Agric. For. Meteorol. 2014, 184, 56–70. [Google Scholar] [CrossRef]
  21. Cavanaugh, M.L.; Kurc, S.A.; Scott, R.L. Evapotranspiration partitioning in semiarid shrubland ecosystems: A two-site evaluation of soil moisture control on transpiration. Ecohydrology 2011, 4, 671–681. [Google Scholar] [CrossRef]
  22. Wilson, K.B.; Hanson, P.J.; Mulholland, P.J.; Baldocchi, D.D.; Wullschleger, S.D. A comparison of methods for determining forest evapotranspiration and its components: Sap-flow, soil water budget, eddy covariance and catchment water balance. Agric. For. Meteorol. 2001, 106, 153–168. [Google Scholar] [CrossRef]
  23. Cammalleri, C.; Rallo, G.; Agnese, C.; Ciraolo, G.; Minacapilli, M.; Provenzano, G. Combined use of eddy covariance and sap flow techniques for partition of ET fluxes and water stress assessment in an irrigated olive orchard. Agric. Water Manag. 2013, 120, 89–97. [Google Scholar] [CrossRef] [Green Version]
  24. Scott, R.L.; Biederman, J.A. Partitioning evapotranspiration using long-term carbon dioxide and water vapor fluxes. Geophys. Res. Lett. 2017, 44, 6833–6840. [Google Scholar] [CrossRef]
  25. Zeggaf, A.T.; Takeuchi, S.; Dehghanisanij, H.; Anyoji, H.; Yano, T. A Bowen ratio technique for partitioning energy fluxes between maize transpiration and soil surface evaporation. Agron. J. 2008, 100, 988–996. [Google Scholar] [CrossRef]
  26. Holland, S.; Heitman, J.L.; Howard, A.; Sauer, T.J.; Giese, W.; Ben-Gal, A.; Agam, N.; Kool, D.; Havlin, J. Micro-Bowen ratio system for measuring evapotranspiration in a vineyard interrow. Agric. For. Meteorol. 2013, 177, 93–100. [Google Scholar] [CrossRef]
  27. Sakuratani, T. A heat balance method for measuring water flux in the stem of intact plants. J. Agric. Meteorol. 1981, 37, 9–17. [Google Scholar] [CrossRef]
  28. Mitchell, P.J.; Veneklaas, E.; Lambers, H.; Burgess, S.S. Partitioning of evapotranspiration in a semi-arid eucalypt woodland in south-western Australia. Agric. For. Meteorol. 2009, 149, 25–37. [Google Scholar] [CrossRef]
  29. Boast, C.W.; Robertson, T.M. A “Micro-Lysimeter” Method for Determining Evaporation from Bare Soil: Description and Laboratory Evaluation 1. Soil Sci. Soc. Am. J. 1982, 46, 689–696. [Google Scholar] [CrossRef]
  30. Shawcroft, R.W.; Gardner, H.R. Direct evaporation from soil under a row crop canopy. Agric. Meteorol. 1983, 28, 229–238. [Google Scholar] [CrossRef]
  31. Wei, Z.; Lee, X.; Wen, X.; Xiao, W. Evapotranspiration partitioning for three agro-ecosystems with contrasting moisture conditions: A comparison of an isotope method and a two-source model calculation. Agric. For. Meteorol. 2018, 252, 296–310. [Google Scholar] [CrossRef]
  32. Stannard, D.I.; Weltz, M.A. Partitioning evapotranspiration in sparsely vegetated rangeland using a portable chamber. Water Resour. Res. 2006, 42. [Google Scholar] [CrossRef] [Green Version]
  33. Rothfuss, Y.; Biron, P.; Braud, I.; Canale, L.; Durand, J.L.; Gaudet, J.P.; Richard, P.; Vauclin, M.; Bariac, T. Partitioning evapotranspiration fluxes into soil evaporation and plant transpiration using water stable isotopes under controlled conditions. Hydrol. Process. 2010, 24, 3177–3194. [Google Scholar] [CrossRef]
  34. Yepez, E.A.; Huxman, T.E.; Ignace, D.D.; English, N.B.; Weltzin, J.F.; Castellanos, A.E.; Williams, D.G. Dynamics of transpiration and evaporation following a moisture pulse in semiarid grassland: A chamber-based isotope method for partitioning flux components. Agric. For. Meteorol. 2005, 132, 359–376. [Google Scholar] [CrossRef]
  35. Wenninger, J.; Beza, D.T.; Uhlenbrook, S. Experimental investigations ofwater fluxes within the soil-vegetation-atmosphere system: Stable isotopemass-balance approach to partition evaporation and transpiration. Phys. Chem. Earth 2010, 35, 565–570. [Google Scholar] [CrossRef]
  36. Good, S.P.; Soderberg, K.; Guan, K.; King, E.G.; Scanlon, T.M.; Caylor, K.K. δ2H isotopic flux partitioning of evapotranspiration over a grass field following a water pulse and subsequent dry down. Water Resour. Res. 2014, 50, 1410–1432. [Google Scholar] [CrossRef]
  37. Hu, Z.M.; Wen, X.F.; Sun, X.M.; Li, L.H.; Yu, G.R.; Lee, X.H.; Li, S.G. Partitioningof evapotranspiration through oxygen isotopic measurements of water poolsand fluxes in a temperate grassland. J. Geophys. Res. 2014, 119, 358–371. [Google Scholar] [CrossRef]
  38. Wang, P.; Yamanaka, T.; Li, X.; Wei, Z. Partitioning evapotranspiration in a temperate grassland ecosystem: Numerical modeling with isotopic tracers. Agric. For. Meteorol. 2015, 208, 16–31. [Google Scholar] [CrossRef]
  39. Wei, Z.; Yoshimura, K.; Wang, L.; Miralles, D.G.; Jasechko, S.; Lee, X. Revisiting the contribution of transpiration to global terrestrial evapotranspiration. Geophys. Res. Lett. 2017, 44, 2792–2801. [Google Scholar] [CrossRef]
  40. Scanlon, T.M.; Sahu, P. On the correlation structure of water vapor and carbon dioxide in the atmospheric surface layer: A basis for flux partitioning. Water Resour. Res. 2008, 44. [Google Scholar] [CrossRef] [Green Version]
  41. Scanlon, T.M.; Kustas, W.P. Partitioning evapotranspiration using an eddy covariance-based technique: Improved assessment of soil moisture and land–atmosphere exchange dynamics. Vadose Zone J. 2012, 11, 3. [Google Scholar] [CrossRef]
  42. Skaggs, T.H.; Anderson, R.G.; Alfieri, J.G.; Scanlon, T.M.; Kustas, W.P. Fluxpart: Open source software for partitioning carbon dioxide and water vapor fluxes. Agric. For. Meteorol. 2018, 253, 218–224. [Google Scholar] [CrossRef]
  43. Baldocchi, D.; Falge, E.; Gu, L.; Olson, R.; Hollinger, D.; Running, S.; Anthoni, P.; Bernhofer, C.; Davis, K.; Evans, R.; et al. FLUXNET: A new tool to study the temporal and spatial variability of ecosystem-scale carbon dioxide, water vapor, and energy flux densities. Bull. Am. Meteorol. Soc. 2001, 82, 2415–2434. [Google Scholar] [CrossRef]
  44. Li, X.; Cheng, G.D.; Liu, S.M.; Xiao, Q.; Ma, M.G.; Jin, R.; Che, T.; Liu, Q.H.; Wang, W.Z.; Qi, Y.; et al. Heihe watershed allied telemetry experimental research (HiWATER): Scientific objectives and experimental design. Bull. Am. Meteorol. Soc. 2013, 94, 1145–1160. [Google Scholar] [CrossRef]
  45. Wen, X.; Yang, B.; Sun, X.; Lee, X. Evapotranspiration partitioning through in-situ oxygen isotope measurements in an oasis cropland. Agric. For. Meteorol. 2016, 230, 89–96. [Google Scholar] [CrossRef]
  46. Zhao, W.; Liu, B.; Chang, X.; Yang, Q.; Yang, Y.; Liu, Z.; Cleverly, J.; Eamus, D. Evapotranspiration partitioning, stomatal conductance, and components of the water balance: A special case of a desert ecosystem in China. J. Hydrol. 2016, 538, 374–386. [Google Scholar] [CrossRef]
  47. Zhao, W.; Liu, B. The response of sap flow in shrubs to rainfall pulses in the desert region of China. Agric. For. Meteorol. 2010, 150, 1297–1306. [Google Scholar] [CrossRef]
  48. Zhang, Z.; Hu, H.C.; Tian, F.; Hu, H.P.; Yao, X.; Zhong, R. Soil salt distribution under mulched drip irrigation in an arid area of northwestern China. J. Arid Environ. 2014, 104, 23–33. [Google Scholar] [CrossRef]
  49. Zhang, Z.; Tian, F.; Hu, H.; Yang, P. A comparison of methods for determining field evapotranspiration: Photosynthesis system, sap flow, and eddy covariance. Hydrol. Earth Syst. Sci. 2014, 10, 14131–14187. [Google Scholar] [CrossRef]
  50. Tie, Q.; Hu, H.; Tian, F.; Guan, H.; Lin, H. Environmental and physiological controls on sap flow in a subhumid mountainous catchment in North China. Agric. For. Meteorol. 2017, 240, 46–57. [Google Scholar] [CrossRef]
  51. Liu, S.M.; Xu, Z.W.; Wang, W.; Jia, Z.Z.; Zhu, M.J.; Bai, J.; Wang, J.M. A comparison of eddy-covariance and large aperture scintillometer measurements with respect to the energy balance closure problem. Hydrol. Earth Syst. Sci. 2011, 15, 1291–1306. [Google Scholar] [CrossRef] [Green Version]
  52. Wutzler, T.; Lucas-Moffat, A.; Migliavacca, M.; Knauer, J.; Sickel, K.; Šigut, L.; Menzer, O.; Reichstein, M. Basic and extensible post-processing of eddy covariance flux data with REddyProc. Biogeosciences 2018, 15, 5015–5030. [Google Scholar] [CrossRef]
  53. Falge, E.; Baldocchi, D.; Olson, R.; Anthoni, P.; Aubinet, M.; Bernhofer, C.; Burba, G.; Ceulemans, R.; Clement, R.; Dolman, H.; et al. Gap filling strategies for defensible annual sums of net ecosystem exchange. Agric. For. Meteorol. 2001, 107, 43–69. [Google Scholar] [CrossRef] [Green Version]
  54. Zhang, X.; Friedl, M.A.; Schaaf, C.B.; Strahler, A.H.; Hodges, J.C.; Gao, F.; Reed, B.C.; Huete, A. Monitoring vegetation phenology using MODIS. Remote Sens. Environ. 2003, 84, 471–475. [Google Scholar] [CrossRef]
  55. Bremnes, J.B. Probabilistic wind power forecasts using local quantile regression. Wind Energy 2004, 7, 47–54. [Google Scholar] [CrossRef]
  56. Wang, P.; Yamanaka, T. Application of a two-source model for partitioning evapotranspiration and assessing its controls in temperate grasslands in central Japan. Ecohydrology 2014, 7, 345–353. [Google Scholar] [CrossRef]
  57. Tian, F.; Yang, P.; Hu, H.; Dai, C. Partitioning of Cotton Field Evapotranspiration under Mulched Drip Irrigation Based on a Dual Crop Coefficient Model. Water 2016, 8, 72. [Google Scholar] [CrossRef]
Figure 1. Location of the five sites.
Remotesensing 10 01755 g001
Figure 2. Sketch representing the identification of growing season.
Remotesensing 10 01755 g002
Figure 3. The 95th quantile linear regression using the half-hourly data for each site in 2015.
Remotesensing 10 01755 g003
Figure 4. Linear regression using the half-hourly data for each site on a monthly and weekly scale. (a) is linear regression using the data of August in 2015, (b) is linear regression using data of the 23rd week in 2015.
Remotesensing 10 01755 g004
Figure 5. Frequency distribution of R2 value. (a) is regression R2 using the half-hourly data on monthly scale, (b) is regression R2 using the half-hourly data on weekly scale.
Remotesensing 10 01755 g005
Figure 6. Annual uWUEp for the five sites.
Remotesensing 10 01755 g006
Figure 7. Frequency distribution of weekly uWUEa.
Remotesensing 10 01755 g007
Figure 8. Frequency distribution of weekly T/ET ratio.
Remotesensing 10 01755 g008
Figure 9. Seasonal dynamic of weekly T/ET ratio.
Remotesensing 10 01755 g009
Figure 10. The relationship between NDVI and T/ET ratio.
Remotesensing 10 01755 g010
Table 1. Information on the five sites.
SitesVegetationLatitudeLongitudeElevation (m)Annual Precipitation (mm)Annual Temperature (℃)Period of Records
ArouMeadow38.0100.53033445.0−5.02013–2015
DamanSpring wheat and maize38.9100.41516204.05.42013–2015
SidaoqiaoShrub42.0101.1873116.89.62013–2015
XinierCrop41.686.288662.012.52013–2016
XitaiziForest40.5116.6974541.07.52015–2016
Table 2. A comparison of annual uWUEp for the five sites.
SiteuWUEp (g C hPa0.5/kg H2O)
2013201420152016Average
Arou13.2711.5112.25-12.34
Daman25.1726.1426.94-26.08
Sidaoqiao9.239.6611.15-10.02
Xinier24.0019.2320.6119.8720.61
Xitaizi--24.3324.8923.22

