Technical Note

Estimation of LAI in Winter Wheat from Multi-Angular Hyperspectral VNIR Data: Effects of View Angles and Plant Architecture

1
College of Resources and Environment, Fujian Agriculture and Forestry University, Fuzhou 350002, Fujian, China
2
University Key Lab of Soil Ecosystem Health and Regulation, Fujian Agriculture and Forestry University, Fuzhou 350002, Fujian, China
3
Key Laboratory of Digital Earth Science, Institute of Remote Sensing and Digital Earth, Chinese Academy of Science, Beijing 100094, China
4
State Key Laboratory of Remote Sensing Science, Jointly Sponsored by Institute of Remote Sensing and Digital Earth of Chinese Academy of Sciences and Beijing Normal University, Beijing 100101, China
*
Authors to whom correspondence should be addressed.
Remote Sens. 2018, 10(10), 1630; https://doi.org/10.3390/rs10101630
Submission received: 28 August 2018 / Revised: 9 October 2018 / Accepted: 10 October 2018 / Published: 13 October 2018
(This article belongs to the Section Remote Sensing in Agriculture and Vegetation)

Abstract

:
View angle effects present in crop canopy spectra are critical for the retrieval of the crop canopy leaf area index (LAI). In the past, the angular effects on spectral vegetation indices (VIs) for estimating LAI, especially in crops with different plant architectures, have not been carefully assessed. In this study, we assessed the effects of the view zenith angle (VZA) on relationships between the spectral VIs and LAI. We measured the multi-angular hyperspectral reflectance and LAI of two cultivars of winter wheat, erectophile (W411) and planophile (W9507), across different growing seasons. The reflectance of each angle was used to calculate a variety of VIs that have already been published in the literature as well as all possible band combinations of Normalized Difference Spectral Indices (NDSIs). The above indices, along with the raw reflectance of representative bands, were evaluated with measured LAI across the view zenith angle for each cultivar of winter wheat. Data analysis was also supported by the use of the PROSAIL (PROSPECT + SAIL) model to simulate a range of bidirectional reflectance. The study confirmed that the strength of linear relationships between different spectral VIs and LAI did express different angular responses depending on plant type. LAI–VI correlations were generally stronger in erectophile than in planophile wheat types, especially at the zenith angle where the background is expected to be more evident for erectophile type wheat. The band combinations and formulas of the indices also played a role in shaping the angular signatures of the LAI–VI correlations. Overall, off-nadir angles served better than nadir angle and narrow-band indices, especially NDSIs with combinations of a red-edge (700~720 nm) and a green band, were more useful for LAI estimation than broad-band indices for both types of winter wheat. But the optimal angles much differed between two plant types and among various VIs. High significance (R2 > 0.9) could be obtained by selecting appropriate VIs and view angles on both the backward and forward scattering direction. These results from the in-situ measurements were also corroborated by the simulation analysis using the PROSAIL model. For the measured datasets, the highest coefficient was obtained by NDSI(536,720) at −35° in the backward (R2 = 0.971) and NDSI(571,707) at 55° in the forward scattering direction (R2 = 0.984) for the planophile and erectophile varieties, respectively. This work highlights the influence of view geometry and plant architecture. The identification of crop plant type is highly recommended before using remote sensing VIs for the large-scale mapping of vegetation biophysical variables.

Graphical Abstract

1. Introduction

Leaf area indiex (LAI) is one of the key vegetation structural variables for understanding the biophysical processes of crop canopies [1,2] and provides important information for the identification of the early assessment of crop conditions, prediction of crop yields, and even scheduling of irrigation [3]. A simple and widely used application for quick and efficient leaf area index (LAI) mapping is to extract empirical relationships between field-measured LAI and spectral vegetation indices (VIs) derived from optical remote sensing data. However, three-dimensional vegetation structures are not easily detectable by VIs derived from conventional nadir observations. As an alternative, VIs derived from multi-angular remote sensing data may provide additional information for enhancing the retrieval of canopy structure variables since they offer a means to characterize the anisotropy of surface reflectance, which may allow us to describe three-dimensional vegetation structures [4,5,6].
A number of studies have focused on investigating view angle effects on traditional VIs designed for nadir viewing, and have demonstrated that various VIs derived from multiple spectral bands often present different view angular effects [7,8,9,10,11]. Directional responses of VIs caused by view geometry thus inevitably affect their angular performances for detecting ecosystem variables. For instance, Aparicio et al. [12] revealed that the performance of VIs to predict wheat yield varied with the sensor view angle. Jay et al. [13] also found that the retrieval accuracy of structural and biochemical sugar beet plant traits from VIs were strongly dependent on sun-view geometry. Danner et al. [14] found anisotropic effects of sensor view angle on reflectance were relatively strong for early growth stages of the winter wheat canopy, which also influenced the retrieval of the LAI based on PROSAIL model. Galvão et al. [15] and Breunig et al. [7] tested the effect of view directions on the normalized difference vegetation index (NDVI)–soybean yield and NDVI–LAI relationships, respectively, and both showed that backward scattering performed better than the forward scattering direction. Stagakis et al. [16] found that the large angle in the forward scattering direction (+55°) of CHRIS/PROBA observations stood out for high correlation with canopy biophysical and biochemical parameters in shrub. Similar performances were also observed between CHRIS +55° and −55° angles in foliar nitrogen concentration prediction [17]. Indices derived from off-nadir viewing provided better discrimination of cover and LAI [18]. Likewise, off-nadir measurements were more closely related to photosynthetic efficiency prediction than nadir measurements over an irrigated rice field [19]. According to the above, studies with respect to the multi-angular approach often concluded that off-nadir angles improved the performance of VIs in monitoring the ecosystem when compared to nadir viewing, since they better accounted for structural heterogeneity and canopy shading [20].
Apart from view angle, plant architecture (e.g., leaf angle distribution, foliage clumping) should also be considered for crop LAI estimation from VIs. Huang et al. [21] suggested that the leaf angle of the crop should be taken into consideration in estimating LAI and monitoring crop growth status when using an optical remote sensing approach since the leaf angle affects light interception, which influences canopy reflectance. For instance, at the nadir angle, planophile canopies are expected to have more vegetation coverage and be less influenced by the background when compared with the erectophile canopies of the same LAI [21,22]. Canopy reflectance is strongly affected by vegetation coverage, thus tending to produce misleading results if prior knowledge of canopy architectures is unavailable [21]. Darvishzadeh et al. [22] assessed the effects of plant architecture on the retrieval of LAI from hyperspectral data and confirmed that the strength of the relationships between VIs and LAI differed for different vegetation species with different leaf sizes and architectures. Similarly, the study involving different crop structures conducted by Zou et al. [23] confirmed the importance of leaf angle information on LAI mapping using VIs. However, they both only used VIs derived from nadir data. In fact, different plant architectures lead to variation in canopy greenness and background information contained in the view, which is supposed to influence the directional performance of VIs. In other words, the view angle effect of VI is also dependent on the structure of the vegetation canopy. Verrelst et al. [20] found that various indices presented significantly different angular responses in pine forest and meadow.
Although some studies have demonstrated the dependence of plant architecture or view angles on the sensitivity of VIs to LAI, the influence of both factors on the predictive performance of VIs, especially narrow band VIs, has not been adequately investigated. In comparison with broad-band VIs, narrow band VIs may be more crucial for providing additional information for quantifying the biophysical characteristics of vegetation [24,25,26,27,28]. The lack of directional testing for different plant type structure limits the potential use of the VIs for consistent and accurate long-term monitoring of crop growth on a large scale. In this study, we attempted to bridge this gap for various VIs determined in visible to near-infrared (VNIR, 400~1000 nm) hyperspectral wavelengths.
Our study aimed to explore the effects of view angles on the performance of spectral vegetation indices determined in VNIR wavelengths in predicting the LAI of a crop with different plant architectures. To that purpose, in-situ measurements of multi-angle hyperspectral reflectance and LAI in the growth cycle of winter wheat were used in the study. Two types of plant that differed in canopy structure were selected. Commonly used band reflectance, proposed indices in the literature as well as potential band combinations determined in the wavelengths from 400~1000 nm were all derived from each observing angle and tested for their linear relationships with LAI. To generalize and validate the results from our field measurements, data analysis was also applied on modeling bidirectional reflectance distribution function (BRDF) based on the canopy reflectance model PROSAIL. The PROSAIL model is a combination of the PROSPECT and SAIL model. As reviewed by [29], the PROSAIL model is highly suitable for studying the sensitivity of spectral VIs to biophysical parameters, especially for grass and crop canopies.

2. Materials and Methods

2.1. Experimental Design

The experiments were conducted over two different years (2004 and 2011) at the China National Experimental Station for Precision Agriculture, in the Changping district of Beijing (40°10.6′N, 116°26.3′E), China. Two types of winter wheat (W411 and W9507) with different canopy structures were selected. W411, with a leaf mean tilt angle (MTA) between 55° and 70°, was treated as an erectophile type wheat, and W9507, with a MTA between 15° and 45°, was treated as a planophile type wheat. Two experimental fields cultivated with W411 and W9507, respectively, were selected to provide samples, with an area of 1200 m2 for each field. The average row space was 0.15 m. Two types of wheat were cultivated in a silty clay soil with sufficient water supply and uniform nutrient management. The information of the nutrient content in the surface soil (0 to 0.20 m) was described in detail by [21]. We established a quadrate of 1 m × 1 m as a standard sample randomly located in the experimental field to measure canopy reflectance and to analyze the biophysical and biochemical features of the crop canopy. A total of fourteen samples for the two cultivars of wheat were collected between April and June 2004 at different wheat growing seasons. To increase the datasets during the rapid growth of winter wheat, we measured another six samples between April and May, 2011. Wheat type, solar zenith angle (ranging from 32° to 48.4°, with a median of 35°), and the growth period of each plot are all shown in Table 1. A photograph of two varieties of winter wheat can be seen in Figure 1 from [30].

2.2. In-Situ Measurements

2.2.1. Spectral Measurement

Spectra of the wheat canopy were measured in a 1 × 1 m2 area of each plot under clear sky conditions between 9:20 and 15:40 (local time, illustrated in Table 1) on each day using a portable spectrum radiometer (FS-FR2500, ASD Inc., Boulder, CO, USA) with a view angle of 25°. The spectrometer operated over a 400 to 1000 nm spectral range with a sampling interval of 1 nm and a resolution of 3 nm. To enable hemispherical directional reflectance factor (HDRF) observations of the same target in a short time and to keep the distance from the sensor to the center of the target almost unchanged with changing view angle, the spectrometer was mounted on a rotating bracket of the multi-angular observation equipment at a height of 1.3 m above the mean canopy surface on the zenith angle. The description of the rotating bracket and experiment site can be seen in [21] (p. 3603, Figure 1). The HDRF was measured in the principal plane (PP, the azimuth plane of the sun) from 65° (forward scattering direction, positively away from the sun) to −65° (back scattering direction, negatively into the sun) by changing the observation angle in five-degree increments, with the view zenith angle (VZA) defined as zero at the nadir position. To keep the solar angle as a stable factor during the spectral sampling of each plot, measurements were taken away from the solar noon, when the changes in the solar angle were relatively small, and the spectral sampling of each plot was completed in six minutes. Vegetation reflectance measurement per view angle was taken by averaging 20 scans at optimized integration times. A 0.4 × 0.4 m2 BaSO4 calibration panel was used to calculate baseline reflectance by averaging reflectance measured over calibration panel before and after the vegetation measurement of each plot.

2.2.2. Canopy Structure Measurements

After the spectral measurements, all plants within a 0.6 × 0.6 m2 area from each plot were cut at ground level and were transported to the laboratory. We took 10% of all the sampled leaves as a subsample for the leaf area measurement. LI-COR 3100 area meter (LI-COR, Inc., Lincoln, Nebraska, USA) was used to measure the leaf surface areas of the subsample (LAsub). The weight of all the sampled leaves (Mall) and the subsample of leaves (Msub) were also measured, respectively. Then, the LAI of the sample area was estimated as follows [31]:
  LAI   =   ( LA sub   ×   M all M sub ) / PA  
where PA is the sampled projection area.
Additionally, the MTA of the canopies was measured by a LAI-2000 plant canopy analyzer (Li-Cor, Lincoln, NE, USA) at each growing season, except for senescence in 2004. LAI-2000 makes light measurements with a “fish-eye” optical sensor. Measurements made above and below the canopy are used to calculate the canopy transmittance at five zenith angles. The LAI and MTA are then computed from the canopy transmittance based on a model of radiative transfer in vegetative canopies. We measured MTA by LAI-2000 at sunset to avoid making measurements under direct sunlight. For each plot, a sequence of one above- and four below-canopy readings regularly distributed was acquired. We repeated the cycle of LAI-2000 readings (the same sensor mode was used) three times with the four below-canopy readings at different locations in each plot. Average MTA for each plot (listed in Table 1) was calculated by all measurements. The mean values of the MTA measured in 2004 were 33.24 (±6.34) and 62.22 (±6.05) for erectophile and planophile, respectively. According to the measurements by LAI-2000, it is reasonable to distinguish canopy structures between the two varieties by MTA. This information is useful to determine the values of MTA in PROSAIL simulations over the two varieties.

2.3. Methods

2.3.1. Measured Data Pre-Processing

As illustrated in Table 1, plots of HDRFs were measured under various solar zenith angles (32°~48.4°). Therefore, each set of HDRFs were first normalized to a uniform solar zenith angle (SZA) before their further application to keep the SZA as a constant factor while isolating the impact of view directions in the PP [32]. Other advantages of using normalized HDRFs directly rather than the measured HDRFs are to eliminate sensor noise and to minimize variations in sun-view-geometry for variable retrieval. Previous studies have proven that the separability of forest types [33] and the retrieval of LAI [34] can be significantly enhanced by normalizing the reflectance to a uniform sun-view-geometry. Kernel-driven semi-empirical models [35] are often used for such normalization. The RossThick-LiSparse (RTLS) model [36,37], a Kernel-driven semi-empirical model, was used in this study as a normalization tool to obtain the HDRFs for the selected sun-view-geometries (normalized HDRFs) from the available multi-angle data measured. This model is currently implemented in the operational MODIS (moderate resolution imaging spectroradiometer) BRDF /Albedo algorithm [38].
The RTLS model is described as a linear combination of three basic scattering components: isotropic scattering, volume scattering, and geometric scattering with the general form of
  HDRF ( θ s , θ v , ϕ )   =   f iso +   f vol × k vol ( θ s , θ v , ϕ )   +   f geo   ×   k geo ( θ s , θ v , ϕ )  
where HDRF ( θ s , θ v , ϕ ) is the HDRF at the selected angle combination of a view zenith ( θ v ), solar zenith ( θ s ), and relative azimuth angle ( ϕ ). kvol and Kgeo are two kernels that describe the volumetric scattering (i.e., multiple scattering within canopies) and the geometric scattering (i.e., shadowing effects), respectively. fiso, fvol, and fgeo are the model parameters. fvol and fgeo serve as the weighting factors for kvol and Kgeo kernels, respectively, and fiso denotes the contribution of isotropic scattering that determines the optical properties in relation to reflectance and transmittance of vegetation foliage and background [39]. Previous studies have developed several expressions for the two types of kernels [40]. In this research, we chose the RossThick kernel for Kvol [35] and the LiSparse Kernel for Kgeo [35]. Both Kvol and Kgeo are functions of θ v , θ s , and ϕ .
For each plot, multi-angle reflectance values measured in the principal plane were available. The corresponding sun-view-geometries ( θ v , θ s illustrated in Table 1 and ϕ , 0° in the backward scattering direction and 180° in the forward scattering direction) were used to calculate Kgeo and kvol. Therefore, the model parameters (fiso, fgeo, fvol in Equation (2)) of each plot were retrieved by the linear fitting RTLS model (Equation (2)), using multi-angle observations as the input. The estimated model parameters, fiso, fgeo, and fvol, were then used to run the RTLS model in forward mode. In this way, the HDRF of each plot at any angle combination ( θ v , θ s , ϕ ) (HDRF( θ v , θ s , ϕ )) can be estimated from Equation (2). Here, we set θ s to 35°, chosen in accordance with the median of the SZAs of the observations (Table 1). VZAs ( θ v ) were set to the same values of the observations. The normalized HDRFs of each plot at wavelengths ranging from 400 to 1000 nm along the principal plane were estimated, which were applied in the following analysis. Therefore, the raw reflectance of each band (Rx, x denotes the position of wavelength) presented in the following refer to normalized HDRFs at a uniform SZA of 35°.

2.3.2. Spectral Analysis and Indices Calculation

Raw reflectance, several indices, and index types were developed for examining their performance on LAI determination. Each view zenith angle was processed as an individual set of HDRFs and the following calculation was applied separately for each observation angle.
• Raw reflectance
Some representative bands were selected from 400 to 1000 nm for evaluating their sensitivities to LAI. These bands were selected according to wavelengths used in greenness and stress indices reviewed by [16] that included a variety of published narrow-band VIs. Selected bands are listed as follows: (a) blue bands 430 nm, 440 nm, 445 nm; (b) green bands 531 nm, 550nm, 539 nm, 570 nm; (c) red bands 670 nm, 680 nm, 681 nm, 690 nm; (d) red-edge bands 705 nm, 709 nm 720 nm; (e) near-infrared (NIR) bands 740 nm, 747 nm, 750 nm, 800 nm.
• Published VIs
As illustrated in Table 2, 11 proposed narrow-band VIs in the literature were selected in this study and sorted into three groups according to band combinations and the formulas of indices. Simple greenness indices (Table 2) are often used in measuring vegetation biophysical or biochemical parameters, and the bands adopted in these indices, especially the NIR and red bands, are widely available in modern multispectral systems. NDVI is the most obvious first choice among these indices, however, the saturation of NDVI at intermediate LAI values limits its application. As the supplements, we included advanced greenness indices in the study (Table 2). These indices (e.g., EVI, MSAVI, TVI) were developed for better correlation to LAI than NDVI by incorporating a new band and constant coefficients to reduce the influence from the soil background and increase the saturation limitation [45,46,47]. The first two groups of indices presented above have often been proven to be effective in the estimation of LAI, while stress indices (Table 2) are designed to detect the stress conditions in leaves. Given that LAI is closely related to plant health, the potential of stress indices in LAI estimation can be expected. More importantly, it is of interest to examine whether the angular performances of VIs depend on band combinations and the formulas of indices.
• A general index formula experimental combinations
We established all possible combinations of two bands at wavelengths between 400 and 1000 nm with an interval of 1 nm based on a general index formula of Normalized Difference Spectral Index (NDSI). This is a straightforward way to evaluate a greater range of vegetation indices than those listed in Table 2. The NDSIs combine the reflectance of two bands (Rx, Ry, x, and y correspond to index wavelengths) and are widely used for scientific and operational applications [16], as shown below.
  NDSI ( x , y )   =   ( R x     R y ) / ( R x   +   R y )  
All possible wavelength combinations between 400 and 1000 nm were applied in the NDSI formula. Taking into account that NDSI(x,y) = −NDSI(y,x), there are 180,300 different combinations possible for the measured datasets.
• Data Analysis
Based on the measured datasets, HDRFs of some representative bands at different VZAs in the principle plane were assessed and compared over two types of winter wheat with similar LAI values. The performances of all indices presented above (raw reflectance, published VIs as well as all possible band combinations of NDSIs in LAI estimation) were evaluated and compared based on their linear relationship with the field measured LAI over two types of winter wheat, respectively. Meanwhile, their performances in different viewing angles were also examined. The comparison among the abilities of indices was basically dependent on the coefficients of determination (R2) for each linear relationship. Regarding the analysis of published VIs, the average difference of R2 among the different VZAs ( AD _ R 2 ) was calculated to quantify the view angle sensitivity of each index for its linear relationships with LAI [52], with the formula
  AD _ R 2 = R max 2     R min 2 R average 2  
where R max 2 and R min 2 denote the maximum and minimum R2 obtained by each index at different VZAs for their linear relationships with LAI. R average 2 denotes the averaged R2 obtained by each index of different VZAs.

2.3.3. PROSAIL Simulations

For this study, PRO4SAIL-5B, which is a combination of the leaf (PROSPECT-5B) and canopy (4SAIL) reflectance model, was used for the sensitivity analysis. The coupling of PROSPECT-5B and 4SAIL models consists in passing the output leaf reflectance and transmittance of the PROSPECT-5B model into the 4SAIL model to simulate the bidirectional reflectance at canopy scale [29]. The 4SAIL model can simulate the canopy reflectance with input parameters including LAI, MTA (deg), hot spot size parameter (Hot), and the fraction of diffuse incoming solar radiation (Skyl) as well as parameters that control the view and illumination geometry, i.e., SZA, VZA, the azimuth angle between the sun and sensor (relative azimuth angle, RAA). The PROSEPCT-5B model can simulate leaf reflectance and transmittance with six leaf parameters including leaf chlorophyll a and b content (Cab, µg.cm−2), leaf carotenoid content (Ccar, µg.cm−2), leaf dry matter content (Cm, g.cm−2), equivalent water thickness (Cw, cm), leaf brown pigment content (Cbp), and the mesophyll structure parameter N.
A range of wheat canopy BRDF (400 nm~1050 nm) for the two varieties were simulated in terms of the range of parameter combinations listed in Table 3. The differences of canopy BRDF modeling between the two varieties were determined by MTA (MTA = 15, 30, 40 for planophile, MTA = 50, 60, 70 for erectophile), which were selected based on information from the field data collection. The values of Cab, LAI, Hot, N, and Cw were drawn randomly (uniform distribution) within the specified ranges presented in Table 3. The ranges of LAI and Cab were selected according to the field measurements, while the ranges of Cw [53], Hot [54], and N [54] were similarly selected based on the existing literature. Ccar was selected as one fifth of Cab [23]. Cm was fixed to the 0.0135 average of the in-situ measurements [30]. Cbp was set to 0, assuming that the leaves were green during measurements. Following the suggestion of [53], Skyl was fixed to 0.1 across all wavelengths. With respect to the soil spectrum, an average soil spectrum taken from the in-situ measurements was used as presented in Figure 1. The SZA was fixed to 35°, and the VZA and RAA were set to coincide with the field measurements.
The simulated reflectance at each angle was further spectrally resampled to the CHRIS/PROBA sensor (Compact High Resolution Imaging Spectrometer on the PROBA platform), with 62 spectral bands ranging from 400 nm to 1050 nm. Among the existing satellite instruments, CHRIS offers unique hyperspectral and multi-angular capabilities in the visible and near-infrared region. We also wondered how these hyperspectral bands of CHRIS worked if they were observed with multi-angles in the principle plane. This would provide an insight of the performance of multi-angular sensors for agricultural monitoring.
The 62 simulated bands at each observing angle were used to calculate the proposed indices (Table 2) and NDSIs (Equation (3)) to test their linear relationship with LAI. For the proposed indices calculation, the available band, of which the central wavelength was closest to each prototype formulation wavelength (Table 2), was used. For the NDSIs calculation, there were 1892 different band combinations generated by 62 bands. Note that the spatial resolution and atmospheric effect of CHRIS data were not considered in the PROSAIL simulation, hence, the results from the simulated data with respect to satellite performance must remain preliminary.

3. Results

3.1. Results Based on Measured Data

3.1.1. Variation of HDRFs in the Principle Plane at Two Different Growth Stages

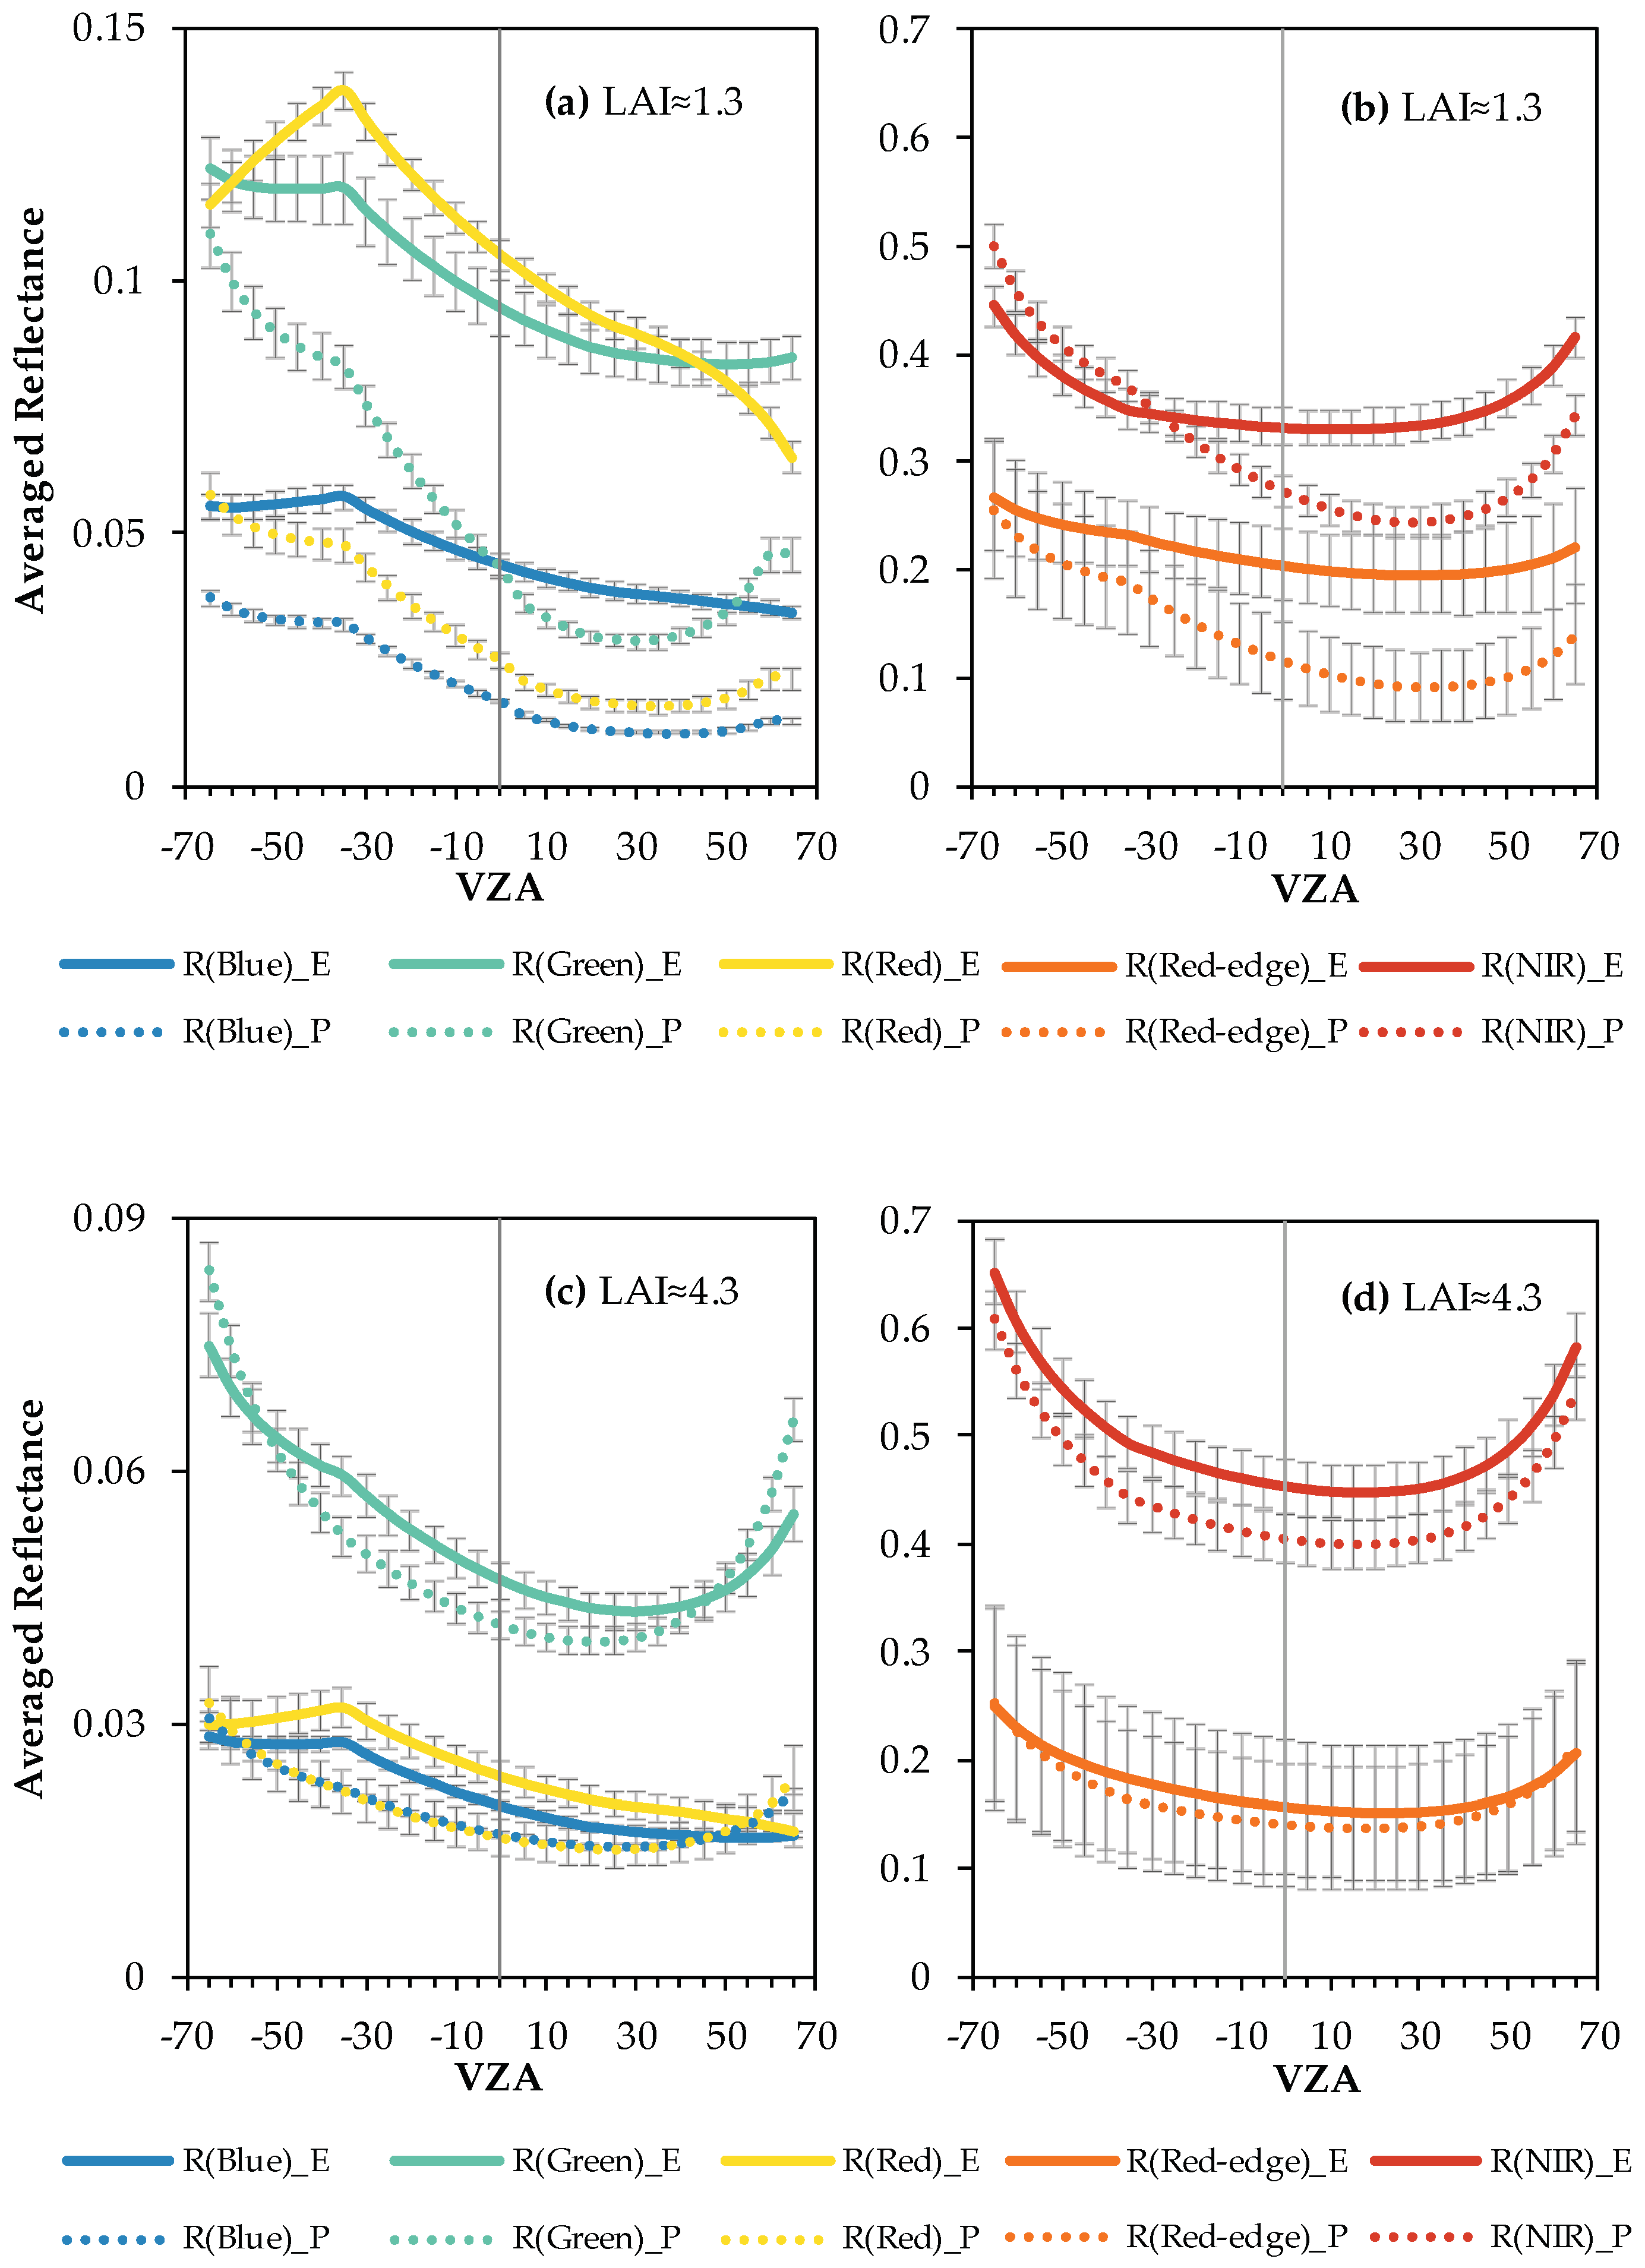
Some bands including blue (430–445 nm), green (531–570 nm), red (670–690 nm), red-edge (705–734 nm), and NIR (740–970 nm), referred to as Band(X1–X2), were selected. The average reflectance of these bands at different VZAs in the PP were assessed and compared over two types of winter wheat with similar LAI values, which is shown in Figure 2. In Figure 2, the x-axis denotes VZA in the PP where the negative angles were in the back-scattering direction and positive angles were in the forward-scattering direction. The y-axis denotes the average reflectance of wavelengths from X1 to X2 of each band for the planophile variety (referred to as R(Band)_P) and erectophile variety (referred to as R(Band)_E) respectively. For the planophile variety, curves of R(Red)_P and R(Blue)_P were nearly overlapped when LAI = 4.29 (Figure 2c).
When LAI ≈ 1.3 (returning green stage), most bands did express different HDRFs in the PP depending on the plant type (Figure 2a,b). In terms of magnitude, most of the investigated bands presented lower HDRFs for the planophile variety (dotted lines) when compared to the erectophile variety (solid lines), with higher reflectance only observed in the R(NIR)_P when there was a VZA larger than 30° in the backscattering direction (Figure 2b). In terms of anisotropic behavior, greater sensitivity to view angles could be observed in the green HDRFs of the planophile canopy (R(Green)_P) than that of erectophile canopy (R(Green)_E) (Figure 2a). Furthermore, the red-edge and NIR HDRFs of the planophile canopy (R(Red-edge)_P and R(NIR)_P) showed a stronger shadow effect (i.e., exhibited higher reflectance in the backward than in the forward scattering direction) when compared to those of the erectophile canopy (R(Red-edge)_E and R(NIR)_E) (Figure 2b).
As the LAI increased (LAI ≈ 4.3 in the jointing stage), we found that the HDRFs of the investigated bands showed fewer differences between the two varieties in terms of both magnitude and anisotropy (Figure 2c,d). Additionally, the shadow effect played a less important role in shaping the anisotropic of the HDRFs at each band for both varieties when compared to the HDRFs with a lower LAI value (Figure 2a,b), with the HDRFs of most bands exhibiting somewhat bowl-shaped angular signatures where values near the nadir were lower than larger scattering angles in both scattering directions in the PP (Figure 2c,d).

3.1.2. Relationship between LAI and Reflectance

The strength of the correlations between the LAI and reflectance did express significantly different angular responses depending on the plant type (Figure 3). Coefficients obtained by visible bands generally declined from the backward to forward scattering direction for the planophile variety (Figure 3b), while exhibiting different degrees of ‘bowl-shape’ angular signatures for the erectophile variety (Figure 3a). Coefficients obtained by the NIR bands slightly increased for the planophile (Figure 3b) and decreased for the erectophile variety in contrast from the backward to forward scatter direction (Figure 3a). As expected, the linear relationships between the LAI and reflectance at the NIR bands (RNIR) were better than those of the LAI and reflectance at visible bands (RVIS) due to the greater sensitivity of RNIR to vegetation structure [1].

3.1.3. Relationships between LAI and Published Indices

Considering the significant differences among the VZAs, AD _ R 2 (Equation (4)) was calculated to quantify the view angle sensitivity of each index for its linear relationships with LAI. The results are shown in Table 4, listed in ascending order of AD _ R 2 .
As shown in Figure 4, the strength of the LAI–VI correlations varied for each plant type and among the observation angles. Generally, most of the VIs performed better in estimating the LAI in planophile than in erectophile varieties, especially at the zenith angle. All the VIs at the nadir showed a lower correlation with the LAI in the erectophile than in the planophile variety. Moreover, the angular shapes of the LAI–VI correlations were similar within three categories of indices, but were obviously different among the categories for each plant type. For the planophile variety, higher coefficients (0.652 < R2 < 0.946, P < 0.05 with a 95% confidence interval) obtained by the simple greenness indices were observed from the backward than from the forward scattering direction (0.537 < R2 < 0.837, P < 0.05), with the highest R2 observed at the hot spot (−35°) (Figure 4b). Additionally, the R2 of these indices presented the most angular sensitivities (higher values of AD_R2 can be seen in Table 4) among the three categories of indices for the planophile variety. Similar angular shapes were found in these indices in the erectophile variety, but with less angular sensitivities (lower AD_R2 values as seen in Table 4) and much lower significances (Figure 4a). The angular shapes of R2 obtained by the stress indices exhibited ‘slight-bowl-shaped’ anisotropies ( AD _ R 2   < 0.133) for the planophile variety and ‘deep-bowl-shaped’ anisotropies for erectophile variety (AD_R2: 0.297~0.432). The performances of the advanced greenness indices were least affected by difference related to canopy architecture. Relatively good coefficients (0.639 < R2 < 0.774, P < 0.05 for the erectophile variety, 0.726 < R2 < 0.921, P < 0.05 for the planophile variety) were obtained by these indices in all observing angles for both varieties.
It was noticeable that no VI obtained the highest R2 at the nadir angle. Indeed, as shown in Table 4, most optimal angles of VIs were larger than 25° either in the backward or forward scattering direction, implying that off-nadir angles are more useful for LAI determination. However, the optimal angle was not always the largest angle, which actually differed between two cultivars and among the various VIs. As shown in Figure 4, for both cultivars, viewing angles larger than 50° in both scattering directions were preferable when using stress indices as the LAI estimator, while viewing angles larger than 30° in the backward scattering direction were more effective when using simple greenness indices. NDVI did not obtain a high significance in LAI determination because of the saturation limitation. However, stress indices, which are not commonly used in predicting biophysical parameters, showed good correlations with LAI for the planophile type wheat among all view angles (0.764 < R2 < 0.926, P < 0.01) (Figure 4b) and for the erectophile variety at large angles (±60°, 65°) (0.639 < R2 < 0.747, P < 0.01) (Figure 4a). The maximum R2 were found with SPVI at −25° for the erectophile variety (R2 = 0.774, P < 0.01) and MSR2 at −35° for the planophile variety (R2 = 0.946, P < 0.001), respectively.

3.1.4. Relationships between LAI and NDSI(x,y) Formula Experimental Combinations

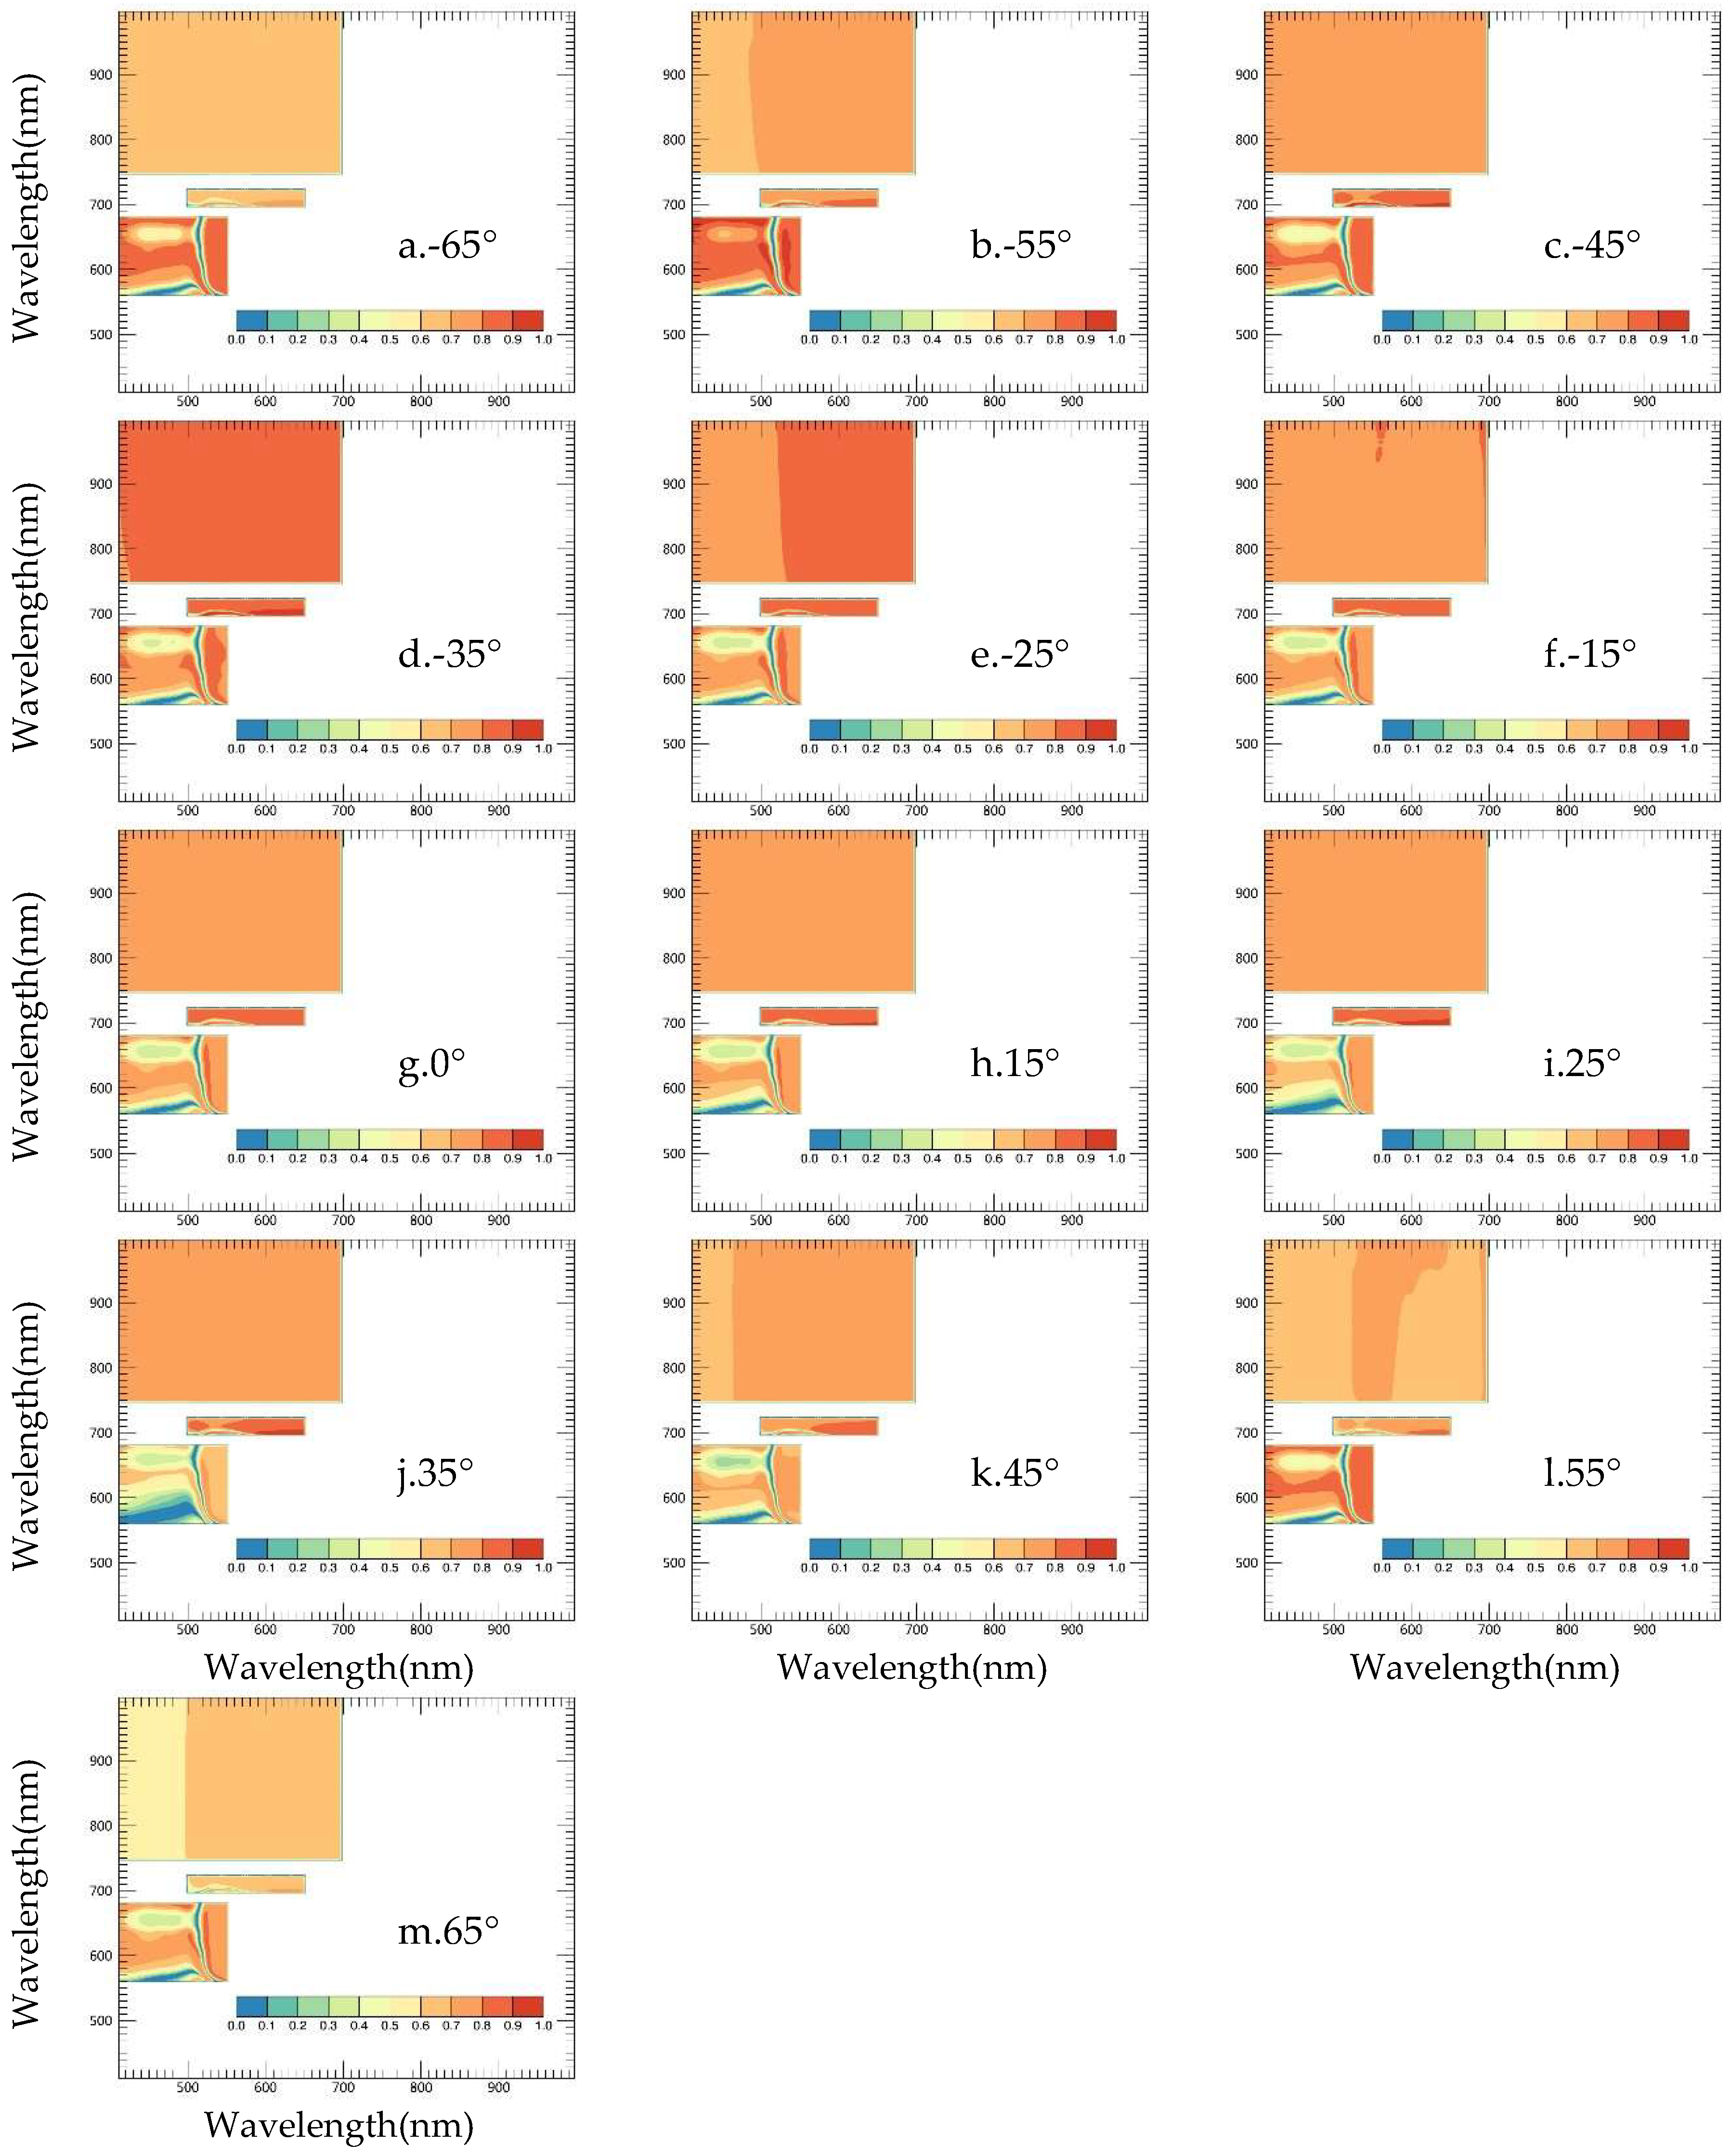
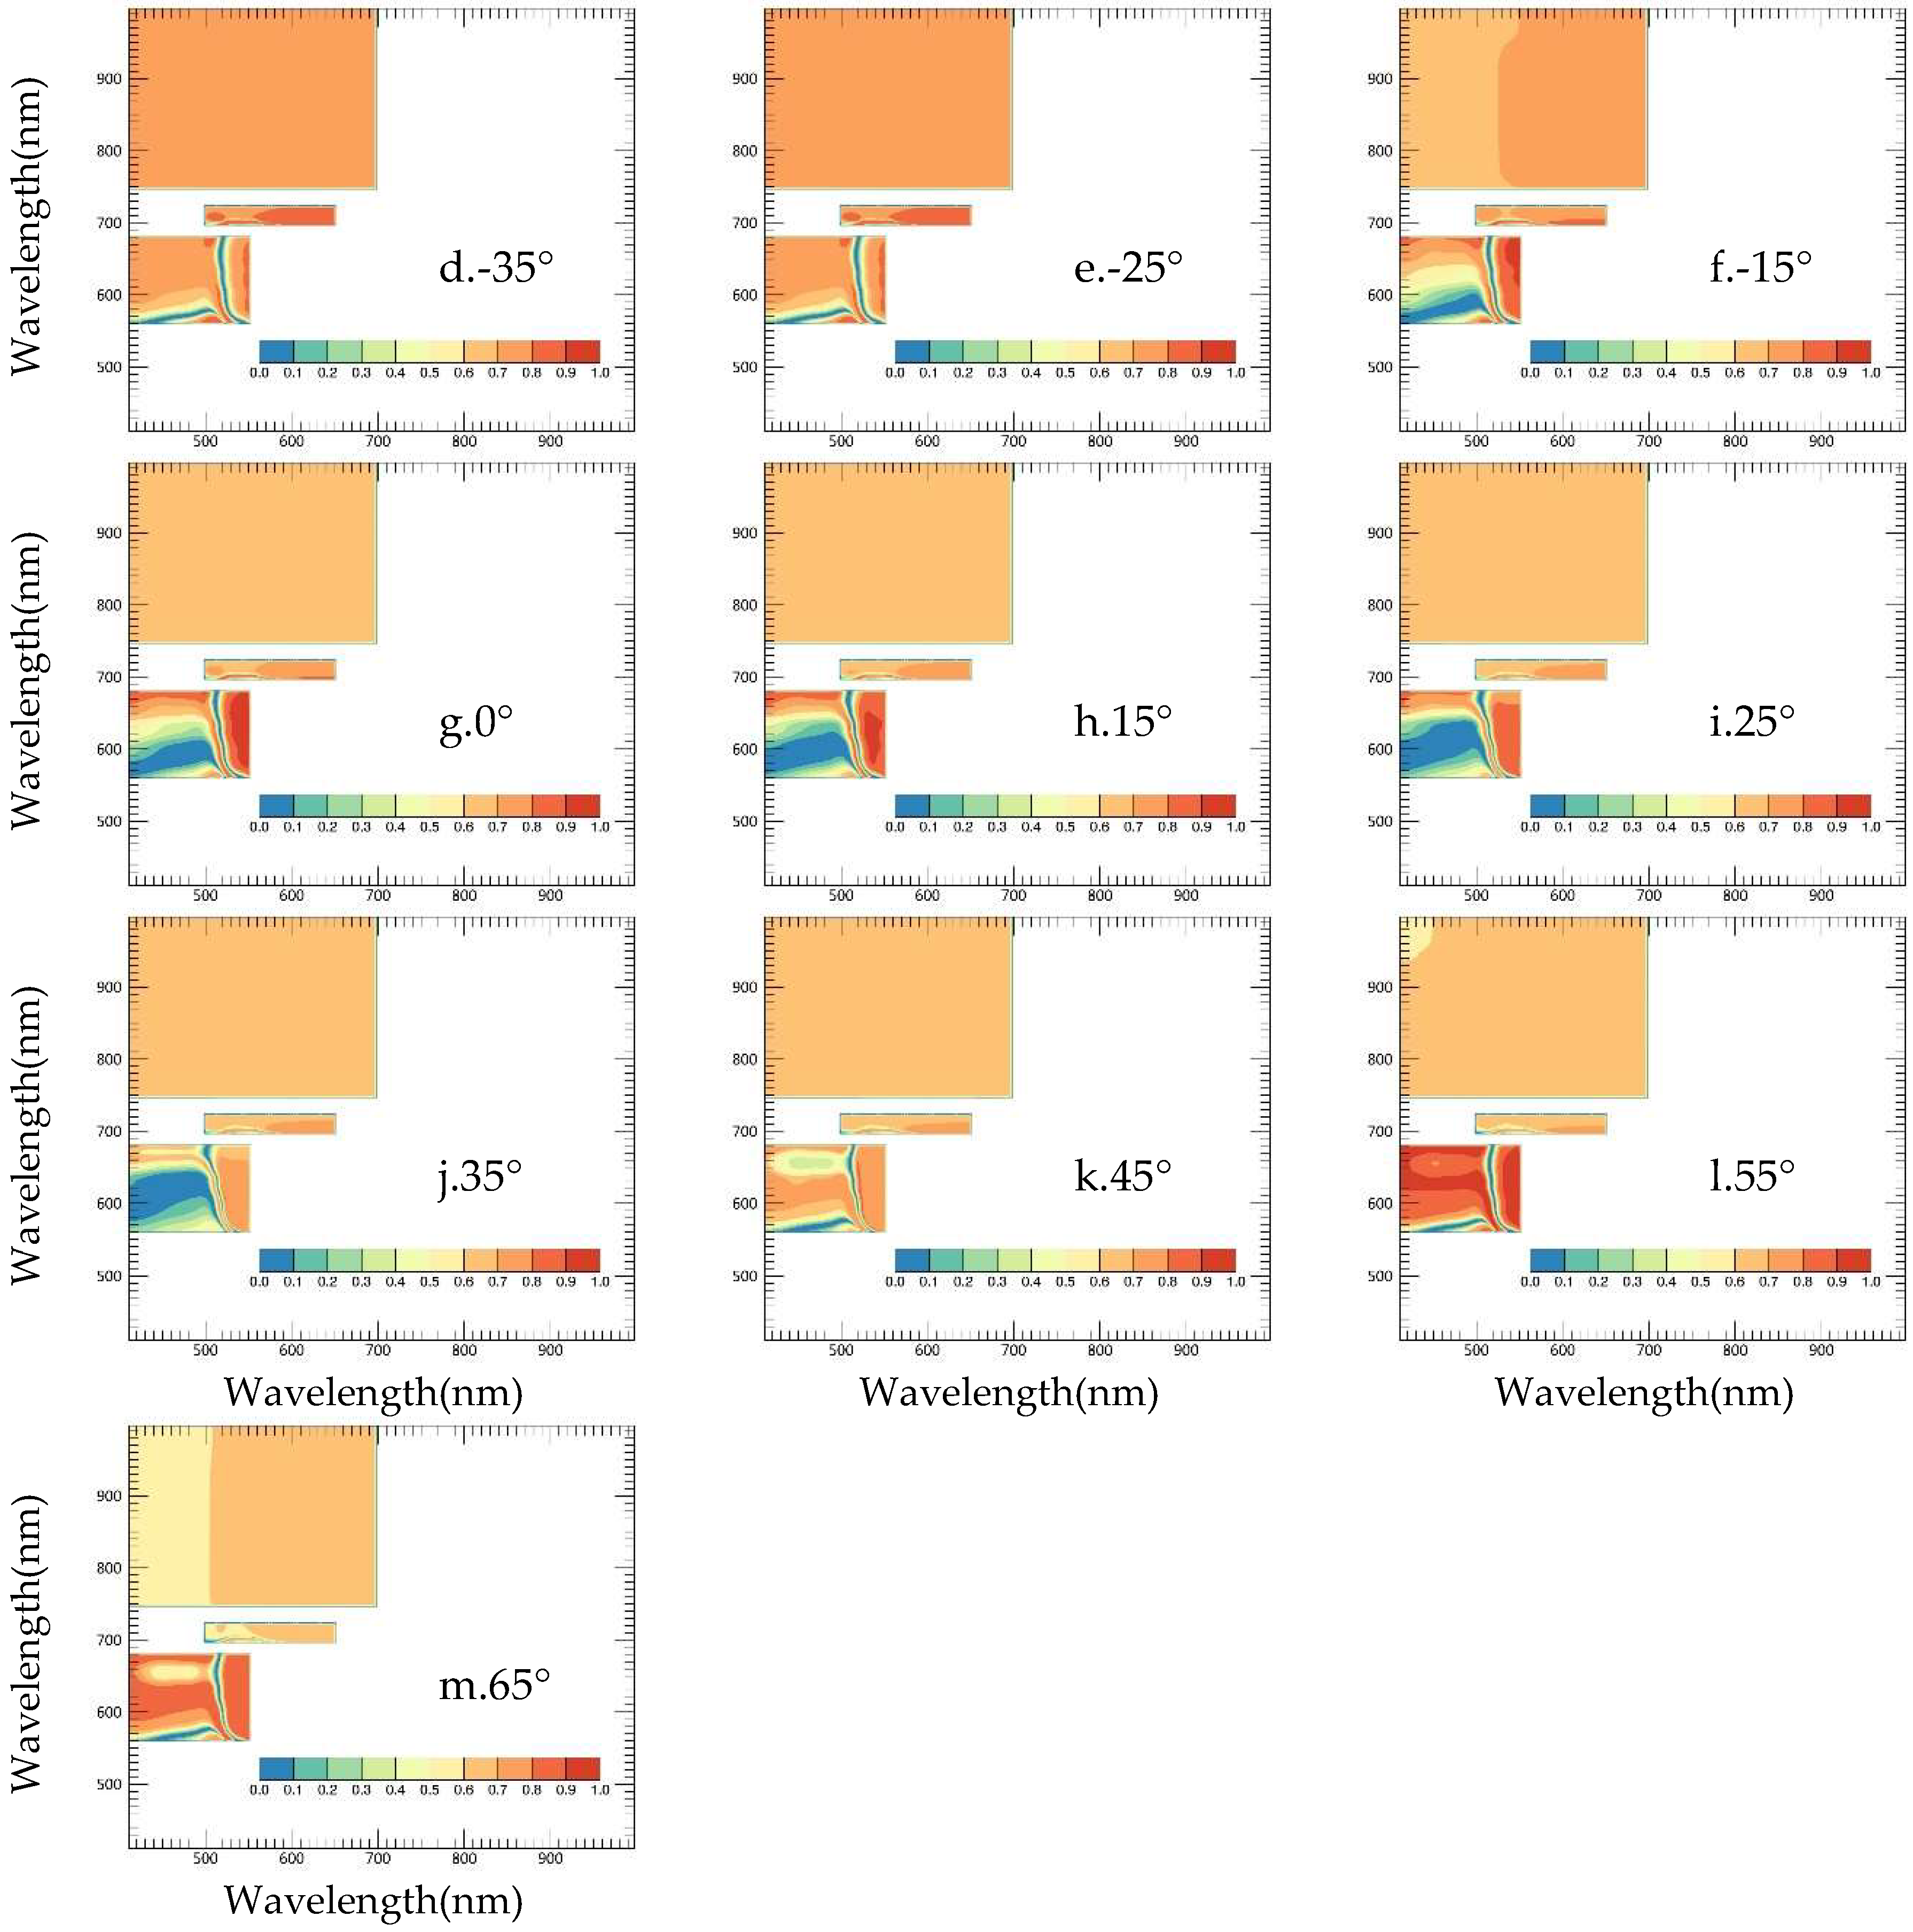
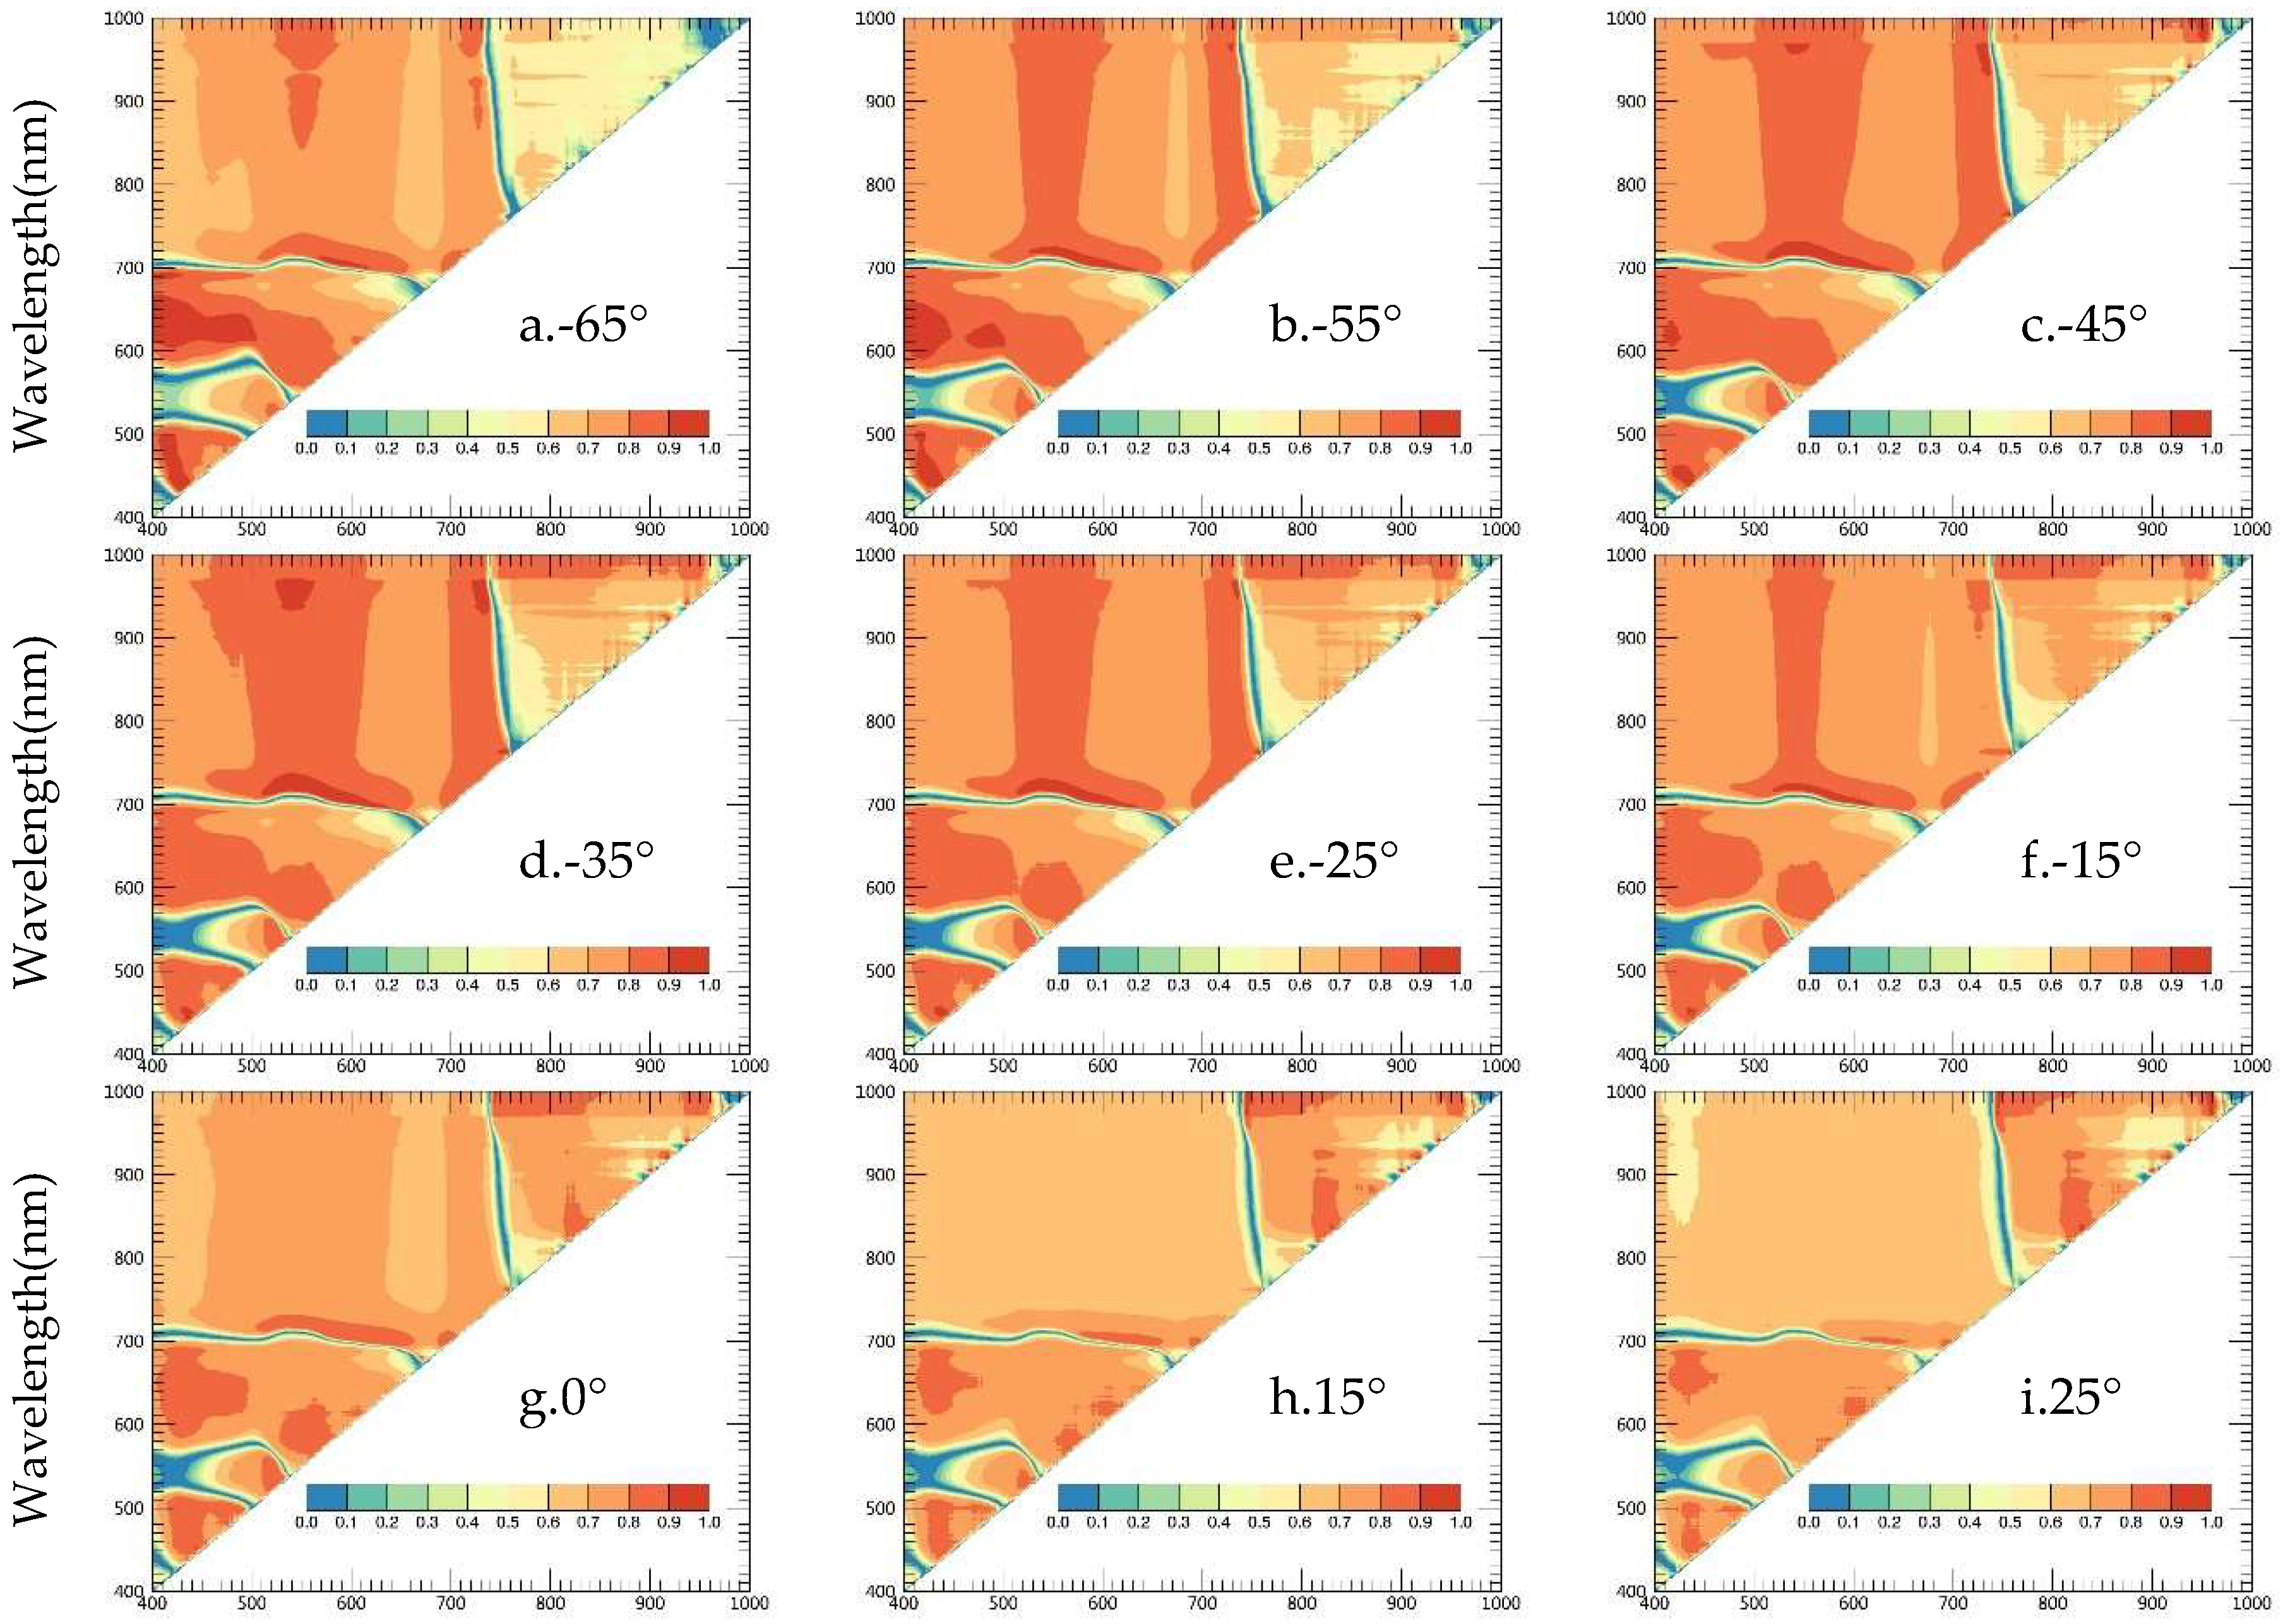
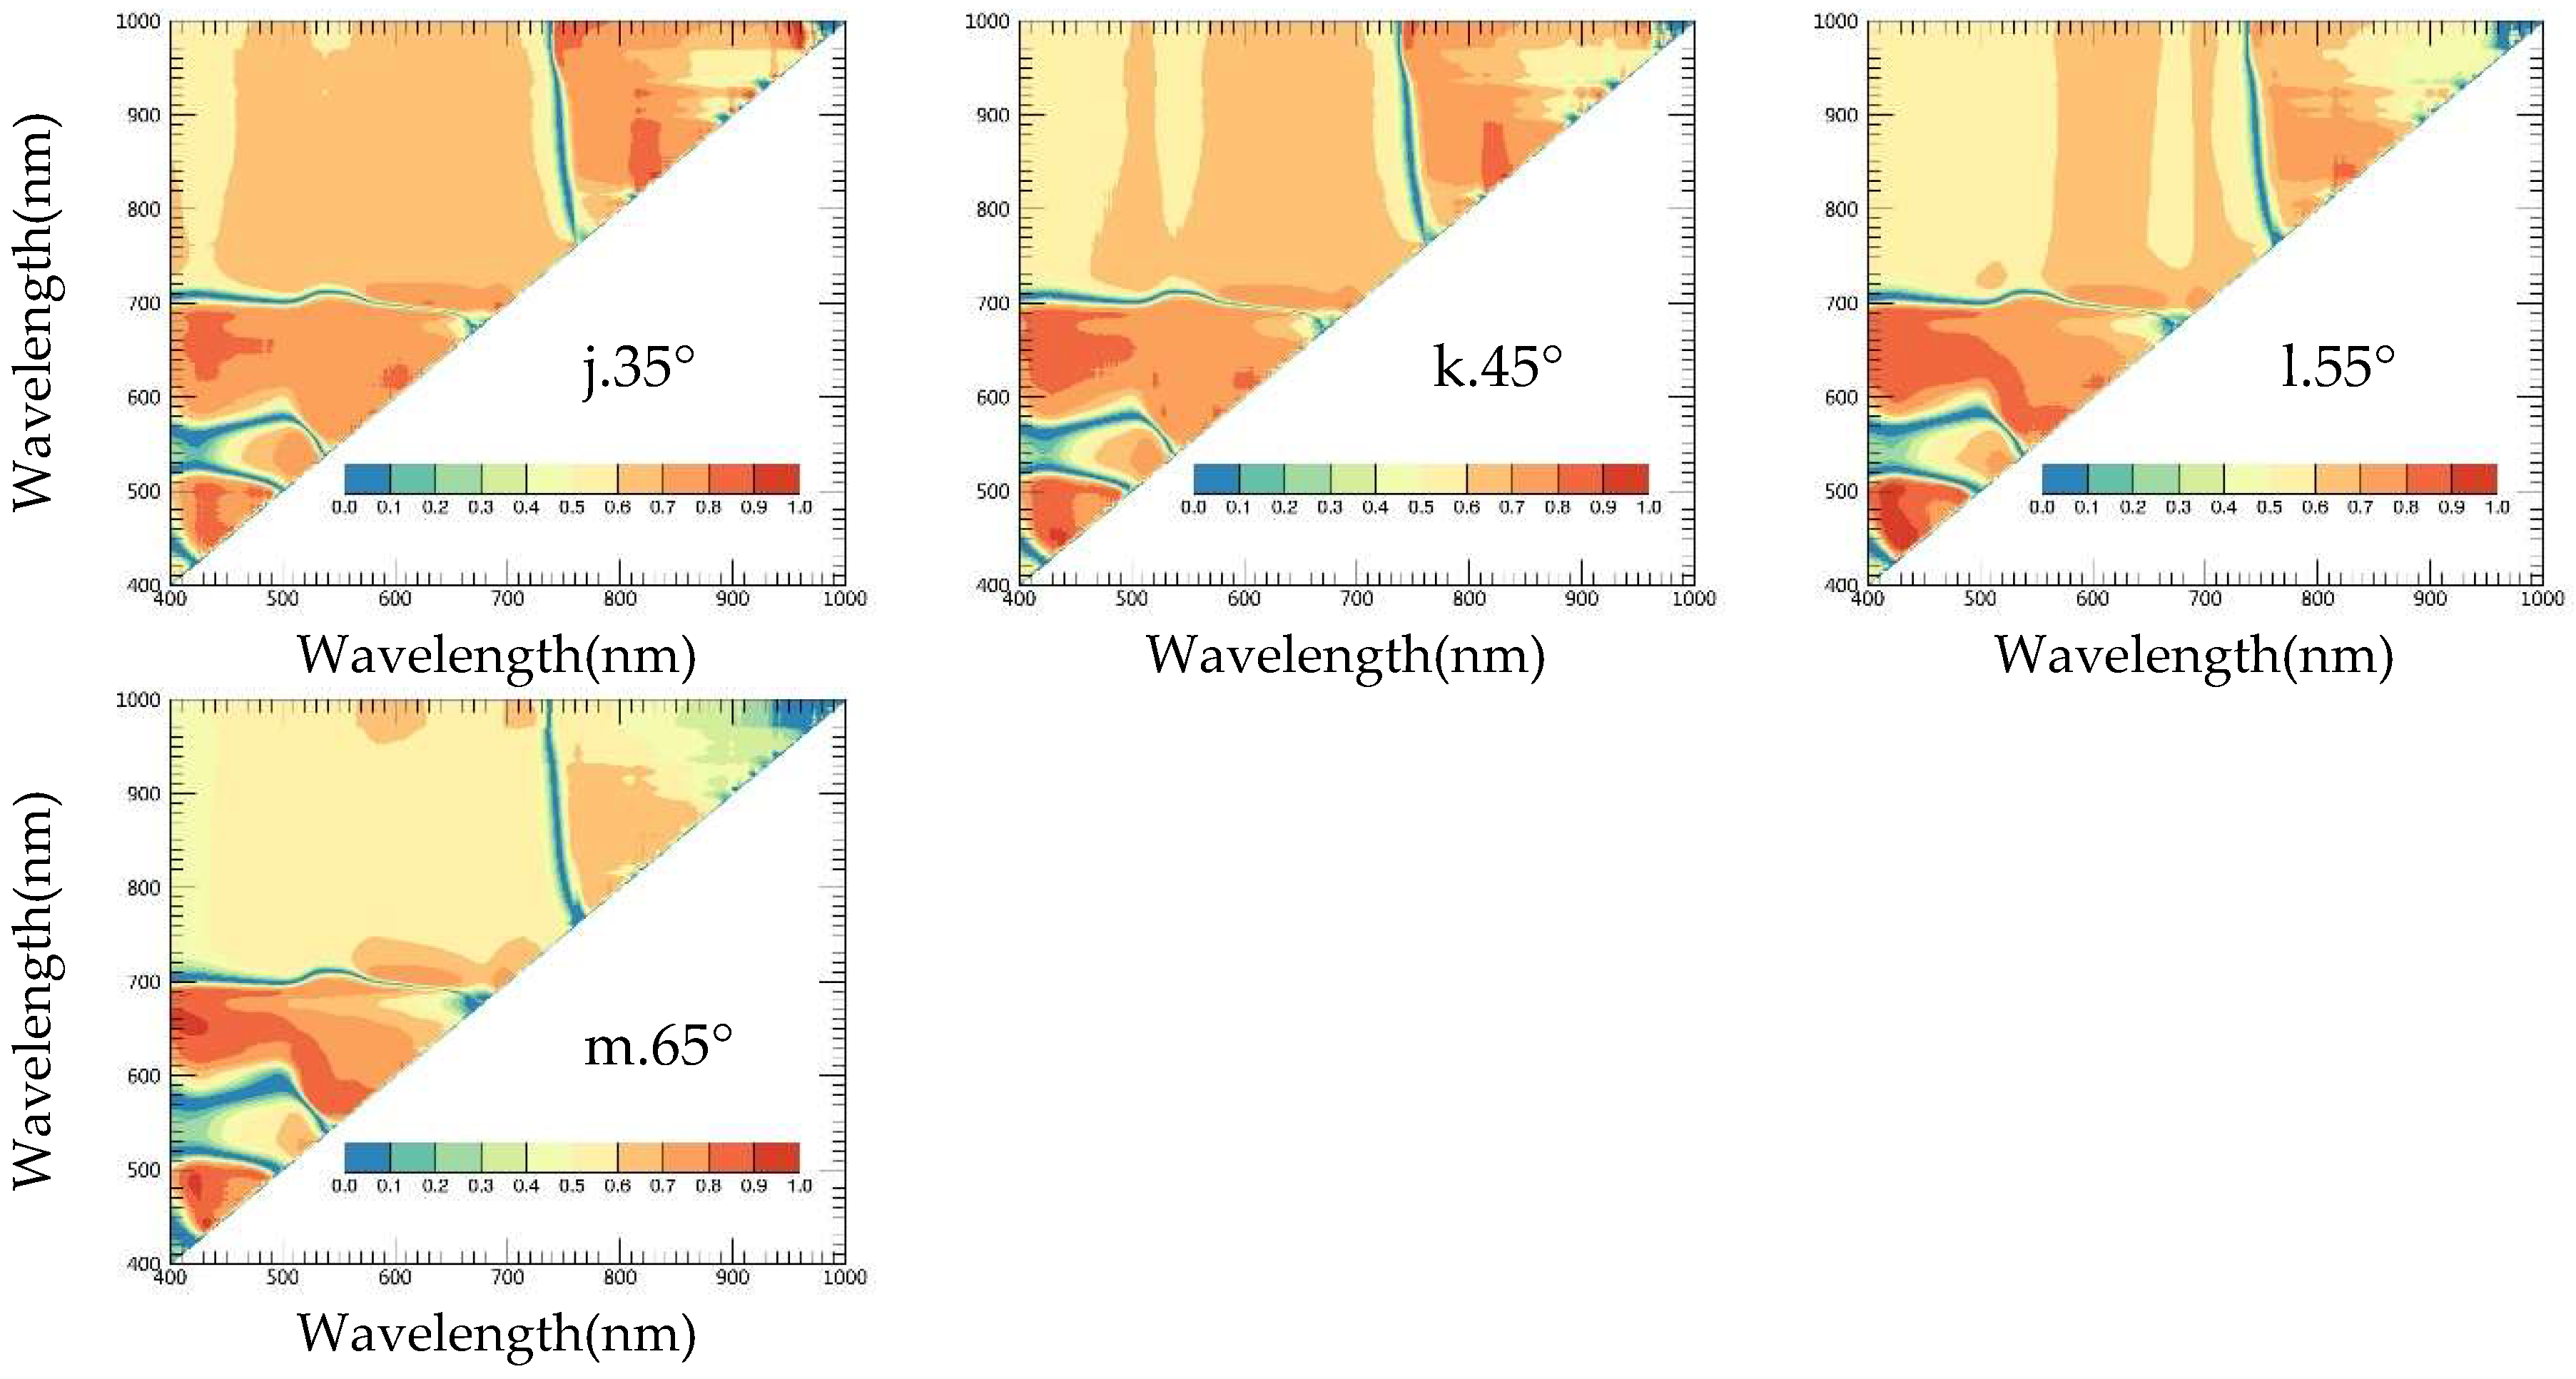
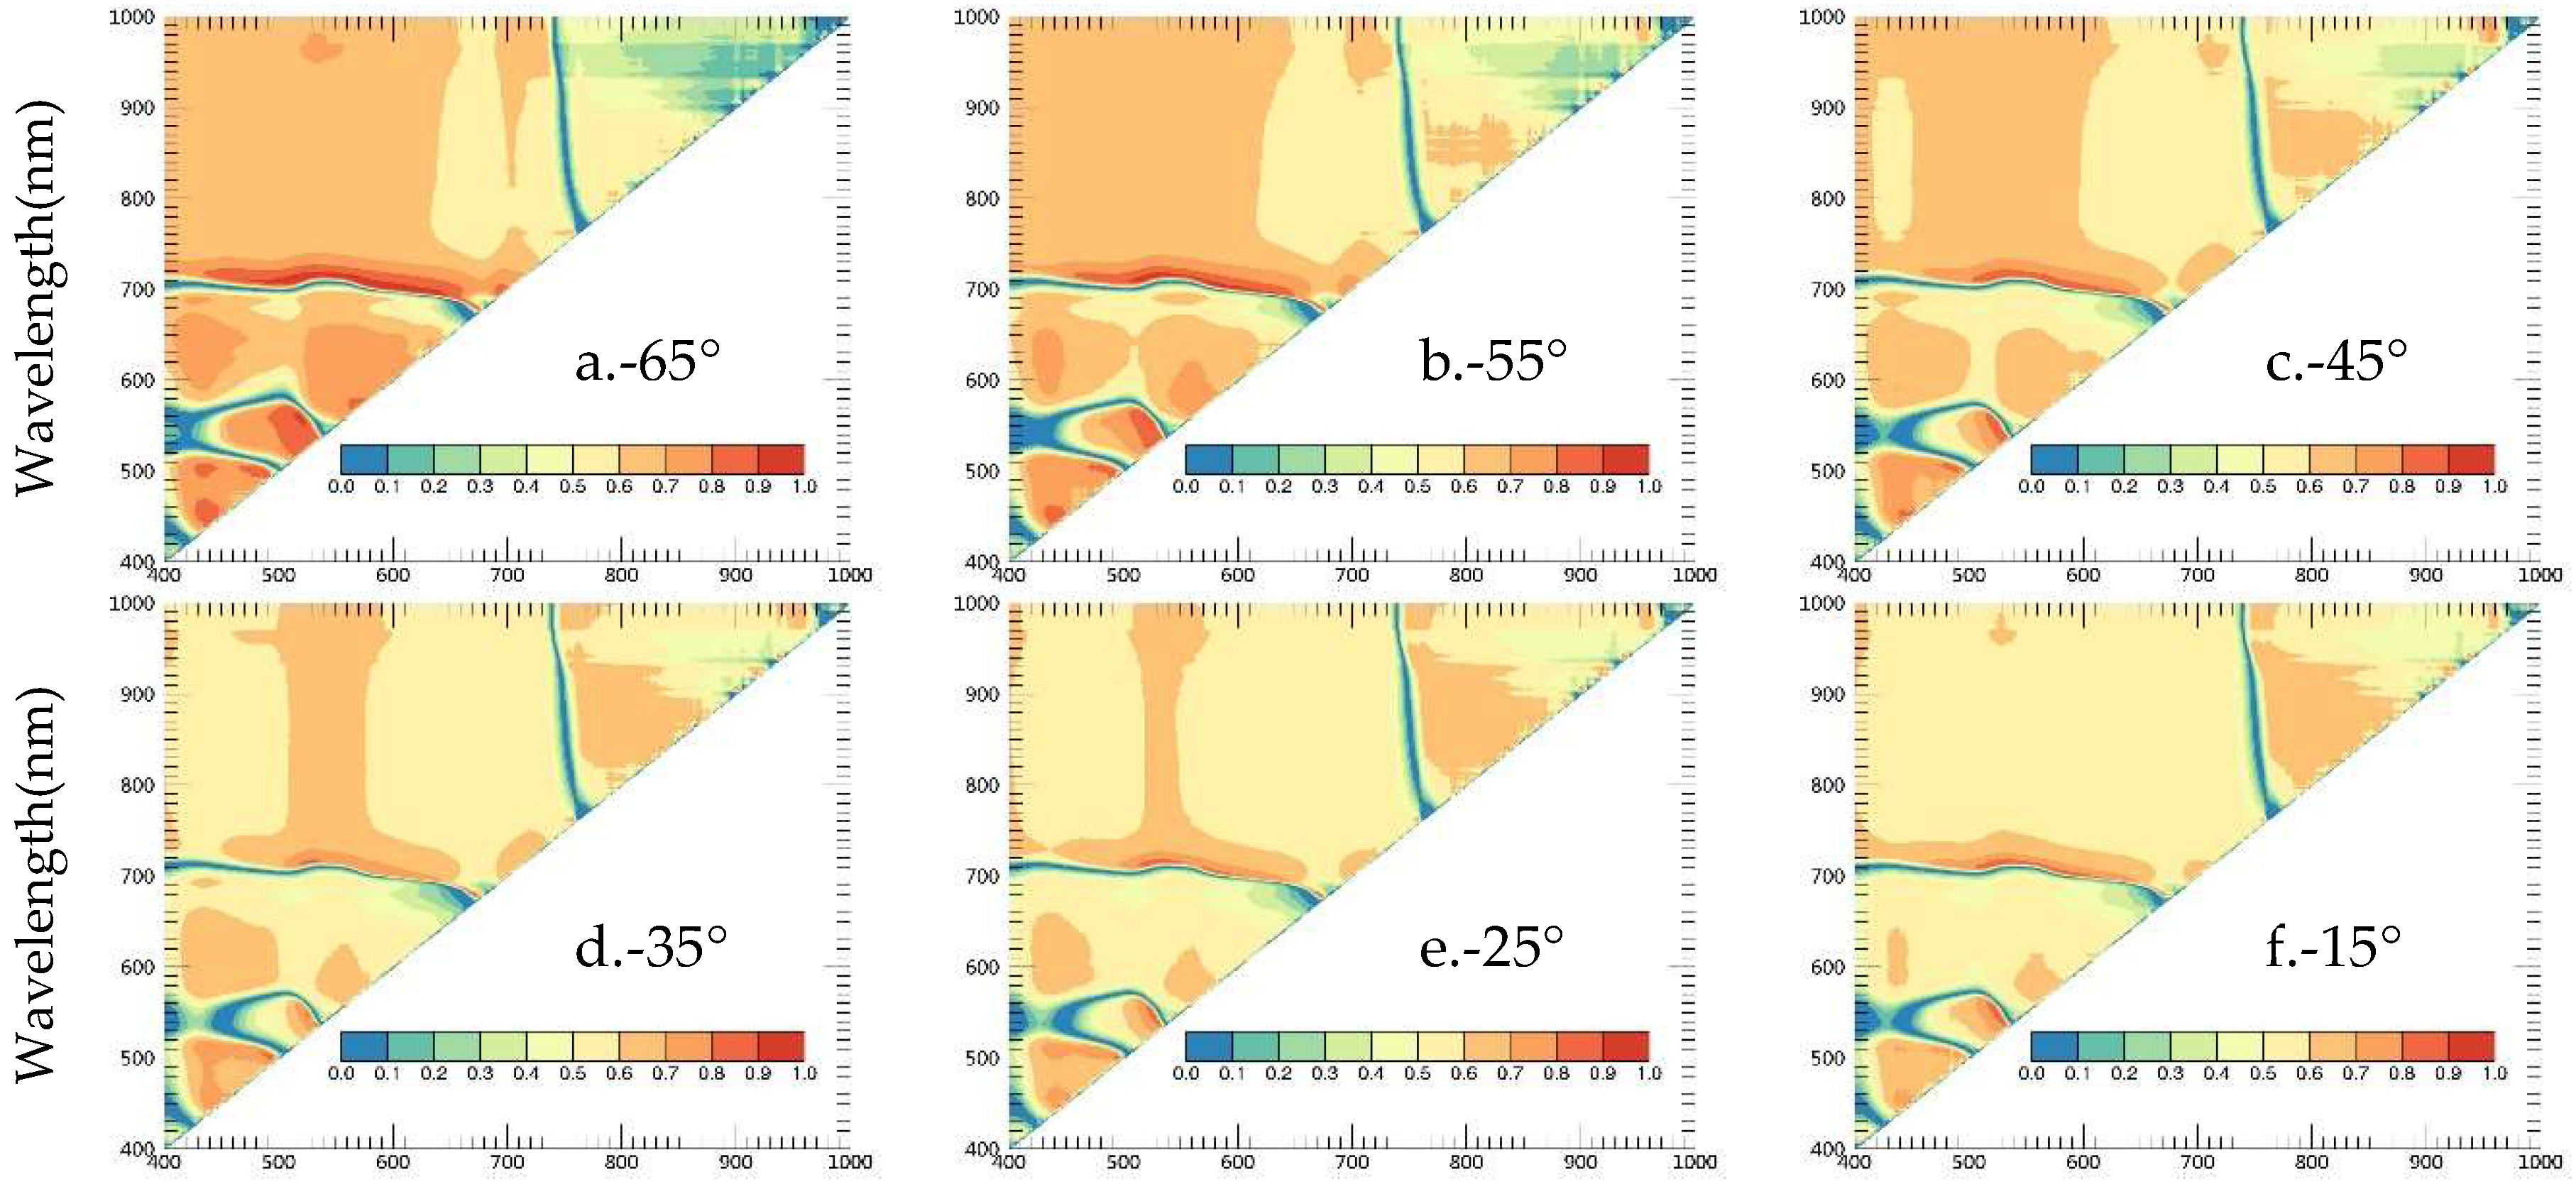
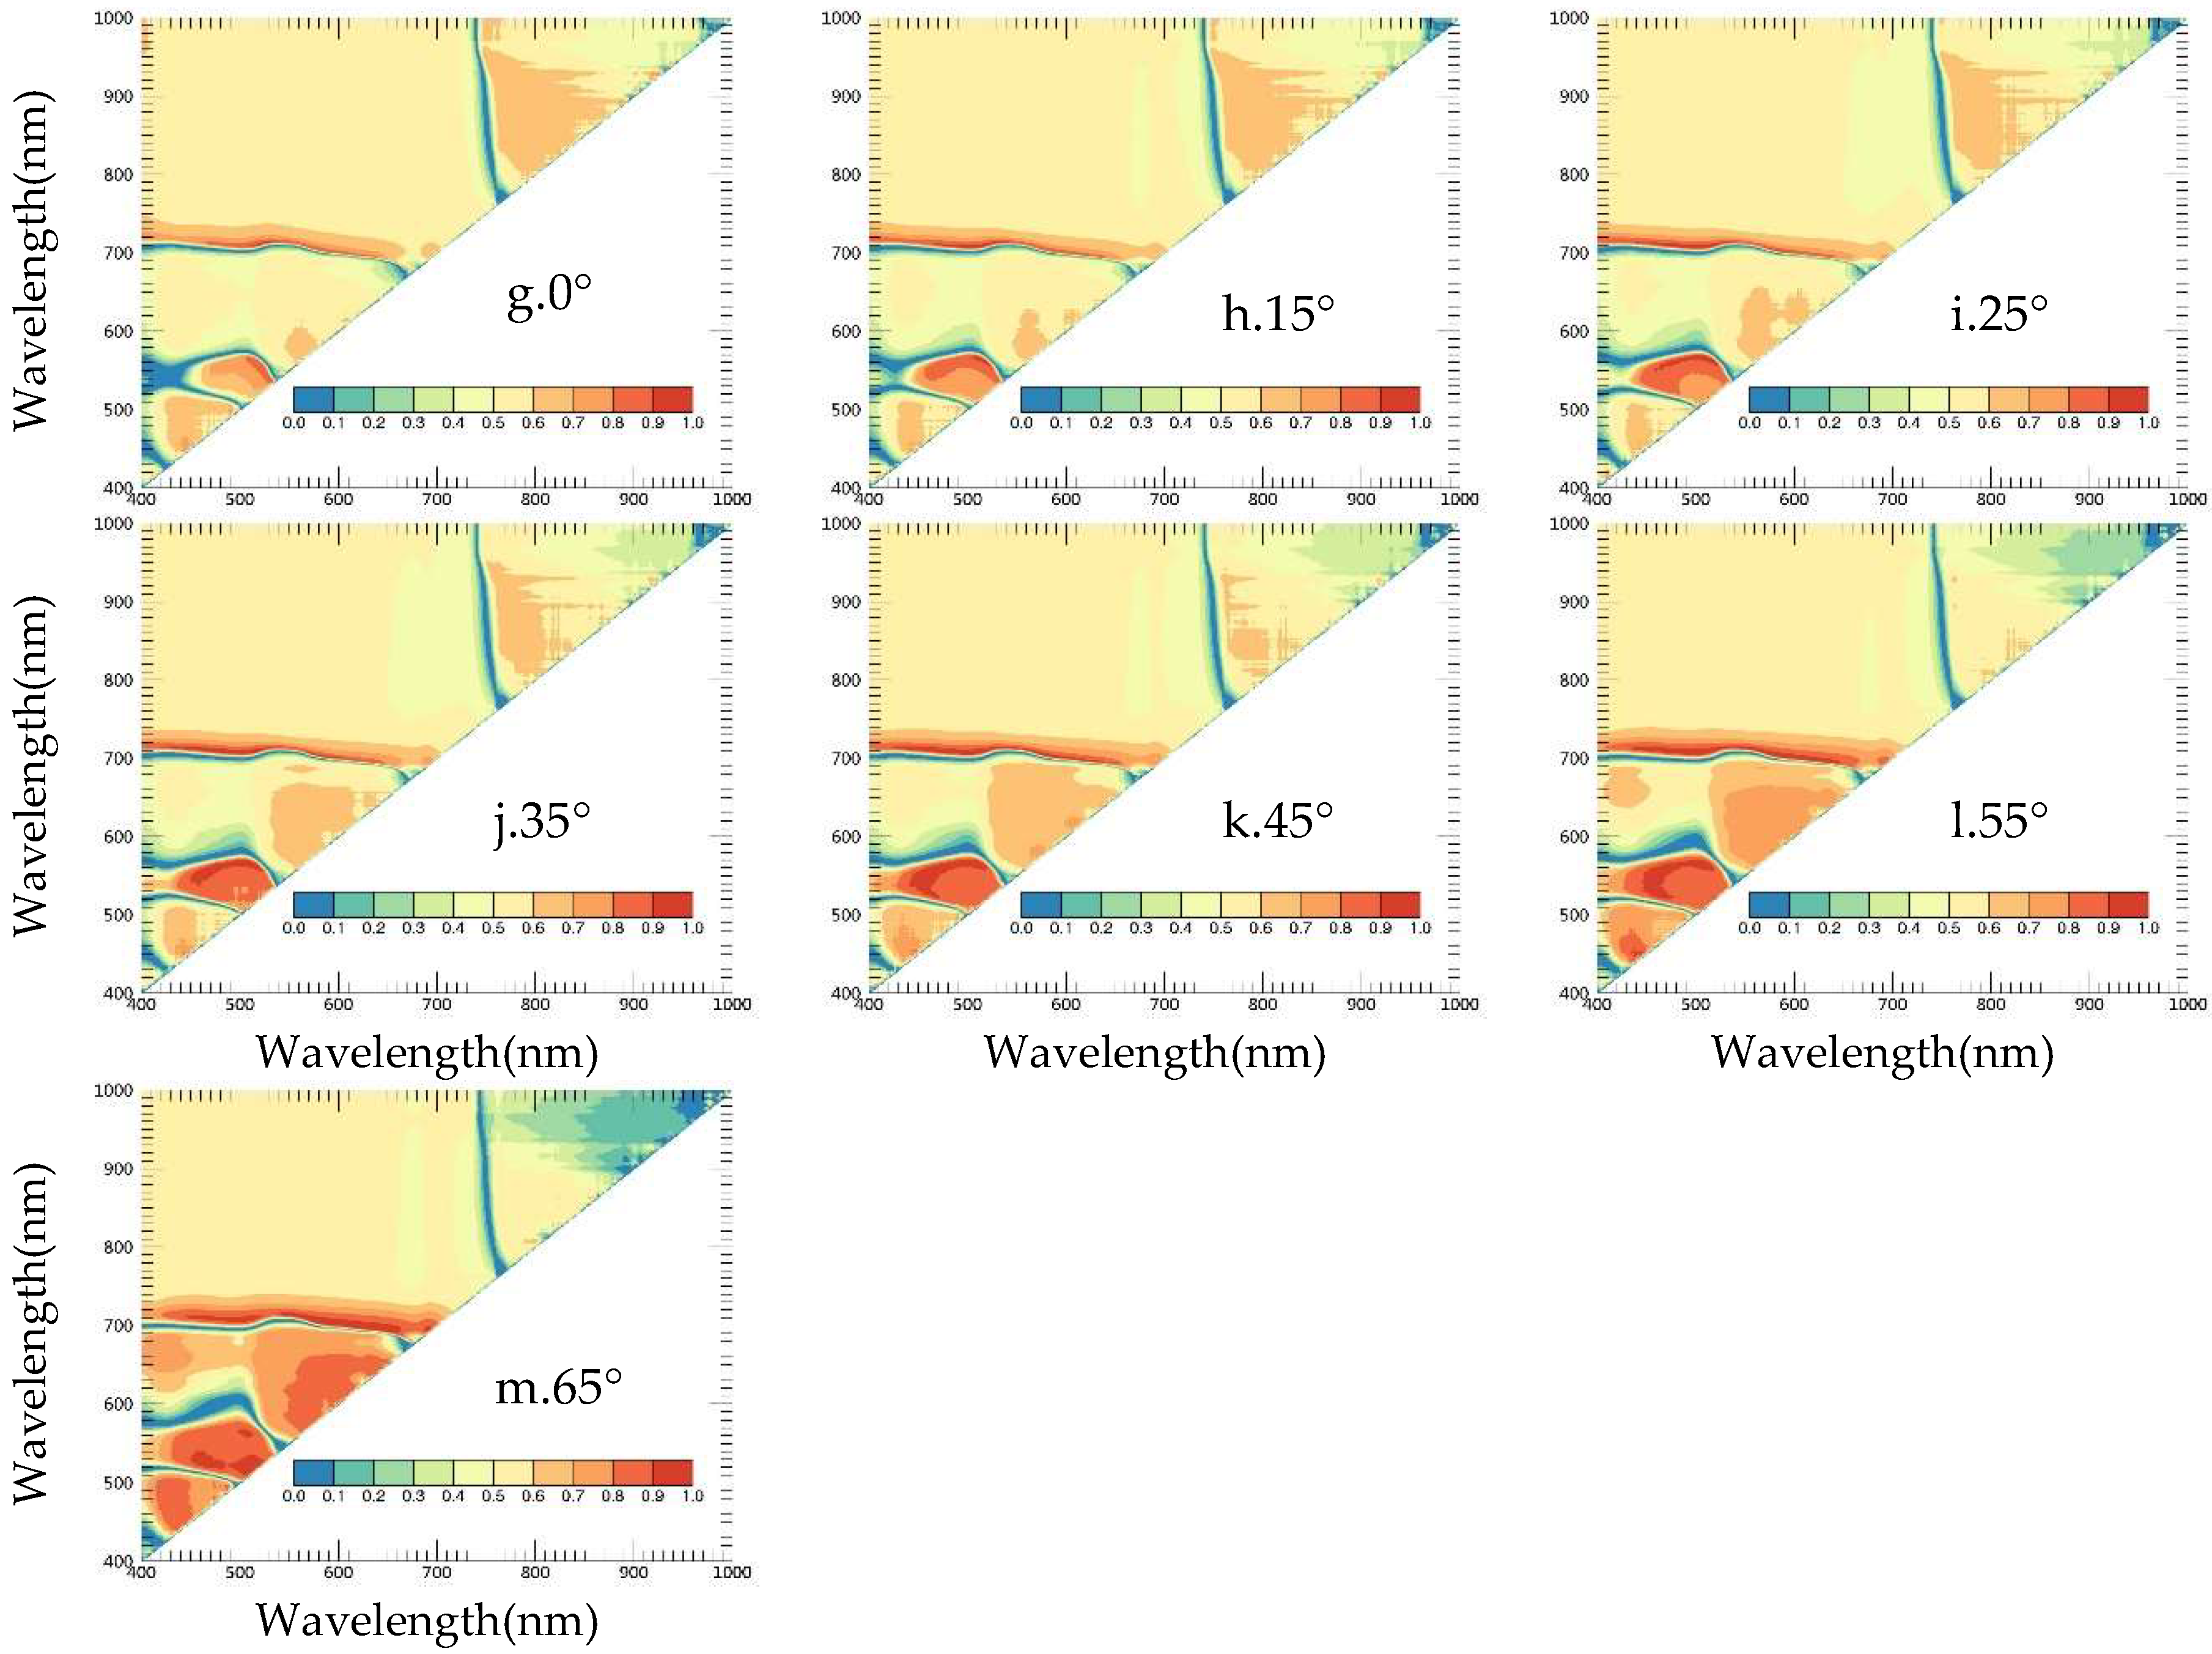
All NDSIs determined in wavelengths from 400 nm to 1000 nm were tested for their linear relationship with the LAI and the coefficients of determination (R2) were plotted in contour maps for the two varieties respectively, providing an overview of the statistical significance of each NDSI band combination derived from each view angle (Figure 5 and Figure 6). To provide clearer and more concise results, only contour maps derived from thirteen observation angles (indicated in each contour map) from the backward to forward scattering direction were shown and analyzed, since the results from these view angles were enough to present general patterns. Additionally, contour maps of significance levels (P-values) of the linear correlation between NDSI and LAI were provided in Appendix A (Figure A1 and Figure A2). The patters of contour maps of the P-value were generally consistent with those of the R2 (the higher the R2, the lower the P value).
The analysis of the NDSIs showed that the optimal NDSIs varied for each wheat type and among the observing angles (Figure 5 and Figure 6). For the planophile variety, one obvious region of good coefficients was in the NDSIs with combinations of VIS (411~697 nm) and NIR (748~997 nm) wavelength (Figure 5). A wider area of high correlations (R2 > 0.8, P < 0.005 shown in Figure A1) located in this region were observed from the backward than from the forward scattering direction, with the widest area observed at the hot spot (–35°) (Figure 5d). This angular signature was consistent with the angular responses of R2 obtained by the simple greenness indices (Figure 4b), which are also normalized difference or the simple ratio formula of NIR and VIS bands. There was also a small region of NDSIs with X(400~570 nm) and Y(580~660 nm) that had good correlations with the LAI among all view angles, in particular, the region of high angles (±55°, 65° in Figure 5a,b,m,n) generally reached high significance (R2 > 0.8, P < 0.01). This behavior is consistent with angular performance of stress indices (Figure 4b), the wavelengths of which are just located in this region.
In comparison with the planophile variety (Figure 5), a much smaller area of high significance was observed for the erectophile variety (Figure 6). There was no evident wide region of NDSIs that reached high significance (R2 > 0.8) at each view angle. Most NDSIs of R2 larger than 0.8 (P < 0.05 shown in Figure A2) were combinations between visible wavelengths at large angles, i.e., X(440~550), Y(520~570); X(420~490), Y(440~500); X(530~640), Y(560~680); high significance areas of which were increased with increasing view angles larger than ±35° (Figure 6a–d,i–m). This angular signature is consistent with the angular performances of the stress indices for the erectophile variety. Like the planophile variety, a better performance of the NDSIs in the region of the VIS and NIR wavelengths was observed from the backward than from the forward scattering direction, but the widest region of R2 larger than 0.7 was observed at −65° (Figure 6a). This behavior is also consistent with the angular performance of the simple greenness indices for the erectophile variety (Figure 4a).
Generally, significances with R2 larger than 0.9 were usually observed in small regions at large view angles for both types of wheat canopy, indicating that narrow-band indices at large view angles were more useful for LAI estimation. For the planophile variety, extreme high significance could be observed in some small regions within visible wavelengths at high observation angles (±55°, 65° Figure 5a,b,m,n). Some combinations between the NIR wavelengths (focused mainly around the water absorption bands, 940–1000 nm) also obtained R2 larger than 0.9 (P < 0.005) in the view angles from 15° to 35° and −45° (Figure 5c,h–k). The maximum R2 value obtained by the NDSIs at each angle from 15° to 35°, −45° was found exactly with wavelengths in this region (Table A1 in Appendix A). Additionally, there were some combinations of a VIS band (500–650 nm) and a red-edge (700–710 nm) in the backward scattering direction that reached a R2 larger than 0.9 for the planophile variety (Figure 5a–f). A similar spectral region (x: 480~660 nm, y: 700~713 nm) can also obtain a R2 larger than 0.9 at high angles in both scattering directions for the erectophile variety (Figure 6). The maximum R2 value at each angle from −25° to 65°, −45° for the erectophile variety (W411) and at each angle from 15° to 35°, −45° for the planophile variety (W9507) was just obtained by the NDSI with the combination of a green and a red-edge band (Table A1), all located in this region. For the erectophile variety, extreme high significance could also be observed in the small region of X(440~550), Y(520~570) in the forward scattering direction (Figure 6j–n). The highest R2 was obtained by NDSI(536,720) at −35° (R2 = 0.971, Figure 7a) and NDSI(571,707) at 55° (R2 = 0.984, Figure 7b) for the planophile and erectophile varieties, respectively.

3.2. Results Based on Simulated Data

3.2.1. Relationships between LAI and Published Indices

Consistent with the results from the measured datasets, all the VIs at angles near the nadir showed a lower correlation with the LAI in the erectophile than in the planophile variety (Figure 8). Similar angular signatures of correlations between the LAI and published indices (except advanced greenness indices) could be found between the simulation (Figure 8) and in-situ results (Figure 4): the LAI-stress indices correlation exhibited slight and deep bowl-shaped anisotropies for the planophile and erectophile varieties, respectively; LAI-simple greenness indices correlation from the backward scattering direction were stronger than those from the forward scattering direction for both varieties, and lower significances with these indices were found in the erectophile variety. In the simulated datasets, advanced greenness indices stood out for high correlation with the LAI in all observing angles for both varieties (Figure 8). The performance of these indices was least affected by different view angles and varieties, which was also in agreement with the in-situ results.
However, there were also obvious discrepancies observed between the simulation and in-situ results including different angular shapes of advanced greenness indices for both varieties and different angular behaviors of stress indices at large angles for the planophile variety.

3.2.2. Relationships between LAI and NDSIs

To focus the comparison on NDSIs in the regions of the VIS-VIS, VIS-Red-edge, and VIS-NIR wavelengths, only the R2 between the LAI and NDSIs determined in wavelengths of X(411~551) and Y(561~680); X(411~697) and Y(748~997); X(500~650) and Y(697~722) were plotted in contour maps (Figure A3 and Figure A4 in Appendix A). Moreover, the average R2 in the three regions were calculated respectively at each angle and plotted in Figure 9, providing a brief overview of the angular performance of the NDSI.
Given the large set of PROSAIL simulations, the values of R2 obtained by NDSIs were somewhat smaller in the simulated data than in the measured data. However, the angular signatures for the NDSIs in the regions of concern were generally consistent with the in-situ results. In general, the NDSI obtained a higher correlation with LAI in the planophile than in the erectophile variety, except for NDSI(VIS-VIS) at high angles (larger than ±45°) according to the average R2 shown in Figure 9. Additionally, similar angular patters but with different angular sensitivities were found between the erectophile (solid lines) and planophile (dotted lines) varieties. As shown in Figure 9, Figure A3 and Figure A4, better performances of the NDSIs were observed from the backward than from the forward scattering direction in the VIS-NIR and VIS-Red-edge regions, with the highest average R2 observed at the hot spot (−35°) (Figure 9). The LAI-NDSIs(VIS-Red-edge) correlations were stronger than the LAI-NDSIs(VIS-NIR) correlations for both varieties according to the average R2, indicating the advantage of red-edge bands over NIR bands in predicting LAI. In the VIS-VIS region, a wider region of high correlations (R2 > 0.8) obtained by the NDSI was observed at large angles than from small angles, with the highest average R2 observed at ±55° for the erectophile and ±65° for the planophile in each scattering direction (Figure 9). Furthermore, stronger angular sensitivities were found in the erectophile variety. All of the angular behaviors above-mentioned were generally in agreement with the in-situ results.
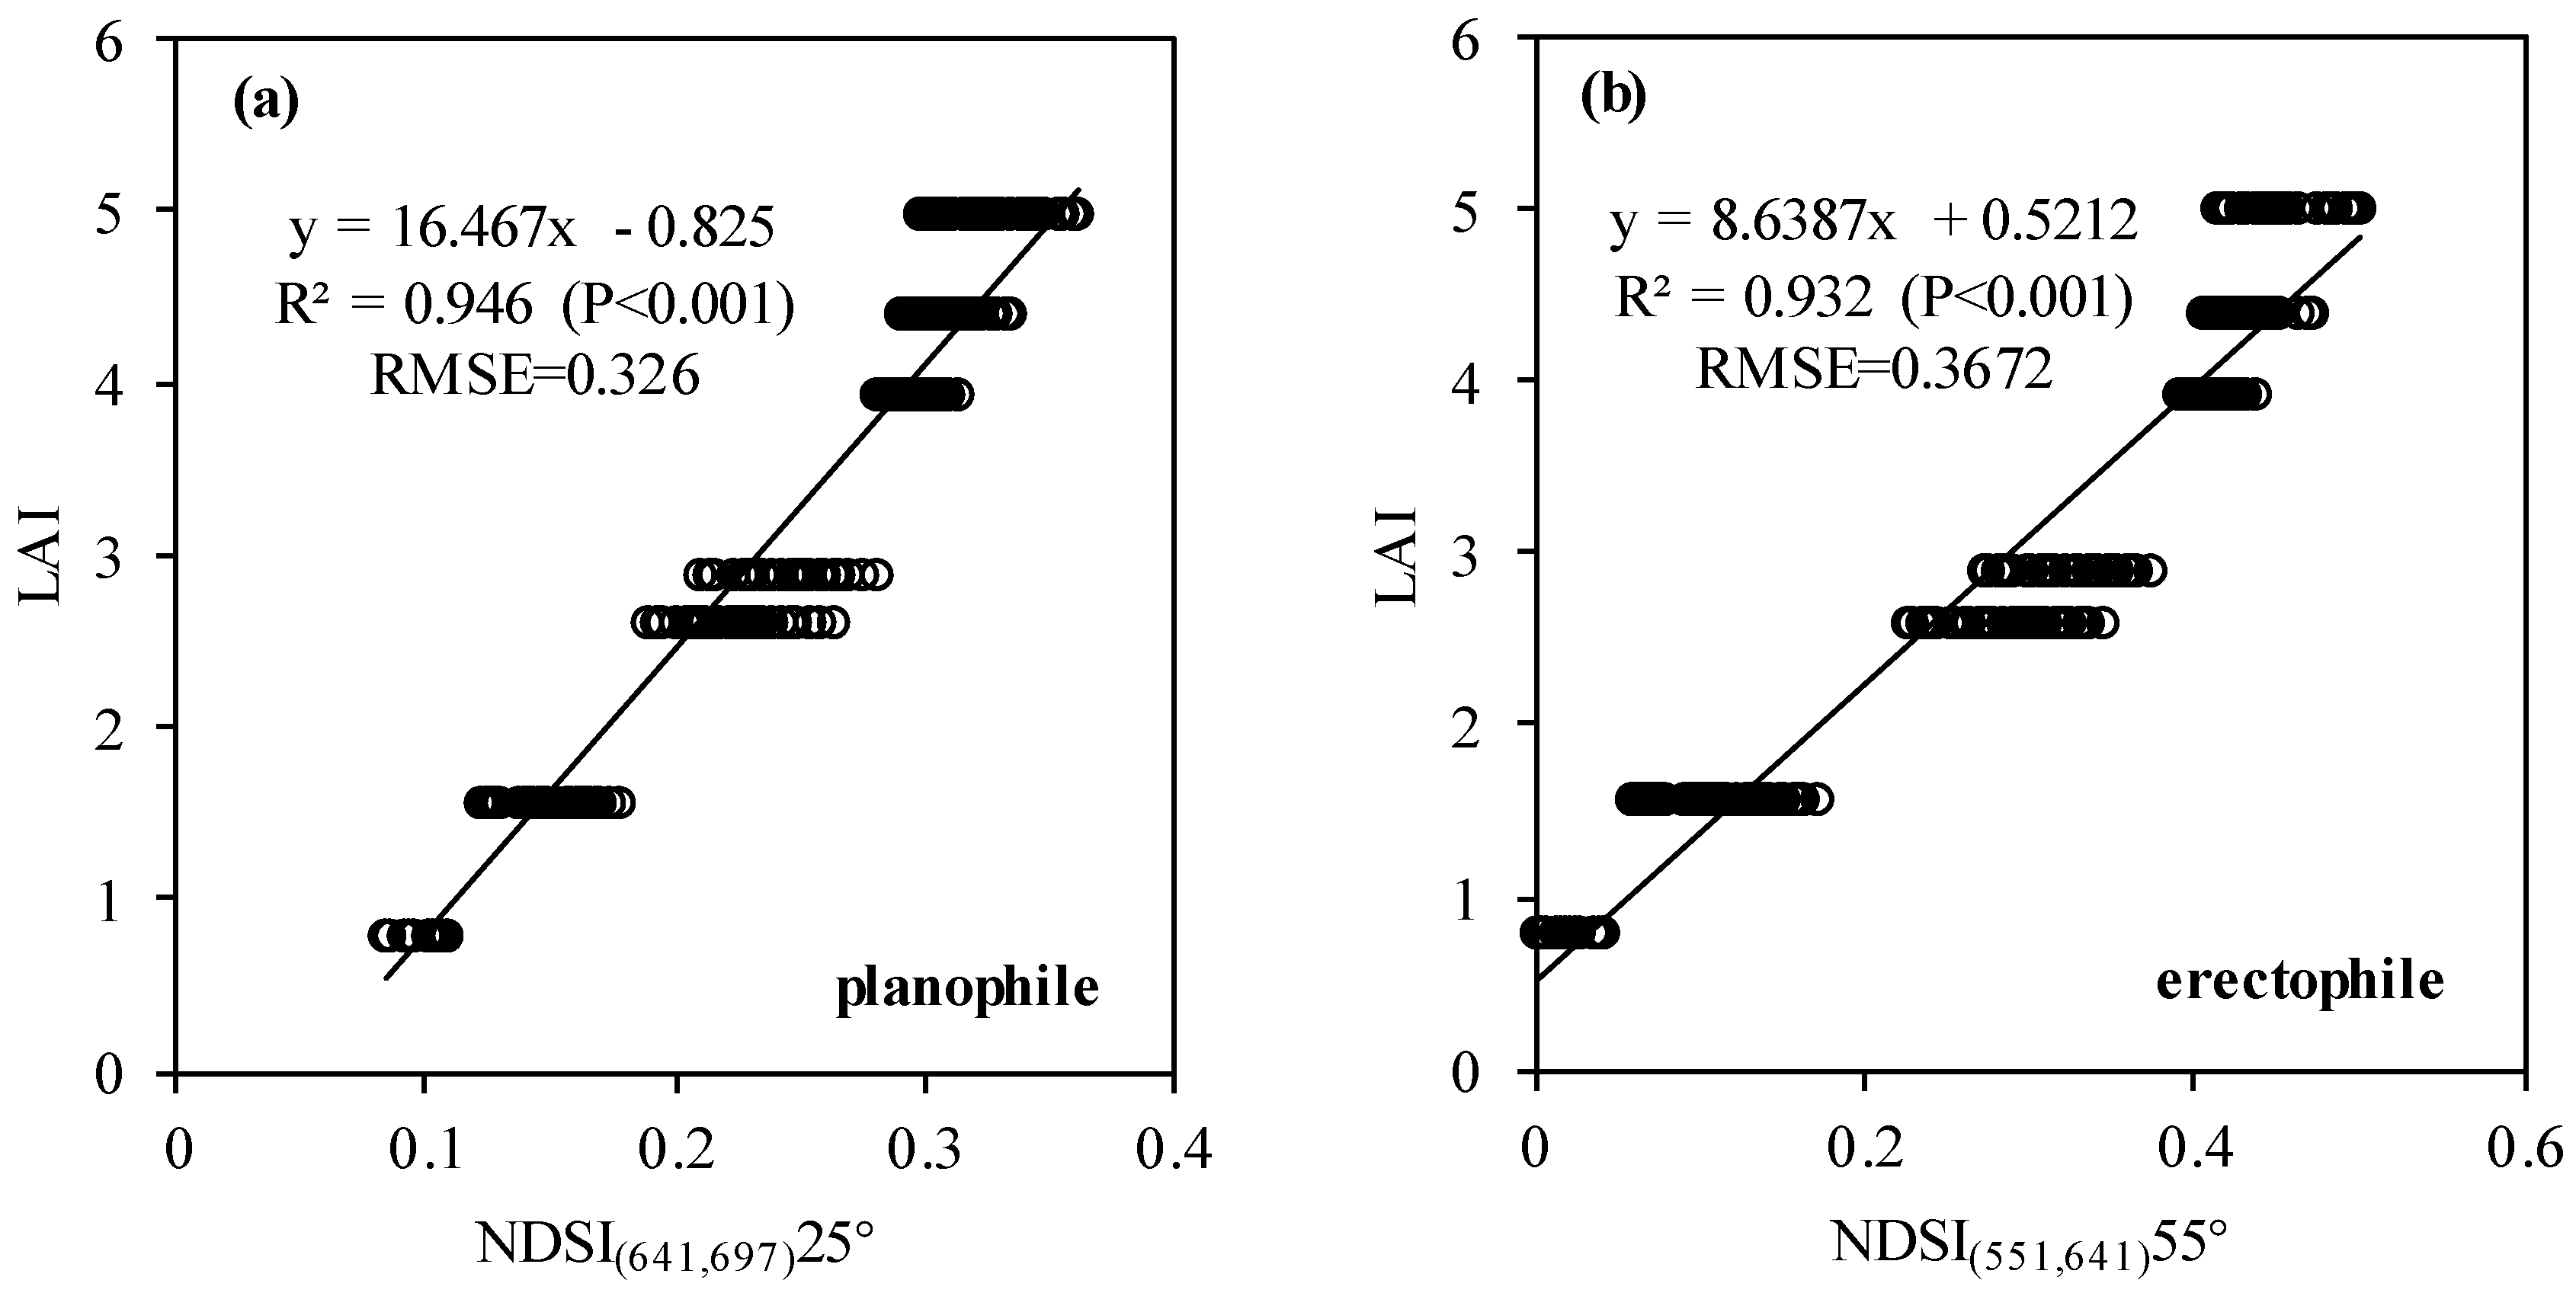
Meanwhile, the average R2 obtained by the NDSI(VIS-VIS) was lower than the NDSI(VIS-NIR) at most angles, but the optimal NDSI at each angle was just located in the region of the VIS and VIS (including red-edge) wavelengths (Table A1), which was also consistent with the in-situ results. It was noticeable that the optimal NDSI was often found with wavelengths of a green and a red-edge band according to both the in-situ and simulation results (text on gray background in Table A1). While the use of water absorption bands (920–970 nm) to obtain extreme high significance in the measured data was not found with the simulated data, with the relevant NDSIs just producing moderate coefficients (not shown in the contour maps). The highest R2 was obtained by NDSI(641,697) at 25° (R2 = 0.946, Figure 10) and NDSI(551,641) at 55° (R2 = 0.984, Figure 10) for the planophile and erectophile varieties, respectively, with the simulated data, which was also different from the in-situ results.

4. Discussion

4.1. Variation of HDRFs at Different VZAs

Our results showed that even with similar LAI levels, the spectral reflectance of most bands differed between the two types of wheat canopy in terms of both magnitude and angular signature with changes in the view zenith angle, especially in the returning green stage (LAI ≈ 1.3). At the canopy level, the reflectance variability at a given wavelength strongly depends on factors such as LAI, canopy architecture, and background soil [55,56], in addition to leaf optical properties and leaf structure that affect the reflectance variability at the leaf level [57,58]. As measurements were performed at similar LAI levels and had similar leaf optical properties with an identical soil background, the discrepancy of reflectance at the same view angle between the two plant types were mainly due to various differences in canopy architecture (i.e., leaf sizes, LAD, and foliar clumping) and their impacts on the background contribution visible in the field of view [22]. Moreover, similar to the differences between the canopy architectures, in the directional domain, varying proportions of foliar and background compounds along the changing view angles equally impose effects on the angular reflectance signal [20]. The observed differences in this study highlight the importance of accounting for canopy architecture and view angles in LAI estimation from spectral remote sensing.
When the LAI ≈ 4.3 (heading stage), the HDRFs of the investigated bands showed less differences between the planophile and erectophile varieties. Alterations of the HDRFs can be explained by the fact that the stand became denser and more homogeneous with increased LAI in the heading stage, which resulted in less difference in the canopy structures between the two varieties [21], thus reducing the contrast of HDRFs between them.

4.2. Relationships between LAI and Spectral Vegetation Indices

Through the analysis of the linear relationships between the LAI and spectral VIs, it is easy to state that the strength of the relationships between the spectral VIs and LAI differed for different plant architectures and view angles. As shown in both the measured and simulated datasets, most of the spectral VIs performed better in estimating the LAI in the planophile than in the erectophile variety, especially at the zenith angle where the background was expected to be more evident for the erectophile type wheat. This is probably because the nadir observation is highly affected by canopy gaps [16] and more background observed at the nadir for erectophile canopies tended to decrease the quality of the signals.
Regarding the three categories of the published indices (simple greenness, advanced greenness, and stress indices), it was noticeable that intra-category similarities and apparent inter-category differences were observed in the angular signatures of the LAI–VI correlations, which was more significant in the measured datasets. This implied that the angular response of the LAI–VI correlation was also strongly dependent on the band combinations and formula of index.
Simple greenness indices including NDVI, modified simple ratio (MSR2), meris terrestrial chlorophyll index (MTCI), and vogelmann index (VOG) (Table 2) as well as NDSIs with visible and near-infrared bands obtained better accuracy for the LAI estimation in the backward than in the forward scattering direction, which was partly consistent with those of Galvão et al. [15] for the LAI and Breunig et al. [7] for yield estimation, both using MODIS NDVI as the predicator variable. For the planophile variety, lower correlations observed in the forward scattering direction were mainly due to the lower correlations between the visible bands and LAI (Figure 3b) when compared to those in the backward scattering direction as a stronger shadowing effect in the visible bands in the forward scattering direction tend to produce lower and lesser variable reflectance for the sensor [15]. However, this argument could not be made for the erectophile variety. It seems that lower significances of these indices occurred in the forward scattering direction was accounted more for the lower correlation between the LAI and NIR bands for the erectophile variety (Figure 3a). Overall, the performance of the advanced greenness indices was the least affected by differences related to plant type and view angles, which produced relatively good coefficients in all of the observing angles over both cultivars. Accordingly, it may be more optimal to use these indices as LAI estimators in crops with these two different plant types and across a wide range of view angles.
Previous studies have often concluded that off-nadir view angles are more useful in monitoring ecosystems since less background is visible within the field of view [16]. Our results further confirmed this conclusion. However, the optimal angles varied for different cultivars and different VIs in this study. Moreover, it has often been stated that VZA in back scattering direction produce more effective VIs than the forward scattering direction in the estimation of biophysical parameters [15,59]. However, except for the simple greenness indices, there was no superiority of the backward scattering directions in estimating the LAI by other published VIs in our results. In the NDSIs analysis, a high significance could also be observed in both sides of the scattering directions. Hence, the view angles both in the backward and forward scattering directions could obtain a high significance by selecting suitable VIs, implying that other factors such as soil background rather than shadow effects largely affect the reliability of these indices. Stagakis et al. [16] also observed that the forward scattering angle (+55) of hyperspectral and multi-angular CHRIS/PROBA observations often performed better than backward scattering angles in the prediction of biophysical parameters.
Some VIs that are not often used in estimating the biophysical parameters presented good accuracies for predicting the LAI. Except for the direct relationships between LAI and VIs, such significant relationships may appear by chance or may be due to plant parameter co-variation [16]. Stress indices including photochemical reflectance index (PRI); normalized pigment chlorophyll index (NPCI) and simple ratio pigment index (SRPI) (Table 2), which are designed to detect stress conditions in leaves as well as NDSIs with bands focused around the wavelengths of these indices, presented high accuracies in the LAI estimation for both cultivars. Given that LAI is closely related to plant health, the above result seems reasonable. Additionally, NDSIs that used red-edge wavelengths (700–720 nm), which are sensitive to chlorophyll content [60,61,62], or even NIR wavelengths around water absorption bands (920–970 nm), often showed extremely high significance in LAI determination. The former is probably due to the covariation between LAI and chlorophyll that allows the interchange of chlorophyll indices and LAI indices. The latter are supposed to be caused by the covariation between leaf biomass and canopy water content. Similar result was also demonstrated by Galvão et al. [10] who concluded that changes in LAI were usually followed by modifications in the canopy water content measured by VIs such as the Normalized Difference Water Index (NDWI). Similar results were also revealed by PROSAIL simulations except for the NDSIs that used water absorption bands, which only produced moderate coefficients in the study.
Many studies have proven that several indices saturate at intermediate values of LAI [1,63]. However, in both the simulated (Figure 10) and measured datasets (Figure 7), the relationship between the optimal VIs chosen from the NDSIs and LAI illustrate almost linear relationships. Even at relatively high LAI values, saturation had not yet occurred. It appears that by carefully selecting appropriate wavelengths and view angles, a relatively high sensitivity of spectral VIs to LAI variations can be maintained even for high LAI values.
Despite the differences in the magnitude of R2, general angular signatures of correlations between LAI and published indices (except advanced greenness indices), LAI and NDSIs in three regions of concern (except NDSIs in VIS-VIS region at large angles for the planophile variety) were also corroborated by the PROSAIL modeled BRDF. Apart from a much larger range of simulated data relative to measured data, the resultant differences may be due to the row effects [64] and interaction between LAD, leaf chlorophyll concentration, and LAI [65,66], both important factors in shaping the realistic canopy reflectance, are not modeled by PROSAIL.

4.3. Limitations

Uncertainties might be encountered when using the RTLS model to normalize measured BRDF to a uniform SZA. As reported by [67] recently, the assumption of spherical leaf angle distribution (LAD) in RTLS model [40] may lead to uncertainties of BRDF parameters on vegetation properties estimation, in particular, for canopy with large MTA (erectophile canopy). Compared to global vegetation structure mapping from satellite BRDF parameters [34,68], probable uncertainties caused by the assumption of LAD are supposed to be more considerable for this study focusing on comparison between planophile and erectophile wheat canopy at ground level. However, structural scattering index (SSI), which was derived from BRDF parameters inversed by RTLS model, was proved to successfully distinguish the different vegetation types even when they have the same nadir view NDVI [69]. Smaller SSI was expected to be observed in sparse and electophile vegetation structure, and larger SSI was more likely to be observed in dense and planophile vegetation structure. Moreover, structural parameter sensitive index (SPEI), a modified version of SSI, was proved to be sensitive to identify LAD varieties of crop when applied in airborne multi-angular images with spatial resolution of 2 m [21]. Besides, forest with more complicated canopy structure is expected to suffer more uncertainties in BRDF modeling than crop. Koukal, T et al. still found that the separability of forest types can be significantly enhanced by normalizing the reflectance to a uniform sun-view-geometry based on RTLS model using multi-angular data from the airborne platform [33]. In light of empirical studies previously, it is reasonable to suppose that structural information of crop with different LAD incorporated in the raw measurements of BRDF could be then encoded or even enhanced in the normalized BRDF modeled by the RTLS model using the raw measurements as input, although the assumption of spherical LAD in the RTLS model is different from reality. From this perspective, consequent uncertainties in the present study were tolerable. Nevertheless, caution is required when incorporating the RTLS model in characterizing vegetation structure for erectophile canopy, following the suggestion of [67].
It is noticeable that the results demonstrated here were only valid within the LAI range and conditions measured in the present study. Only limited samples in the growth cycle of wheat were provided in our study, and the evaluation was only conducted over two types of wheat at a canopy scale with ground data. Deeper analyses with extensive datasets involving a large range of crop structures and with multi-angular data acquired by airborne or spaceborne sensors are required. Replicate measurements should also be carried out to infer generalizable results.

5. Conclusions

Based on field experiments over winter wheat, this paper examined the effects of view angle and plant architecture on the estimation of LAI from hyperspectral vegetation indices. The angular responses of the linear relationships between three sections of VIs and LAI were compared in the two cultivars. The evaluation was also supported by a simulation analysis using the PROSAIL model.
The study confirmed that the strength of the relationships between VIs and LAI differed depending on different plant types and view zenith angles. In general, the LAI–VI correlations were deemed to be stronger in the planophile (W9507) than in the erectophile (W411) variety, especially at the zenith angle where the background was expected to be more evident for the erectophile type of wheat. Intra-category similarities and apparent inter-category differences were present in the angular shapes of correlations between the LAI and three categories of published VIs including simple greenness (NDVI, MSR2, MTCI, VOG), advanced greenness (EVI, MSAVI, TVI, SPVI), and stress indices (PRI, SRPI, NPCI), which implied that the angular performance of VIs also strongly depended on the band combinations and formulas of the indices. It was evident that the off-nadir angles produced more effective VIs than the nadir angle, and the analyses of the NDSIs further indicated that narrow-band indices, especially with combinations of a red-edge (700~720 nm) and a green band, led to more accurate LAI estimations than broad-band indices. These findings are particularly relevant in light of future hyperspectral satellite missions. Furthermore, the study revealed that by selecting appropriate VIs and view angles in both the backward and forward scattering directions, consistently linear relationships between LAI and VIs could be obtained. These results from the in-situ measurements were also confirmed by the PROSAIL model simulating canopy reflectance.
Despite limited ground data, our results suggest that the appropriate plant-specific choice of VIs and view angles is of particular importance for the retrieval of LAI through remote sensing VIs. These conclusions will also be useful for designing improved multi-angular sensors for accurate ecosystem monitoring and further improving our understanding of global and regional vegetation states, processes, change, and dynamics.

Author Contributions

H.C. implemented the methods, analyzed the data, and wrote the manuscript. W.H. and W.L. designed the field experiment, realized this idea, and reviewed the manuscript. Z.N. provided suggestions about the field design and contributed to all phases of the investigation. L.Z. contributed to the data processing. All authors read and approved the final manuscript.

Funding

This research was funded by [National Natural Science Foundation of China] grant number [41401399] and [41601466], [Foundation for Outstanding Youth in Fujian Agriculture and Forestry University] grant number [xjq201508]. And the APC was funded by [Foundation for Outstanding Youth in Fujian Agriculture and Forestry University] grant number [xjq201508].

Acknowledgments

This work was supported by the National Natural Science Foundation of China (41401399 and 41601466); the Foundation for Outstanding Youth in Fujian Agriculture and Forestry University (xjq201508).

Conflicts of Interest

The authors declare no conflict of interest.

Appendix A

Table A1. Band combination of NDSI that shows the maximum R2 for the linear relationship with LAI at each view angle, excluding results due to chance, for each wheat plant type.
In-situ ResultsSimulation Results
NDSI(x,y) W9507NDSI(x,y) W411NDSI(x,y) W9507NDSI(x,y) W411
VZAxyR2xyR2xyR2xyR2
−65°4224450.9696146990.9665006720.920 5106220.882
−55°4254460.9696116990.9335006720.884 5205810.911
−45°9529960.9685287150.9005307030.928 5816970.866
−35°5367200.9696656840.8555726970.914 5816970.905
−25°5447190.9555257140.8595726970.886 5105610.900
−15°5417190.9325317150.8876036970.866 5516610.931
7449900.915247120.9425906970.871 5516720.911
15°95510000.915207100.9676416970.918 5306220.912
25°9599890.9455167090.976416970.9465816970.899
35°9579990.9645127080.976316970.932 5816970.883
45°4304500.9285077070.9675726970.888 5206410.818
55°4294530.9555717070.9845726970.844 5516410.932
T65°4214870.9195957020.9785006720.870 5006800.885
x, y correspond to index wavelengths. The best index for each plant type is highlighted in bold. NDSI with wavelengths of a green and a red-edge band are highlighted in gray. W9507: planophile variety, W411: erectophile variety.
Figure A1. Contour maps of significance levels (P-values) of the linear correlations between NDSI(x,y) and the ground measured LAI for thirteen VZAs in PP for the planophile variety based on in-situ measurements. The color bar shown in each graph denotes the P-values divided into four levels: P < 0.005, 0.005 < P < 0.01, 0.01< P < 0.05, and P > 0.05. Subtitle a.-m. shown in each graph denotes observation angle.
Remotesensing 10 01630 g0a1
Figure A2. Contour maps of significance levels (P-values) of the linear correlations between NDSI(x,y) and the ground measured LAI for thirteen VZAs in PP for the erectophile variety based on in-situ measurements. Subtitle a.-m. shown in each graph denotes observation angle.
Remotesensing 10 01630 g0a2
Figure A3. Contour maps of R2 between NDSI(x,y) and LAI for thirteen VZAs in PP for the planophile variety based on PROSAIL simulations. Subtitle a.-m. shown in each graph denotes observation angle.
Remotesensing 10 01630 g0a3
Figure A4. Contour maps of R2 between NDSI(x,y) and LAI for thirteen VZAs in PP for the erectophile variety based on PROSAIL simulations. Subtitle a.-m. shown in each graph denotes observation angle.
Remotesensing 10 01630 g0a4aRemotesensing 10 01630 g0a4b

References

  1. Haboudane, D.; Miller, J.R.; Pattey, E.; Zarco-Tejada, P.J.; Strachan, I.B. Hyperspectral vegetation indices and novel algorithms for predicting green LAI of crop canopies: Modeling and validation in the context of precision agriculture. Remote Sens. Environ. 2004, 90, 337–352. [Google Scholar] [CrossRef]
  2. Pocewicz, A.; Vierling, L.A.; Lentile, L.B.; Smith, R. View angle effects on relationships between MISR vegetation indices and leaf area index in a recently burned ponderosa pine forest. Remote Sens. Environ. 2007, 107, 322–333. [Google Scholar] [CrossRef]
  3. Zhao, F.; Gu, X.; Verhoef, W.; Wang, Q.; Yu, T.; Liu, Q.; Huang, H.; Qin, W.; Chen, L.; Zhao, H. A spectral directional reflectance model of row crops. Remote Sens. Environ. 2010, 114, 265–285. [Google Scholar] [CrossRef]
  4. Chen, J.M.; Liu, J.; Leblanc, S.G.; Lacaze, R.; Roujean, J.-L. Multi-angular optical remote sensing for assessing vegetation structure and carbon absorption. Remote Sens. Environ. 2003, 84, 516–525. [Google Scholar] [CrossRef] [Green Version]
  5. Chen, J.M.; Leblanc, S.G. A four-scale bidirectional reflectance model based on canopy architecture. IEEE Trans. Geosci. Remote Sens. 1997, 35, 1316–1337. [Google Scholar] [CrossRef] [Green Version]
  6. Strahler, A.H.; Jupp, D.L. Modeling bidirectional reflectance of forests and woodlands using boolean models and geometric optics. Remote Sens. Environ. 1990, 34, 153–166. [Google Scholar] [CrossRef]
  7. Breunig, F.M.; Galvão, L.S.; Formaggio, A.R.; Epiphanio, J.C.N. Directional effects on NDVI and LAI retrievals from MODIS: A case study in Brazil with soybean. Int. J. Appl. Earth Obs. Geoinf. 2011, 13, 34–42. [Google Scholar] [CrossRef]
  8. Galvão, L.S.; Dos Santos, J.R.; Roberts, D.A.; Breunig, F.M.; Toomey, M.; De Moura, Y.M. On intra-annual EVI variability in the dry season of tropical forest: A case study with MODIS and hyperspectral data. Remote Sens. Environ. 2011, 115, 2350–2359. [Google Scholar] [CrossRef]
  9. Sims, D.A.; Rahman, A.F.; Vermote, E.F.; Jiang, Z. Seasonal and inter-annual variation in view angle effects on MODIS vegetation indices at three forest sites. Remote Sens. Environ. 2011, 115, 3112–3120. [Google Scholar] [CrossRef]
  10. Galvão, L.S.; Breunig, F.M.; Dos Santos, J.R.; De Moura, Y.M. View-illumination effects on hyperspectral vegetation indices in the Amazonian tropical forest. Int. J. Appl. Earth Obs. Geoinf. 2013, 21, 291–300. [Google Scholar] [CrossRef]
  11. Burkart, A.; Aasen, H.; Alonso, L.; Menz, G.; Bareth, G.; Rascher, U. Angular dependency of hyperspectral measurements over wheat characterized by a novel UAV based goniometer. Remote Sens. 2015, 7, 725–746. [Google Scholar] [CrossRef] [Green Version]
  12. Aparicio, N.; Villegas, D.; Royo, C.; Casadesus, J.; Araus, J. Effect of sensor view angle on the assessment of agronomic traits by ground level hyper-spectral reflectance measurements in durum wheat under contrasting Mediterranean conditions. Int. J. Remote Sens. 2004, 25, 1131–1152. [Google Scholar] [CrossRef]
  13. Jay, S.; Maupas, F.; Bendoula, R.; Gorretta, N. Retrieving LAI, chlorophyll and nitrogen contents in sugar beet crops from multi-angular optical remote sensing: Comparison of vegetation indices and PROSAIL inversion for field phenotyping. Field Crops Res. 2017, 210, 33–46. [Google Scholar] [CrossRef] [Green Version]
  14. Danner, M.; Berger, K.; Wocher, M.; Mauser, W.; Hank, T. Retrieval of biophysical crop variables from multi-angular canopy spectroscopy. Remote Sens. 2017, 9, 726. [Google Scholar] [CrossRef]
  15. Galvão, L.S.; Roberts, D.A.; Formaggio, A.R.; Numata, I.; Breunig, F.M. View angle effects on the discrimination of soybean varieties and on the relationships between vegetation indices and yield using off-nadir Hyperion data. Remote Sens. Environ. 2009, 113, 846–856. [Google Scholar] [CrossRef]
  16. Stagakis, S.; Markos, N.; Sykioti, O.; Kyparissis, A. Monitoring canopy biophysical and biochemical parameters in ecosystem scale using satellite hyperspectral imagery: An application on a Phlomis fruticosa mediterranean ecosystem using multiangular CHRIS/PROBA observations. Remote Sens. Environ. 2010, 114, 977–994. [Google Scholar] [CrossRef]
  17. Huber, S.; Kneubuehler, M.; Koetz, B.; Schopfer, J.; Zimmermann, N.; Itten, K.I. The potential of spectrodirectional CHRIS/PROBA data for biochemistry estimation. In Proceeding of the Envisat Symposium, Montreux, Switzerland, 23–27 April 2007. [Google Scholar]
  18. Gemmell, F.; McDonald, A.J. View zenith angle effects on the forest information content of three spectral indices. Remote Sens. Environ. 2000, 72, 139–158. [Google Scholar] [CrossRef]
  19. Inoue, Y.; Peñuelas, J.; Miyata, A.; Mano, M. Normalized difference spectral indices for estimating photosynthetic efficiency and capacity at a canopy scale derived from hyperspectral and co 2 flux measurements in rice. Remote Sens. Environ. 2008, 112, 156–172. [Google Scholar] [CrossRef]
  20. Verrelst, J.; Schaepman, M.E.; Koetz, B.; Kneubühler, M. Angular sensitivity analysis of vegetation indices derived from CHRIS/PROBA data. Remote Sens. Environ. 2008, 112, 2341–2353. [Google Scholar] [CrossRef]
  21. Huang, W.; Niu, Z.; Wang, J.; Liu, L.; Zhao, C.; Liu, Q. Identifying crop leaf angle distribution based on two-temporal and bidirectional canopy reflectance. IEEE Trans. Geosci. Remote Sens. 2006, 44, 3601–3609. [Google Scholar] [CrossRef]
  22. Darvishzadeh, R.; Skidmore, A.; Atzberger, C.; van Wieren, S. Estimation of vegetation LAI from hyperspectral reflectance data: Effects of soil type and plant architecture. Int. J. Appl. Earth Obs. Geoinf. 2008, 10, 358–373. [Google Scholar] [CrossRef]
  23. Zou, X.; Mõttus, M. Sensitivity of common vegetation indices to the canopy structure of field crops. Remote Sens. 2017, 9, 994. [Google Scholar] [CrossRef]
  24. Blackburn, G.A. Quantifying chlorophylls and caroteniods at leaf and canopy scales: An evaluation of some hyperspectral approaches. Remote Sens. Environ. 1998, 66, 273–285. [Google Scholar] [CrossRef]
  25. Elvidge, C.D.; Chen, Z. Comparison of broad-band and narrow-band red and near-infrared vegetation indices. Remote Sens. Environ. 1995, 54, 38–48. [Google Scholar] [CrossRef]
  26. Gong, P.; Pu, R.; Miller, J.R. Correlating leaf area index of ponderosa pine with hyperspectral CASI data. Can. J. Remote Sens. 1992, 18, 275–282. [Google Scholar] [CrossRef]
  27. Lee, K.-S.; Cohen, W.B.; Kennedy, R.E.; Maiersperger, T.K.; Gower, S.T. Hyperspectral versus multispectral data for estimating leaf area index in four different biomes. Remote Sens. Environ. 2004, 91, 508–520. [Google Scholar] [CrossRef]
  28. Mutanga, O.; Skidmore, A.K. Narrow band vegetation indices overcome the saturation problem in biomass estimation. Int. J. Remote Sens. 2004, 25, 3999–4014. [Google Scholar] [CrossRef]
  29. Jacquemoud, S.; Verhoef, W.; Baret, F.; Bacour, C.; Zarco-Tejada, P.J.; Asner, G.P.; François, C.; Ustin, S.L. PROSPECT + SAIL models: A review of use for vegetation characterization. Remote Sens. Environ. 2009, 113, 56–66. [Google Scholar] [CrossRef]
  30. Chen, H.; Niu, Z.; Huang, W.; Feng, J. Predicting leaf area index in wheat using an improved empirical model. J. Appl. Remote Sens. 2013, 7, 073577. [Google Scholar] [CrossRef]
  31. Liu, L.; Wang, J.; Bao, Y.; Huang, W.; Ma, Z.; Zhao, C. Predicting winter wheat condition, grain yield and protein content using multi-temporal EnviSat-Asar and Landsat TM satellite images. Int. J. Remote Sens. 2006, 27, 737–753. [Google Scholar] [CrossRef]
  32. De Moura, Y.M.; Hilker, T.; Gonçalves, F.G.; Galvão, L.S.; Dos Santos, J.R.; Lyapustin, A.; Maeda, E.E.; De Jesus Silva, C.V. Scaling estimates of vegetation structure in amazonian tropical forests using multi-angle MODIS observations. Int. J. Appl. Earth Obs. Geoinf. 2016, 52, 580–590. [Google Scholar] [CrossRef] [PubMed]
  33. Koukal, T.; Atzberger, C.; Schneider, W. Evaluation of semi-empirical BRDF models inverted against multi-angle data from a digital airborne frame camera for enhancing forest type classification. Remote Sens. Environ. 2014, 151, 27–43. [Google Scholar] [CrossRef]
  34. Feng, D.; Chen, J.M.; Plummer, S.; Mingzhen, C.; Pisek, J. Algorithm for global leaf area index retrieval using satellite imagery. IEEE Trans. Geosci. Remote Sens. 2006, 44, 2219–2229. [Google Scholar] [CrossRef] [Green Version]
  35. Roujean, J.L.; Leroy, M.; Deschamps, P.Y. A bidirectional reflectance model of the earth’s surface for the correction of remote sensing data. J. Geophys. Res. Atmos. 1992, 97, 20455–20468. [Google Scholar] [CrossRef]
  36. Lucht, W.; Schaaf, C.B.; Strahler, A.H. An algorithm for the retrieval of albedo from space using semiempirical BRDF models. IEEE Trans. Geosci. Remote Sens. 2000, 38, 977–998. [Google Scholar] [CrossRef]
  37. Schaaf, C.B.; Gao, F.; Strahler, A.H.; Lucht, W.; Li, X.; Tsang, T.; Strugnell, N.C.; Zhang, X.; Jin, Y.; Muller, J.-P. First operational BRDF, albedo nadir reflectance products from MODIS. Remote Sens. Environ. 2002, 83, 135–148. [Google Scholar] [CrossRef] [Green Version]
  38. Wanner, W.; Strahler, A.; Hu, B.; Lewis, P.; Muller, J.P.; Li, X.; Schaaf, C.; Barnsley, M. Global retrieval of bidirectional reflectance and albedo over land from EOS MODIS and MISR data: Theory and algorithm. J. Geophys. Res. Atmos. 1997, 102, 17143–17161. [Google Scholar] [CrossRef] [Green Version]
  39. Jiao, Z.; Hill, M.J.; Schaaf, C.B.; Zhang, H.; Wang, Z.; Li, X. An anisotropic flat index (AFX) to derive BRDF archetypes from MODIS. Remote Sens. Environ. 2014, 141, 168–187. [Google Scholar] [CrossRef]
  40. Wanner, W.; Li, X.; Strahler, A. On the derivation of kernels for kernel-driven models of bidirectional reflectance. J. Geophys. Res. Atmos. 1995, 100, 21077–21089. [Google Scholar] [CrossRef]
  41. Sims, D.A.; Gamon, J.A. Relationships between leaf pigment content and spectral reflectance across a wide range of species, leaf structures and developmental stages. Remote Sens. Environ. 2002, 81, 337–354. [Google Scholar] [CrossRef]
  42. Dash, J.; Curran, P.J. The MERIS terrestrial chlorophyll index. Int. J. Remote Sens. 2004, 25, 5403–5413. [Google Scholar] [CrossRef]
  43. Tucker, C.J. Red and photographic infrared linear combinations for monitoring vegetation. Remote Sens. Environ. 1979, 8, 127–150. [Google Scholar] [CrossRef] [Green Version]
  44. Vogelmann, J.; Rock, B.; Moss, D. Red edge spectral measurements from sugar maple leaves. Int. J. Remote Sens. 1993, 14, 1563–1575. [Google Scholar] [CrossRef]
  45. Huete, A.; Liu, H.; Batchily, K.; Van Leeuwen, W. A comparison of vegetation indices over a global set of TM images for EOS-MODIS. Remote Sens. Environ. 1997, 59, 440–451. [Google Scholar] [CrossRef]
  46. Qi, J.; Chehbouni, A.; Huete, A.; Kerr, Y.; Sorooshian, S. A modified soil adjusted vegetation index. Remote Sens. Environ. 1994, 48, 119–126. [Google Scholar] [CrossRef]
  47. Broge, N.H.; Leblanc, E. Comparing prediction power and stability of broadband and hyperspectral vegetation indices for estimation of green leaf area index and canopy chlorophyll density. Remote Sens. Environ. 2001, 76, 156–172. [Google Scholar] [CrossRef]
  48. Vincini, M.; Frazzi, E.; D’Alessio, P. Angular dependence of maize and sugar beet vis from directional CHRIS/PROBA data. In Proceeding of the 4th ESA CHRIS PROBA Workshop, ESRIN, Frascati, Italy, 19–21 Septembar 2006; pp. 19–21. [Google Scholar]
  49. Peñuelas, J.; Filella, I.; Lloret, P.; Muñoz, F.; Vilajeliu, M. Reflectance assessment of mite effects on apple trees. Int. J. Remote Sens. 1995, 16, 2727–2733. [Google Scholar] [CrossRef]
  50. Peñuelas, J.; Gamon, J.; Fredeen, A.; Merino, J.; Field, C. Reflectance indices associated with physiological changes in nitrogen-and water-limited sunflower leaves. Remote Sens. Environ. 1994, 48, 135–146. [Google Scholar] [CrossRef]
  51. Gamon, J.; Serrano, L.; Surfus, J. The photochemical reflectance index: An optical indicator of photosynthetic radiation use efficiency across species, functional types, and nutrient levels. Oecologia 1997, 112, 492–501. [Google Scholar] [CrossRef] [PubMed]
  52. He, L.; Song, X.; Feng, W.; Guo, B.-B.; Zhang, Y.-S.; Wang, Y.-H.; Wang, C.-Y.; Guo, T.-C. Improved remote sensing of leaf nitrogen concentration in winter wheat using multi-angular hyperspectral data. Remote Sens. Environ. 2016, 174, 122–133. [Google Scholar] [CrossRef]
  53. Atzberger, C.; Darvishzadeh, R.; Immitzer, M.; Schlerf, M.; Skidmore, A.; Le Maire, G. Comparative analysis of different retrieval methods for mapping grassland leaf area index using airborne imaging spectroscopy. Int. J. Appl. Earth Obs. Geoinf. 2015, 43, 19–31. [Google Scholar] [CrossRef] [Green Version]
  54. Wang, L.; Dong, T.; Zhang, G.; Niu, Z. LAI retrieval using PROSAIL model and optimal angle combination of multi-angular data in wheat. IEEE J. Sel. Top. Appl. Earth Obs. Remote Sens. 2013, 6, 1730–1736. [Google Scholar] [CrossRef]
  55. Gitelson, A.A.; Gritz, Y.; Merzlyak, M.N. Relationships between leaf chlorophyll content and spectral reflectance and algorithms for non-destructive chlorophyll assessment in higher plant leaves. J. Plant Physiol. 2003, 160, 271–282. [Google Scholar] [CrossRef] [PubMed]
  56. Jackson, R.D.; Pinter, P.J. Spectral response of architecturally different wheat canopies. Remote Sens. Environ. 1986, 20, 43–56. [Google Scholar] [CrossRef]
  57. Curran, P.J.; Dungan, J.L.; Macler, B.A.; Plummer, S.E.; Peterson, D.L. Reflectance spectroscopy of fresh whole leaves for the estimation of chemical concentration. Remote Sens. Environ. 1992, 39, 153–166. [Google Scholar] [CrossRef]
  58. Fourty, T.; Baret, F.; Jacquemoud, S.; Schmuck, G.; Verdebout, J. Leaf optical properties with explicit description of its biochemical composition: Direct and inverse problems. Remote Sens. Environ. 1996, 56, 104–117. [Google Scholar] [CrossRef]
  59. Walter-Shea, E.; Privette, J.; Cornell, D.; Mesarch, M.A.; Hays, C. Relations between directional spectral vegetation indices and leaf area and absorbed radiation in alfalfa. Remote Sens. Environ. 1997, 61, 162–177. [Google Scholar] [CrossRef]
  60. Gamon, J.; Surfus, J. Assessing leaf pigment content and activity with a reflectometer. New Phytol. 1999, 143, 105–117. [Google Scholar] [CrossRef] [Green Version]
  61. Gitelson, A.; Merzlyak, M.N. Quantitative estimation of chlorophyll-a using reflectance spectra: Experiments with autumn chestnut and maple leaves. J. Photochem. Photobiol. B Biol. 1994, 22, 247–252. [Google Scholar] [CrossRef]
  62. Zarco-Tejada, P.J.; Miller, J.R.; Noland, T.L.; Mohammed, G.H.; Sampson, P.H. Scaling-up and model inversion methods with narrowband optical indices for chlorophyll content estimation in closed forest canopies with hyperspectral data. IEEE Trans. Geosci. Remote Sens. 2001, 39, 1491–1507. [Google Scholar] [CrossRef] [Green Version]
  63. Wu, C.; Niu, Z.; Wang, J.; Gao, S.; Huang, W. Predicting leaf area index in wheat using angular vegetation indices derived from in situ canopy measurements. Can. J. Remote Sens. 2010, 36, 301–312. [Google Scholar] [CrossRef]
  64. Atzberger, C.; Richter, K. Spatially constrained inversion of radiative transfer models for improved LAI mapping from future sentinel-2 imagery. Remote Sens. Environ. 2012, 120, 208–218. [Google Scholar] [CrossRef]
  65. Olioso, A.; Inoue, Y.; Ortega-Farias, S.; Demarty, J.; Wigneron, J.-P.; Braud, I.; Jacob, F.; Lecharpentier, P.; Ottlé, C.; Calvet, J.-C. Future directions for advanced evapotranspiration modeling: Assimilation of remote sensing data into crop simulation models and svat models. Irrig. Drain. Syst. 2005, 19, 377–412. [Google Scholar] [CrossRef]
  66. Baret, F.; Houles, V.; Guérif, M. Quantification of plant stress using remote sensing observations and crop models: The case of nitrogen management. J. Exp. Bot. 2007, 58, 869–880. [Google Scholar] [CrossRef] [PubMed]
  67. Zhang, X.; Jiao, Z.; Dong, Y.; Zhang, H.; Li, Y.; He, D.; Ding, A.; Yin, S.; Cui, L.; Chang, Y. Potential investigation of linking PROSAIL with the ross-li BRDF model for vegetation characterization. Remote Sens. 2018, 10, 437. [Google Scholar] [CrossRef]
  68. Pisek, J.; Chen, J.M.; Nilson, T. Estimation of vegetation clumping index using MODIS BRDF data. Int. J. Remote Sens. 2011, 32, 2645–2657. [Google Scholar] [CrossRef]
  69. Gao, F. Detecting vegetation structure using a kernel-based BRDF model. Remote Sens. Environ. 2003, 86, 198–205. [Google Scholar] [CrossRef]
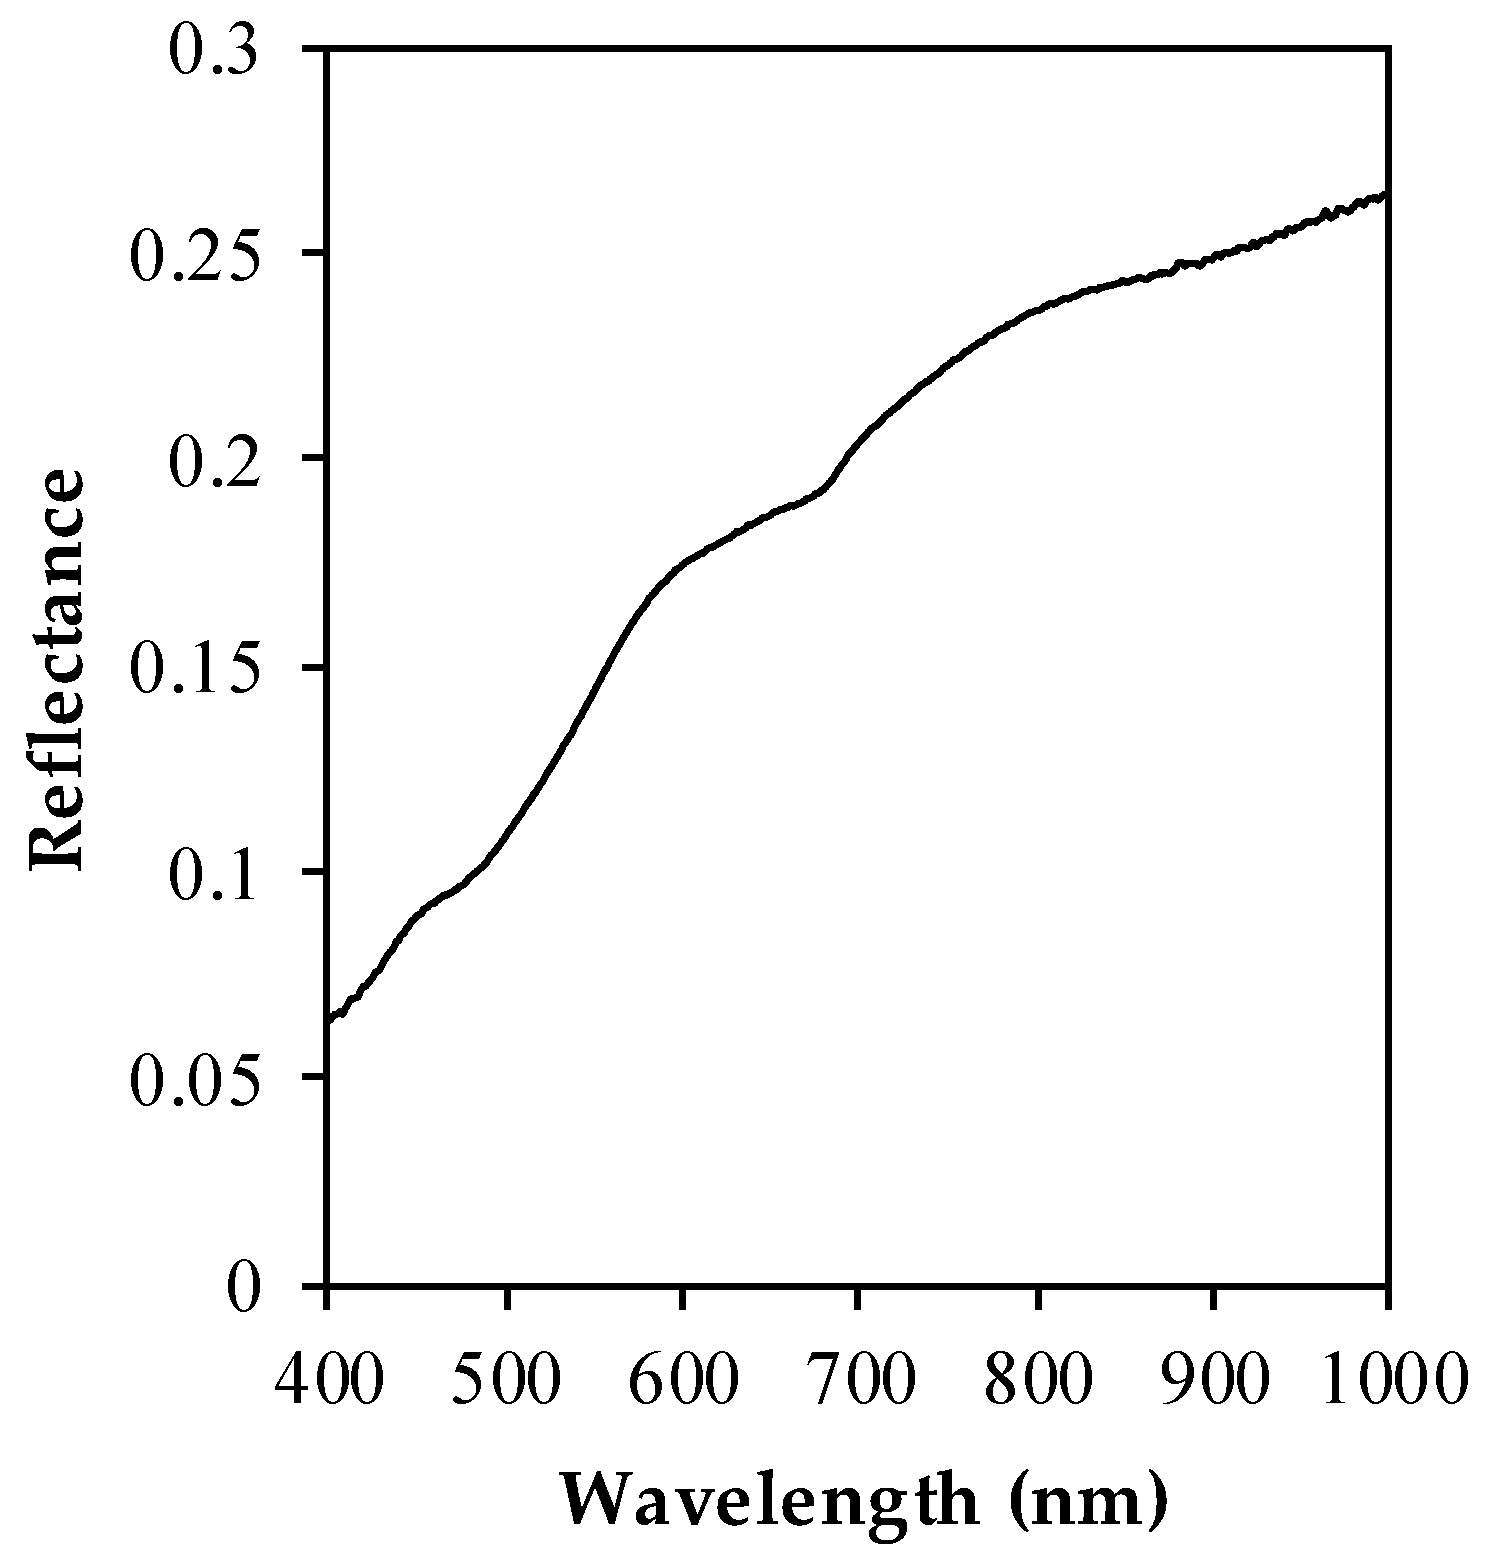
Figure 1. The soil reflectance used for the PROSAIL simulations.
Remotesensing 10 01630 g001
Figure 2. Average HDRFs of the red, blue, and green wavelengths for the erectophile (solid line, R(Red)_E, R(Blue)_E, R(Green)_E) and planophile varieties (dotted line, R(Red)_P, R(Blue)_P, R(Green)_P) in PP measured at (a) the returning green stage (LAI ≈ 1.3) and (c) heading stage (LAI ≈ 4.3) as well as the average hemispherical directional reflectance factors (HDRFs) of the red-edge, NIR wavelengths for the erectophile (solid line, R(Red-edge)_E, R(NIR)_E) and planophile varieties (dotted line, R(Red-edge)_P, R(NIR)_P) in PP measured at (b) returning green stage (LAI ≈ 1.3) and (d) heading stage (LAI ≈ 4.3). Standard deviation bars are indicated.
Remotesensing 10 01630 g002
Figure 3. Coefficients of determination (R2) of the linear relationships between LAI and red, blue, green, red-edge, and NIR bands at different VZAs in principal plane (PP) for (a) planophile and (b) erectophile varieties based on the measured datasets. The y-axis indicates the average R2 of the linear relationships between LAI and Rx at each view angle (Rx: Reflectance at wavelength of x presented in Section 2.3.2: 1. Raw reflectance). Standard deviation bars are indicated.
Remotesensing 10 01630 g003
Figure 4. Coefficients of determination (R2) of the linear relationships between LAI and selected VIs at different VZAs in PP for (a) erectophile and (b) planophile varieties based on the measured datasets.
Remotesensing 10 01630 g004
Figure 5. Contour maps of coefficients of determination (R2) between NDSI(x,y) (x and y are the wavelengths on the corresponding axes) and the ground measured LAI for thirteen VZAs in PP for the planophile variety based on in-situ measurements. The color bar shown in each graph denotes the R2 value of the linear relationship between LAI and NDSI(x,y) (the whiter the image, the higher the R2). Subtitle a.-m. shown in each graph denotes observation angle.
Remotesensing 10 01630 g005aRemotesensing 10 01630 g005b
Figure 6. Contour maps of R2 between NDSI(x,y) and the ground measured LAI for thirteen VZAs in PP for the erectophile variety based on in-situ measurements. Subtitle a.-m. shown in each graph denotes observation angle.
Remotesensing 10 01630 g006aRemotesensing 10 01630 g006b
Figure 7. Optimal linear relationships between NDSI(x,y) and LAI for (a) the planophile and (b) erectophile varieties based on in-situ measurements.
Remotesensing 10 01630 g007
Figure 8. R2 of the linear relationships between the LAI and selected VIs at different VZAs in PP for (a) the erectophile and (b) the planophile varieties based on PROSAIL simulations.
Remotesensing 10 01630 g008
Figure 9. Average R2 of the linear relationships between LAI and NDSIs in the VIS-VIS, VIS-Red-edge, and VIS-NIR regions at different VZAs in PP for the erectophile (solid line, VIS-VIS_E, VIS-red-edge_E, VIS-NIR_E) and planophile varieties (dotted line, VIS-VIS_P, VIS-Red-edge_P, VIS-NIR_P) based on PROSAIL simulations.
Remotesensing 10 01630 g009
Figure 10. Optimal linear relationships between NDSI(x,y) and LAI for (a) the planophile and (b) the erectophile varieties based on the PROSAIL simulations.
Remotesensing 10 01630 g010
Table 1. Precise information of each plot.
Plot NumberObserved DateObserved Time (Beginning)SZA (°)PeriodTypeLAIMTA
11 April 200411:04:0039returning greenW95071.3038.70
217 April 200411:04:0033.2jointingW95074.0126.10
33 May 200410:14:0035.1headingW95074.2924.00
411 May 200415:32:0048.4flowering W95073.8536.40
520 May 200414:31:0036milk ripeningW95072.9832.79
630 May 200414:18:0032.4wax ripenessW95071.0641.42
79 June 200410:05:0032senescenceW95070.84-
820 April 201110:12:0039.4jointingW95073.87-
96 May 20119:41:0040.1headingW95073.41-
1013 May 20119:36:0039.7floweringW95072.92-
111 April 200410:15:0044.8returning greenW4111.3153.72
1217 April 200410:20:0038.6jointingW4114.2571.85
133 May 200414:27:0038.2headingW4114.2861.10
1411 May 200413:58:0032floweringW4112.2763.80
1520 May 200410:09:0032.7milk ripeningW4112.4766.42
1630 May 200410:00:0033.3wax ripenessW4111.6256.42
179 June 20049:26:0039.1senescenceW4110.92-
1820 April 201110:08:0040jointingW4114.44-
1910 May 20119:45:0038.8flowering W4113.48-
2013 May 20119:33:0040.3floweringW4113.42-
W9507: planophile variety; W411: erectophile variety; SZA: solar zenith angle; LAI: leaf area index; MTA: mean tilt angle.
Table 2. Vegetation indices, proposed in the relevant literature, that were tested in the present study.
IndicesFormulationReference
Simple greenness indices: normalized difference or simple ratio formula of NIR, red (including red-edge), blue (used in MSR2) band combinations.
MSR2 (Modified Simple Ratio)(R750 − R445)/(R705 − R445)[41]
MTCI (MERIS Terrestrial Chlorophyll index)(R754 − R709)/(R709 − R681)[42]
NDVI (Normalized Difference Vegetation Index)(R800 − R670)/(R800 + R670)[43]
VOG (Vogelmann Index)R740/R720[44]
Advanced greenness indices: more complicated formula of NIR and visible bands combinations
EVI (Enhanced Vegetation Index) 2.5 R 800 R 670 R 800 +   6 R 670 7.5 R 445 +   1 [45]
MSAVI (Improved Soil Adjusted Vegetation Index) 0.5 [ 2 R 800 + 1 ( 2 R 800 + 1 ) 2 8 ( R 800 R 670 ) ] [46]
TVI (Triangular Vegetation Index)0.5[120(R750 − R550) − 200(R670 − R550)][47]
SPVI (Spectral polygon vegetation index)0.4[3.7(R800 − R670) − 1.2|R530 − R670|][48]
Stress indices: normalized difference or simple ratio formula of visible bands combinations
SRPI (Simple Ratio Pigment Index)R430/R680[49]
NPCI (Normalized Pigment Chlorophyll index)(R680 − R430)/(R680 + R430)[50]
PRI (Photochemical Reflectance Index)(R531 − R570)/(R531 + R570)[51]
Indices are sorted according to their bands combinations and formulas.
Table 3. Overview of PRO4SAIL-5B parameter ranges. Skyl: the fraction of diffuse incoming solar radiation; Hot: hot spot size parameter; Cab: leaf chlorophyll a and b content; Ccar: leaf carotenoid content; Cm: leaf dry matter content; Cw: equivalent water thickness; Cbp: leaf brown pigment content; VZA: view zenith angle (VZA); RAA: relative azimuth angle.
ModelParameterUnitsFixed valueMinMax
PROSPECT-5BLAI--0.55
MTAdeg-1570
Hot--0.011
Skyl-0.1--
Cabμg·cm−2-4555
Ccarµg·cm-2-911
4SAILCmg·cm-20.0135-
Cwcm-0.010.02
Cbp-0--
N--1.31.7
SZAdeg35--
VZAdeg-−6565
RAAdeg-0180
Table 4. The optimal angle and view angle sensitivity of linear correlation between each published VI listed in Table 2 and LAI based on measured datasets.
Erectophile VarietyPlanophile Variety
VIOptimal Angle (deg)Optimal R2AD_R2VIOptimal Angle (deg)Optimal R2AD_R2
MSAVI100.725 *0.090NPCI650.852 ** 0.055
EVI−100.706 *0.098SRPI−650.926 *** 0.094
TVI−150.756 *0.119PRI−650.871 ** 0.133
SPVI250.774 **0.121SPVI250.899 ** 0.171
NDVI−650.560 *0.138EVI250.902 ** 0.174
VOG−650.654 *0.207TVI300.883 ** 0.187
PRI−650.665 *0.297MSAVI250.921 *** 0.211
MTCI−350.649 *0.300MSR2350.946 ***0.283
MSR2−650.700 *0.355NDVI−350.723 * 0.283
NPCI650.721 *0.372VOG−350.900 ** 0.341
SRPI−650.747 *0.432MTCI−350.933 ** 0.390
Results are listed in ascending order of AD_R2. The optimal angle denotes the view angle where each index obtained the highest coefficient (optimal R2). Significance level: * P < 0.05, ** P < 0.01, *** P < 0.001. The best index for each variety is highlighted in bold. MSR2: Modified Simple Ratio; MTCI: MERIS Terrestrial Chlorophyll index; NDVI: Normalized Difference Vegetation Index; VOG: Vogelmann Index; EVI: Enhanced Vegetation Index; MSAVI: Improved Soil Adjusted Vegetation Index; TVI: Triangular Vegetation Index; SPVI: Spectral polygon vegetation index; SRPI: Simple Ratio Pigment Index; NPCI: Normalized Pigment Chlorophyll index; PRI: Photochemical Reflectance Index.