An Overview of Innovative Heritage Deliverables Based on Remote Sensing Techniques


Abstract
:
1. Background and Related Work
2. Orthomosaic
2.1. Test Case Sint Niklaaschurch
2.1.1. Survey
2.1.2. Processing
2.1.3. Orthomosaic
2.2. Test Case Church Bijloke
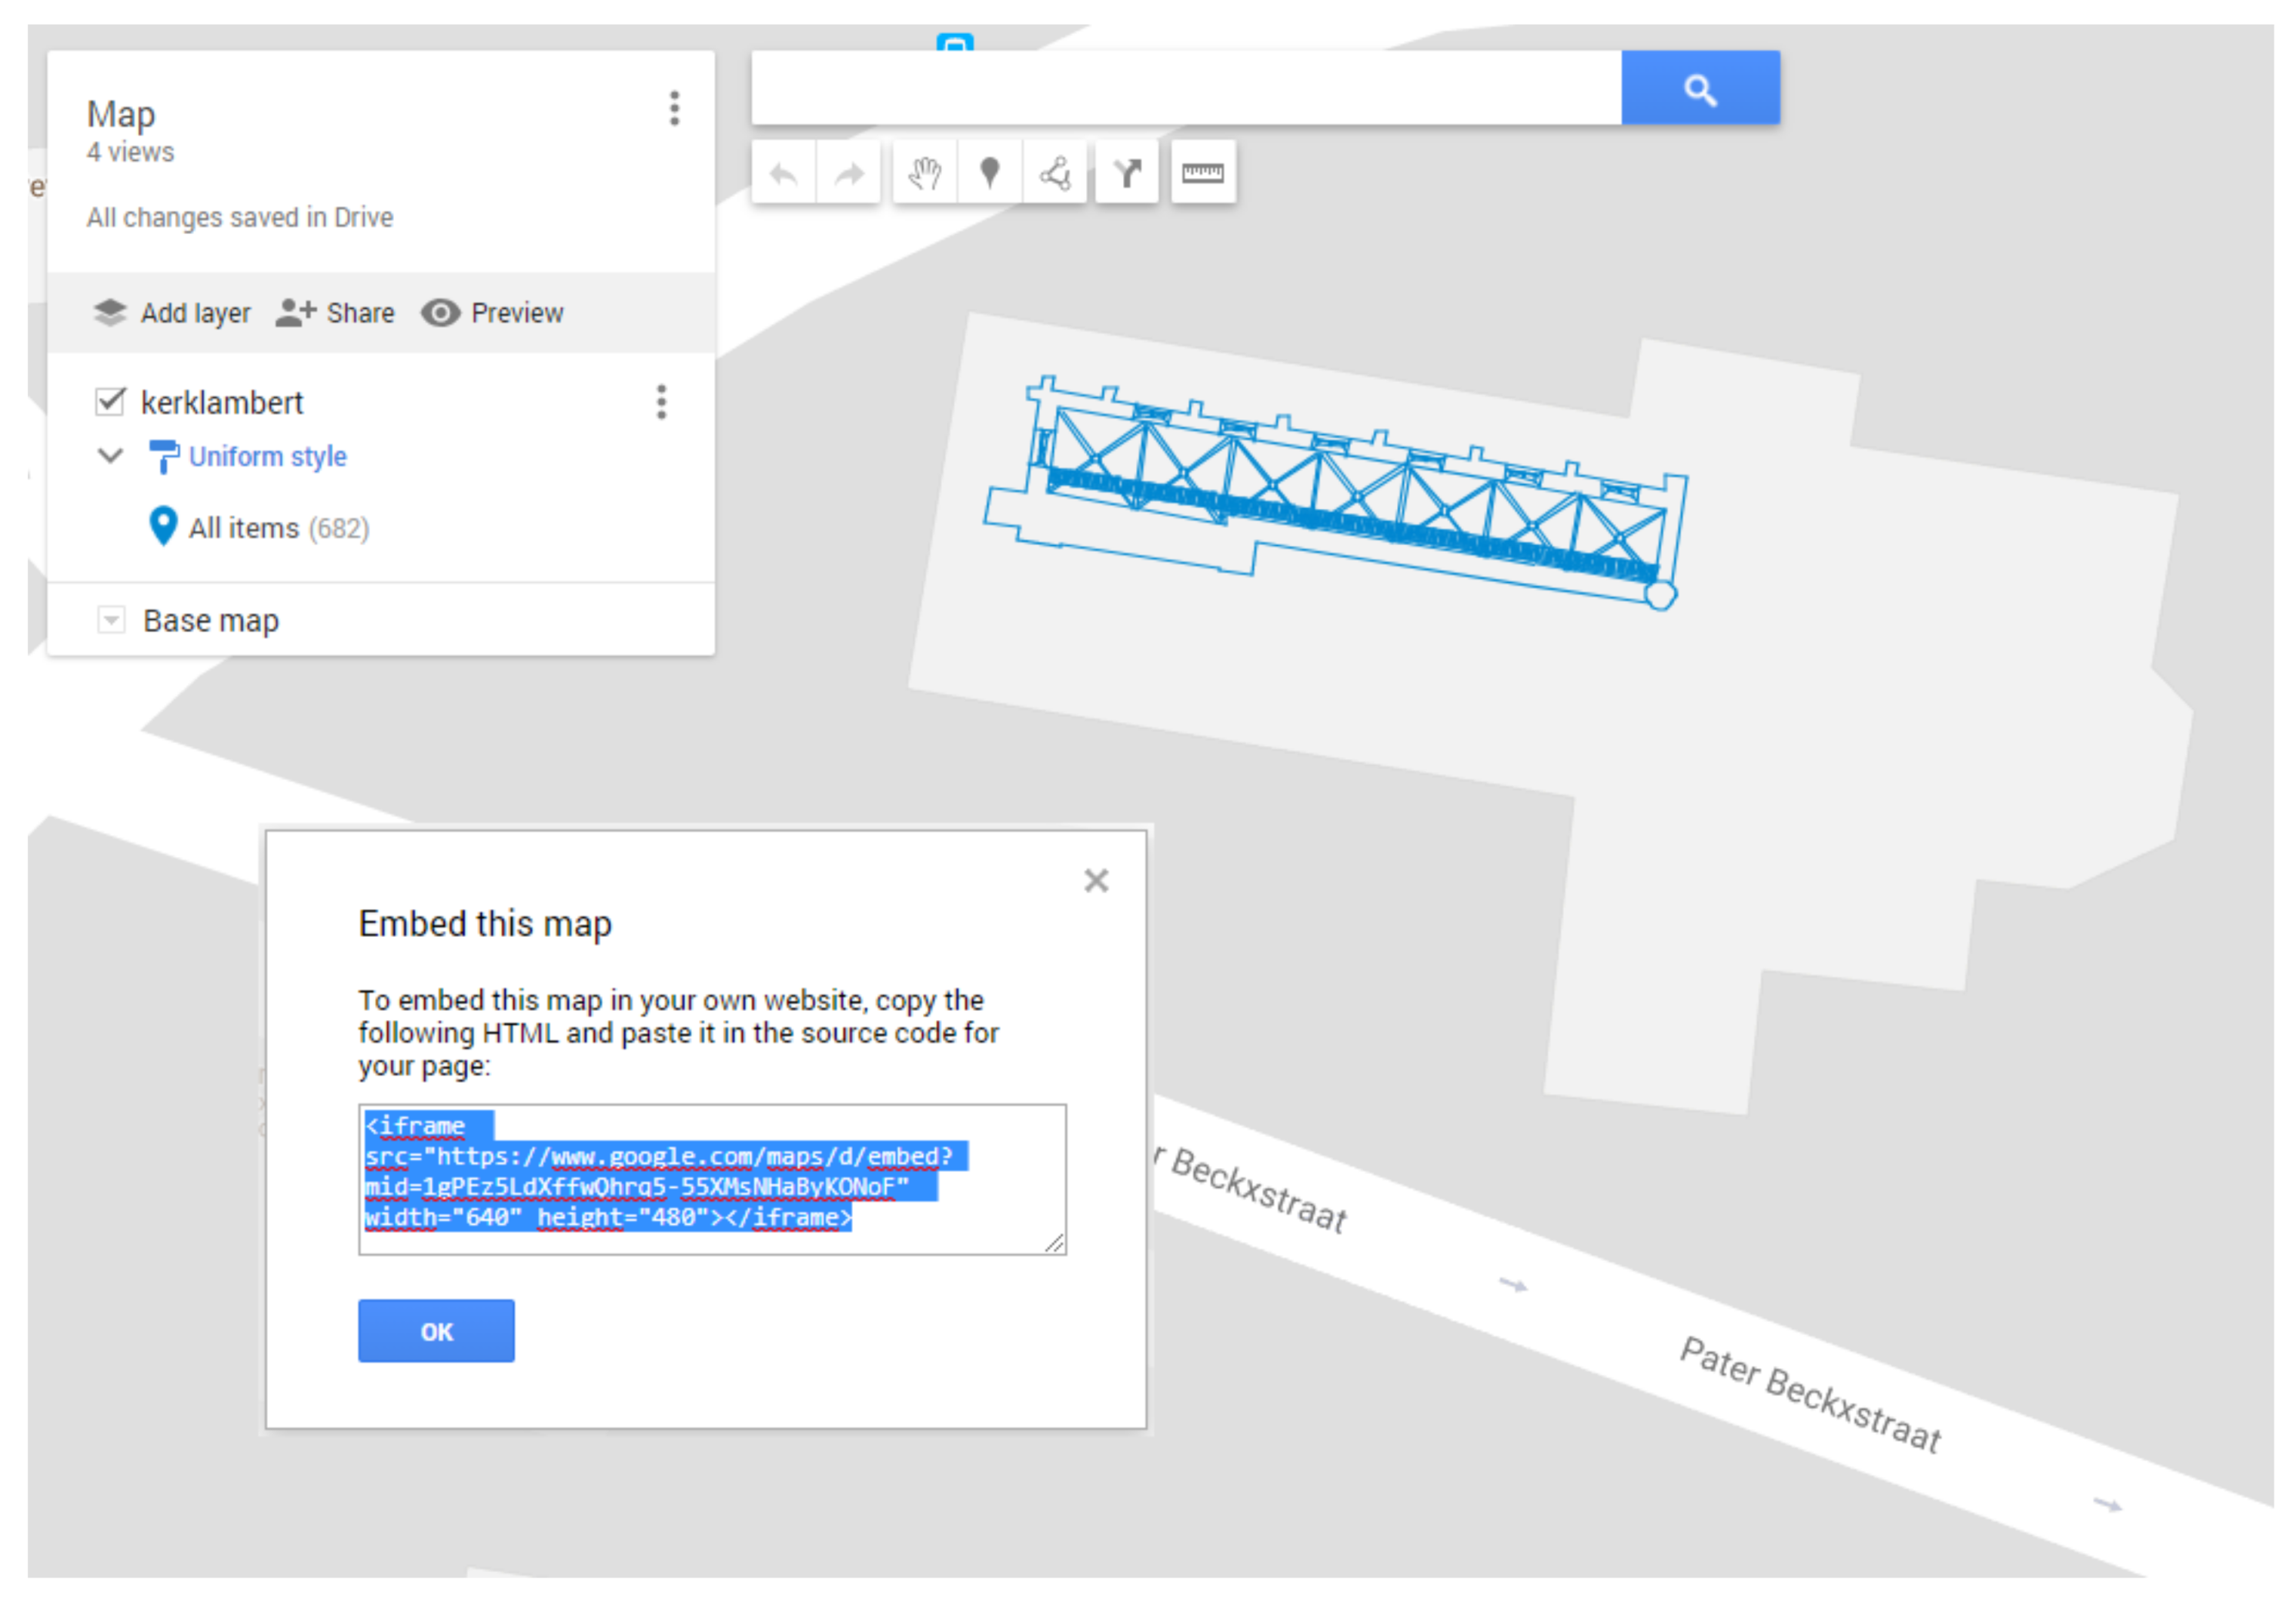
3. Panoramic Viewer
3.1. Test Case
3.1.1. Data Acquisition
3.1.2. Viewer
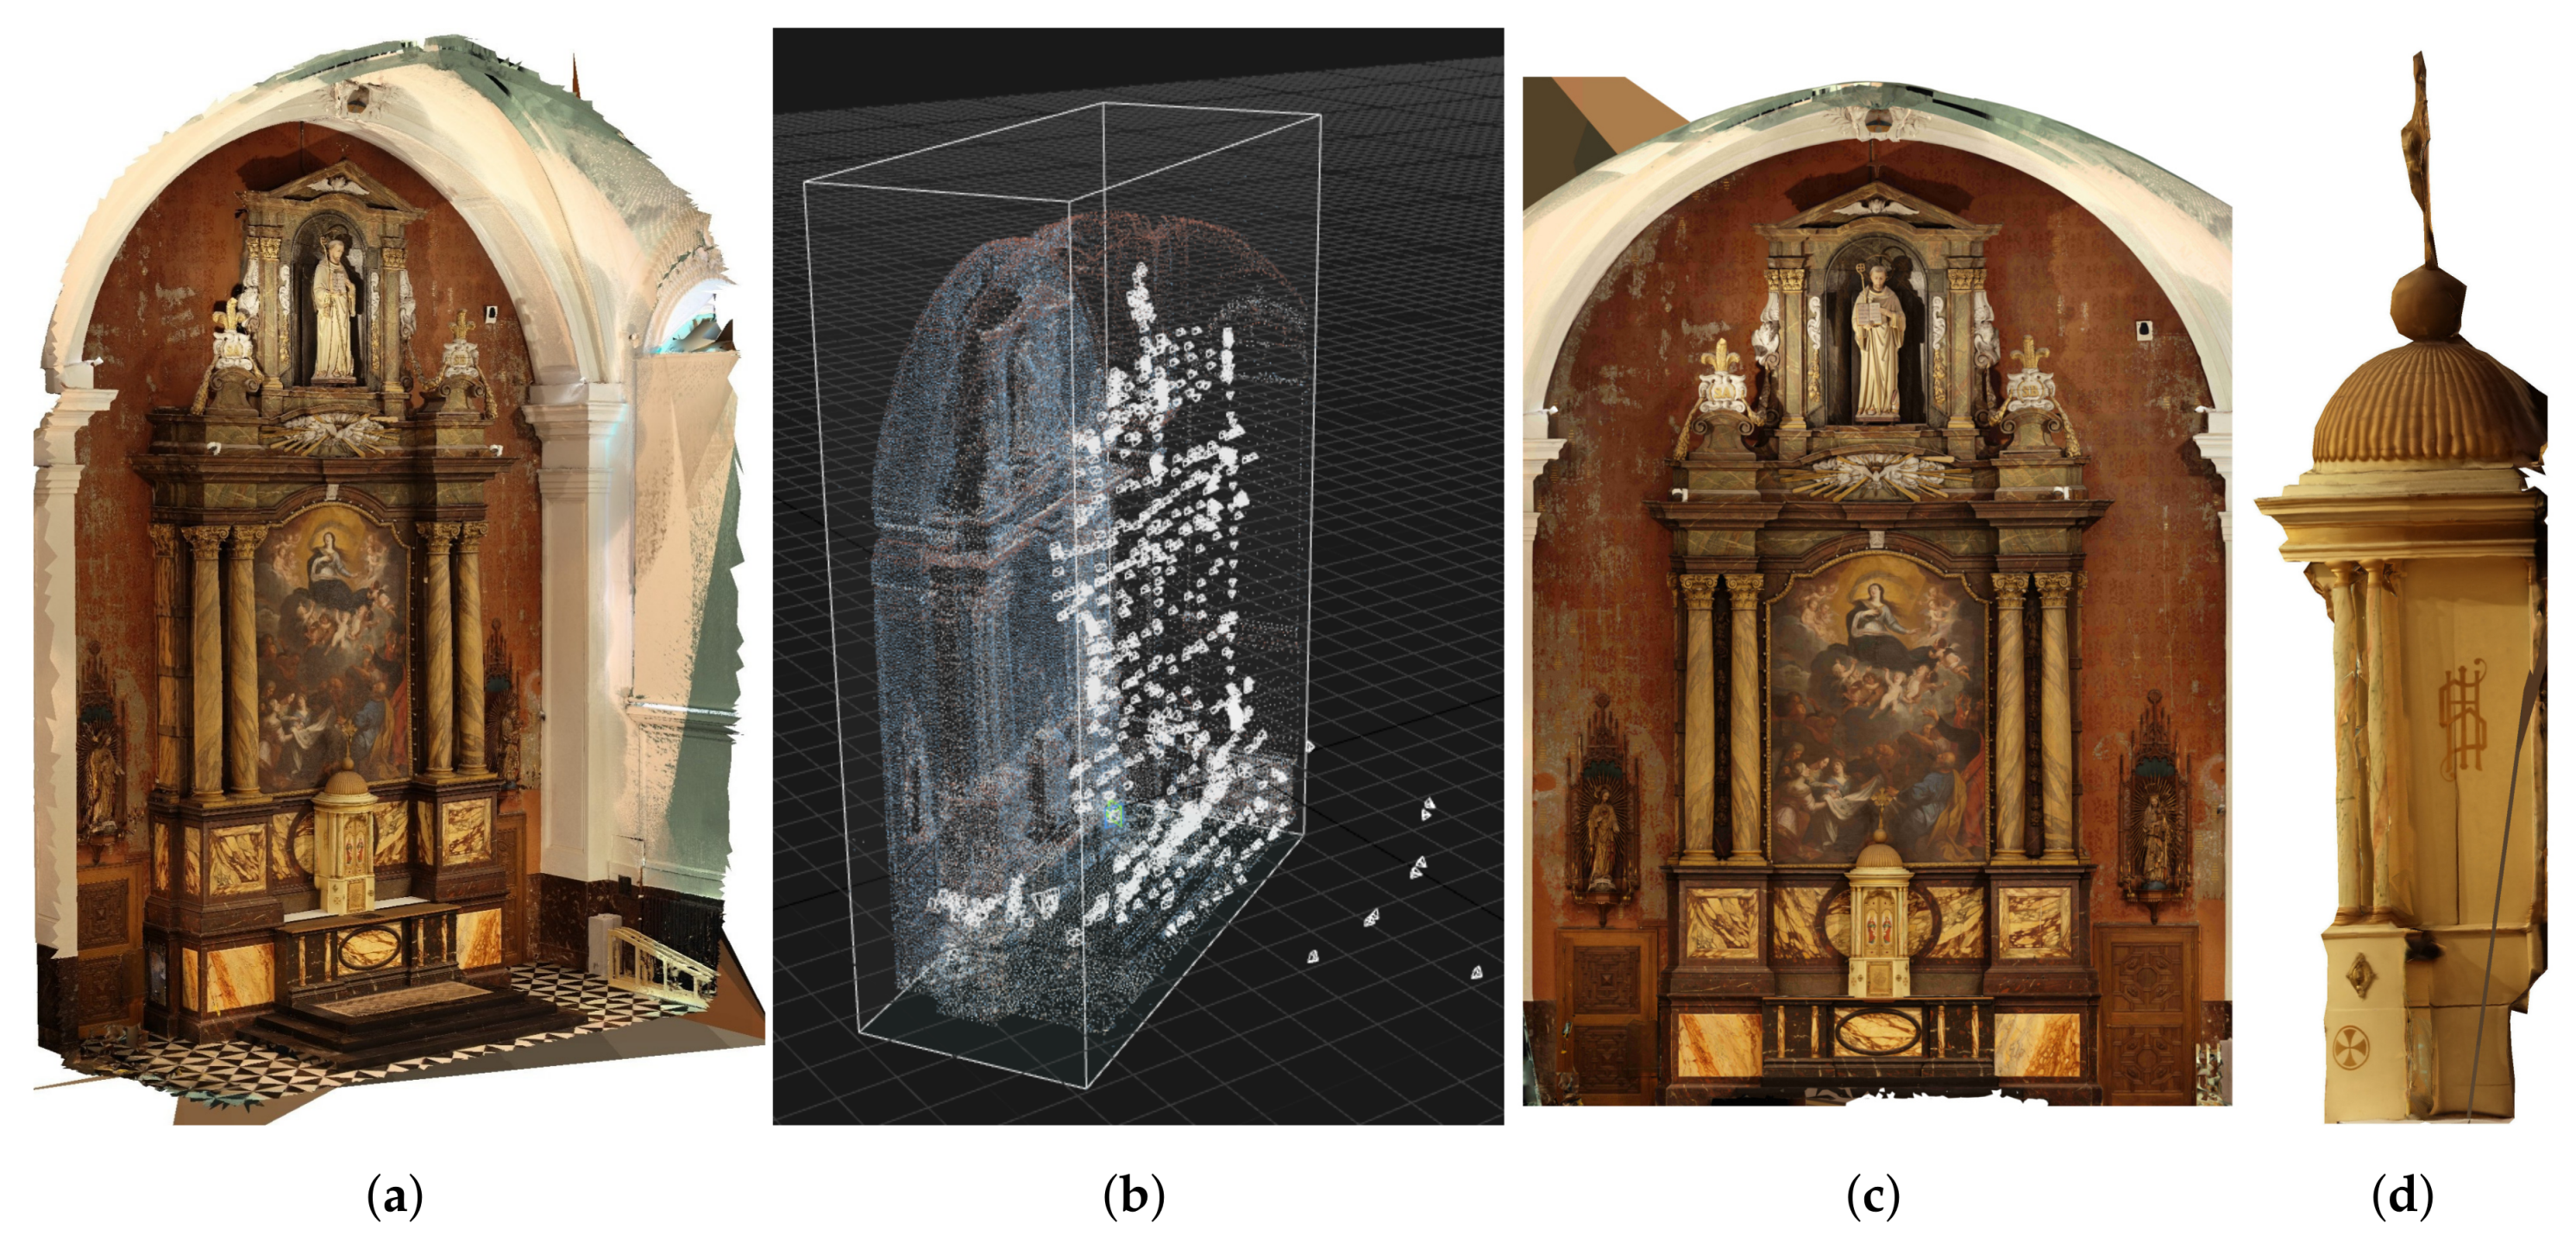
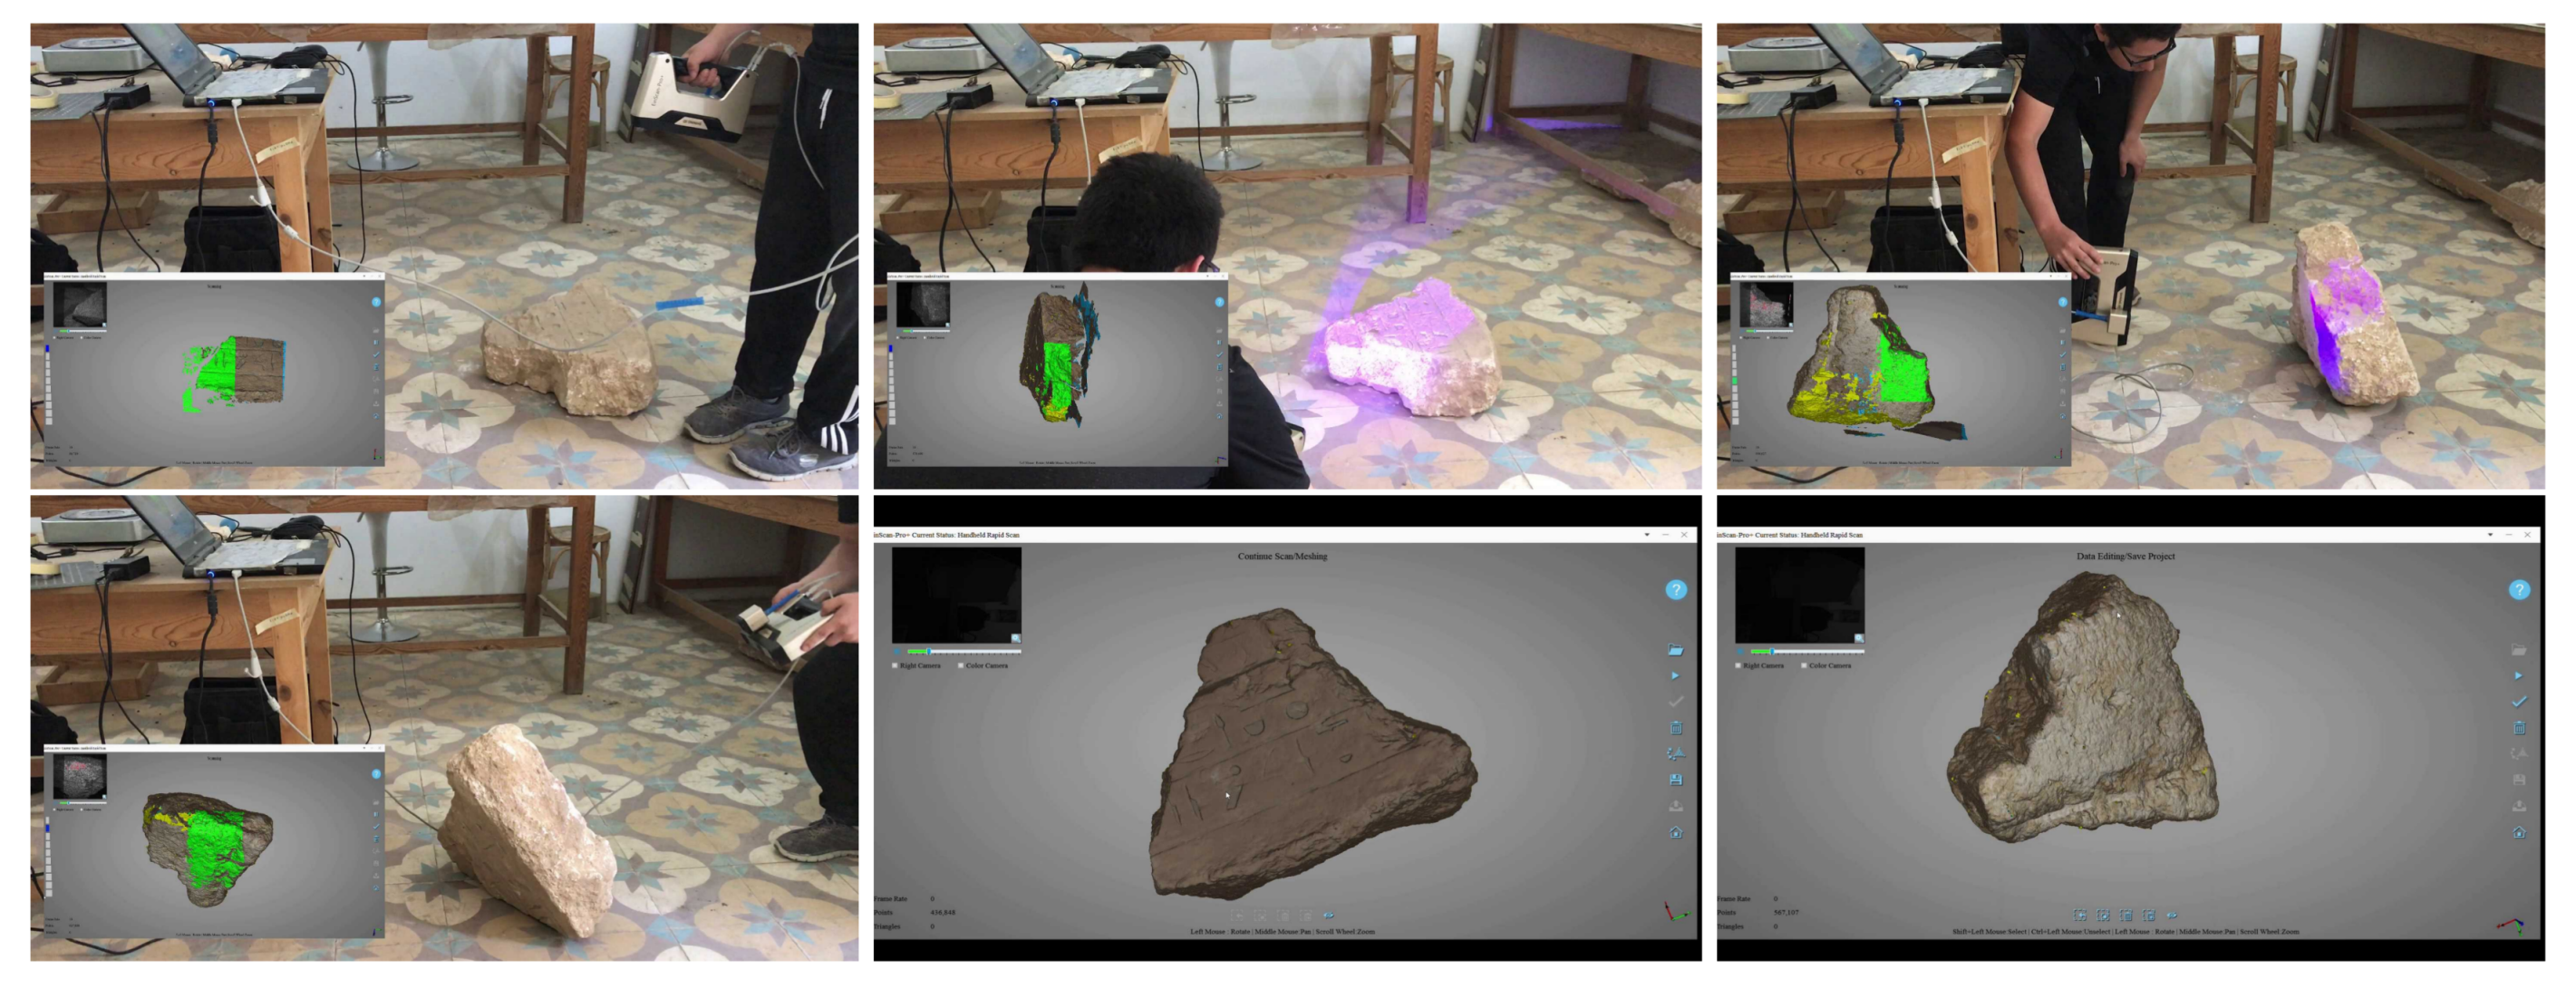
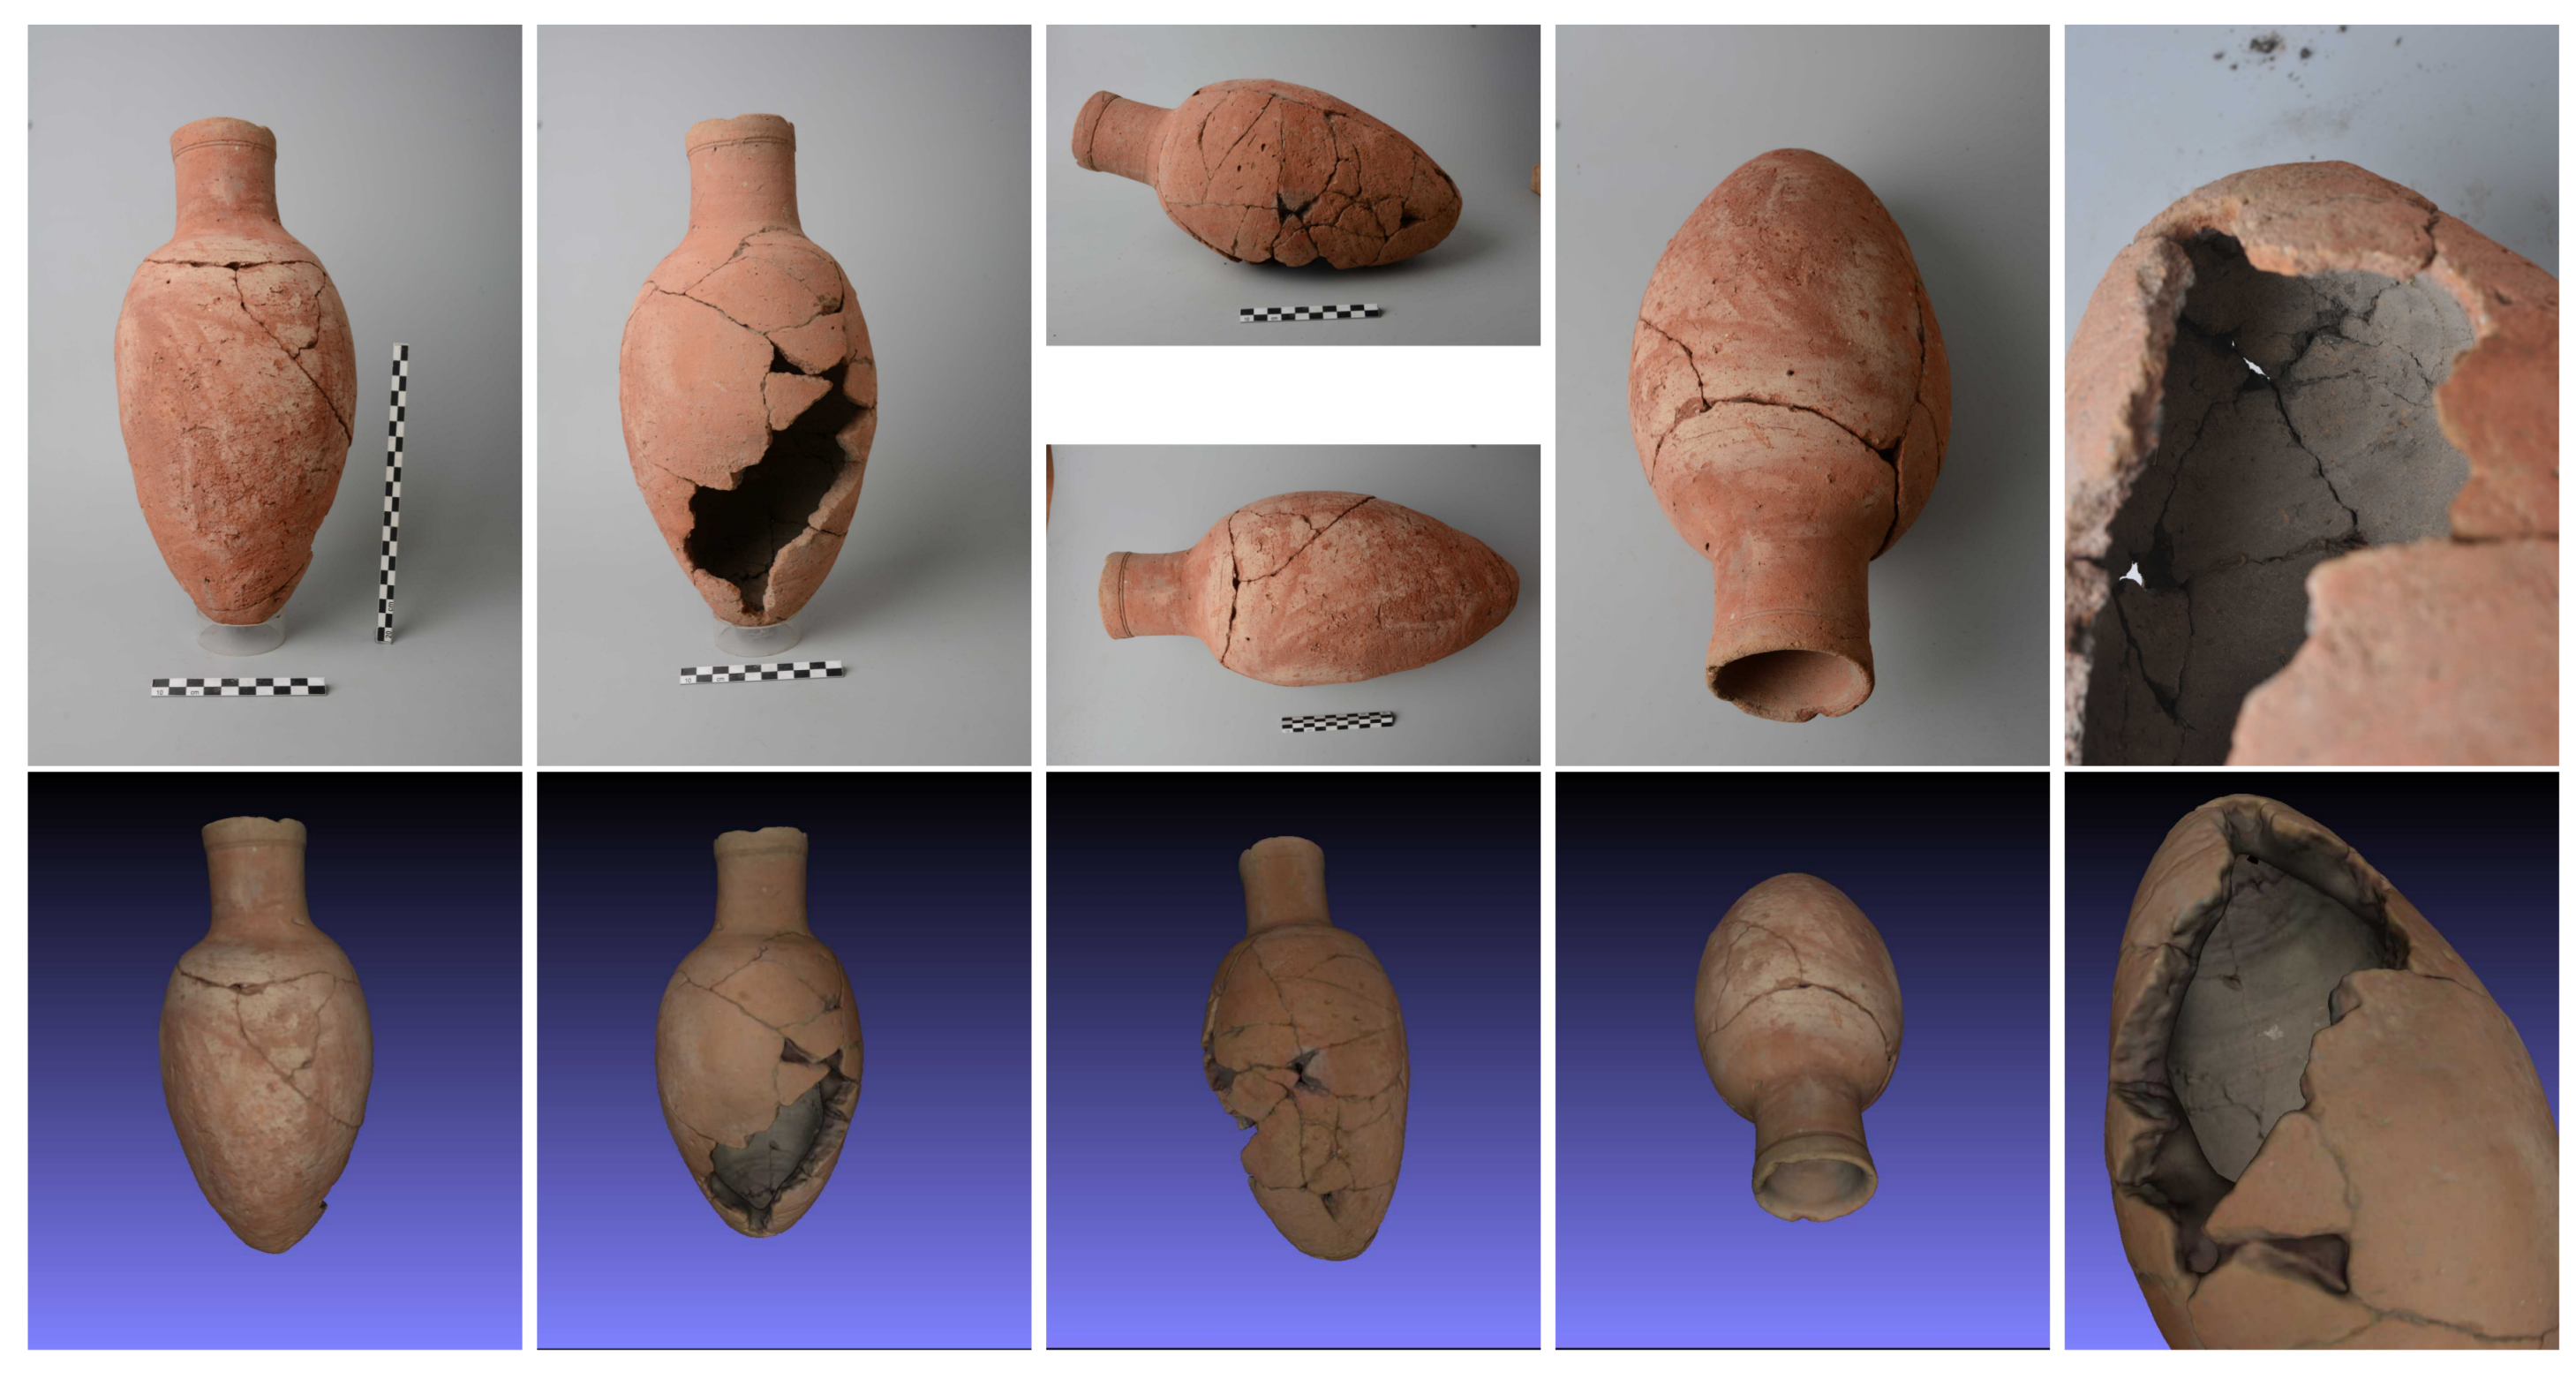
4. Meshes
Test Case
5. 3D Game Content
Test Case
6. Conclusions
Author Contributions
Funding
Conflicts of Interest
References
- ICOMOS. The ICOMOS Charter for the Interpretation and Presentation of Cultural Heritage Sites; International Council on Monuments and Sites: Paris, France, 2008; pp. 1–8. [Google Scholar]
- Bentkowska-kafel, A.; Macdonald, L. Digital Techniques for Documenting and Preserving Cultural Heritage; Collection Development, Cultural Heritage, and Digital Humanities; Arc Humanities Press: Leeds, UK, 2018; Volume 1. [Google Scholar]
- Van Genechten, B. Creating Built Heritage Orthophotographs from Laser Scans. Ph.D. Thesis, KU Leuven, Leuven, Belgium, 2009. [Google Scholar]
- Logothetis, S.; Delinasiou, A.; Stylianidis, E. Building Information Modelling for Cultural Heritage: A review. ISPRS Ann. Photogramm. Remote Sens. Spat. Inf. Sci. 2015, II-5/W3, 177–183. [Google Scholar] [CrossRef]
- Turco, M.L.; Caputo, F.; Fusaro, G. From Integrated Survey to the Parametric Modeling of Degradations. A Feasible Workflow. In Digital Heritage. Progress in Cultural Heritage: Documentation, Preservation, and Protection; Springer: Cham, Switzerland, 2016; Volume 10058, pp. 1–12. [Google Scholar]
- Arias, P.; Armesto, J.; Lorenzo, H.; Al, E. Digital photogrammetry, GPR and finite elements in heritage documentation: Geometry and Structural Damages. In Proceedings of the ISPRS Commission V Symposium Image Engineering and Vision Metrology, Dresden, Germany, 25–27 September 2006. [Google Scholar] [CrossRef]
- Koller, D.; Frischer, B.; Humphreys, G. Research challenges for digital archives of 3D cultural heritage models. J. Comput. Cult. Herit. 2009, 2, 7. [Google Scholar] [CrossRef]
- Evans, D.; Traviglia, A. Uncovering Angkor: Integrated remote sensing applications in the archaeology of early Cambodia. In Satellite Remote Sensing; Springer: Dordrecht, The Netherlands, 2012. [Google Scholar]
- Makuvaza, S. Aspects of Management Planning for Cultural World Heritage Sites: Principles, Approaches and Practices; Springer International Publishing AG: Basel, Switzerland, 2018. [Google Scholar]
- Traviglia, A.; Torsello, A. Landscape Pattern Detection in Archaeological Remote Sensing. Geosciences 2017, 7, 128. [Google Scholar] [CrossRef]
- Remondino, F.; Rizzi, A. Reality-based 3D documentation of natural and cultural heritage sites-techniques, problems, and examples. Appl. Geomatics 2010, 2, 85–100. [Google Scholar] [CrossRef]
- Haddad, N.A. From ground surveying to 3D laser scanner: A review of techniques used for spatial documentation of historic sites. J. King Saud Univ.—Eng. Sci. 2011, 23, 109–118. [Google Scholar] [CrossRef]
- Yastikli, N. Documentation of cultural heritage using digital photogrammetry and laser scanning. J. Cult. Herit. 2007, 8, 423–427. [Google Scholar] [CrossRef]
- Ntregka, A.; Georgopoulos, A.; Santana Quintero, M. Photogrammetric exploitation of HDR images for cultural heritage documentation. ISPRS Ann. Photogramm. Remote Sens. Spat. Inf. Sci. 2013, II-5/W1, 209–214. [Google Scholar] [CrossRef]
- Makantasis, K.; Doulamis, A.; Doulamis, N.D.; Ioannides, M. In the wild image retrieval and clustering for 3D cultural heritage landmarks reconstruction. Multimed. Tools Appl. 2016, 75. [Google Scholar] [CrossRef]
- Traviglia, A.; Cottica, D. Remote sensing applications and archaeological research in the Northern Lagoon of Venice: The case of the lost settlement of Constanciacus. J. Archaeol. Sci. 2011, 38, 2040–2050. [Google Scholar] [CrossRef]
- Erenoglu, R.C.; Akcay, O.; Erenoglu, O. An UAS-assisted multi-sensor approach for 3D modeling and reconstruction of cultural heritage site. J. Cult. Herit. 2017, 26, 79–90. [Google Scholar] [CrossRef]
- Guarnieri, A.; Fissore, F.; Masiero, A.; Di Donna, A.; Coppa, U.; Vettore, A. From survey to fem analysis for documentation of built heritage: The case study of villa revedin-bolasco. Int. Arch. Photogramm. Remote Sens. Spat. Inf. Sci.—ISPRS Arch. 2017, 42, 527–533. [Google Scholar] [CrossRef]
- Guarnieri, A.; Fissore, F.; Masiero, A.; Vettore, A. From Tls Survey To 3D Solid Modeling for Documentation of Built Heritage: the Case Study of Porta Savonarola in Padua. ISPRS—Int. Arch. Photogramm. Remote Sens. Spat. Inf. Sci. 2017, XLII-2/W5, 303–308. [Google Scholar] [CrossRef]
- Remondino, F. Heritage recording and 3D modeling with photogrammetry and 3D scanning. Remote Sens. 2011, 3, 1104–1138. [Google Scholar] [CrossRef] [Green Version]
- Fritsch, D.; Klein, M. 3D preservation of buildings—Reconstructing the past. Multimed. Tools Appl. 2018, 77, 9153–9170. [Google Scholar] [CrossRef]
- Hassani, F. Documentation of cultural heritage techniques, potentials and constraints. Int. Arch. Photogramm. Remote Sens. Spat. Inf. Sci.—ISPRS Arch. 2015, 40, 207–214. [Google Scholar] [CrossRef]
- Guidi, G.; Russo, M.; Angheleddu, D. 3D survey and virtual reconstruction of archeological sites. Digit. Appl. Archaeol. Cult. Herit. 2014, 1, 55–69. [Google Scholar] [CrossRef]
- Ortiz, P.; Sánchez, H.; Pires, H.; Pérez, J.A. Experiences about fusioning 3D digitalization techniques for cultural heritage documentation. In Proceedings of the ISPRS Commission V Symposium `Image Engineering and Vision Metrology’, Dresden, Germany, 25–27 September 2006; pp. 224–229. [Google Scholar]
- Yilmaz, H.M.; Yakar, M.; Gulec, S.A.; Dulgerler, O.N. Importance of digital close-range photogrammetry in documentation of cultural heritage. J. Cult. Herit. 2007, 8, 428–433. [Google Scholar] [CrossRef]
- Balsa-Barreiro, J.; Fritsch, D. Generation of visually aesthetic and detailed 3D models of historical cities by using laser scanning and digital photogrammetry. Digit. Appl. Archaeol. Cult. Herit. 2017, 8, 57–64. [Google Scholar] [CrossRef]
- Salonia, P.; Scolastico, S.; Pozzi, A.; Marcolongo, A.; Messina, T.L. Multi-Scale cultural heritage survey: Quick digital photogrammetric systems. J. Cult. Herit. 2009, 10, 59–64. [Google Scholar] [CrossRef]
- Alsadik, B.; Gerke, M.; Vosselman, G. Efficient Use of Video for 3D Modelling of Cultural Heritage Objects. ISPRS Ann. Photogramm. Remote Sens. Spat. Inf. Sci. 2015, II-3/W4, 1–8. [Google Scholar] [CrossRef]
- Teza, G.; Pesci, A.; Ninfo, A. Morphological Analysis for Architectural Applications: Comparison between Laser Scanning and Photogrammetry, Structure-from-motion. J. Surv. Eng. 2016, 142, 04016004. [Google Scholar] [CrossRef]
- Galizia, M.; Inzerillo, L.; Santagati, C. Heritage and Technology: Novel Approaches to 3D Documentation and Communication of Architectural Heritage. In Proceedings of the heritage and technology Mind Knowledge Experience, Aversa, Italy, 11–13 June 2015. [Google Scholar]
- Hess, M.; Petrovic, V.; Meyer, D.; Rissolo, D.; Kuester, F. Fusion of multimodal three-dimensional data for comprehensive digital documentation of cultural heritage sites. In Proceedings of the 2015 Digital Heritage International Congress, Granada, Spain, 28 September–2 October 2015; pp. 595–602. [Google Scholar]
- Pepe, M.; Parente, C. Cultural heritage documentation in sis environment: An application for “porta sirena” in the archaeological site of paestum. Int. Archi. Photogramm. Remote Sens. Spat. Inf. Sci.—ISPRS Arch. 2017, 42, 427–432. [Google Scholar] [CrossRef]
- Liang, H.; Li, W.; Lai, S.; Zhu, L.; Jiang, W.; Zhang, Q. The integration of terrestrial laser scanning and terrestrial and unmanned aerial vehicle digital photogrammetry for the documentation of Chinese classical gardens—A case study of Huanxiu Shanzhuang, Suzhou, China. J. Cult. Herit. 2018. [Google Scholar] [CrossRef]
- Pritchard, D.; Sperner, J.; Hoepner, S.; Tenschert, R. Terrestrial laser scanning for heritage conservation: The Cologne Cathedral documentation project. ISPRS Ann. Photogramm. Remote Sens. Spat. Inf. Sci. 2017, 4, 213–220. [Google Scholar] [CrossRef]
- Hanan, H.; Suwardhi, D.; Nurhasanah, T.; Bukit, E.S. Batak Toba Cultural Heritage and Close-range Photogrammetry. Procedia—Soc. Behav. Sci. 2015, 184, 187–195. [Google Scholar] [CrossRef]
- Núñez Andrés, A.; Buill Pozuelo, F.; Regot Marimón, J.; de Mesa Gisbert, A. Generation of virtual models of cultural heritage. J. Cult. Herit. 2012, 13, 103–106. [Google Scholar] [CrossRef]
- Armesto, J.; Ordonez, C.; Alejano, L.; Arias, P. Terrestrial laser scanning used to determine the geometry of a granite boulder for stability analysis purposes. Geomorphology 2009, 106, 271–277. [Google Scholar] [CrossRef]
- Branco, J.; Varum, H. Behaviour of Traditional Portuguese Timber Roof Structures; Oregon State University: Corvallis, OR, USA, 2006. [Google Scholar]
- Koehl, M.; Viale, A.; Reeb, S. a Historical Timber Frame Model for Diagnosis and Documentation Before Building Restoration. ISPRS Ann. Photogramm. Remote Sens. Spat. Inf. Sci. 2013, II, 27–29. [Google Scholar]
- Riveiro, B.; Morer, P.; Arias, P.; de Arteaga, I. Terrestrial laser scanning and limit analysis of masonry arch bridges. Constr. Build. Mater. 2011, 25, 1726–1735. [Google Scholar] [CrossRef]
- Bassier, M.; Hadjidemetriou, G.; Vergauwen, M.; Van Roy, N.; Verstrynge, E. Implementation of Scan-to-BIM and FEM for the Documentation and Analysis of Heritage Timber Roof Structures. In Digital Heritage. Progress in Cultural Heritage: Documentation, Preservation, and Protection; Springer: Cham, Switzerland, 2016; Volume 10058, pp. 1–12. [Google Scholar]
- Armesto, J.; Arias, P.; Roca, J.; Lorenzo, H. Monitoring and Assessing Structural Damage in Historic Buildings. Photogramm. Rec. 2008, 23, 36–50. [Google Scholar] [CrossRef] [Green Version]
- Barazzetti, L.; Banfi, F.; Brumana, R.; Gusmeroli, G.; Previtali, M.; Schiantarelli, G. Cloud-to-BIM-to-FEM: Structural simulation with accurate historic BIM from laser scans. Simul. Model. Pract. Theory 2015, 57, 71–87. [Google Scholar] [CrossRef]
- Barazzetti, L.; Banfi, F.; Brumana, R.; Previtali, M.; Roncoroni, F. Integrated Modeling and Monitoring of the Medieval Bridge Azzone Visconti. In Proceedings of the 8th European Workshop on Structural Health Monitoring (EWSHM 2016), Bilbao, Spain, 5–8 July 2016; pp. 5–8. [Google Scholar]
- Brumana, R.; Georgopoulos, A.; Brumana, R.; Georgopoulos, A.; Oreni, D.; Raimondi, A. HBIM for Documentation , Dissemination and Management of Built Heritage. The Case Study of St. Maria in Scaria d’Intelvi. Int. J. Herit. Digit. Era 2013, 2. [Google Scholar] [CrossRef]
- Murphy, M.; McGovern, E.; Pavia, S. Historic Building Information Modelling - Adding intelligence to laser and image based surveys of European classical architecture. ISPRS J. Photogramm. Remote Sens. 2013, 76, 89–102. [Google Scholar] [CrossRef]
- Dore, C.; Murphy, M. Semi-Automatic Modelling of Building Facades with Shape Grammars Using Historic Building Information Modelling. In Proceedings of the International Archives of the Photogrammetry, Remote Sensing and Spatial Information Sciences—3D Virtual Reconstruction and Visualization of Complex Architectures, Trento, Italy, 25–26 February 2013; Volume XL. [Google Scholar]
- Brusaporci, S.; Maiezza, P.; Tata, A. A framework for architectural heritage hbim semantization and development. Int. Arch. Photogramm. Remote Sens. Spat. Inf. Sci.—ISPRS Arch. 2018, 42, 179–184. [Google Scholar] [CrossRef]
- Laing, R.; Leon, M.; Isaacs, J.; Georgiev, D. Scan to BIM: the development of a clear workflow for the incorporation of point clouds within a BIM environment. WIT Trans. Built Environ. 2015, 149, 279–289. [Google Scholar] [CrossRef]
- Oreni, D.; Brumana, R.; Georgopoulos, A.; Cuca, B. Hbim for Conservation and Management of Built Heritage: Towards a Library of Vaults and Wooden Bean Floors. ISPRS Ann. Photogramm. Remote Sens. Spat. Inf. Sci. 2013, II-5/W1, 215–221. [Google Scholar] [CrossRef]
- Oreni, D.; Brumana, R.; Della Torre, S.; Banfi, F.; Barazzetti, L.; Previtali, M. Survey turned into HBIM: the restoration and the work involved concerning the Basilica di Collemaggio after the earthquake (L’Aquila). IISPRS Ann. Photogramm. Remote Sens. Spat. Inf. Sci. 2014, II-5, 267–273. [Google Scholar] [CrossRef]
- McCarthy, J. Multi-image photogrammetry as a practical tool for cultural heritage survey and community engagement. J. Archaeol. Sci. 2014, 43, 175–185. [Google Scholar] [CrossRef]
- Verhoeven, G.; Doneus, M.; Briese, C.; Vermeulen, F. Mapping by matching: A computer vision-based approach to fast and accurate georeferencing of archaeological aerial photographs. J. Archaeol. Sci. 2012, 39, 2060–2070. [Google Scholar] [CrossRef]
- Chiabrando, F.; Donadio, E.; Rinaudo, F. SfM for orthophoto generation: Awinning approach for cultural heritage knowledge. Int. Arch. Photogramm. Remote Sens. Spat. Inf. Sci.—ISPRS Arch. 2015, 40, 91–98. [Google Scholar] [CrossRef]
- Lowe, D.G. Object recognition from local scale-invariant features. In Proceedings of the Seventh IEEE International Conference on Computer Vision, Corfu, Greece, 20–25 September 1999; Volume 2, pp. 1150–1157. [Google Scholar]
- Bay, H.; Ess, A.; Tuytelaars, T.; Gool, L.V.; Van Gool, L. Speeded-Up Robust Features (SURF). Comput. Vis. Image Understand. 2008, 110, 346–359. [Google Scholar] [CrossRef] [Green Version]
- Habib, A.F.; Kim, E.M.; Kim, C.J.C. New Methodologies for True Orthophoto Generation. Photogramm. Eng. Remote Sens. 2007, 73, 25–36. [Google Scholar] [CrossRef] [Green Version]
- Kato, A.; Moskal, L.M.; Schiess, P.; Calhoun, D.; Swanson, M.E. True Orthophoto Creation Through Fusion of Lidar Derived Digital Surface Model and Aerial Photos. Symp. A Q. J. Mod. Foreign Lit. 2010, XXXVIII, 88–93. [Google Scholar]
- Krzystek, P. Fully Automatic Measurement of Digital Elevation Models with MATCH-T. Schriftenreihe des Institut für Photogrammetrie der Universität Stuttgart, 1991; Volume 15, pp. 165–182. Available online: https://www.researchgate.net/publication/239065724_Fully_Automatic_Measurement_of_Digital_Elevation_Models_with_MATCH-T (accessed on 8 August 2018).
- Verhoeven, G.; Taelman, D.; Vermeulen, F. Computer Vision-Based Orthophoto Mapping Of Complex Archaeological Sites: The Ancient Quarry Of Pitaranha (Portugal-Spain). Archaeometry 2012, 54, 1114–1129. [Google Scholar] [CrossRef]
- Cowley, D.; Ferguson, L. Historic aerial photographs for archaeology and heritage management. In Space, Time, Place, Proceedings of the Third International Conference on Remote Sensing in Archaeology, Tiruchirappalli, Tamil Nadu, India, 17–21 August 2009; BAR Publishing: Oxford, UK, 2010; pp. 97–104. [Google Scholar]
- Cowley, D.; Moriarty, C.; Geddes, G.; Brown, G.; Wade, T.; Nichol, C. UAVs in Context: Archaeological Airborne Recording in a National Body of Survey and Record. Drones 2017, 2, 2. [Google Scholar] [CrossRef]
- Colomina, I.; Molina, P. Unmanned aerial systems for photogrammetry and remote sensing: A review. ISPRS J. Photogramm. Remote Sens. 2014, 92, 79–97. [Google Scholar] [CrossRef]
- Yastikli, N.; Özerdem, O.Z. Architectural heritage documentation by using low cost uav with fisheye lens: Otag-I Jumayun in Istanbul as a case study. ISPRS Ann. Photogramm. Remote Sens. Spat. Inf. Sci. 2017, 4, 415–418. [Google Scholar] [CrossRef]
- Themistokleous, K.; Agapiou, A.; Cuca, B.; Hadjimitsis, D.G. 3D documentation of Fabrica Hills caverns using TERRESTRIAL and low cost UAV equiptment. EuroMed 2014, 1, 59–69. [Google Scholar]
- De Reu, J.; De Smedt, P.; Herremans, D.; Van Meirvenne, M.; Laloo, P.; De Clercq, W. On introducing an image-based 3D reconstruction method in archaeological excavation practice. J. Archaeol. Sci. 2014, 41, 251–262. [Google Scholar] [CrossRef]
- Markiewicz, J.S.; Podlasiak, P.; Zawieska, D. Attempts to automate the process of generation of orthoimages of objects of cultural heritage. Int. Arch. Photogramm. Remote Sens. Spat. Inf. Sci.—ISPRS Arch. 2015, 40, 393–400. [Google Scholar] [CrossRef]
- Jalandoni, A.; Domingo, I.; Taçon, P.S. Testing the value of low-cost Structure-from-Motion (SfM) photogrammetry for metric and visual analysis of rock art. J. Archaeol. Sci. Rep. 2018, 17, 605–616. [Google Scholar] [CrossRef]
- Monna, F.; Esin, Y.; Jerome, M.; Ludovic, G.; Navarro, N.; Jozef, W.; Saligny, L.; Couette, S.; Dumontet, A.; Chateau, C. Documenting carved stones by 3D modelling—Example of Mongolian deer stones. J. Cult. Herit. 2018, 1–11. [Google Scholar] [CrossRef]
- Oliveira, A.; Oliveira, J.F.; Pereira, J.M.; de Araújo, B.R.; Boavida, J. 3D modelling of laser scanned and photogrammetric data for digital documentation: The Mosteiro da Batalha case study. J. Real-Time Image Process. 2012, 9, 673–688. [Google Scholar] [CrossRef]
- Koska, B.; Kremen, T. The Combination of Laser Scanning and Structure from Motion Technology for Creation of Accurate Exterior and Interior Orthophotos of St. Nicholas Baroque Chrich. Int. Arch. Photogramm. Remote Sens. Spat. Inf. Sci. 2013, XL, 25–26. [Google Scholar] [CrossRef]
- Gonzalez-Aguilera, D.; Muñoz, A.L.; Lahoz, J.G.; Herrero, J.S.; Corchón, M.S.; García, E. Recording and modeling paleolithic caves through laser scanning. In Proceedings of the International Conference on Advanced Geographic Information Systems and Web Services (GEOWS 2009), Cancun, Mexico, 1–7 February 2009; pp. 19–26. [Google Scholar]
- Galatsanos, N.P.; Chin, R.T. Digital Imaging for Cultural Heritage Preservation. IEEE Trans. Acoust. Speech Signal Process. 1989, 37, 415–421. [Google Scholar] [CrossRef]
- Yokoi, K. Application of Virtual Reality (Vr) Panorama for Townscape Monitoring in the World. Master’s Thesis, Department of International Development Engineering, Graduate School of Engineering, Tokyo Institute of Technology, Tokyo, Japan, 2013; pp. 4–5. [Google Scholar]
- Abbey, S.G.; Theatre, R.; Pisa, C.; Zeppa, F.; Fangi, G. Spherical Photogrammetry for Cultural Heritage. In Proceedings of the Second Workshop on EHeritage and Digital Art Preservation, Firenze, Italy, 25–29 October 2010; pp. 3–6. [Google Scholar]
- Bourke, P. Novel imaging of heritage objects and sites. In Proceedings of the 2014 International Conference on Virtual Systems and Multimedia (VSMM 2014), Hong Kong, China, 9–12 December 2014; pp. 25–30. [Google Scholar]
- Grussenmeyer, P.; Landes, T.; Alby, E.; Carozza, L. High Resolution 3D Recording and Modelling of the Bronze Age Cave “Les Fraux” in Perigord (France). Int. Arch. Photogramm. Remote Sens. Spat. Inf. Sci. 2010, 38, 262–267. [Google Scholar]
- Jusof, M.J.; Rahim, H.R.A. Revealing visual details via high dynamic range gigapixels spherical panorama photography: The Tempurung Cave natural heritage site. In Proceedings of the 2014 International Conference on Virtual Systems and Multimedia (VSMM 2014), Hong Kong, China, 9–12 December 2014; pp. 193–200. [Google Scholar]
- Roussou. New Heritage: New Media and Cultural Heritage; Technical Report; Routledge: London, UK; New York, NY, USA, 2008. [Google Scholar]
- Fan, J.; Fan, Y.; Pei, J. HDR spherical panoramic image technology and its applications in ancient building heritage protection. In Proceedings of the 2009 IEEE 10th International Conference on Computer-Aided Industrial Design and Conceptual Design: E-Business, Creative Design, Manufacturing—CAID and CD’2009, Wenzhou, China, 26–29 November 2009; pp. 1549–1553. [Google Scholar]
- Mazzoleni, P.; Valtolina, S.; Franzoni, S.; Mussio, P.; Bertino, E. Towards a contextualized access to the cultural heritage world using 360 panoramic images. In Proceedings of the 18th International Conference on Software Engineering and Knowledge Engineering (SEKE 2006), San Francisco, CA, USA, 5–7 July 2006; ISBN 1600591965. [Google Scholar]
- McCollough, F. Complete Guide to High Dynamic Range Digital Photography; Number Dec, Scitech Book News; Pixiq: New York, NY, USA, 2008; p. 400. [Google Scholar]
- Vincent, M.L.; DeFanti, T.; Schulze, J.; Kuester, F.; Levy, T. Stereo panorama photography in archaeology: Bringing the past into the present through CAVEcams and immersive virtual environments. In Proceedings of the 2013 Digital Heritage International Congress, Marseille, France, 28 October–1 November 2013; p. 455. [Google Scholar]
- Annibale, E.D.; Fangi, G. Interactive Modelling By Projection of Oriented. In Proceedings of the ISPRS International Workshop on 3D Virtual Reconstruction and Visualization of Comprex Architectures (3D-Arch’2009), Trento, Italy, 25–28 February 2009. [Google Scholar]
- D’Annibale, E. New VR system for navigation and documentation of Cultural Heritage. CIPA Workshop Petra 2010, 1985, 4–8. [Google Scholar]
- Woolner, M.; Kwiatek, K. Embedding Interactive Storytelling Within Still and Video Panoramas for Cultural Heritage Sites. In Proceedings of the 15th International Conference on Virtual Systems and Multimedia (VSMM’09), Vienna, Austria, 9–12 September 2009. [Google Scholar]
- Kwiatek, K.; Woolner, M. Transporting the viewer into a 360? heritage story: Panoramic interactive narrative presented on a wrap-around screen. In Proceedings of the 2010 16th International Conference on Virtual Systems and Multimedia (VSMM 2010), Seoul, Korea, 20–23 October 2010; pp. 234–241. [Google Scholar]
- Tseng, Y.K.; Chen, H.K.; Hsu, P.Y. The Use of Digital Images Recording Historical Sites and ‘Spirit of Place’: A Case Study of Xuejia Tzu-chi Temple. Int. J. Hum. Arts Comput. 2013, 7, 156–171. [Google Scholar] [CrossRef]
- Di Benedetto, M.; Ganovelli, F.; Balsa Rodriguez, M.; Jaspe Villanueva, A.; Scopigno, R.; Gobbetti, E. ExploreMaps: Efficient construction and ubiquitous exploration of panoramic view graphs of complex 3D environments. Comput. Gr. Forum 2014, 33, 459–468. [Google Scholar] [CrossRef]
- Martínez-Graña, A.M.; Goy, J.L.; Cimarra, C.A. A virtual tour of geological heritage: Valourising geodiversity using Google earth and QR code. Comput. Geosci. 2013, 61, 83–93. [Google Scholar] [CrossRef]
- Maicas, J.; Blasco, V. EDETA 360°: VIRTUAL TOUR FOR VISITING THE HERITAGE OF LLÍRIA (SPAIN). In Proceedings of the 8th International Congress on Archaeology, Computer Graphics, Cultural Heritage and Innovation, Valencia, Spain, 5–7 September 2016; pp. 376–378. [Google Scholar]
- González-Delgado, J.A.; Martínez-Graña, A.M.; Civis, J.; Sierro, F.J.; Goy, J.L.; Dabrio, C.J.; Ruiz, F.; González-Regalado, M.L.; Abad, M. Virtual 3D tour of the Neogene palaeontological heritage of Huelva (Guadalquivir Basin, Spain). Environ. Earth Sci. 2014, 73, 4609–4618. [Google Scholar] [CrossRef]
- Lozar, F.; Clari, P.; Dela Pierre, F.; Natalicchio, M.; Bernardi, E.; Violanti, D.; Costa, E.; Giardino, M. Virtual tour of past environmental and climate change: The Messinian succession of the Tertiary Piedmont Basin (Italy). Geoheritage 2015, 7, 47–56. [Google Scholar] [CrossRef]
- Nabil, M.; Said, A. Time-Lapse Panoramas for the Egyptian Heritage. In Proceedings of the 18th International Conference on Cultural Heritage and New Technologies 2013 (CHNT 18, 2013), Vienna, Austria, 12–15 November 2013; pp. 1–8. [Google Scholar]
- Beraldin, J.-A.; Picard, M.; El-Hakim, S.; Godin, G.; Borgeat, L.; Blais, F.; Paquet, E.; Rioux, M.; Valzano, V.; Bandiera, A. Virtual Reconstruction of Heritage Sites: Opportunities and Challenges Created by 3D Technologies. In Proceedings of the InternationalWorkshop on Recording, Modeling and Visualization of Cultural Heritage, Ascona, Switzerland, 22–27 May 2005. [Google Scholar]
- Hua, L.; Chen, C.; Fang, H.; Wang, X. 3D documentation on Chinese Hakka Tulou and Internet-based virtual experience for cultural tourism: A case study of Yongding County, Fujian. J. Cult. Herit. 2018, 29, 173–179. [Google Scholar] [CrossRef]
- Bonacinia, E. A pilot project aerial street view tour at the valley of the temples (Agrigento). In Proceedings of the 8th International Congress on Archaeology, Computer Graphics, Cultural Heritage and Innovation, Valencia, Spain, 5–7 September 2016; pp. 430–432. [Google Scholar]
- Dhonju, H.K.; Xiao, W.; Shakya, B.; Mills, J.P.; Sarhosis, V. Documentation of Heritage Structures Through Geo- Crowdsourcing and Web-Mapping. Int. Arch. Photogramm. Remote Sens. Spat. Inf. Sci. 2017, XLII, 18–22. [Google Scholar] [CrossRef]
- Google Developers. Google API. 2018. Available online: https://cloud.google.com/maps-platform/?hl=de (accessed on 8 August 2018).
- Pintus, R.; Pal, K.; Yang, Y.; Weyrich, T.; Gobbetti, E.; Rushmeier, H. A Survey of Geometric Analysis in Cultural Heritage. Comput. Gr. Forum 2015, 35, 1–27. [Google Scholar] [CrossRef]
- Cadi, N.; Magnenat, N.; Se, S. Mixed Reality and Gamification for Cultural Heritage; Springer International Publishing: Cham, Switzerland, 2017; pp. 395–419. [Google Scholar]
- Aicardi, I.; Chiabrando, F.; Maria Lingua, A.; Noardo, F. Recent trends in cultural heritage 3D survey: The photogrammetric computer vision approach. J. Cult. Herit. 2018. [Google Scholar] [CrossRef]
- Guo, X.; Xiao, J.; Wang, Y. A survey on algorithms of hole filling in 3D surface reconstruction. Vis. Comput. 2018, 34, 93–103. [Google Scholar] [CrossRef]
- Ebke, H.c.; Schmidt, P.; Campen, M.; Kobbelt, L. Interactively Controlled Quad Remeshing of High Resolution 3D Models. ACM Trans. Gr. TOG 2016, 35, 218. [Google Scholar] [CrossRef]
- Abdullah, A.; Bajwa, R.; Gilani, S.R.; Agha, Z.; Boor, S.B.; Taj, M.; Khan, S.A. 3D Architectural Modeling: Efficient RANSAC for n -gonal primitive fitting. Eurogr. Assoc. 2015. [Google Scholar] [CrossRef]
- Boltcheva, D.; Lévy, B. Surface reconstruction by computing restricted Voronoi cells in parallel. CAD Comput. Aided Des. 2017, 90, 123–134. [Google Scholar] [CrossRef] [Green Version]
- Si, H. TetGen, a Delaunay-Based Quality Tetrahedral Mesh Generator. ACM Trans. Math. Softw. 2015, 41, 1–36. [Google Scholar] [CrossRef]
- Ruther, H.; Bhurtha, R.; Held, C.; Schroder, R.; Wessels, S. Laser Scanning in Heritage Documentation: The Scanning Pipeline and its Challenges. Photogramm. Eng. Remote Sens. 2012, 78, 309–316. [Google Scholar] [CrossRef]
- Rodríguez-Gonzálvez, P.; Nocerino, E.; Menna, F.; Minto, S.; Remondino, F. 3D Surveying and modeling of underground passages in wwi fortifications. Int. Arch. Photogramm. Remote Sens. Spat. Inf. Sci.—ISPRS Arch. 2015, 40, 17–24. [Google Scholar] [CrossRef]
- Neubauer, W.; Doneus, M.; Studnicka, N.; Riegl, J. Combined High Resolution Laser Scanning and Photogrammetrical Documentation of the Pyramids at Giza. In Proceedings of the XXth International Symposium CIPA, Torino, Italy, 26 September–1 October 2005; pp. 470–475. [Google Scholar]
- Der Manuelian, P. Giza 3D: Digital archaeology and scholarly access to the Giza Pyramids: The Giza Project at Harvard University. In Proceedings of the 2013 Digital Heritage International Congress, Marseille, France, 28 October–1 November 2013; Volume 2, pp. 727–734. [Google Scholar]
- Tucci, G.; Bonora, V.; Conti, A.; Fiorini, L. High-quality 3D models and their use in a cultural heritage conservation project. Int. Arch. Photogramm. Remote Sens. Spat. Inf. Sci.—ISPRS Arch. 2017, 42, 687–693. [Google Scholar] [CrossRef]
- Pierdicca, R.; Frontoni, E.; Malinverni, E.S.; Colosi, F.; Orazi, R. Virtual reconstruction of archaeological heritage using a combination of photogrammetric techniques: Huaca Arco Iris, Chan Chan, Peru. Dig. Appl. Archaeol. Cult. Herit. 2016, 3, 80–90. [Google Scholar] [CrossRef]
- Dellepiane, M.; Dell’Unto, N.; Callieri, M.; Lindgren, S.; Scopigno, R. Archeological excavation monitoring using dense stereo matching techniques. J. Cult. Herit. 2013, 14, 201–210. [Google Scholar] [CrossRef]
- Dall’Asta, E.; Bruno, N.; Bigliardi, G.; Zerbi, A.; Roncella, R. Photogrammetric techniques for promotion of archaeological heritage: The archaeological museum of parma (Italy). Int. Arch. Photogramm. Remote Sens. Spat. Inf. Sci.—ISPRS Arch. 2016, 41, 243–250. [Google Scholar] [CrossRef]
- Tariq, A.; Gillani, S.M.O.A.; Qureshi, H.K.; Haneef, I. Heritage preservation using aerial imagery from light weight low cost Unmanned Aerial Vehicle (UAV). In Proceedings of the 2017 International Conference on Communication Technologies (ComTech), Rawalpindi, Pakistan, 19–21 April 2017; pp. 201–205. [Google Scholar]
- Davis, A.; Belton, D.; Helmholz, P.; Bourke, P.; McDonald, J. Pilbara rock art: Laser scanning, photogrammetry and 3D photographic reconstruction as heritage management tools. Heri. Sci. 2017, 5, 1–16. [Google Scholar] [CrossRef]
- Grenzdörffer, G.J.; Naumann, M.; Niemeyer, F.; Frank, A. Symbiosis of UAS photogrammetry and TLS for surveying and 3D modeling of cultural heritage monuments—A case study about the cathedral of St. Nicholas in the city of Greifswald. Int. Arch. Photogramm. Remote Sens. Spat. Inf. Sci.—ISPRS Arch. 2015, 40, 91–96. [Google Scholar] [CrossRef]
- Poux, F.; Neuville, R.; Van Wersch, L.; Nys, G.A.; Billen, R. 3D Point Clouds in Archaeology: Advances in Acquisition, Processing and Knowledge Integration Applied to Quasi-Planar Objects. Geosciences 2017, 7. [Google Scholar] [CrossRef]
- Giancola, S.; Valenti, M.; Sala, R. A Survey on 3D Cameras: Metrological Comparison of Time-of-Flight, Structured-Light and Active Stereoscopy Technologies; Springer International Publishing: Cham, Switzerland, 2018; Volume F3, pp. 89–90. [Google Scholar]
- Buchón-Moragues, F.; Bravo, J.M.; Ferri, M.; Redondo, J.; Sánchez-Pérez, J.V. Application of structured light system technique for authentication of wooden panel paintings. Sensors (Switzerland) 2016, 16, 881. [Google Scholar] [CrossRef] [PubMed]
- Di Pietra, V.; Donadio, E.; Picchi, D.; Sambuelli, L.; Spanò, A. Multi-source 3D models supporting ultrasonic test to investigate an egyptian sculpture of the archaeological museum in Bologna. Int. Arch. Photogramm. Remote Sens. Spat. Inf. Sci.—ISPRS Arch. 2017, 42, 259–266. [Google Scholar] [CrossRef]
- Mathys, A.; Brecko, J.; Semal, P. Comparing 3D digitizing technologies: What are the differences? In Proceedings of the 2013 Digital Heritage International Congress, Marseille, France, 28 October–1 November 2013; Volume 1, pp. 201–204. [Google Scholar]
- Papaioannou, G.; Schreck, T.; Andreadis, A.; Mavridis, P.; Gregor, R.; Sipiran, I.; Vardis, K. From Reassembly to Object Completion. J. Comput. Cult. Herit. 2017, 10, 1–22. [Google Scholar] [CrossRef]
- De Meyer, M.; Linseele, V.; Vereecken, S.; Williams, L.J. Fowl for the governor. The tomb of governor Djehutinakht IV or V at Dayr al-Barsha reinvestigated. Part 2: Pottery, human remains, and faunal remains. J. Egypt. Archaeol. 2014, 100, 67–87. [Google Scholar] [CrossRef]
- Willems, H. The Belgian Excavations at Deir al-Barsja, season 2003. In Mitteilungen des Deutschen Archäologischen Instituts; Gebr. Mann: Berlin, Germany, 2014. [Google Scholar]
- 3D Shining. Shining 3D Einscan, 2018. Available online: https://www.einscan.com/ (accessed on 8 August 2018).
- MeshLab. MeshLab, 2014. Available online: http://www.meshlab.net/ (accessed on 8 August 2018).
- Anderson, E.F.; McLoughlin, L.; Liarokapis, F.; Peters, C.; Petridis, P.; de Freitas, S. Developing serious games for cultural heritage: A state-of-the-art Review. Virtual Reality 2010, 14, 255–275. [Google Scholar] [CrossRef]
- Dörner, R.; Göbel, S.; Effelsberg, W.; Wiemeyer, J. Serious Games—Foundations, Concepts and Practice; Springer: Cham, Switzerland, 2016; p. 421. [Google Scholar]
- Hutchison, D. Games for Training, Education, Health and Sports: 4th International Conference on Serious Games; Springer International Publishing: Cham, Switzerland, 2014; p. 200. [Google Scholar]
- Carrozzino, M.; Bergamasco, M. Beyond virtual museums: Experiencing immersive virtual reality in real museums. J. Cult.Herit. 2010, 11, 452–458. [Google Scholar] [CrossRef]
- Rua, H.; Alvito, P. Living the past: 3D models, virtual reality and game engines as tools for supporting archaeology and the reconstruction of cultural heritage—The case-study of the Roman villa of Casal de Freiria. J. Archaeol. Sci. 2011, 38, 3296–3308. [Google Scholar] [CrossRef]
- Chen, S.; Pan, Z.; Zhang, M.; Shen, H. A case study of user immersion-based systematic design for serious heritage games. Multimed. Tools Appl. 2013, 62, 633–658. [Google Scholar] [CrossRef]
- Dagnino, F.M.; Pozzi, F.; Cozzani, G.; Bernava, L. Using Serious Games for Intangible Cultural Heritage (ICH) Education: A Journey into the Canto a Tenore Singing Style. In Proceedings of the 12th International Joint Conference on Computer Vision, Imaging and Computer Graphics Theory and Applications, Porto, Portugal, 27 February–1 March 2017; pp. 429–435. [Google Scholar]
- Kontogianni, G.; Koutsaftis, C.; Skamantzari, M.; Georgopoulos, A. Utilising 3D Realistic Models in Serious Games for Cultural Heritage. Int. J. Comput. Methods Herit. Sci. (IJCMHS) 2017, 1, 21–46. [Google Scholar] [CrossRef]
- De Paolis, L.T.; Aloisio, G.; Celentano, M.G.; Oliva, L.; Vecchio, P. A simulation of life in a medieval town for edutainment and touristic promotion. In Proceedings of the 2011 International Conference on Innovations in Information Technology (IIT 2011), Abu Dhabi, UAE, 25–27 April 2011; pp. 361–366. [Google Scholar]
- Doulamis, A.; Doulamis, N.; Ioannidis, C.; Chrysouli, C.; Grammalidis, N.; Dimitropoulos, K.; Potsiou, C.; Stathopoulou, E.K.; Ioannides, M. 5D Modelling: An Efficient Approach for Creating Spatiotemporal Predictive 3D Maps of Large-Scale Cultural Resources. ISPRS Ann. Photogramm. Remote Sens. Spat. Inf. Sci. 2015, II-5/W3, 61–68. [Google Scholar] [CrossRef]
- Christodoulou, S.E.; Vamvatsikos, D.; Georgiou, C. A BIM-based framework for forecasting and visualizing seismic damage, cost and time to repair. eWork and eBusiness in Architecture, Engineering and Construction. In Proceedings of the European Conference on Product and Process Modelling 2010, Cork, Ireland, 14–16 September 2010; pp. 33–38. [Google Scholar]
- Mortara, M.; Catalano, C.E.; Bellotti, F.; Fiucci, G.; Houry-Panchetti, M.; Petridis, P. Learning cultural heritage by serious games. J. Cult. Herit. 2014, 15, 318–325. [Google Scholar] [CrossRef] [Green Version]
- Mures, O.A.; Jaspe, A.; Padrón, E.J.; Rabuñal, J.R. Virtual Reality and Point-Based Rendering in Architecture and Heritage. In Handbook of Research on Visual Computing and Emerging Geometrical Design Tools; IGI Global: Hershey, PA, USA, 2016. [Google Scholar]
- Younes, G.; Kahil, R.; Jallad, M.; Asmar, D.; Elhajj, I.; Turkiyyah, G.; Al-Harithy, H. Virtual and augmented reality for rich interaction with cultural heritage sites: A case study from the Roman Theater at Byblos. Digit. Appl. Archaeol. Cult. Herit. 2017, 5, 1–9. [Google Scholar] [CrossRef]
- Bellotti, F.; Berta, R.; De Gloria, A.; D’ursi, A.; Fiore, V. A serious game model for cultural heritage. J. Comput. Cult. Herit. 2012, 5, 1–27. [Google Scholar] [CrossRef]
- Ruppel, U.; Schatz, K.; Rüppel, U.; Schatz, K. Designing a BIM-based serious game for fire safety evacuation simulations. Adv. Eng. Inform. 2011, 25, 600–611. [Google Scholar] [CrossRef]
- Lercari, N. 3D visualization and reflexive archaeology: A virtual reconstruction of Çatalhöyük history houses. Digit. Appl. Archaeol. Cult. Herit. 2017, 6, 10–17. [Google Scholar] [CrossRef]
- Bille, R.; Smith, S.P.; Maund, K.; Brewer, G. Extending Building Information Models into Game Engines. In Proceedings of the 2014 Conference on Interactive Entertainment—IE2014, Newcastle, Australia, 2–3 December 2014; pp. 1–8. [Google Scholar]
- Barazzetti, L.; Banfi, F.; Brumana, R.; Oreni, D.; Previtali, M.; Roncoroni, F. HBIM and augmented information: Towards a wider user community of image and range-based reconstructions. Int. Arch. Photogramm. Remote Sens. Spat. Inf. Sci.—ISPRS Arch. 2015, 40. [Google Scholar] [CrossRef]
- Amirebrahimi, S.; Rajabifard, A.; Mendis, P.; Ngo, T. A framework for a microscale flood damage assessment and visualization for a building using BIM–GIS integration. Int. J. Digit. Earth 2015, 8947, 1–24. [Google Scholar] [CrossRef]
- Oreni, D.; Brumana, R.; Georgopoulos, A.; Cuca, B. HBIM Library Objects for Conservation and Management of Built Heritage. Int. J. Herit. Digit. Era 2014, 3, 321–334. [Google Scholar] [CrossRef]
- Murphy, M.; Corns, A.; Cahill, J.; Eliashvili, K.; Chenau, A.; Pybus, C.; Shaw, R.; Devlin, G.; Deevy, A.; Truong-Hong, L. Developing historic building information modelling guidelines and procedures for architectural heritage in Ireland. Int. Arch. Photogramm. Remote Sens. Spat. Inf. Sci.—ISPRS Arch. 2017, 42, 539–546. [Google Scholar] [CrossRef]


© 2018 by the authors. Licensee MDPI, Basel, Switzerland. This article is an open access article distributed under the terms and conditions of the Creative Commons Attribution (CC BY) license (http://creativecommons.org/licenses/by/4.0/).
Share and Cite
Bassier, M.; Vincke, S.; De Lima Hernandez, R.; Vergauwen, M. An Overview of Innovative Heritage Deliverables Based on Remote Sensing Techniques. Remote Sens. 2018, 10, 1607. https://doi.org/10.3390/rs10101607
Bassier M, Vincke S, De Lima Hernandez R, Vergauwen M. An Overview of Innovative Heritage Deliverables Based on Remote Sensing Techniques. Remote Sensing. 2018; 10(10):1607. https://doi.org/10.3390/rs10101607
Chicago/Turabian StyleBassier, Maarten, Stan Vincke, Roberto De Lima Hernandez, and Maarten Vergauwen. 2018. "An Overview of Innovative Heritage Deliverables Based on Remote Sensing Techniques" Remote Sensing 10, no. 10: 1607. https://doi.org/10.3390/rs10101607
APA StyleBassier, M., Vincke, S., De Lima Hernandez, R., & Vergauwen, M. (2018). An Overview of Innovative Heritage Deliverables Based on Remote Sensing Techniques. Remote Sensing, 10(10), 1607. https://doi.org/10.3390/rs10101607