Article

Implications of Whole-Disc DSCOVR EPIC Spectral Observations for Estimating Earth’s Spectral Reflectivity Based on Low-Earth-Orbiting and Geostationary Observations

1
Department of Earth and Environment, Boston University, Boston, MA 02215, USA
2
State Key Laboratory of Remote Sensing Science, Jointly Sponsored by Beijing Normal University and Institute of Remote Sensing and Digital Earth of Chinese Academy of Sciences, Beijing, 100875, China
3
Beijing Engineering Research Center for Global Land Remote Sensing Products, Institute of Remote Sensing Science and Engineering, Faculty of Geographical Science, Beijing Normal University, Beijing 100875, China
4
NASA Goddard Space Flight Center, Greenbelt, MD 20771, USA
5
VTT Technical Research Centre of Finland, 02044 Espoo, Finland
6
College of Electrical and Information Engineering, Hunan University, Changsha 410082, China
7
Macro Agriculture Research Institute, College of Resource and Environment, Huazhong Agricultural University, Wuhan 430070, China
8
Department of Global Ecology, Carnegie Institution for Science, Stanford, CA 94305, USA
*
Author to whom correspondence should be addressed.
Remote Sens. 2018, 10(10), 1594; https://doi.org/10.3390/rs10101594
Submission received: 24 August 2018 / Revised: 20 September 2018 / Accepted: 1 October 2018 / Published: 5 October 2018
(This article belongs to the Special Issue Radiative Transfer Modelling and Applications in Remote Sensing)

Abstract

:
Earth’s reflectivity is among the key parameters of climate research. National Aeronautics and Space Administration (NASA)’s Earth Polychromatic Imaging Camera (EPIC) onboard National Oceanic and Atmospheric Administration (NOAA)’s Deep Space Climate Observatory (DSCOVR) spacecraft provides spectral reflectance of the entire sunlit Earth in the near backscattering direction every 65 to 110 min. Unlike EPIC, sensors onboard the Earth Orbiting Satellites (EOS) sample reflectance over swaths at a specific local solar time (LST) or over a fixed area. Such intrinsic sampling limits result in an apparent Earth’s reflectivity. We generated spectral reflectance over sampling areas using EPIC data. The difference between the EPIC and EOS estimates is an uncertainty in Earth’s reflectivity. We developed an Earth Reflector Type Index (ERTI) to discriminate between major Earth atmosphere components: clouds, cloud-free ocean, bare and vegetated land. Temporal variations in Earth’s reflectivity are mostly determined by clouds. The sampling area of EOS sensors may not be sufficient to represent cloud variability, resulting in biased estimates. Taking EPIC reflectivity as a reference, low-earth-orbiting-measurements at the sensor-specific LST tend to overestimate EPIC values by 0.8% to 8%. Biases in geostationary orbiting approximations due to a limited sampling area are between 0.7 % and 12%. Analyses of ERTI-based Earth component reflectivity indicate that the disagreement between EPIC and EOS estimates depends on the sampling area, observation time and vary between 10 % and 23%.

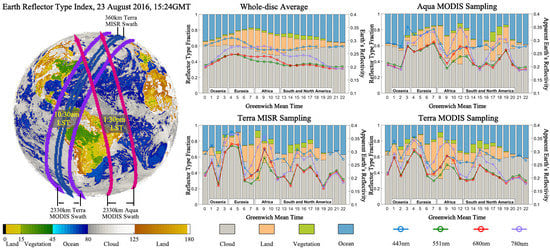
Graphical Abstract

1. Introduction

Earth’s reflectivity characterizes the fraction of incident solar radiation that the sunlit Earth reflects back to space. It is among the key variables in remote sensing, Earth’s energy budget studies and climate models [1,2,3,4,5]. Monitoring the Earth’s broadband and spectral reflective properties and their interpretation has long been one of the main goals of the Earth Orbiting Satellites (EOS) [6,7,8,9,10]. The EOS sensors sample radiance data over swaths at a specific local solar time (LST) or over a specific area of the sunlit Earth (Figure 1). For example, Moderate Resolution Imaging Spectroradiometer (MODIS) and Multi-Angle Imaging SpectroRadiometer (MISR) onboard Terra and MODIS onboard Aqua, these low-earth-orbiting (LEO) satellite sensors provide Earth’s spectral reflectivity at 10:30 and 13:30 LST, respectively. It takes 1–2 days for MODIS and 9 days for MISR to provide global coverage of the Earth at instrument-specific LSTs. National Oceanic and Atmospheric Administration (NOAA)’s Geostationary Operational Environmental Satellite East (GOES-East) acquires almost complete sunlit images of North and South America and most of the Atlantic Ocean and the Pacific Ocean basin. The scene in the sunlit images changes due to the Earth’s rotation. This causes a strong temporal variation of the Earth’s reflectivity. The satellite sampling geometry therefore has a strong impact on the estimation of how much solar energy the sunlit Earth reflects. It also affects the estimates of contributions to the total reflectivity from ocean, clouds, atmosphere, land, and vegetation. All EOS sensors require models to extrapolate the observations temporally and spatially to the entire sunlit image. Models are based on a number of assumptions that introduce model uncertainties. Their specification is critical to understanding the feedback mechanisms within the land–atmosphere–ocean system that strives to achieve dynamic equilibrium in response to perturbations of the Earth’s radiation budget.
For the first time, National Aeronautics and Space Administration (NASA)’s Earth Polychromatic Imaging Camera (EPIC) onboard NOAA’s Deep Space Climate Observatory (DSCOVR) can measure the reflected sunlight simultaneously at all sunlit locations from sunrise to sunset (Figure 1). The DSCOVR spacecraft arrived at the first Lagrangian point (L1) about 1.5 million km away from Earth in June 2015 and has been in a Lissajous orbit providing measurements since then. EPIC is a 10-channel spectroradiometer (317–780 nm), taking 10 narrow band spectral images of the entire sunlit face of Earth every 65 to 110 min [11]. Its observing geometry is characterized by a nearly constant phase angle (angle between the directions to the Sun and sensor) between 4.5° and 11.5°, making the reflectance data free of Sun-sensor bidirectional effects. DSCOVR EPIC provides direct observations of the Earth’s spectral reflectivity in the near backscattering directions at a high temporal resolution.
Methods and approaches to approximate the Earth’s reflectivity from EOS observations are well advanced [1,2,3,4,5,6,7,8,9,10]. However, their direct validation and assessment of their underlying assumptions have been lacking thus far due to the absence of truth data. Such data have become available now due the DSCOVR platform. Here we took advantage of the unique capabilities of the EPIC instrument to analyze the impacts of the sampling geometries of the EOS sensors on estimating the spectral reflectivity of the Earth and its components. The EPIC Earth’s spectral reflectivity was taken as a reference data set. We generated time series of reflected radiation integrated over sampling areas of EOS sensors using EPIC data. Since the Sun-sensor geometry and spectral band compositions are fixed, the difference between the time series quantifies the effects of the sensor sampling areas on Earth’s reflectivity. The aim of the present paper is to understand these effects. Our analyses were performed for sampling areas of the Terra MODIS, MISR, Aqua MODIS and GOES-East sensors.
This paper is organized as follows. Section 2, Appendix A, Appendix B and Appendix C describe the DSCOVR EPIC data, introduce rigorous definitions of the Earth’s spectral reflectivity, detail sampling geometries of Terra MODIS, MISR, Aqua MODIS and GOES-East sensors and discuss a physically-based approach to discriminate between signals originated from clouds and cloud-free ocean, bare and vegetated land. Analyses of diurnal, daily and monthly variations of the spectral reflectivity of the Earth as seen by the EOS sensors are presented in Section 3 and in the Supplementary Materials. The analyses were performed under an assumption of fixed Sun-sensor geometry. Uncertainties in LEO approximations due to bidirectional effects are discussed in Section 3.4. Finally, Section 4 summarizes the results.

2. Data and Methods

2.1. DSCOVR EPIC Data

The DSCOVR EPIC L1B data product provides radiance data for the entire sunlit Earth at ten ultraviolet to near-infrared (NIR) narrow spectral bands every 65 to 110 min (https://epic.gsfc.nasa.gov/epic). The EPIC Earth observing geometry is characterized by a nearly constant scattering angle between 168.5° and 175.5°. The effective resolution is about 10 km at nadir and 20 km at 60°. The L1B product also includes per pixel latitude and longitude locations, Sun position and instrument viewing angles. Latitude and longitude are the same for all 10 bands, however, the Sun angles are different by a small amount for each band due to the rotation of the Earth (https://eosweb.larc.nasa.gov/project/dscovr/DSCOVR_EPIC_Geolocation_V02.pdf). The DSCOVR EPIC L1B are written in the standard Hierarchical Data Format 5 (HDF5) and publicly available from the NASA Langley Atmospheric Science Data Center (https://eosweb.larc.nasa.gov/project/dscovr/dscovr_table). An overview of the DSCOVR EPIC project, geolocation algorithm, radiometric calibration for each wavelength channels and DSCOVR EPIC standard products can be found in [11].
The radiance data are in engineering units of counts per second. The EPIC team provides a calibration factor (Table 1) to convert measurements given in counts per second into the top of the atmosphere (TOA) reflectance [12,13]. In this work we use L1B EPIC images at blue (443 nm), green (551 nm), red (680 nm) and NIR (780 nm) spectral bands acquired from 1 January 2016 to 31 December 2016. Pixels with a solar zenith angle (SZA) that exceed 76° are excluded from our analyses to avoid ambiguities resulting from the oblique illumination, large field-of-views, and slight variations in the DSCOVR satellite’s position relative to the exact L1 point. We also used the spectral TOA bidirectional reflectance factor (BRF), which is related to TOA reflectance Rr,λ as B R F r , λ = R r , λ / cos S Z A r , where r and S Z A r denote pixel location and corresponding SZA.

2.2. Definitions of Earth’s Spectral Reflectivity

We idealized the Earth’s atmospheric system as a sphere of radius R T O A centered at r 0 , which is illuminated by a parallel solar beam. We introduced a scattering function, P λ ( Ω 0 , Ω ) , which characterizes the angular distribution of the radiation scattered by the system: π 1 P λ ( Ω 0 , Ω ) is the fraction of the total solar energy at wavelength λ intercepted by the sphere that is scattered towards the sensor. It depends on the directions of incidence, Ω 0 , and scattering, Ω , and is given by
1 π P λ ( Ω 0 , Ω ) = 1 π 2 4 π B R F r , λ ( Ω 0 , Ω ) | ( Ω 0 , Ω n ) ( Ω , Ω n ) | χ ( Ω n , Ω 0 , Ω ) d Ω n .
Here Ω n represents an outward normal at point r = r 0 + R T O A Ω n on the sphere, χ is an indicator function of sunlit points, which takes the value 1 if ( Ω n , Ω ) ( Ω 0 , Ω ) < 0 (i.e., sensor sees a sunlit sphere element) and 0 otherwise. Integration is performed over the entire sphere. The scalar products | ( Ω 0 , Ω n ) | and ( Ω n , Ω ) give cosines of the SZA and view zenith angle (VZA), respectively.
We introduced two albedos widely used in astronomy. They are the geometric albedo ( g λ ) and the Bond albedo ( ρ λ ). Unlike the surface albedo, which is defined for a point on a sphere, the geometric and Bond albedos pertain to the entire sphere. The geometric albedo is the ratio of the radiance scattered back to the source by a sphere to that scattered by a normally illuminated ideal Lambertian disc for the same source [14]. Its value coincides with P λ in the backscattering direction, i.e., g λ = P λ ( Ω 0 , Ω 0 ) . The Bond albedo is the fraction of the total solar energy intercepted by the sphere reflected in all directions [14]. Obviously, ρ λ can be obtained by integrating π 1 P λ ( Ω 0 , Ω ) over all directions of reflection Ω .
We illustrated the above definitions for a Lambertian sphere, i.e., when B R F r , λ = c o n s t = ρ λ . The scattering function depends only on the phase angle γ , i.e., the angle between directions to the source and sensors, and is given by (Appendix A)
P λ ( γ ) = 2 ρ λ 3 π [ sin γ + ( π γ ) cos γ ] .
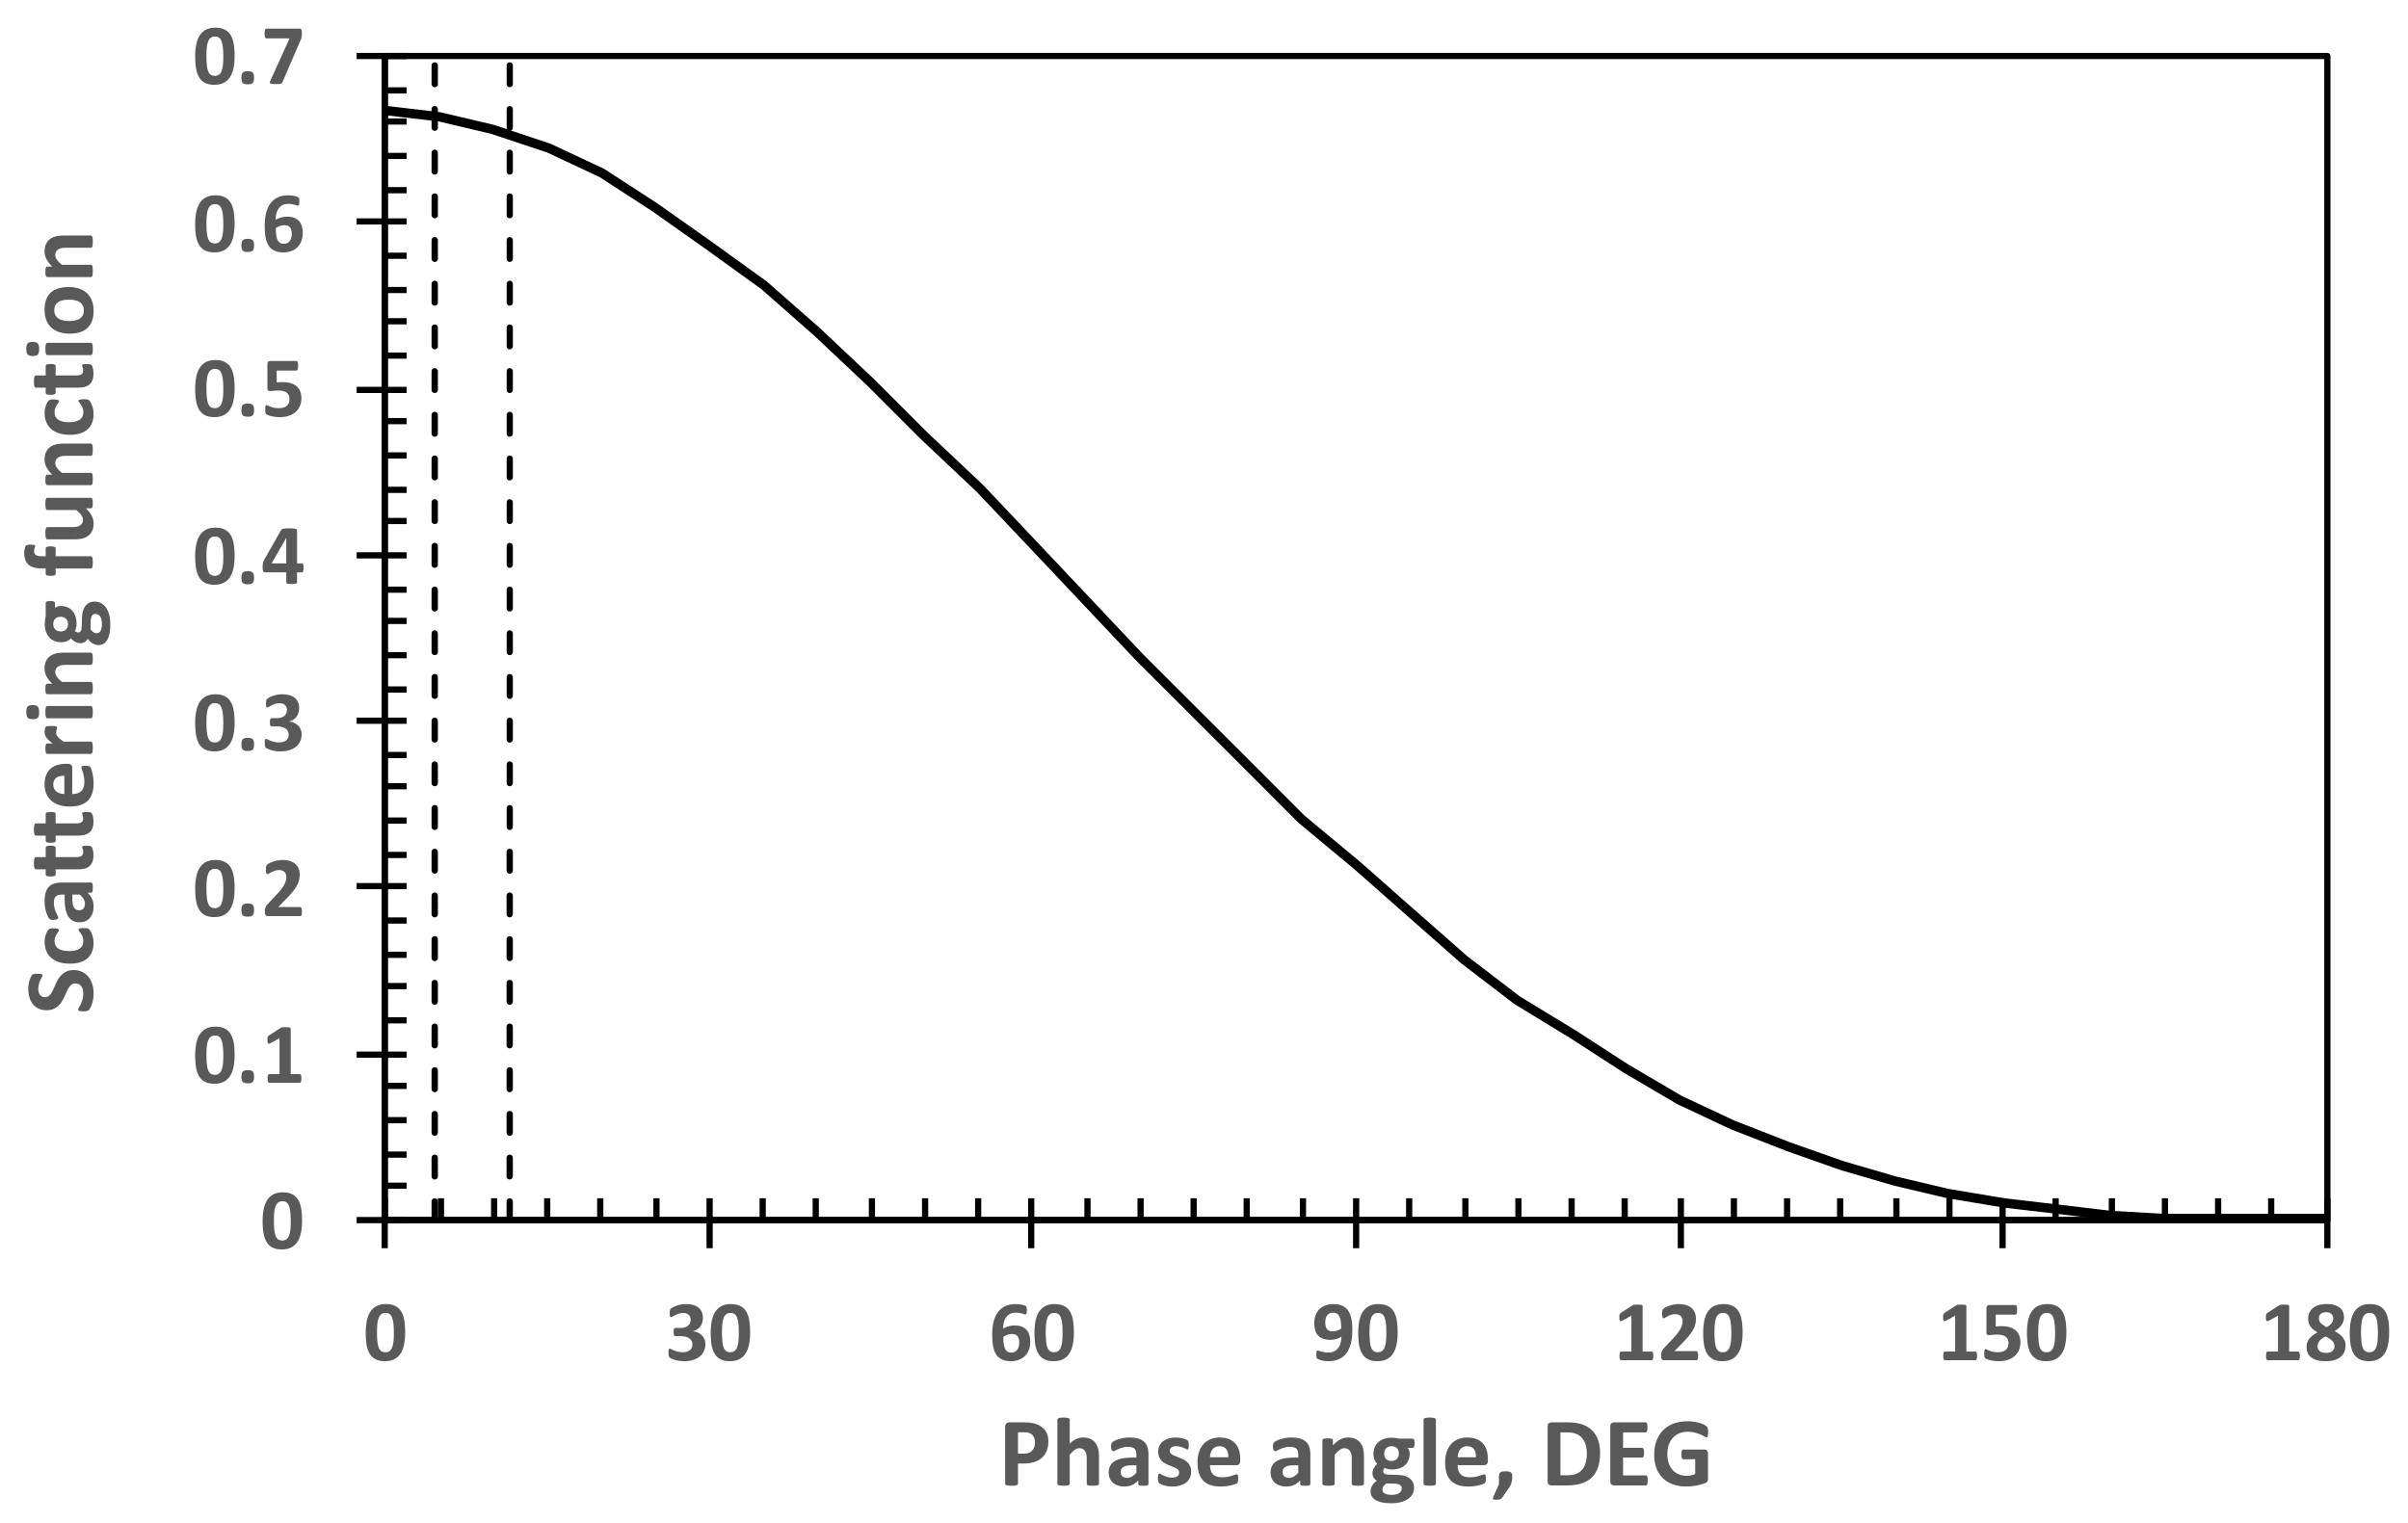
Figure 2 shows the scattering function for an ideal Lambertian sphere ( ρ λ = 1 ) . In the backscattering direction, a distant observer sees the entire sunlit sphere. The scattering function takes its maximum value at γ = 0 , P λ ( 0 ) = 2 / 3 , which is the geometric albedo. The contribution of the sphere shaded area (unirradiated face) increases with the phase angle, resulting in a monotonic decrease in P λ from its maximum in the backscattering direction ( γ = 0 ) to zero ( P λ ( π ) = 0 ) in the forward scattering direction ( γ = π ). The Bond albedo coincides with the surface BRF, i.e.,
1 π 4 π P λ ( γ ) d Ω = 1 π 0 2 π d φ 0 π P λ ( γ ) sin γ d γ = ρ λ .
A distinguishing feature of the data acquired from a distant point is that the phase angle is constant for every image pixel and coincides with the Sun–Earth–vehicle (SEV) angle at the time of image acquisition. The SEV depends on the DSCOVR satellite position on the non-repeating Lissajous orbit around the Lagrangian L1 point and therefore changes with time. Orbital data show that it varies between 4.5° and 11.5° with a mean of about 8.5°. The DSCOVR EPIC data, therefore, allowed us to estimate the scattering functions in this phase angle ranges, which in turn approximates the geometric albedo.
In our analyses, we approximated the scattering function as [15]
P λ ( γ ) i = 1 N B R F i , λ cos S Z A i cos V Z A i i = 1 N cos V Z A i = i = 1 N R i , λ cos V Z A i i = 1 N cos V Z A i ,
where R i , λ = B R F i , λ cos S Z A i represents TOA reflectance in the ith pixel and N is the total number of pixels used. The scattering function depends on Greenwich mean time (GMT). In this study, the daily average was the mean P λ over the 0 to 24 h time interval. The monthly and yearly averages represent the monthly mean over the daily averages and annual mean over monthly averages, respectively.

2.3. Sampling Approaches of the Earth Orbiting Satellites (EOS)

Unlike observations from deep space points, low-earth-orbiting (LEO) satellites acquire radiance data over swaths at a specific LST, while geostationary orbiting (GEO) satellites only sample a specific area of the Earth (Figure 1). Obviously, their sampling approaches do not provide enough information to estimate the 24 h course of the Earth’s spectral reflectivity. Questions that then arise are (a) Do daily, monthly or annual averaged reflectance from LEO and GEO satellites converge to their true values? (b) Do LEO and GEO data alone enable us to estimate how much solar energy is scattered back to space by the key Earth components: clouds, ocean, land, and vegetation?
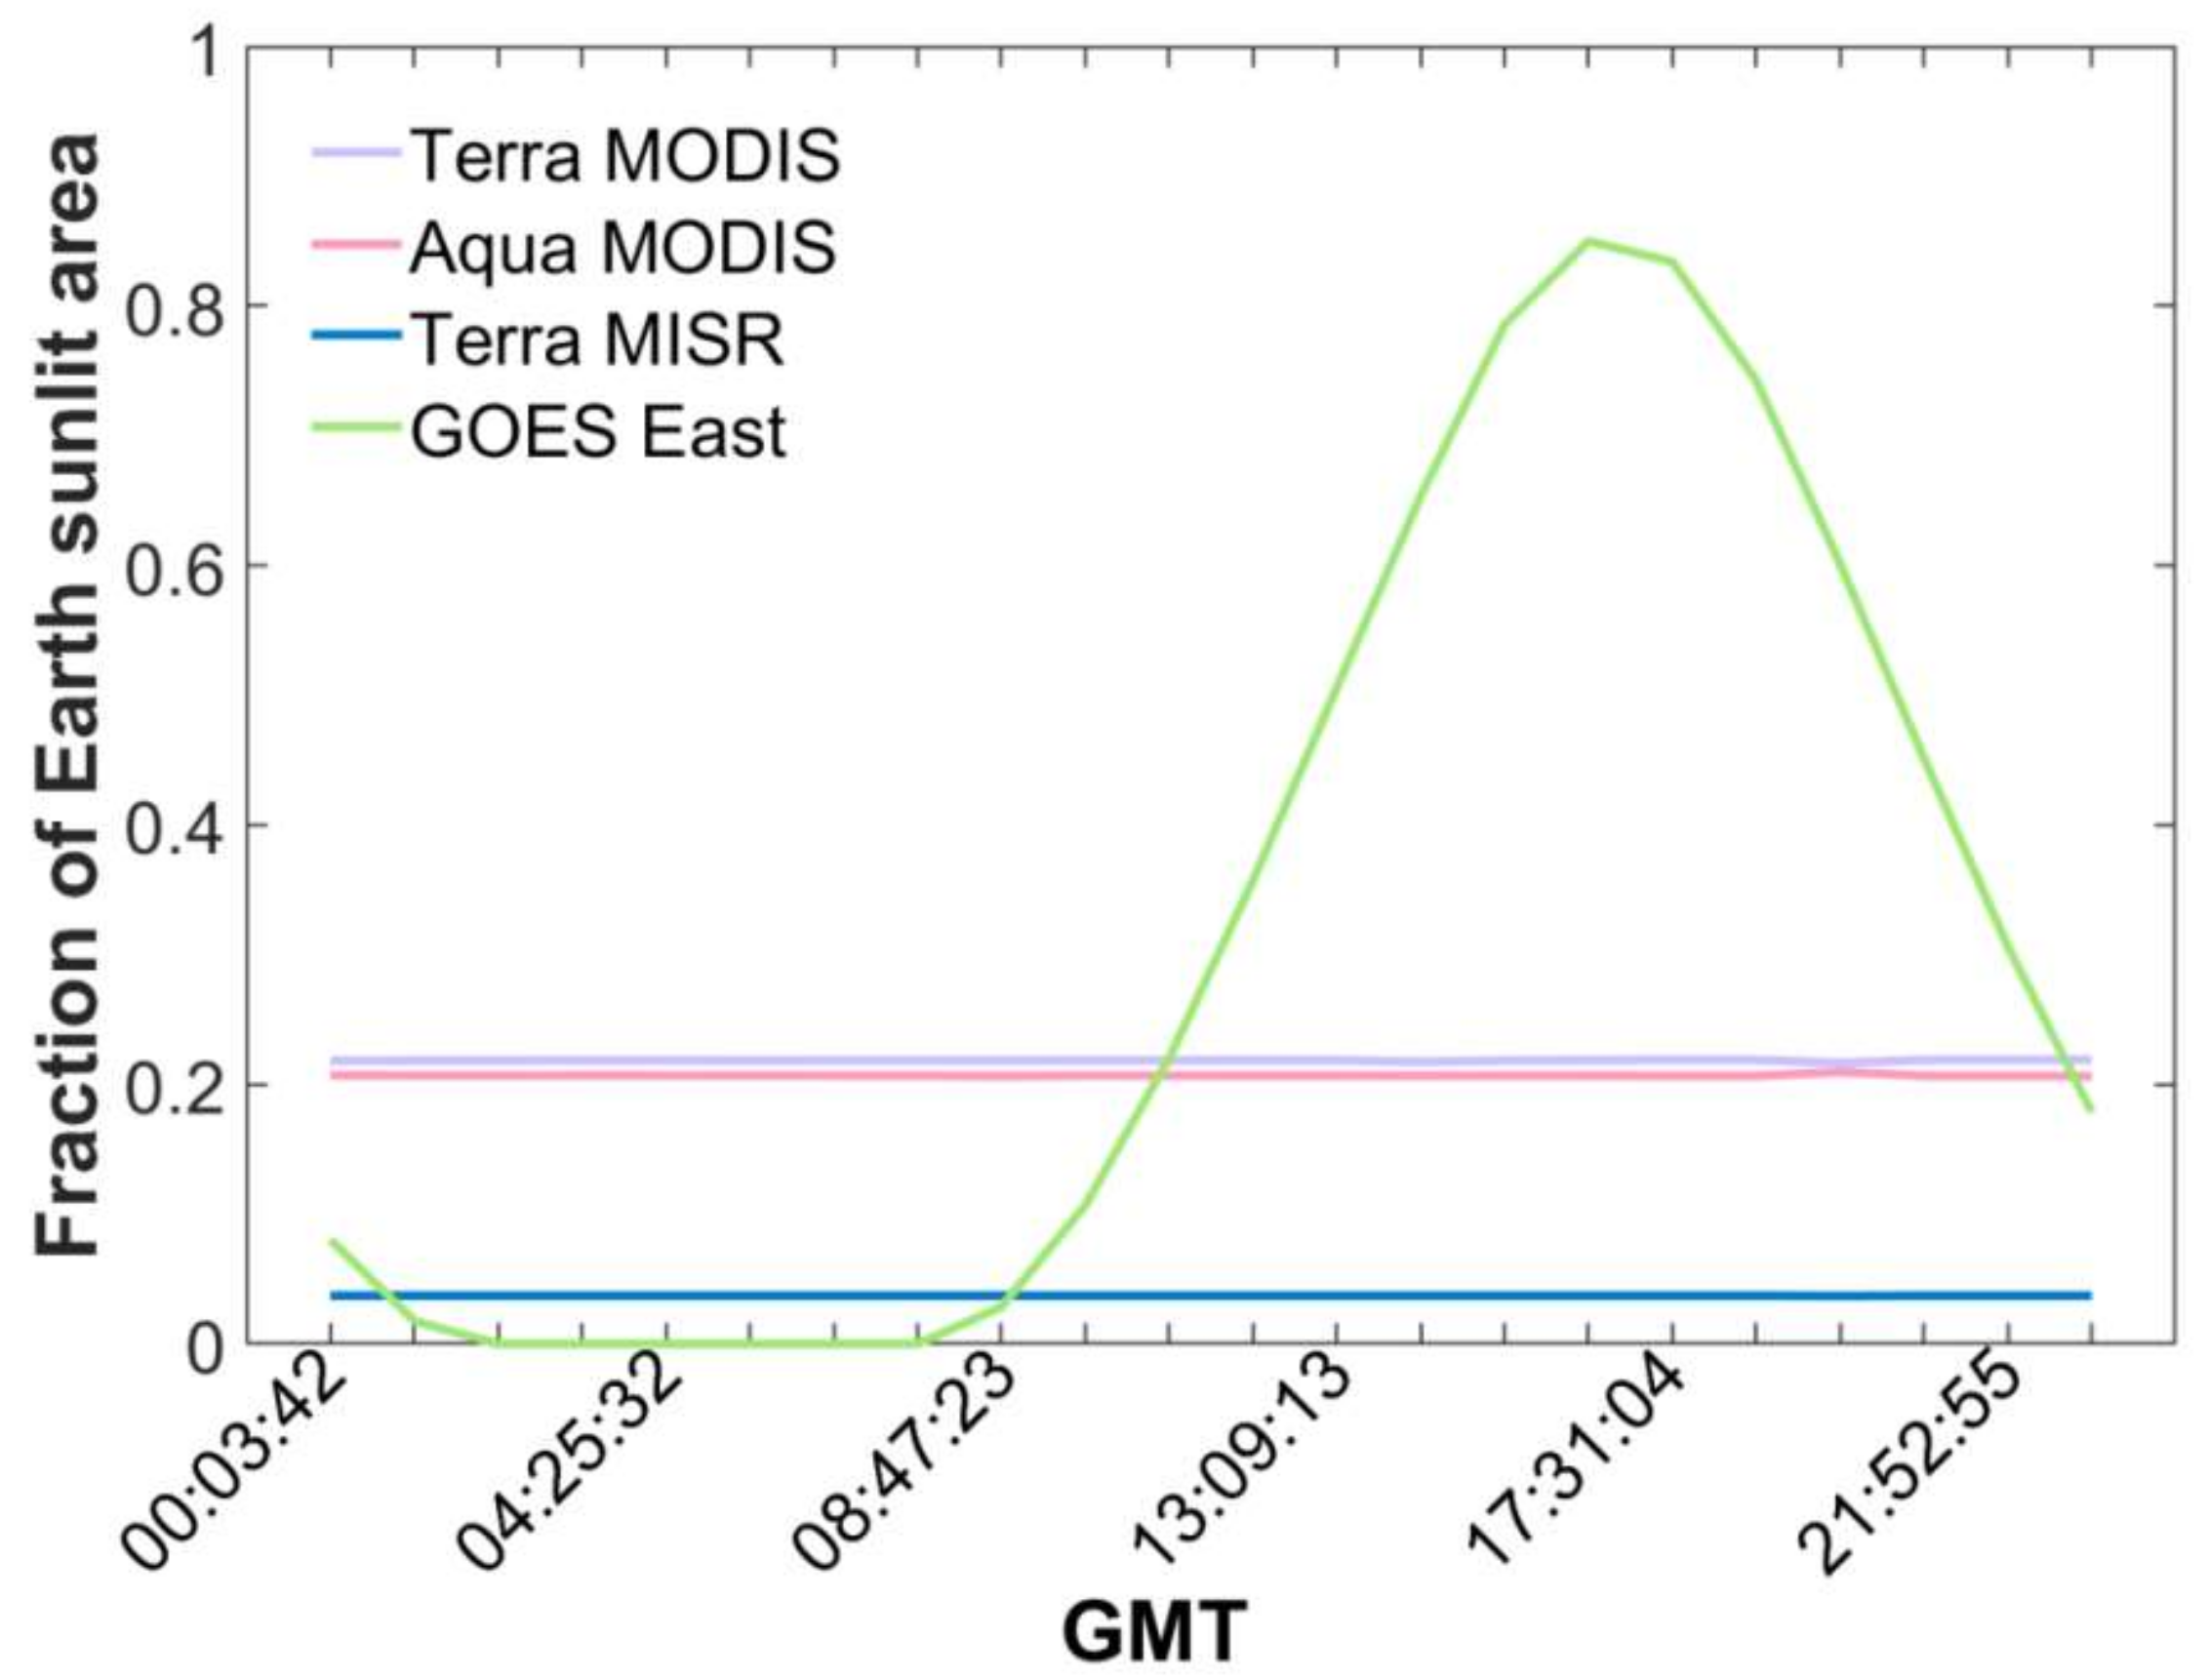
The DSCOVR EPIC sensor measures the radiance reflected by the Earth close to the backscattering directions in which the scattering function varies around its maximum. The EPIC scattering function, Equation (4), was taken as a reference of the Earth reflectivity in our analyses. To understand the sampling effects, we generated a time series of the scattering functions, P λ ( γ , S ) , using EPIC data over the EOS satellite sampling areas S, which then were compared with the reference. Here P λ ( γ , S ) was calculated using Equation (4) where the summation was performed over the pixels located in S. The sampling areas of the EOS sensors were represented in our study by the sunlit part of swaths of Terra MODIS/MISR, Aqua MODIS and a fixed area of the GOES-East satellite (Figure 1). The variations in the sampling areas with time are shown in Figure 3.
The MODIS sensor onboard the Terra and Aqua sun-synchronous polar orbit satellites is a whisk broom sensor with a ±55° scanning angle, resulting in a 2330 km width swath across the satellite ground track. In the daytime, Aqua ascends from south to north, while Terra descends from north to south. Due to the Earth’s rotation, the ground tracks for both satellites drift to the west as satellites fly (Figure 1). The sun-synchronous orbits are specified by the time they cross the equator on the sunlit side of the orbit. Terra crosses the equator at 10:30 am LST, while Aqua crosses it at 1:30 pm. Given GMT and local longitude, the LST is calculated as LST = GMT + longitude/15°.
The MISR instrument on the Terra platform uses nine separate push broom cameras to acquire data at nine along-track viewing angles. Each camera sees instantaneously a single row of pixels at right angles to the ground track, resulting in a 360 km cross-track swath. Similar to Terra MODIS, the MISR orbit is also specified by the LST it crosses the equator on the sunlit side. In this study, we first built a fixed swath mask according to the projection, width of the swath and the Earth’s rotation, and then extracted the sunlit part of the LEO paths by moving this mask based on their LSTs. Thus, the LEO swaths are constant on the EPIC images.
NOAA’s GOES is a series of geostationary satellites about 35,800 km above the Earth. GOES is built and launched by NASA and operated by NOAA. Their orbits are over the equator. Each satellite views almost a third of the Earth’s surface, which focuses on North and South America and most of the Atlantic Ocean and the Pacific Ocean basin. Here we take GOES-East (also named GOES-16, GOES-R which was launched on 19 November 2016) to represent GEO sampling area. It is positioned at 75° W longitude above the equator (https://www.goes-r.gov/mission/history.html). The satellite can produce a full-face picture of the Earth approximately from 20° W to 130° W longitude with the sunlit sampling area S changing with time (Figure 1).

2.4. Earth Reflector Type Index

We considered major four components of the Earth’s atmospheric system: clouds, cloud-free ocean, land, and vegetation. We developed an Earth Reflector Type Index (ERTI), which discriminates signals originating from different Earth components. The index is based on the spectrally invariant behavior of radiation reflected from vegetation canopies [16,17,18,19,20,21], clouds [22,23], and the soil line concept [24,25]. The spectral invariant theory suggests that the ratio of BRF to single scattering albedo (SSA), B R F λ / ω λ , is linearly related to B R F λ , i.e.,
B R F λ ω λ = p B R F λ + K ,
where the spectrally invariant slope, p, and intercept, K, are the recollision probability and the escape factor. The SSA is represented by the leaf albedo in vegetation radiative transfer, while it is well defined for water droplets and ice crystals in clouds. For bare soil, the SSA depends on soil moisture [25]. At weakly absorbing wavelengths the linear relationship given by Equation (5) holds for any SSA, ω 0 , λ [26,27]. The slope (p) depends on the choice of ω 0 , λ : it takes on a negative value if ω 0 , λ < ω λ , and a positive value between 0 and 1, otherwise (Appendix B).
The EPIC green and NIR spectral bands represent weakly absorbing bands for both clouds and vegetation canopies. We use a fixed brightest leaf for leaf albedo. Its values at 551 nm and 780 nm are ω 0 , 551 = 0.4898 and ω 0 , 779 = 0.9798 , respectively. These values were obtained from Lewis and Disney’s [20] approximation of the PROSPECT-4 model [28,29] with the following parameters: chlorophyll content of 16 μg cm−2; equivalent water thickness of 0.005 cm−1, and dry matter content of 0.002 g   cm 1 . Given the BRF at the green and NIR spectral bands, we calculated the slope p of a line passing two points, ( B R F 551 ω 0 , 551 ,   B R F 551 ) and ( B R F 779 ω 0 , 779 ,   B R F 779 ) , on the B R F / ω vs. BRF plane, i.e.,
  p = B R F 779 ω 0 , 779 B R F 551 ω 0 , 551 B R F 779 B R F 551 .
For a vegetated pixel, ω 0 , λ is always greater than an actual value of the leaf albedo and therefore 0 p 1 . For a cloudy pixel, the SSA of the darkest water droplet exceeds the albedo of the brightest leaf, i.e., ω 0 , λ is less than the actual value of the SSA for water droplets. Equation (6) therefore results in a negative value. For bare land, this equation also generates negative values, which exceed the p-values for the clouds due to the SSA difference. The spectral invariant approach is not applicable to ocean pixels. In this case, Equation (6) outputs non-physical values that exceed unity.
These properties underlie our definition of the ERTI. Given the BRF at the green and NIR spectral bands, we first calculate the slope (Equation (6)) and then convert it to the angle between the line (Equation (5)) and BRF axis, i.e.,
E R T I = { atan p , p > 0 90 ° + atan p , p < 0
The theoretical thresholds for different reflector types are discussed in Appendix B.
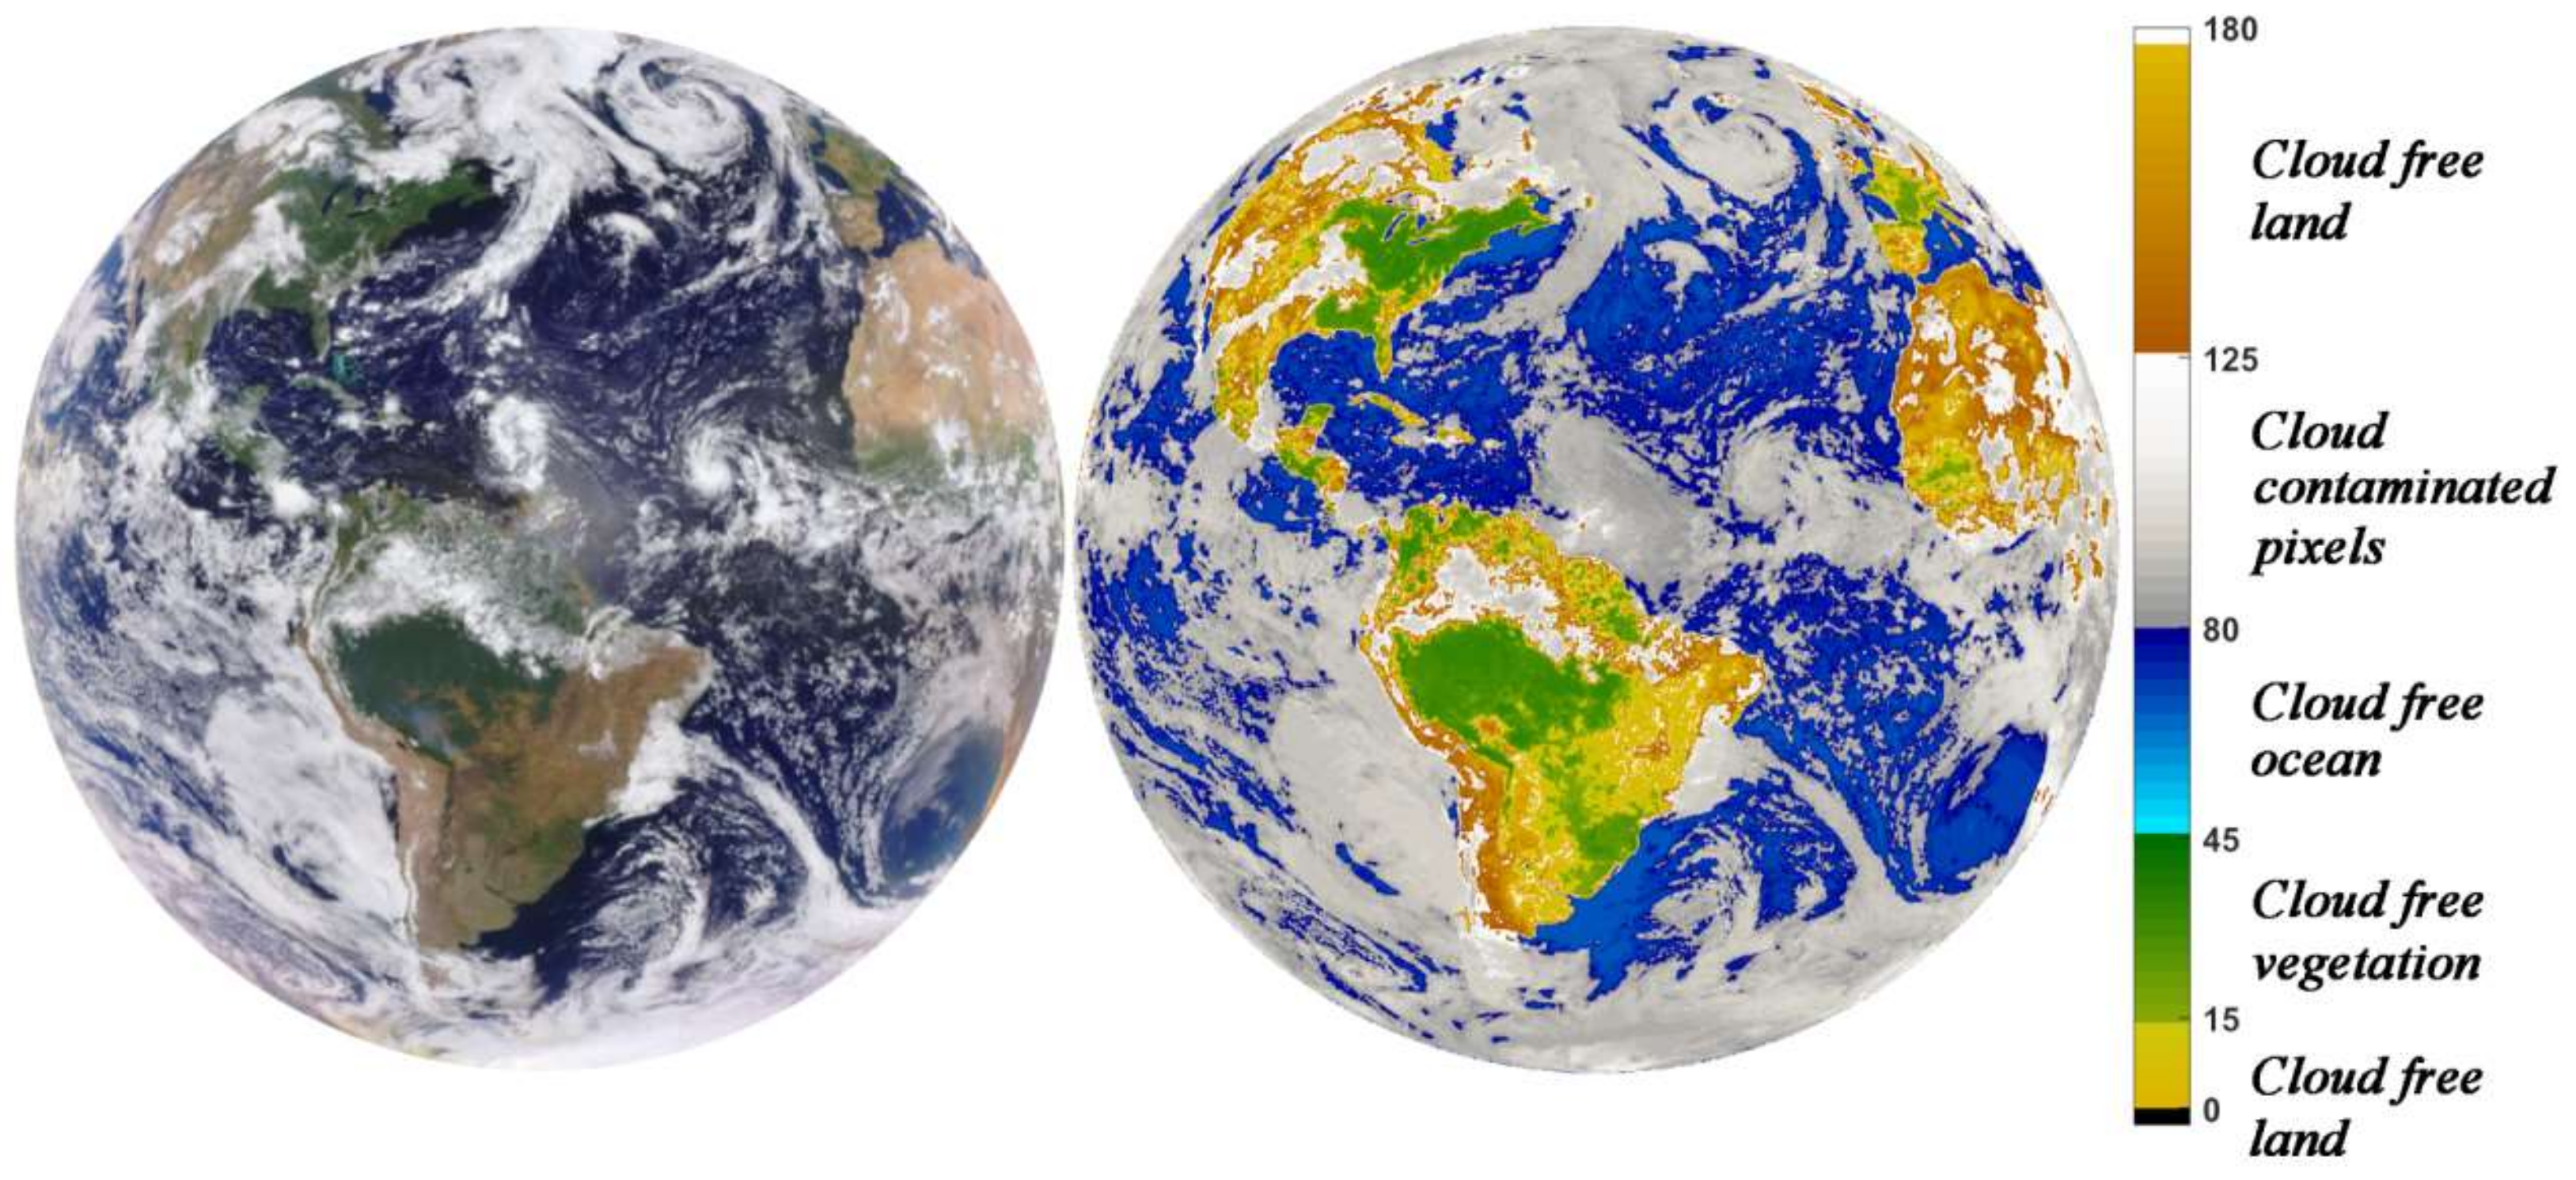
The largest uncertainties in the interpretation of the ERTI values arise in the case of clouds over ocean, i.e., when the ERTI varies around a cloud–ocean threshold of 90° (Appendix B). Equation (6) exhibits a jump from + (ERTI < 90°) to (ERTI > 90°) and becomes very sensitive to errors in cloud BRF. Indeed, the cloud BRF at the NIR and green spectral bands are very close and differ only by a few percent. Small errors in their values, therefore, can change the sign of the denominator in Equation (6). The numerator is less sensitive to uncertainties because the normalization BRF by SSA makes their values more contrasting. As a result, Equation (7) can generate values below 90°. For the ocean, NIR and green BRFs are better separated, making Equation (6) more tolerant to measurement errors and consequently its values are always below 90°. To minimize the impact of the instability, we reduced the theoretical value of the threshold for clouds and ocean (Appendix C). Its value was selected to match an average fractional cloud cover value of 0.56 (within 4%) for clouds with a cloud optical depth above 2 [30]. As assessed in [30], the global cloud amount increases to about 0.68 when considering clouds with optical depth above 0.1, and to about 0.73 when including subvisible cirrus. The probability of the ERTI method with selected thresholds being able to discriminate between cloudy and cloud-free scenes is therefore about 82%, which represents the reliability of the ERTI approach. Figure 4 shows the distribution of the ERTI over a DSCOVR EPIC image and the thresholds used. One can see that ERTI values corresponding to cloud-free ocean, land, vegetation, and cloudy pixels tend to occupy different spaces within the 0° to 180° intervals.
The presence of optically thin clouds in the scene is another source of uncertainty in the identification of the reflector type. For vegetated land, for example, the BRF reaches its maximum in the backscattering direction. This phenomenon is known as the hotspot effect [31,32,33]. The radiation scattered by the vegetation in the backscattering direction is very strong, allowing the EPIC to see green leaves even through the optically thin clouds (~0.9–1.2) [11,19]. The ERTI takes values between 15° and 45° as in the case of cloud-free scenes. An increase in the optical depth of clouds above the vegetation results in ERTI values close to the threshold between land and clouds. Our ERTI threshold values may cause an overestimation of cloud cover over ocean and an underestimation over vegetation. Thus, our classification “cloud-free scene” contains transitional cases between definitely cloudy and definitely cloud-free scenes. All cloud-free scenes also include contributions from the scattering atmosphere, with a maximum effect at the blue spectral band.

2.5. Definitions of Variation

We used the variable V(S) defined as
  V ( S ) = G M T | F G M T + 1 ( S ) F G M T ( S ) | ,
to quantify the cumulative magnitude of variations in time series. Here Ftime(S) represents either reflector type fractions or the scattering function at different GMT times over a sampling area S. Variations of F over the whole EPIC image, V(E), are taken as reference values. The ratio between V(S) and V(E) characterizes the relative deviation of variation over the sampling area S from its reference counterpart.

3. Results and Discussion

3.1. Diurnal Variability

3.1.1. EPIC Scattering Function

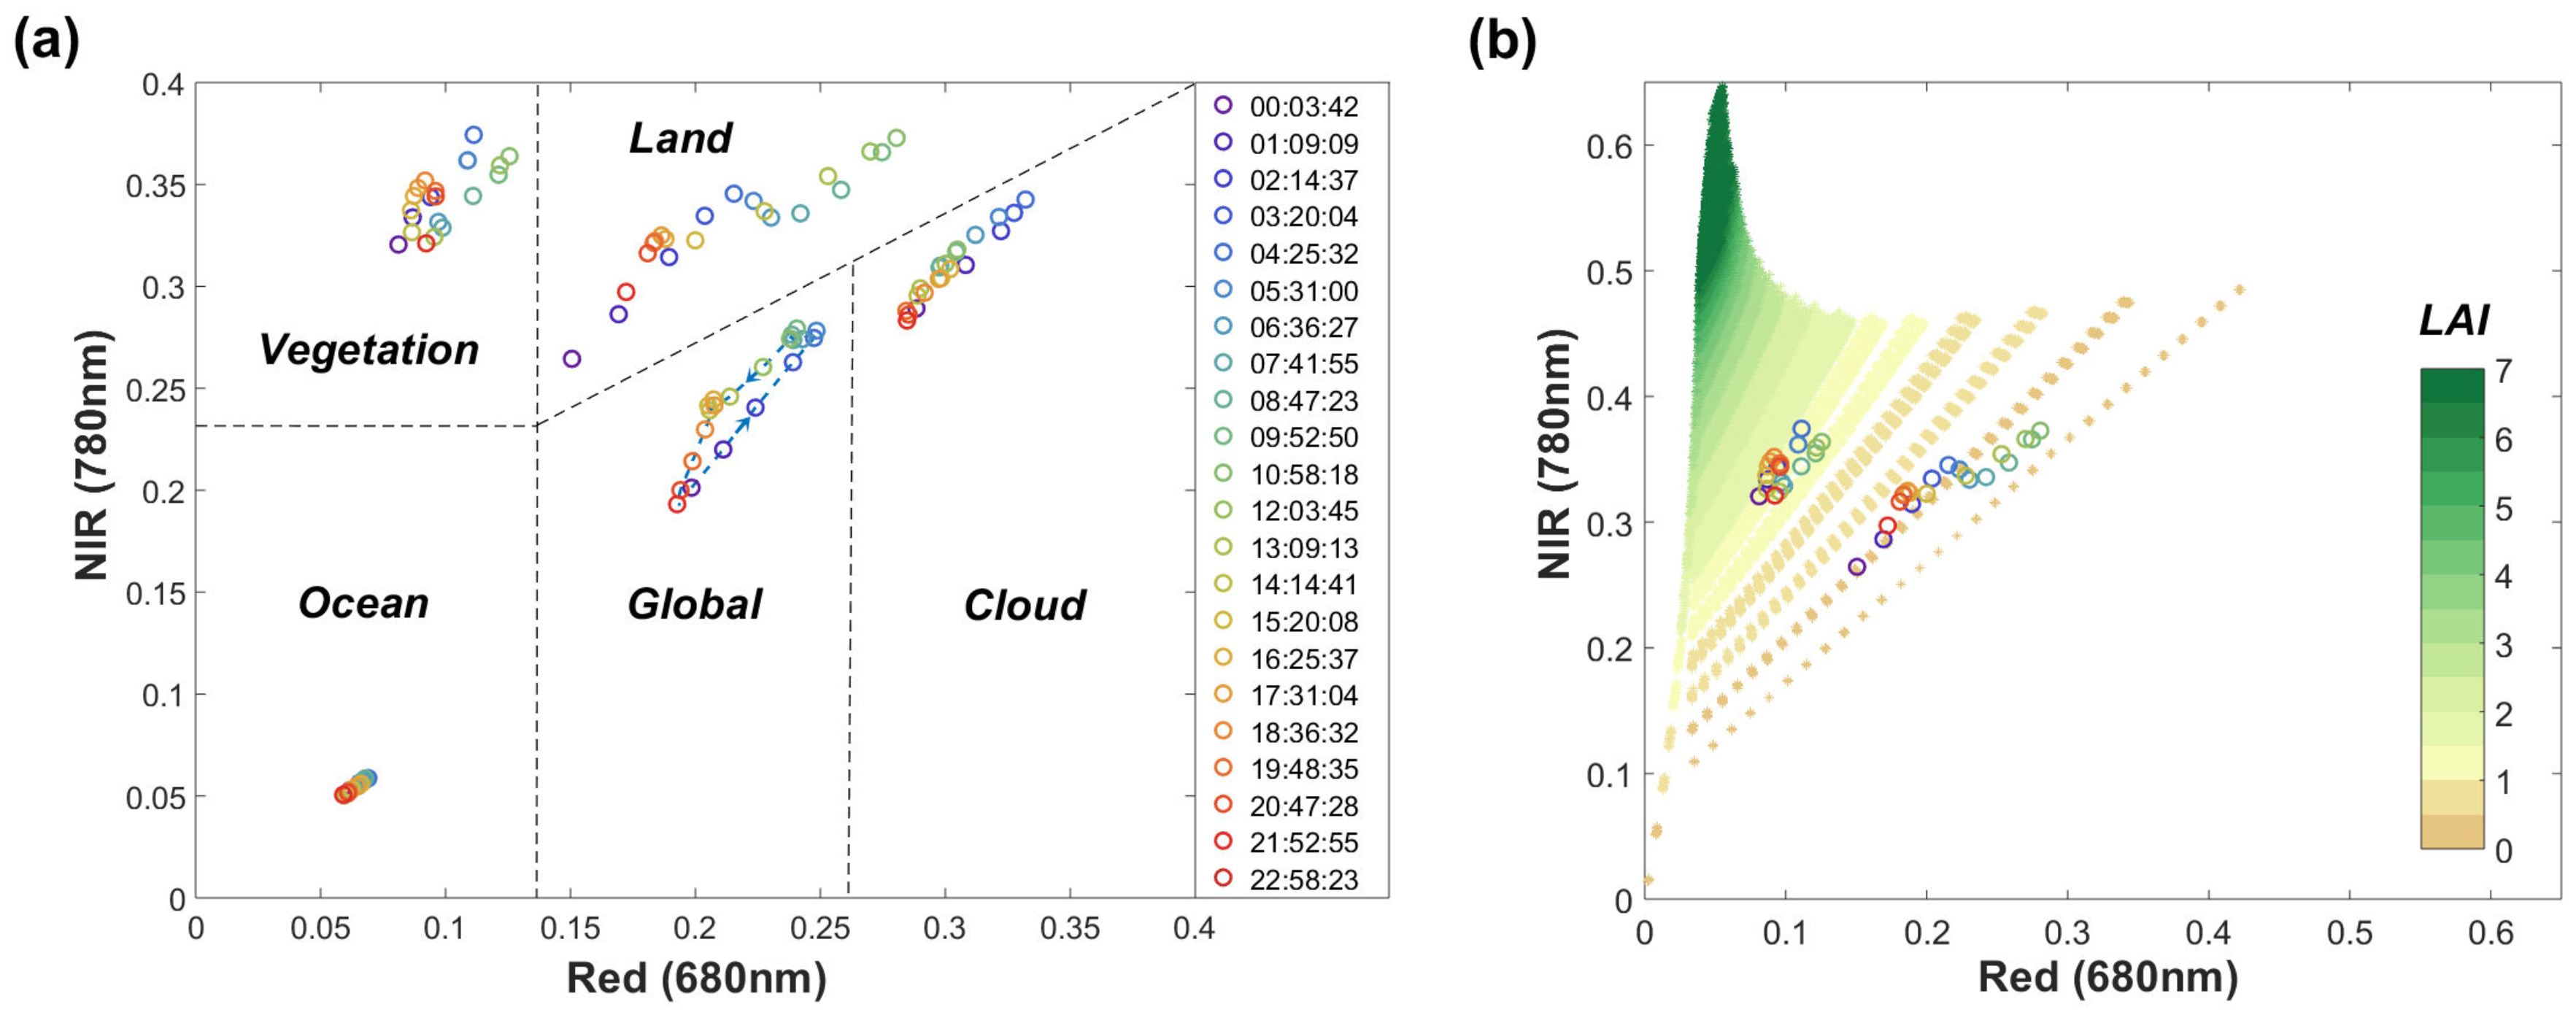
We started with analyses of variations in the EPIC scattering function, P λ , at λ = 680   nm (red) and λ = 780   nm (NIR) derived from DSCOVR EPIC images acquired on 23 August 2016. This is an anomalous day in the sense that the EPIC observed almost the entirety of South America free of clouds, a rare event (https://epic.gsfc.nasa.gov/?date=2016-08-23). Figure 5a shows the distribution of the scattering function on the NIR vs. red spectral plane as a function of GMT. The central block, labeled “global”, represents the diurnal course of the EPIC scattering function pairs ( P 680 , P 780 ) . The remaining blocks contain the trajectories of the mean scattering functions over the cloudy and cloud-free ocean, land and vegetated pixels. The ERTI index was used to identify the reflector types.
Clouds represent the strongest red and NIR reflector. Their trajectory forms a line with a relative difference between P 680 and P 780 of about −2.3%. The ocean acts as an absorber at these wavelengths. It scatters about 14.8% more radiation at the red band compared to that at the NIR band. Figure 5b shows a domain of variation in the red and NIR reflectance of bare and vegetated land simulated with the stochastic radiative transfer equation [34,35], as well as points from the blocks “vegetation” and “land”. The reflectance of bare land forms a line as the soil line concept predicts [24,25]. The reflectance of vegetated land varies with the amount of green leaves and the brightness of its background. The range of variation in the NIR reflectance of vegetated land is comparable with that of clouds. The strong absorption of incoming solar radiation by the vegetation at the red spectral band significantly reduces its reflectance. Reflection from bare land exhibits a wide range of variation. Note that the reflective properties of clouds, cloud-free ocean, land and vegetation derived based on the ERTI index follow the regularities expected from physics, suggesting the robustness of our identification approach.
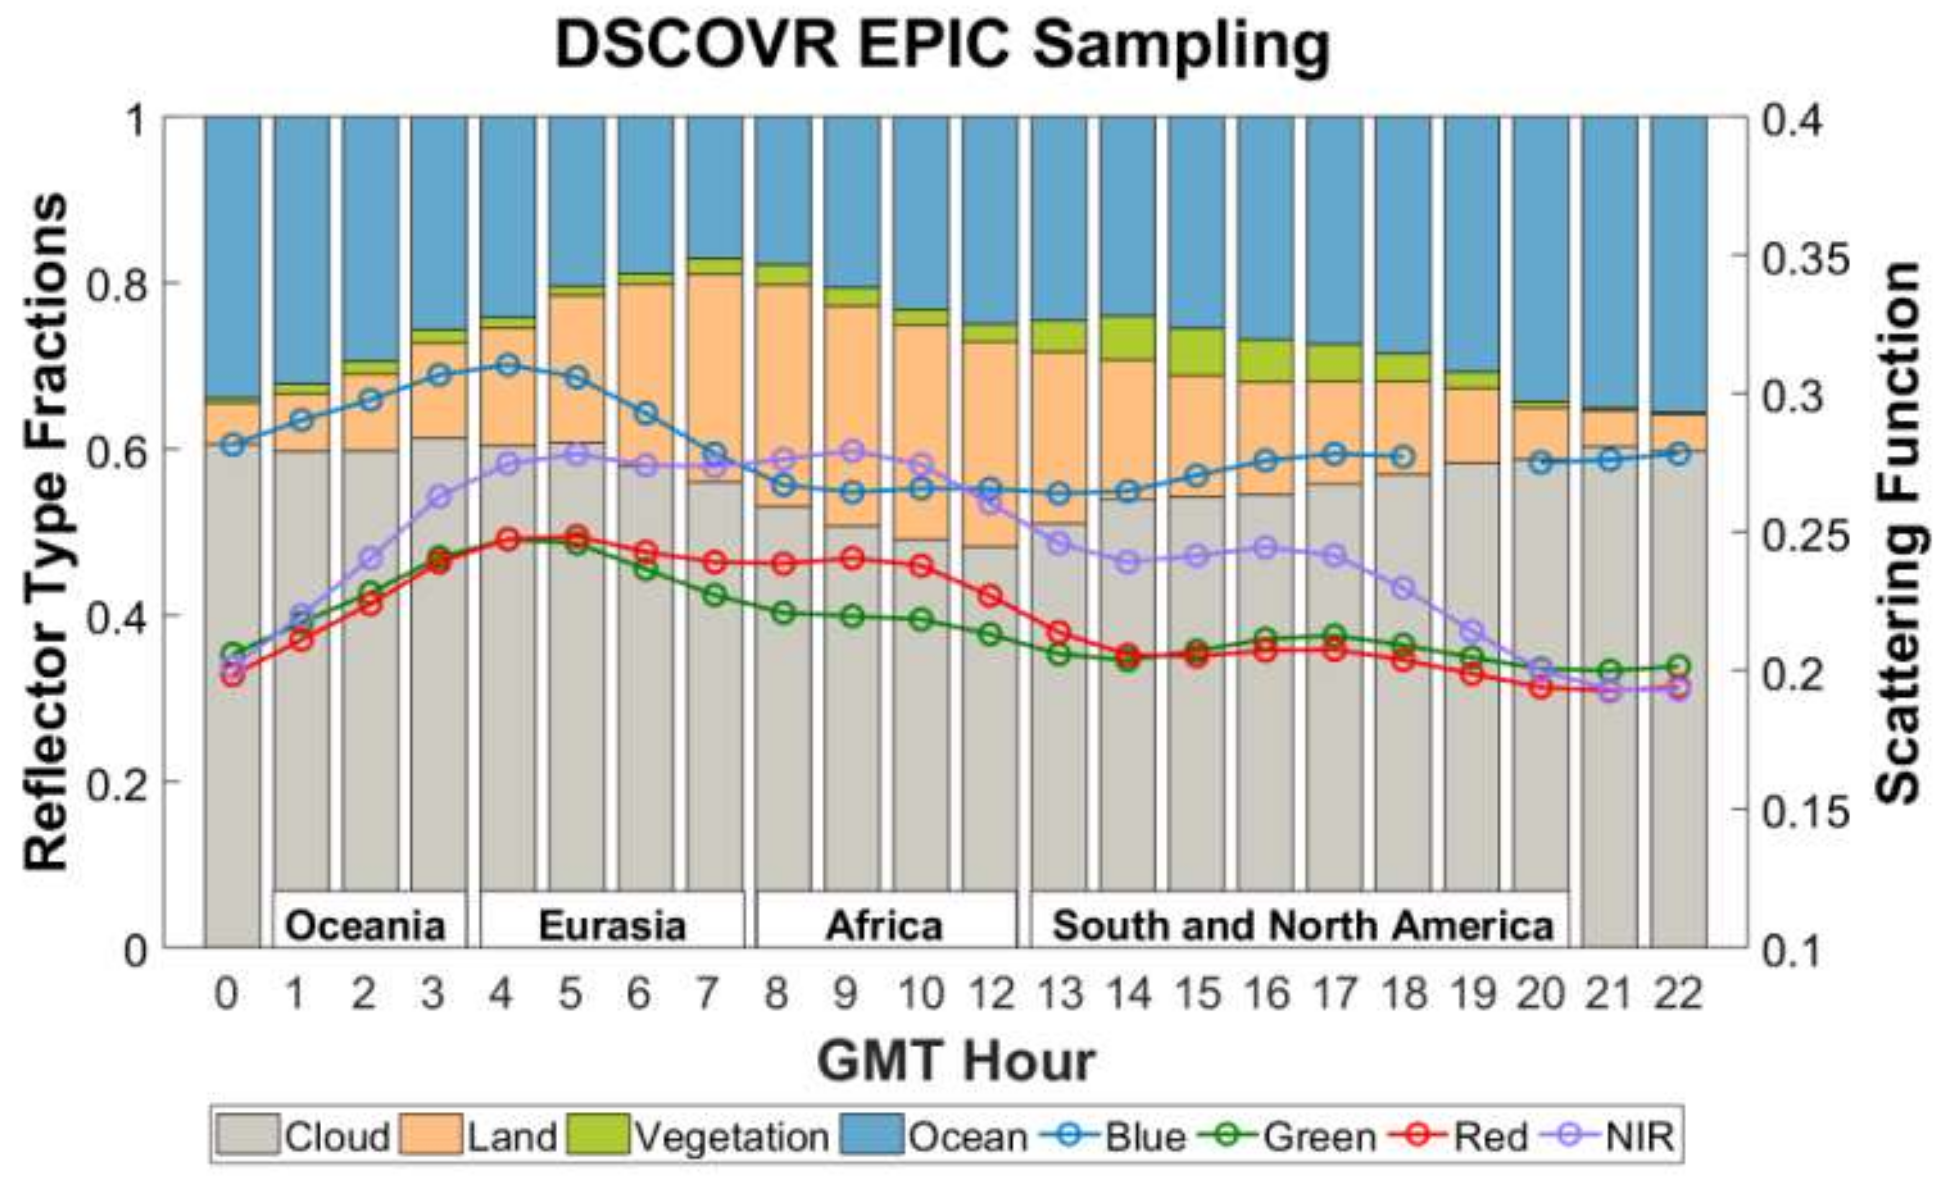
The EPIC scattering function is a weighted sum of the reflectance of four Earth components, where weights are fractions of the reflector types present in the image. Figure 6 shows the diurnal courses of the weights and the EPIC scattering function at four spectral bands. The fractional cloud cover is relatively stable. It varies between 0.482 and 0.613 during the day with a mean and standard deviation of 0.564 and 0.041, respectively. The fractions of the remaining reflector types exhibit much stronger variations during the 24 h interval. Their areas in the scenes therefore represent a key factor that impacts the diurnal course of the scattering function in this example.
The time series starts at 0:08 GMT when the EPIC image was covered mostly by the Pacific Ocean. Clouds and cloud-free ocean dominate the image. The cloud fraction is approximately a constant of about 0.6 between 0 and ~4 GMT (see also https://epic.gsfc.nasa.gov/?date=2016-08-23), whereas the area of cloud-free ocean, which acts as an absorber for all four bands, declines rapidly. The EPIC P λ increases at all wavelengths as Oceania gradually passes the image center. Between ~5 GMT and ~12 GMT Eurasia and then Africa appear in the EPIC image. The fraction of cloud-free surface (land and vegetation) increases to its maximum at about 8 GMT and then declines. At 443 nm, the EPIC scattering function drops to its minimum and then levels off from ~8 GMT to ~14 GMT. At 551, 680 and 780 nm, the land and vegetated surfaces reflect more radiation than the ocean. This results in an almost constant value of P λ at 680 and 780 nm and a weak decrease at 551 nm from ~8 GMT to ~12 GMT. Between ~12 GMT and ~17 GMT, the EPIC sees South America with a very large area of cloud-free Amazonian forests. The fractions of cloudy pixels (mean = 0.529, std. = 0.028) and cloud-free ocean (mean = 0.256, std. = 0.013) are almost constant. An increase in the fraction of vegetated land lowers the P λ at green, red and NIR. Clouds and cloud-free ocean dominate the EPIC image after ~18 GMT.
To summarize, the diurnal variation of the scattering function is determined by periodic changes in the surface-ocean ratio, which is consistent with the similar result documented in [15]. With fractional cloud cover and the fraction of cloud-free ocean constant, the ratio between pixels with cloud-free vegetation and total surface pixels is another factor that impacts the Earth’s reflectivity.

3.1.2. Estimates of the Scattering Function from Earth Orbiting Satellites (EOS)

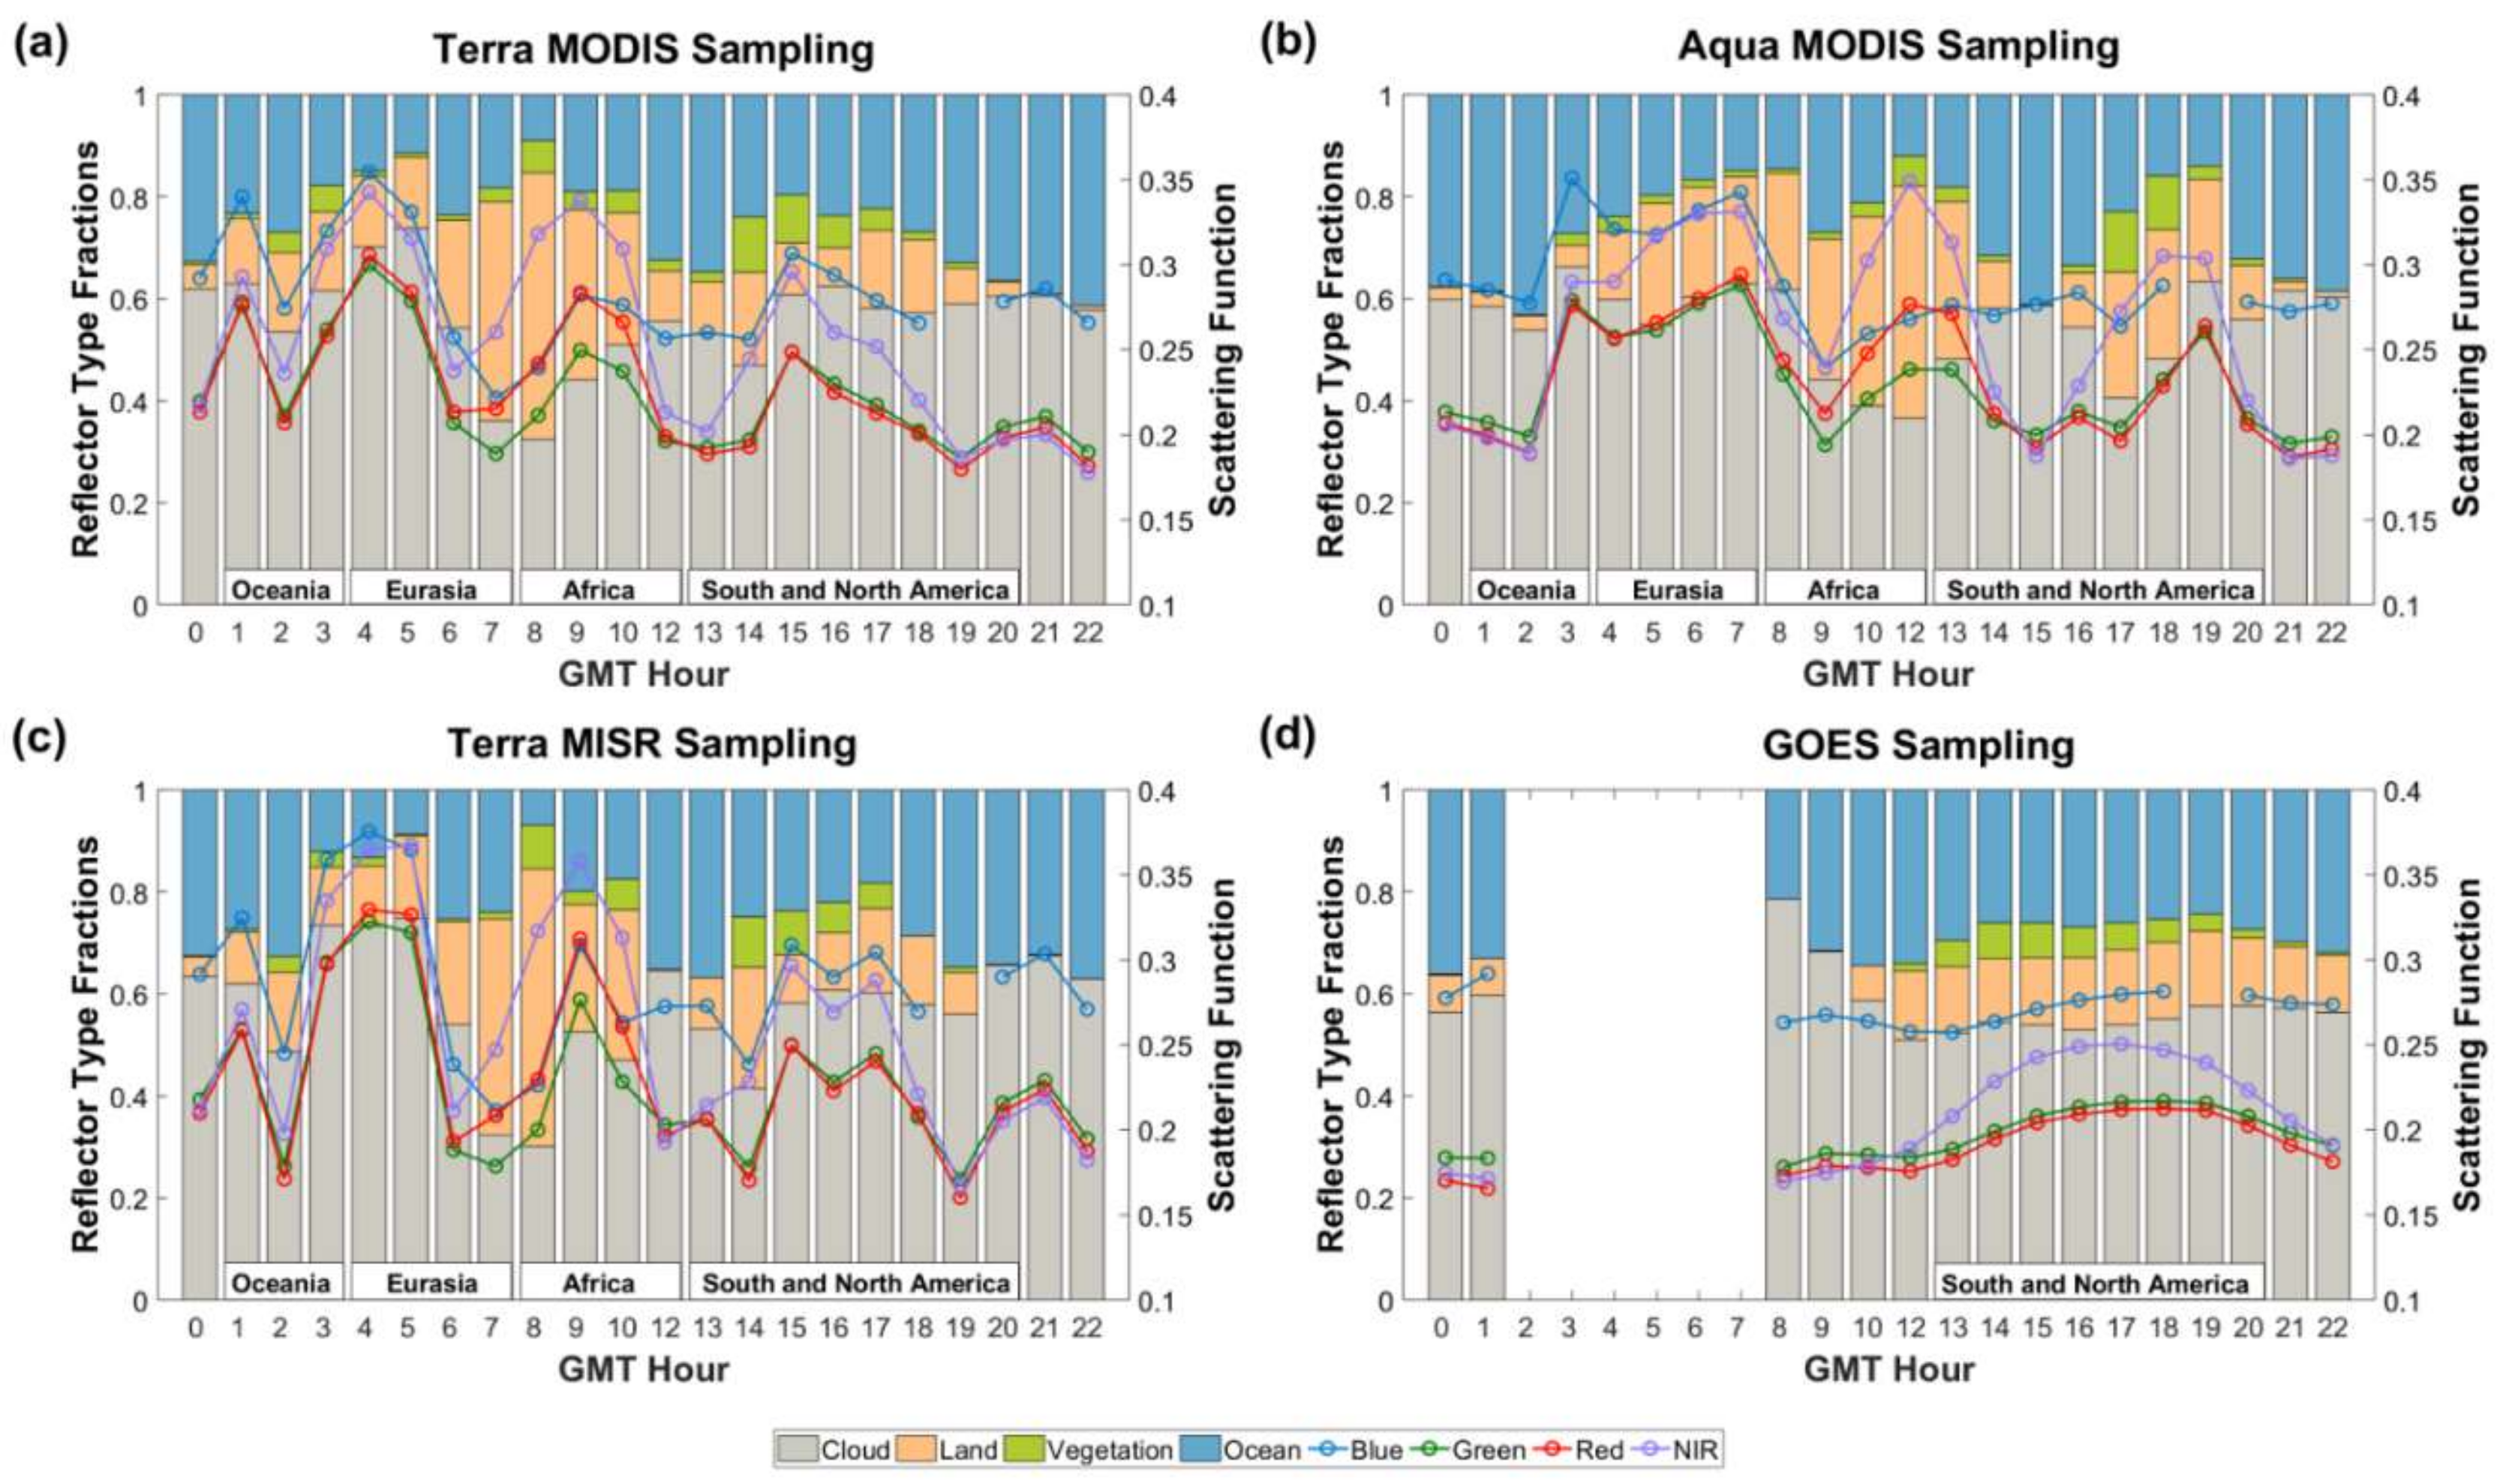
Figure 7 presents the diurnal course of the reflector type fractions and scattering functions at four spectral bands averaged over the sampling areas of the Terra/Aqua MODIS, Terra MISR and GOES-East sensors (Figure 1) on 23 August 2016. As expected, both the reflector type fractions and scattering function exhibit much stronger variation compared to the EPIC values (Figure 6). Table 2 shows the variation of the reflector type fractions for 23 August 2016. As one can see, the intrinsic sampling limits of the LEO sensors result in a strong discontinuity in the diurnal curves.
The cloud fractional cover from the LEO sensors shows the strongest discontinuity in diurnal variation. The cloud-free ocean and surface areas are smoother but still significantly differ from the reference curves. A much narrower MISR swath compared to that of Terra and Aqua MODIS causes wider spreads for the EPIC reflector type fractions. The GOES-East sampling area over-smooths the time series from 13 to 20 GMT. Their values are close to the EPIC estimates between 16 and 18 GMT, when the GOES-east sampling area covers about 70% of the EPIC image (Figure 3). The EOS estimated tendencies in temporal changes, however, differ significantly from their reference counterparts.
Diurnal course of EPIC scattering functions at all wavelengths are less changeable (Table 3) compared to a variation of the reflector type fractions (Table 2) on 23 August 2016. This does not hold for the LEO approximations: the magnitude of variation not only significantly exceeds that of the reference scattering function but also exhibits a stronger variation compared to the reflector types. The precision (std.) in the LEO diurnal average scattering functions were reduced with the lowest values for the MISR sampling (Table 3). The GOES-East estimates showed higher precision. All estimates of the Earth’s reflectivity from the EOS observations were biased: the LEO observing strategy tends to overestimate whereas GOES-East underestimates this variable. Biases in the LEO estimates increase with wavelength. This is a consequence of the lower diurnal variability of the EPIC reflectance at shorter wavelengths (Table 3), which remain the same for all seasons through the entire year [15]. Our examples illustrate that the EOS sampling strategies may not represent the Earth’s scattering variability and consequently may result in biased estimates of its daily average reflectivity.

3.2. Daily and Monthly Average Scattering Function

The Earth scattering function displays a strong daily cycle that correlates with a similar cycle in the surface–ocean ratio (Figure 6), especially in NIR, where oceans are dark. More details on this variability can be found in [15]. Here we focus on the understanding of how the EOS sampling strategies impact the daily and monthly estimates of the Earth’s scattering function.
The daily and monthly average reflector type fractions become less sensitive to the LEO sampling areas (Figure S1 in Supplementary Materials). This is not true for the GOES-East sensor, which significantly overestimates the EPIC fraction of vegetation by 62.8% (mostly due to Amazonian forests) and underestimates the bare land portion by 14.5–18.5% (Figure S1). Monthly courses of the Terra MODIS and MISR fractions are almost indistinguishable (Figure S1b,c), suggesting that the MISR sampling adequately represents its variability within the MODIS swath. Annual courses from all platforms display seasonal variation in the cloud-free surface with its maximum during summer time (right panels in Figure S1). This occurs because during the summer period the sunlit face of Earth is mostly in the northern hemisphere, where the surface area is larger and the probability of seeing it through clouds is consequently increased. On average, the EPIC and LEO sensors see about 59.9% of the Earth’s area covered by clouds (with an optical depth >2), and 25.4%, 13.1% and 1.6% of cloud-free ocean, bare land and vegetation during a year, respectively.
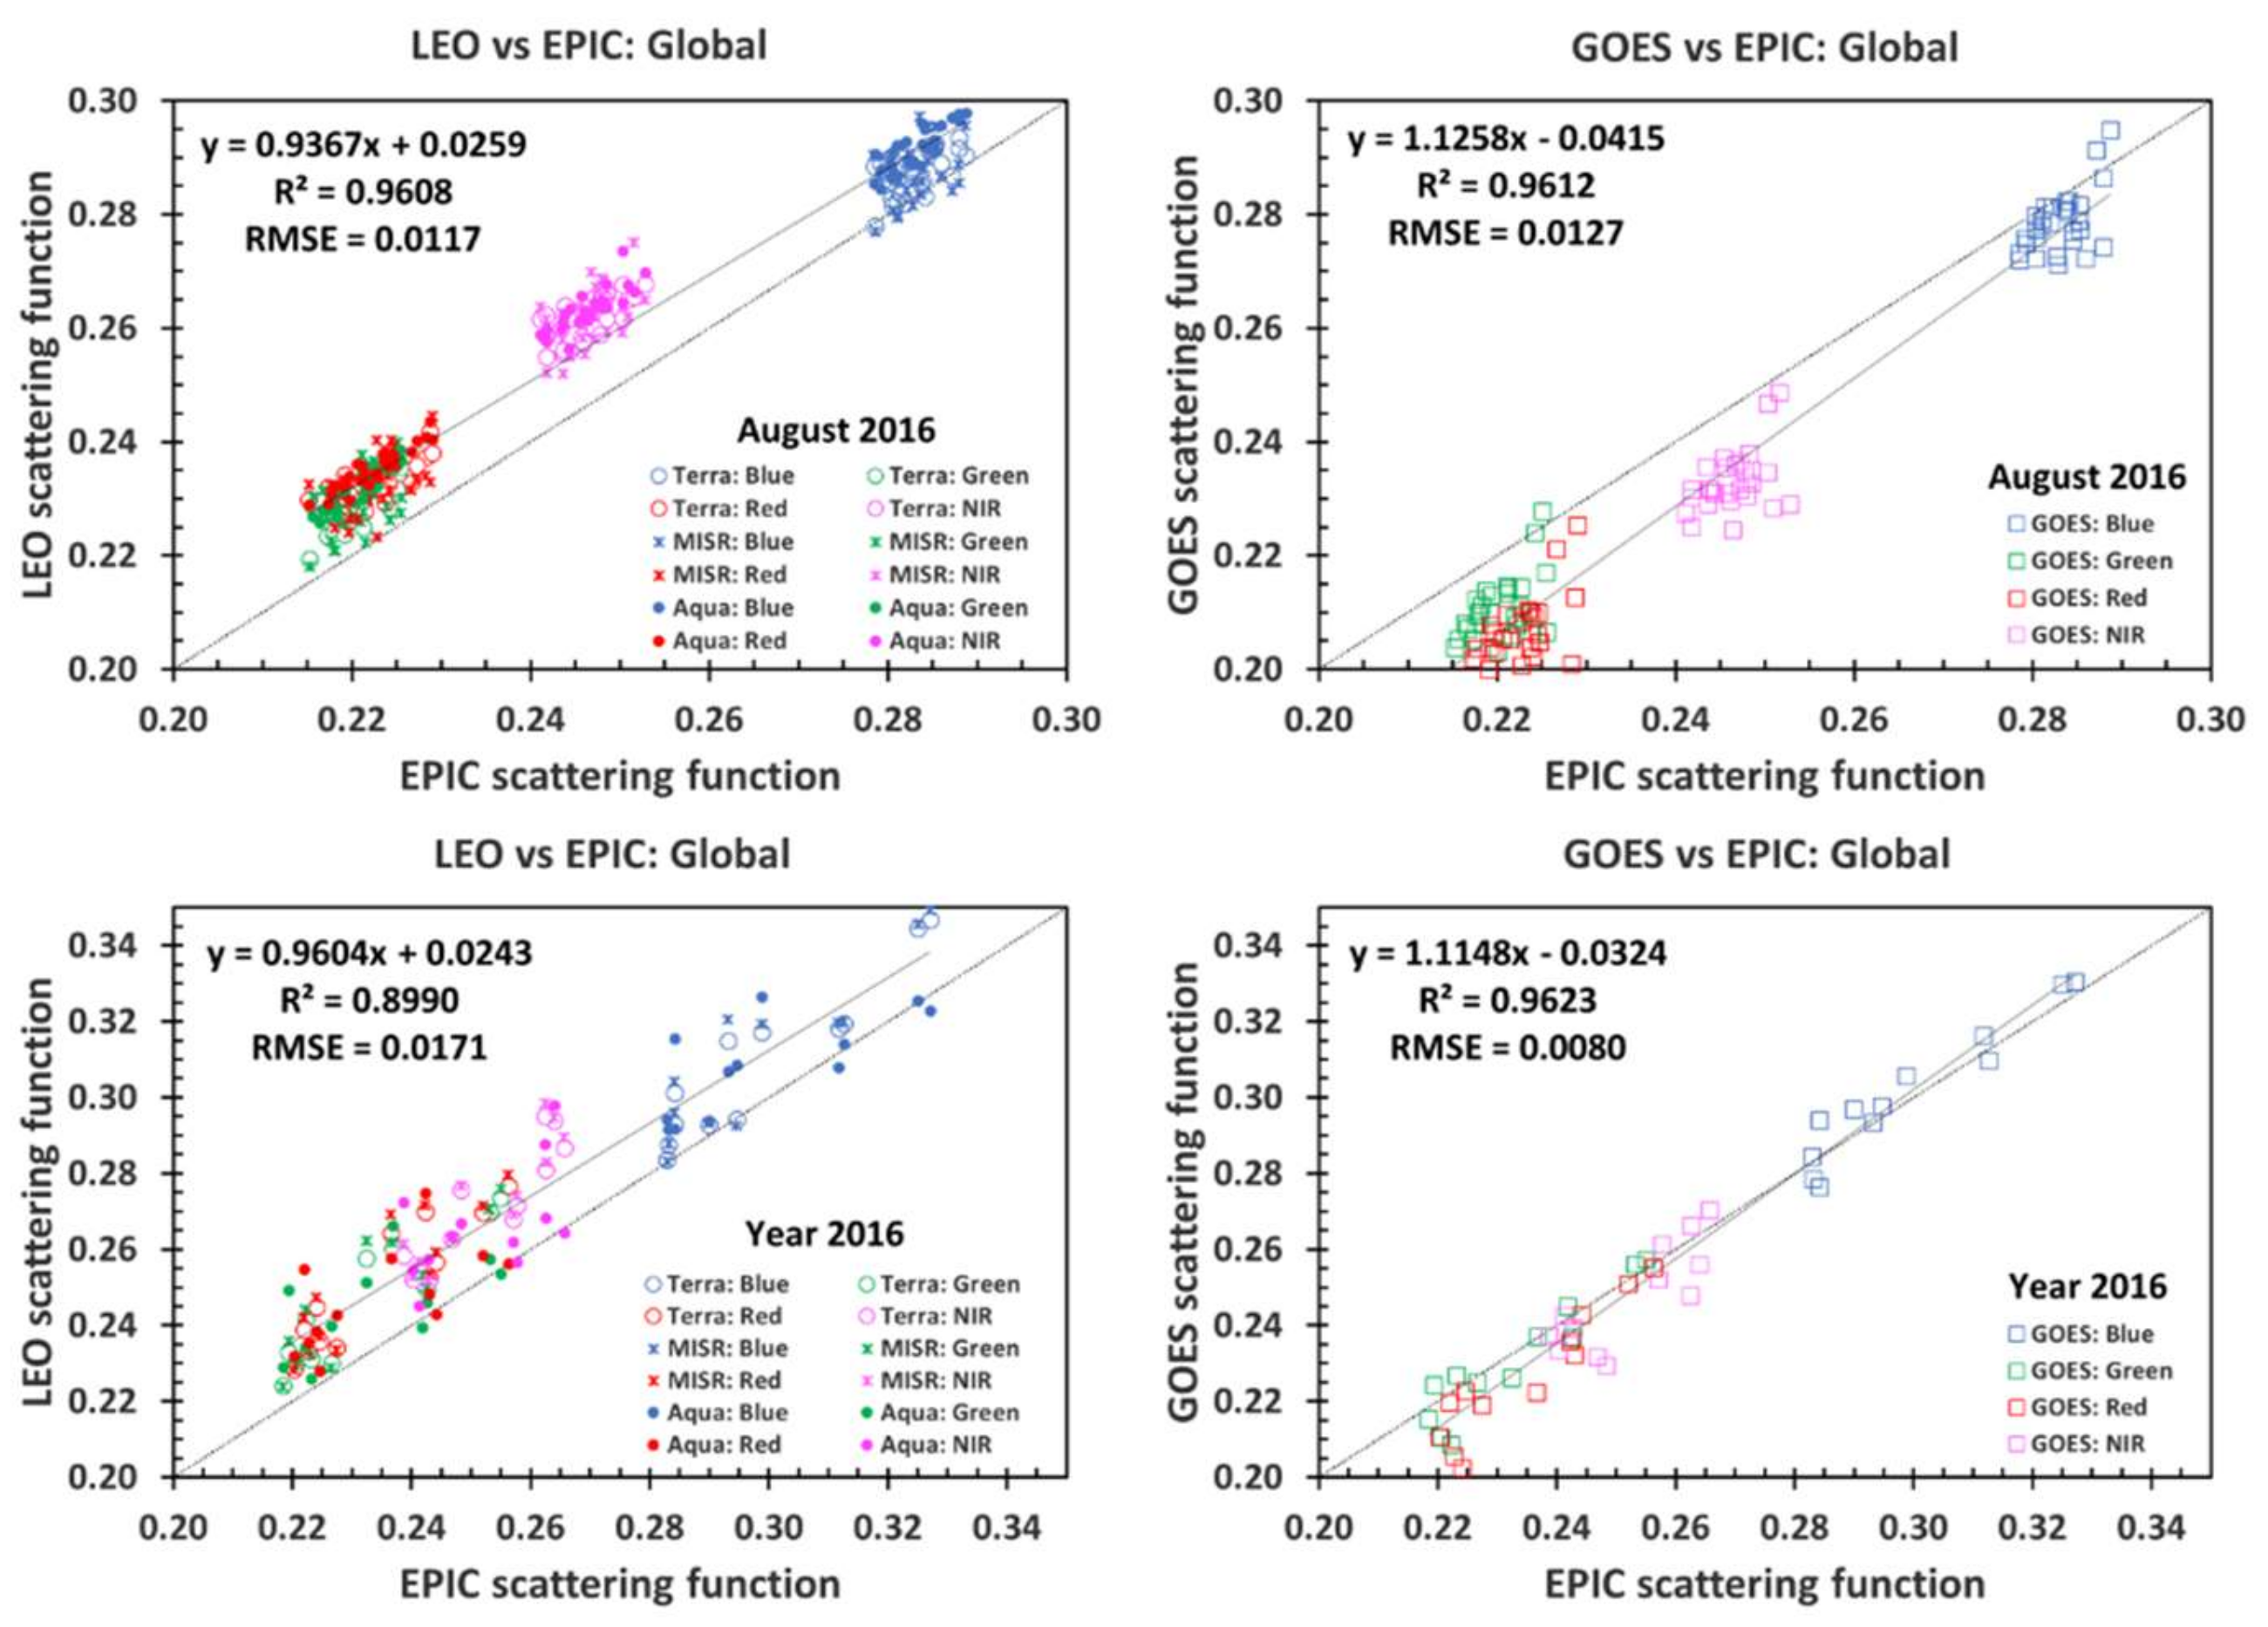
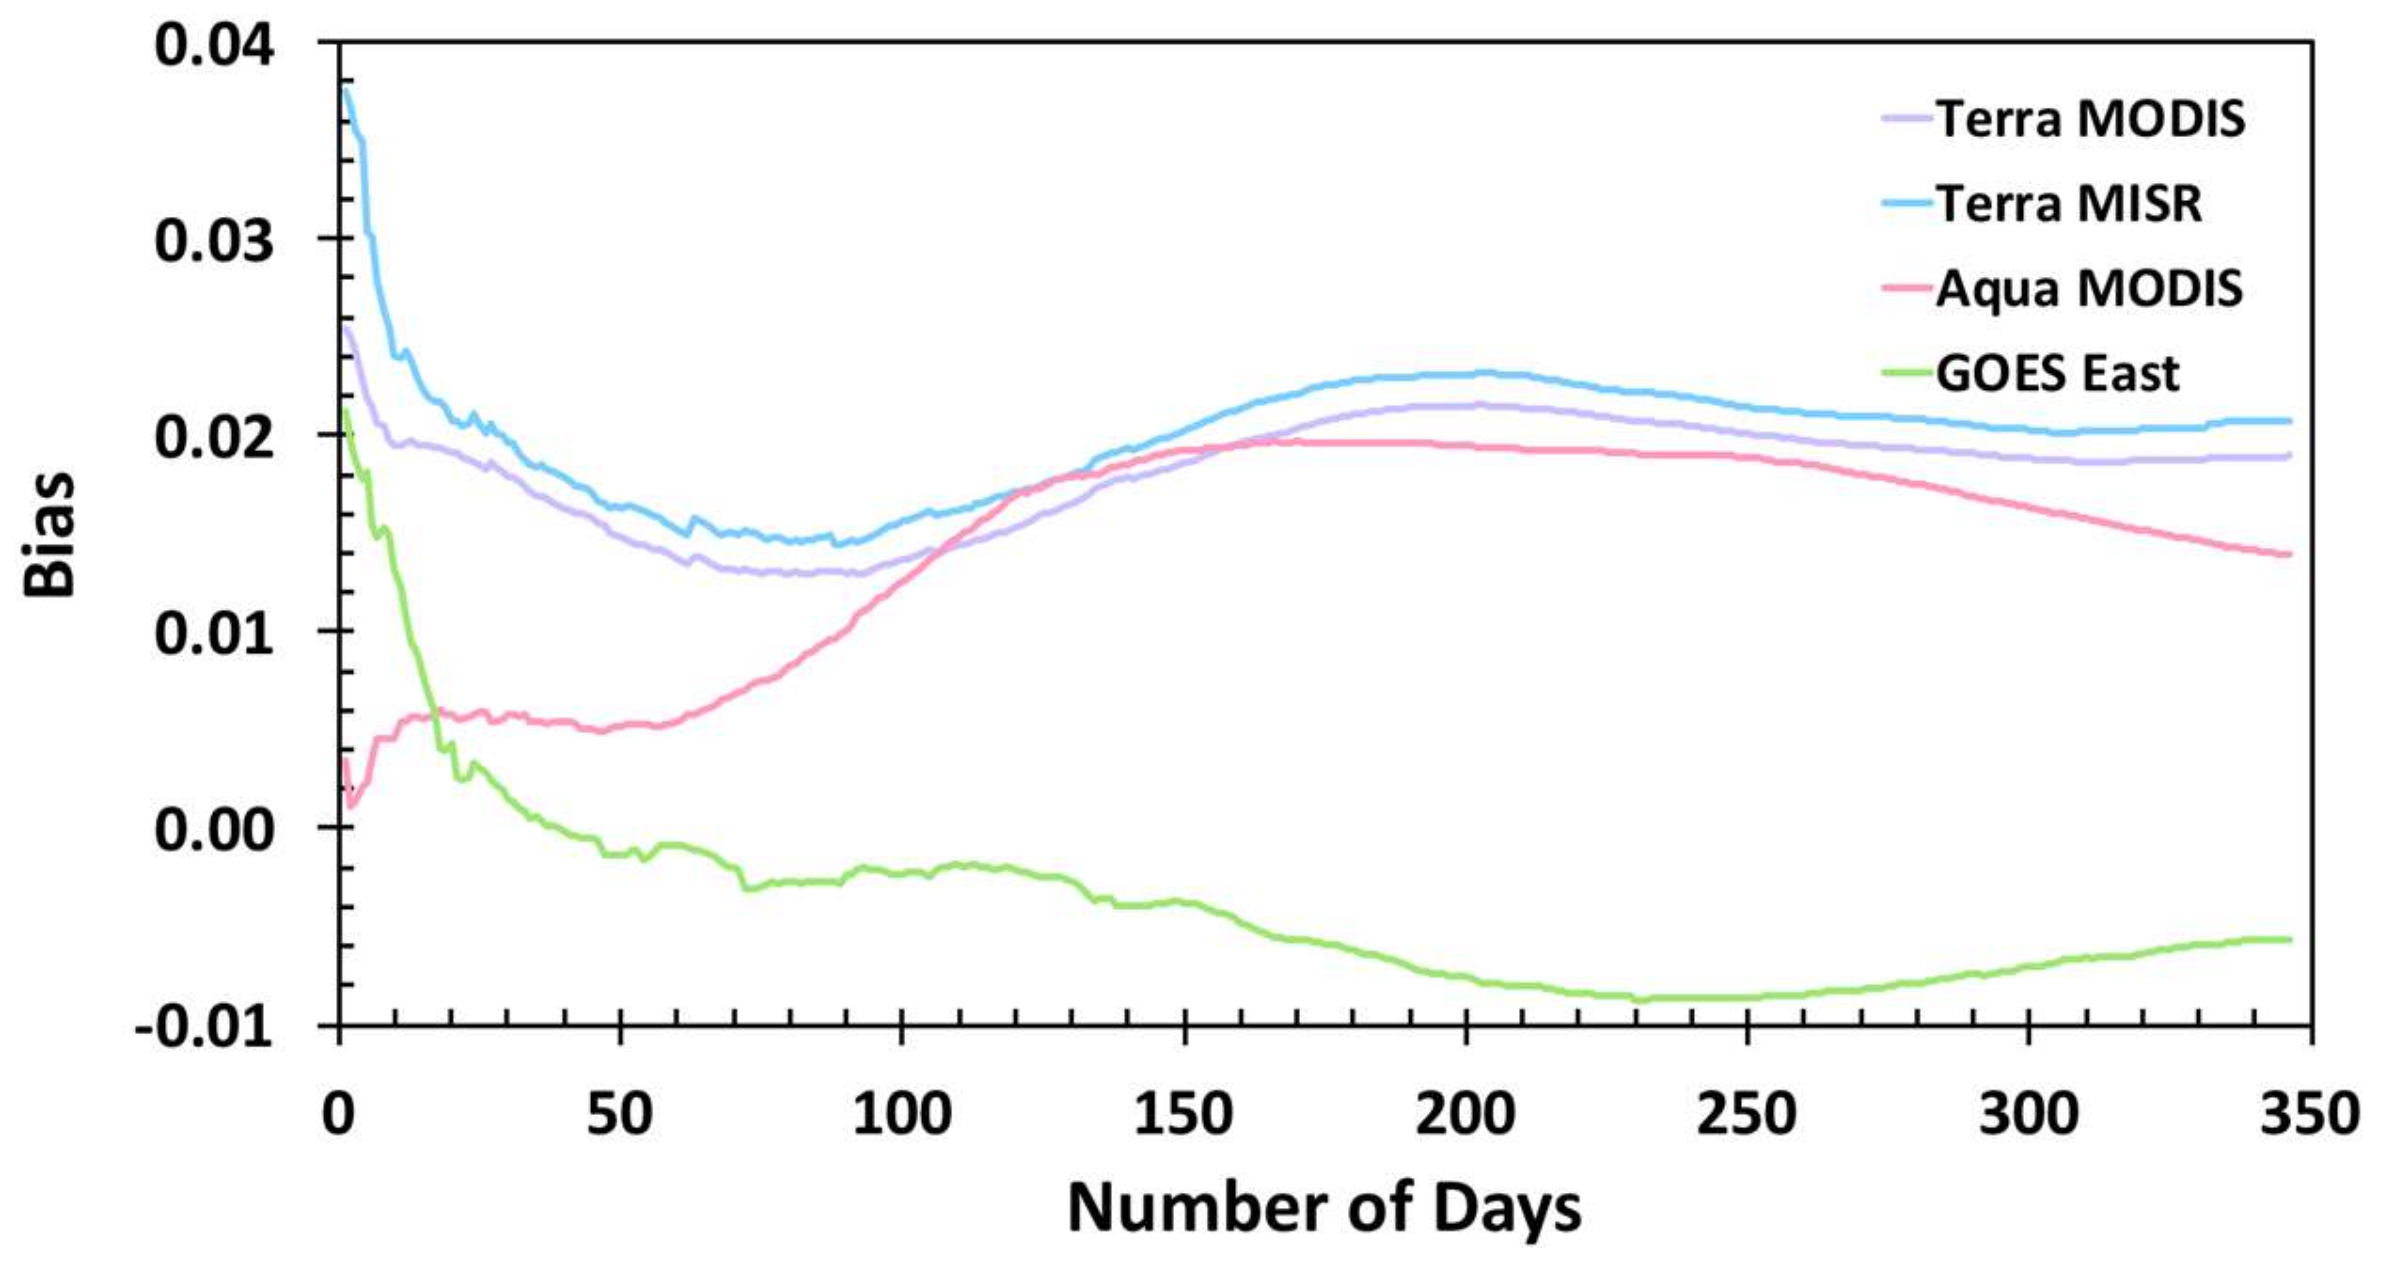
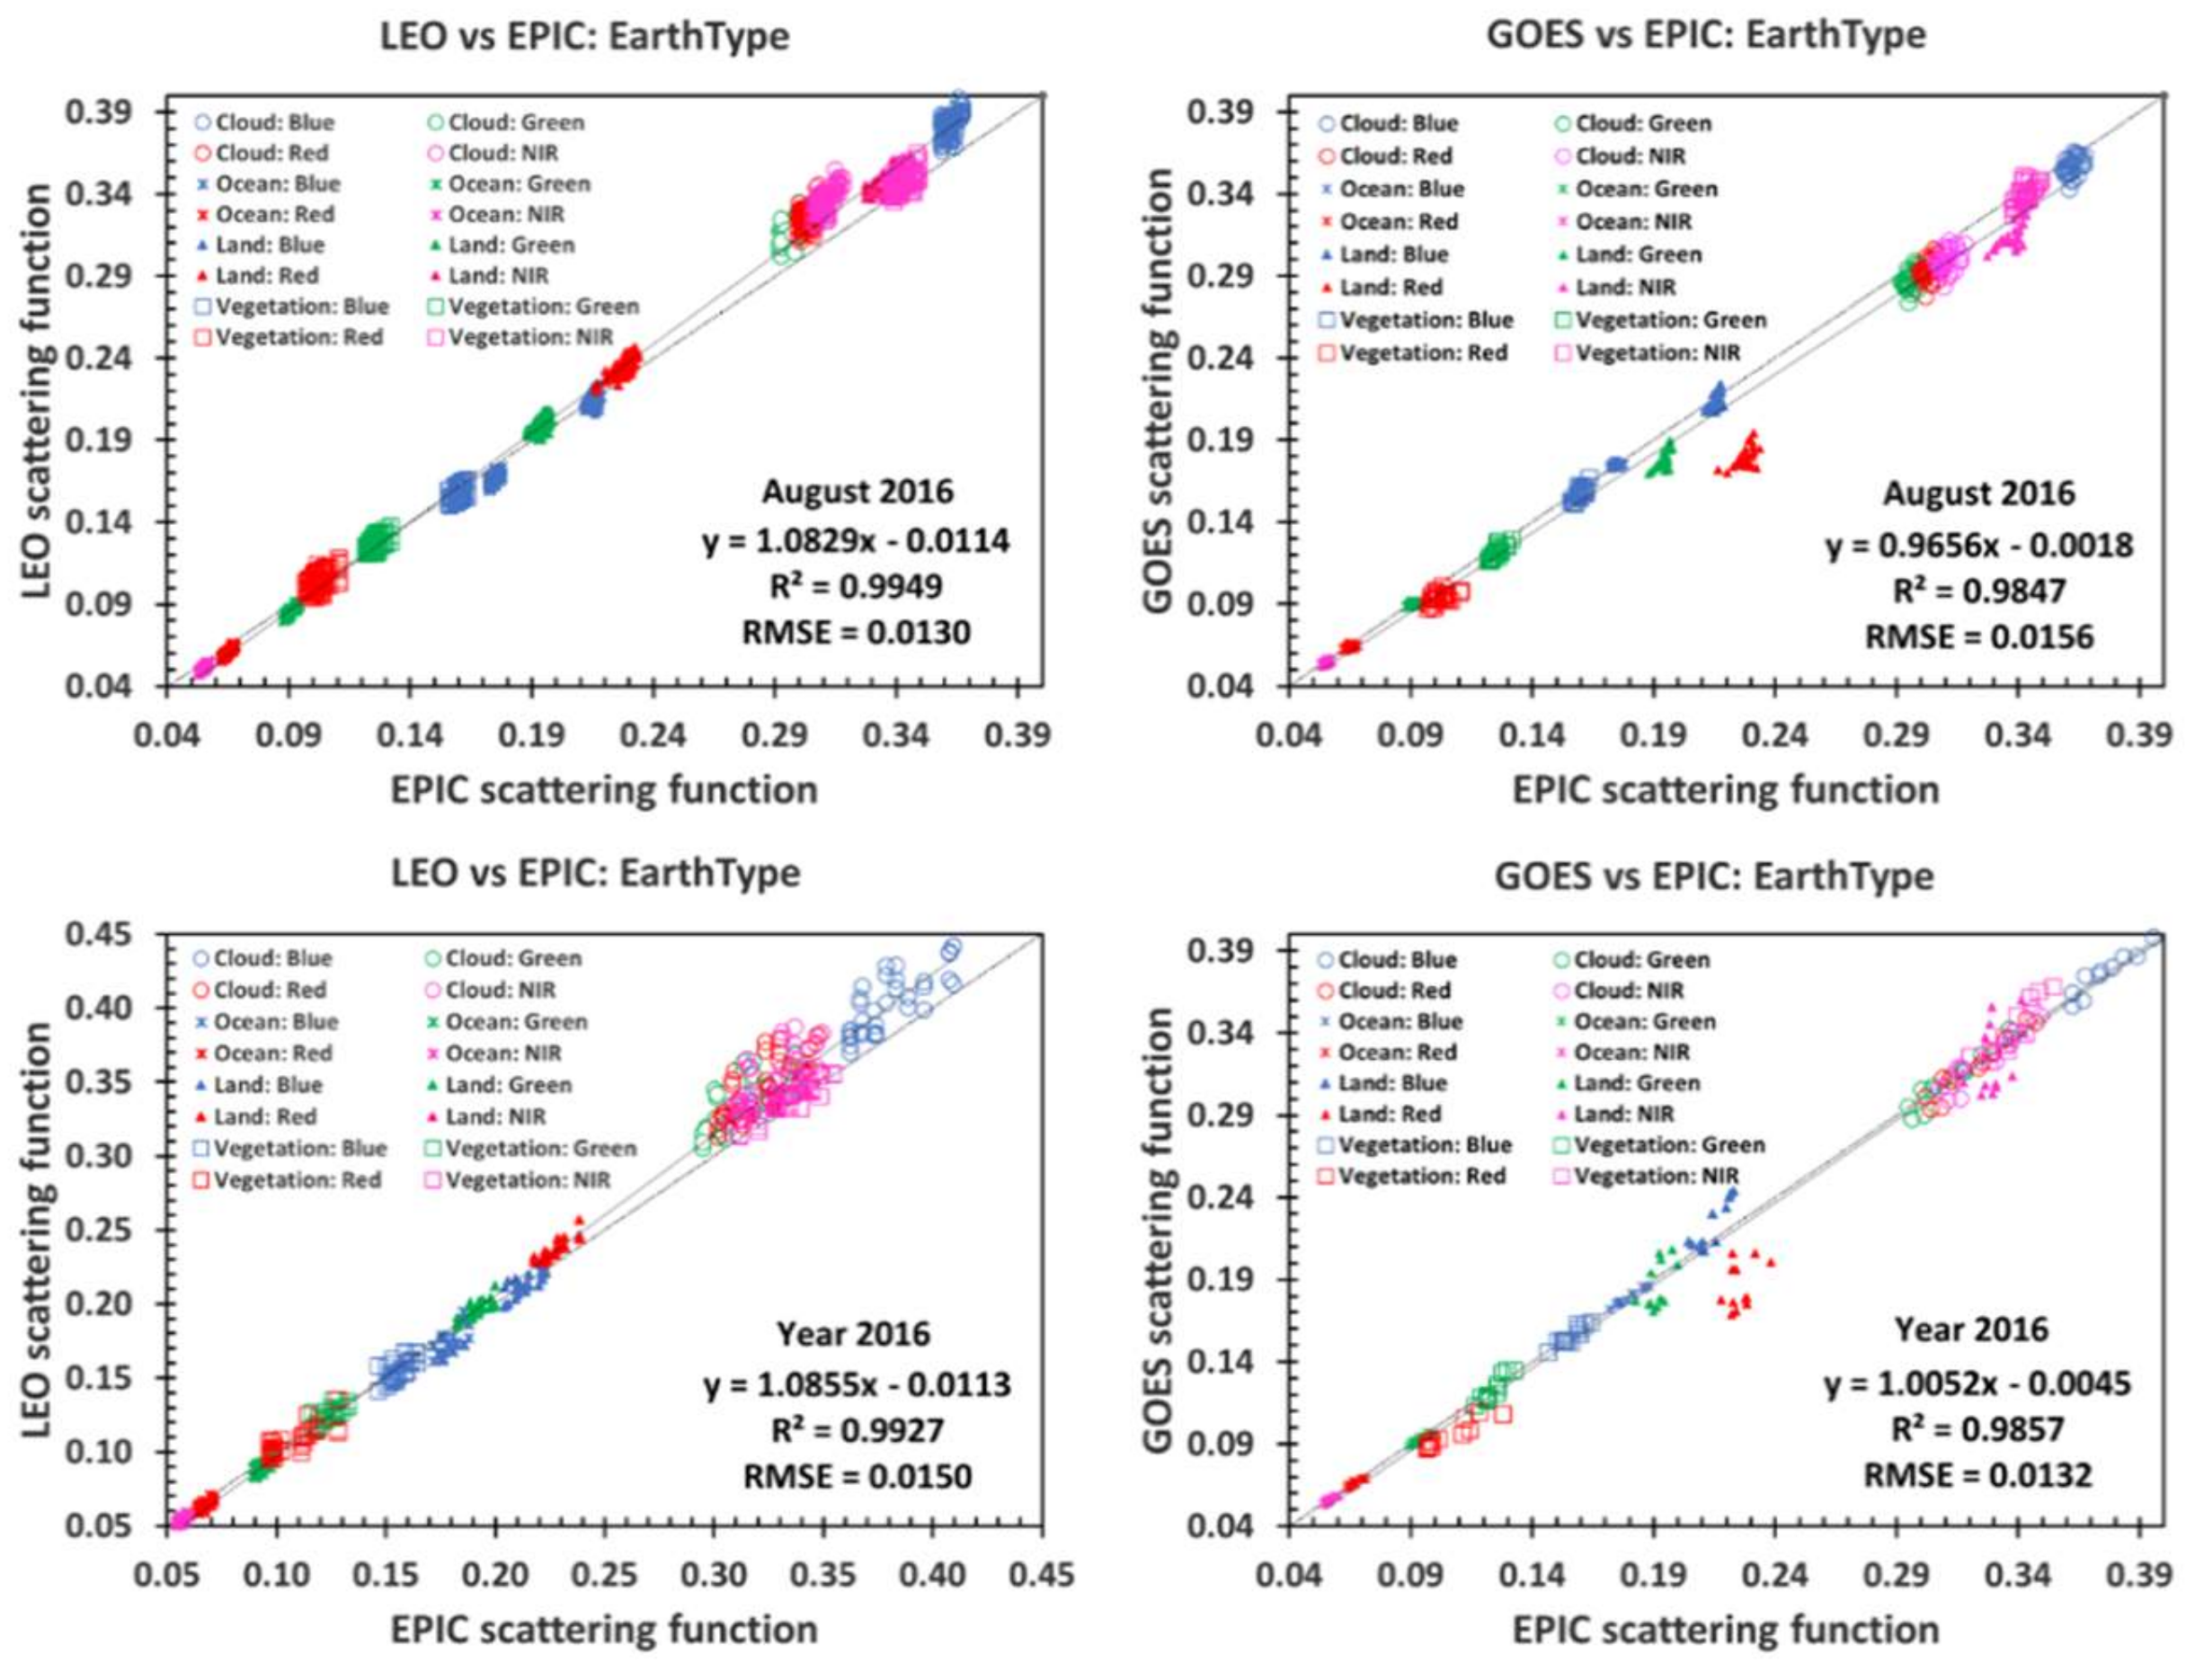
Unlike reflector type fractions, daily and monthly average scattering functions remain sensitive to the sampling area (Figure 8 and Figure S2 in Supplementary Materials). Overall, the LEO platforms tend to overestimate the daily and monthly mean Earth reflectivity while the GOES-East underestimates it due to its limited sampling area (Figure 8 and Figure S2). Figure 9 shows mean biases at 780 nm as a function of the averaging timescale. As one can see, the biases level off at an averaging time scale of about 165 days.
The Terra MODIS and MISR daily and monthly time series were very close. They overestimated the monthly (August 2016) and annual (2016) EPIC mean scattering functions at the blue, green, red and NIR spectral band by about 1.5–4.0%, 3.9–6.3%, 4.6–7.5% and 6.4–8.1%, respectively. The corresponding values from Aqua MODIS were also slightly higher for the monthly averages and annual means by 3.0–3.1%, 4.8–5.0%, 5.5–5.6%, 5.6–6.7%. The bias between LEO and EPIC could be due to the different Earth component fractions present in the EPIC images. The LEO sensors see more bare land and vegetated pixels and less ocean pixels than EPIC (Figure S1), resulting in a higher reflectivity. All monthly average scattering functions exhibit seasonal variation (Figure S2). They show a decrease until reaching the first minimum around April and then an increase from April to May, with another decrease and increase from May to December with local minima in July–September. A similar result was documented in [15]. They also noted that the relative variabilities at longer wavelengths are much smaller between November and March than at other times, which is consistent with our analyses. This occurs because during this period the sunlit face of Earth is mostly in the southern hemisphere (Figure 5a in [15]), and the impact of diurnal variations in the surface fraction is weaker. The LEO estimates of Earth reflectivity are much closer to the EPIC scattering function during this period.

3.3. Reflectivity of Earth Components

How accurate are EOS estimates of the reflectivity of clouds, cloud-free ocean, land, and vegetation? Both reflectivities of the Earth’s components and their areas present in the EPIC image are key factors that impact the Earth’s scattering function. Here we analyze the scattering functions over the reflector types and sampling areas. The ERTI index was used to estimate the reflector type areas.
Clouds reflect more radiation, while oceans absorb more than the Earth’s other components. The spetral reflectivity of the bare land and vegetation vary between these two extrema. Overall, the LEO platforms tend to overestimate the daily and monthly mean reflectivity of the Earth’s components while GOES-East underestimates it (Figure 10, and Figures S3 and S4 in Supplementary Materials).
Figure S3 demonstrates the daily and monthly average scattering functions over clouds and cloud-free oceans for different sampling areas. The daily reflectivity does not vary much within a month (August 2016). On average, the LEO samplings tend to overestimate the daily mean reflectivity of clouds at all spectral bands by about 7.2%, whereas GOES underestimates its value by 2.8%. The fractional cloud cover exhibits a strong hourly variation within the LEO sampling areas (Figure 7). Data acquired at a specific LST over sensor paths, therefore, may not be sufficient to accurately estimate the daily mean cloud reflectivity. The daily average ocean reflectivity is less sensitive to the sampling area (Figure 10 and Figure S3b).
Cloud reflectivity shows seasonal variations at all wavelengths (Figure S3a) and for all sensors. This seasonality comes from different cloud properties over the ocean in the northern and southern hemispheres [15], with their approximately equal contributions around the two equinox dates of 22 September and 20 March 2016. The EPIC Normalized Difference Vegetation Index (NDVI) of clouds varies between 0.003 and 0.012, as expected (Figure 11a). LEO observations may overestimate the magnitude of the seasonal variation in cloud reflectivity with a maximum difference in May–June when the fraction of the southern ocean reaches its minimum (Figure 5 in [15]). On average, the Terra MODIS, MISR, and Aqua MODIS samplings overestimate the annual mean cloud reflectivity by 7.4%, 8.4%, and 6.6%, respectively, while their GEOS counterpart underestimates the mean by 1.9%.
Ocean scattering functions exhibit a similar but weaker seasonality (Figure S3b), suggesting different reflective properties of the northern and southern parts of the ocean due to phytoplankton, salinity, pollutant content, etc. The EPIC NDVI of the ocean varies between −0.043 and −0.125 (Figure 11a). The annual average ocean reflectivity from the LEO (GOES) satellites was below (above) the reference values by 3.2–5.2% (0.2–1.1%).
The reflectivity of the cloud-free bare and vegetated land was relatively stable within a month (Figure S4 in Supplementary Materials). The scattering function of the cloud-free vegetation followed the spectral signature of green leaves, i.e., local maxima at the green wavelengths during August (~0.132), local minimum at red (~0.111), and absolute maximum at NIR (~0.349) (Figure 10 and Figure S4b). The LEO monthly and annual surface reflectivity differed from the reference EPIC results by 5.0 % to +1.5% (land) and 6.4 % to 3.0% (vegetation) for all spectral bands. The GOES significantly underestimated the monthly mean land reflectivity at green (~9.0%), red (~21.6%) and NIR (~7.0%) spectral bands and agreed with the EPIC value within ~1.1% at blue (Figure 10 and Figure S4a). The bias between the GOES and EPIC surface reflectivity could be due to stronger variations in the land cover types over the globe compared to that over North and South America. The annual average reflectivity of bare and vegetated land differed from their EPIC counterparts by 4.0 % to 17.6% with a maximum at the red spectral band.
The monthly average land and vegetation scattering functions exhibited seasonal variability (Figure S4). The optical properties of bare land at all wavelengths covaried with cycles of wet and dry seasons in the equatorial zone. From May to October, its reflectivity was an average over moist soil during the wet season in northern part of the equatorial zone and a brighter rainless area during the dry season in the southern part. The wet and dry seasons reversed in the southern and northern parts from October to May, resulting in a second cycle in land reflectivity. A decrease (September to January) and increase (February to August) in the surface fraction on the sunlit image of the Earth impacted the magnitude of the cycles [36,37,38,39]. As expected [40], the NDVI of bare land clearly showed this seasonality (Figure 11b). Its value varied between 0.176 and 0.195. The EPIC estimates of the annual mean reflectivity of bare land at the blue, green, red and NIR bands were 0.214, 0.192, 0.226 and 0.330, respectively. The LEO estimates differed from the reference by 0.8–4.8%. Overall, GOES significantly underestimated the mean values at all wavelengths by about 4.5%.
The time series of the monthly average EPIC reflectance of vegetated land at the green, red and NIR bands displayed different patterns, with a plateau between May and September (Figure S4). The monthly course of the EPIC NDVI significantly differed from its land counterpart (Figure 11b). It rose from February until reaching a plateau in May and then declined from September to February. This feature indicates that there are more green leaves during the boreal summer. The annual mean reflectivity of vegetated land from EPIC at the blue, green, red and NIR bands were 0.156, 0.124, 0.106 and 0.335. Terra MODIS and MISR agreed with the reference within 1.1–2.3%, Terra Aqua overestimated it by 1.0–4.7% and GOES differed from it by −1.2–9.6% at all wavelengths.
Finally, how much solar energy was scattered back to space by clouds, ocean, land, and vegetation? Table 4 shows their contributions to the EPIC annual average scattering function. As expected, the Earth’s reflectivity at all EPIC wavelengths was mainly determined by clouds in the image. Contributions from other components depended on the wavelength and their fractions. Compared to EPIC, the LEO estimates showed a higher contribution from clouds (by 1.5~2.8%) and bare land (2.2–4.3%) but a lower contribution from ocean (9.6–14.6%). GOES overestimated the contribution of clouds (by 2.2%) and ocean (3.9%) and underestimated that from bare land (21.9%). In the case of vegetation, the Terra MODIS/MISR and GOES estimates were above the EPIC values by 26.0–64.4%, while Aqua MODIS was lower by 11.1%.

3.4. Bidirectional Effects

A distinguishing feature of the EPIC observing strategy is that the phase angle is nearly constant at every image point. In this geometry, the scattering function accurately approximates the geometric albedo, which is free of Sun-sensor geometry effects. Its spectral and temporal variations, therefore, are directly related to variations in the properties of our planet and consequently convey information useful to detecting and monitoring its changes due to climate and anthropogenic influences and feedback processes. With the Sun-sensor geometry constant, data from EOS sensors approximate the Earth’s reflectivity. Its accuracy depends on the sensor sampling area. On average, the LEO spatial and temporal samplings tend to overestimate, while the GEO underestimates the Earth scattering function (Figure 8).
In our analyses, the Sun-sensor geometries for the EPIC and EOS sensors were the same. In reality, the angular samplings of the LEO sensors can vary significantly. Figure 12 illustrates the distribution of the Terra MODIS/MISR phase angle for the Amazonian rainforest in June–July and September. The geometry in terms of solar and view directions during the year in this area is cyclical with a period of six months. The Terra/Aqua MODIS sensors measure our Earth-atmosphere system close to the orthogonal plane around the solstices (June/July, December/January), and near the principal plane around the equinoxes (September/October and February/March). This imbues the satellite data with Sun-sensor bidirectional effects, which represents an additional source of noise or error. The interpretation of such data requires the use of models to correct or normalize the measurements to a fixed Sun-sensor geometry. The models are based on a number of assumptions that introduce model uncertainties, in addition to sampling errors.
There is an important, noteworthy feature in the distribution of the MODIS and MISR phase angles. The Terra MISR along-track angular sampling follows its MODIS counterpart, but is shifted by about 90°. It, however, views the Earth with nine cameras simultaneously as opposed to the MODIS sensor which is capable of only one view. This allows us to obtain the reflectance of each pixel in nine well-separated phase angles during a year. The distribution of MODIS phase angles results from their accumulation over different pixels located in a 2330 km width swath across the satellite ground track. In other words, different phase angles may come from pixels with different reflector types. The interpretation of MISR data, therefore, is less model-dependent. More details on the seasonal changes in Terra MODIS/MISR and Aqua MODIS Sun-sensor geometries in the equatorial zone can be found in [41].
The DSCOVR EPIC sensor measures the radiance reflected by Earth in the direction in which the scattering function varies around its maximum. For an ideal Lambertian sphere, the scattering function accounts for about 2 / 3 π   (~21%) of the total radiant energy reflected in all directions (see Equation (2)). The estimation of the Bond albedo requires values of the scattering function at a sufficiently wide range of phase angles. The MISR sensor provides a good dynamic range for this variable within the equatorial zone (Figure 12). Concurrent Terra MISR and DSCOVR EPIC data can potentially be used to extrapolate the MISR observations from the equatorial zone to the entire sunlit Earth and estimate its Bond albedo.
Thus, the EPIC scattering function is free of Sun-sensor geometry effects and conveys information about properties of the Earth-atmosphere system. Two types of uncertainties should be accounted for in estimating the Earth’s reflectivity using data from LEO satellites. The first arises from their spatial and temporal sampling. The second is due to the Sun-sensor bidirectional effects.

4. Summary and Conclusions

The Earth’s reflectivity is among the key parameters that describe climate forcing and the associated response of the climate system. Sensors onboard earth orbiting satellites (EOS) acquire radiance data over swaths at a specific local solar time (LST) or over a specific area of the Earth (Figure 1). This introduces a source of uncertainties in the estimation of the Earth’s reflectivity. The purpose of this study was to analyze possible errors in its estimates from EOS data.
The DSCOVR EPIC provides spectral images of the entire sunlit Earth in the near backscattering direction every 65 to 110 min. We estimated the Earth’s scattering function, which in turn is an accurate approximation of the geometric albedo. This variable is free of Sun-sensor geometry effects and directly related to the properties of the Earth’s atmospheric system. The sampling areas of Terra MODIS, MISR, Aqua MODIS and GOES-East instruments (Figure 1) were used to represent the EOS data. We derived the scattering function over their sampling areas using EPIC data. The difference between the EOS and EPIC estimates were taken as a measure of the uncertainties in the estimation of the Earth’s reflectivity.
Our idealization of the Earth’s atmospheric system included four components: clouds and cloud-free ocean, land, and vegetation. We developed an Earth Reflector Type Index (ERTI), which discriminated signals originating from different Earth components. The very distinct spectral behavior of the single-scattering albedo in the Earth’s components underlies its physical basis. They are related to the reflectivity of cloudy and cloud-free scenes via a spectrally invariant relationship. Spectral and temporal variations of the ERTI-based estimates of the reflectivity of these four components followed the regularities expected from physics (Figure 5 and Figure 11).
As expected, the diurnal courses of the scattering function and fraction of the components present in images of the sunlit Earth estimated from EOS data differed significantly from the reference EPIC values (Figure 6 and Figure 7). The daily variability of the reflector type fraction estimated from low-earth-orbiting (LEO) satellites exceeded its EPIC counterpart by 3–6.5 times (Figure 7 and Table 2) with the strongest discontinuity in fractional cloud cover. The corresponding scattering functions showed stronger variation. Geostationary-orbiting (GEO) sampling over-smooths all diurnal curves (Table 2 and Table 3) and their tendencies differ from EPIC.
The daily and monthly average reflector type fractions were less sensitive to the sensor sampling area (Figure S1 in Supplementary Materials). Over the course of a year, the EOS (EPIC) sensors see about 60% (59.7%) of the sunlit Earth’s area covered by clouds and 25–27% (26.4%), 10–13% (12.5%), 1–2% (1.4%) for cloud-free ocean, bare land and vegetation, respectively. Their contributions to the annual average scattering function depend on the wavelength and vary between 76% and 85% (76% and 82%), 5% and 16% (6% and 16%), 8% and 17% (9% and 16%), 0.5% and 3% (0.6% and 1.8%) for the four components, respectively (Table 4).
The LEO sensors tend to overestimate the daily and monthly average scattering function by about 2–4% (blue), 4–6% (green), 5–8% (red) and 6–8% (NIR). The difference increases with wavelength. The GEO underestimates scattering functions by 1–8%. Although the seasonal variations in the EOS monthly average scattering functions agreed with the EPIC estimates, their magnitudes can exceed the EPIC values by 14.8% (Figure 8 and Figure S2 in Supplementary Materials).
On average, the LEO sensors overestimate (underestimate) the monthly and annual cloud (ocean) reflectivity by 5–9% (3–7%). The GEO estimates of cloud and ocean reflectivity agree with EPIC within 4% (Figure 10 and Figure S3 in Supplementary Materials). The LEO monthly and annual surface reflectivity differed from EPIC estimates by 5 % to 1% (land) and 6 % to 3% (vegetation). The GEO underestimates monthly land reflectivity by 1–22%. The annual average reflectivity of land and vegetation differed from their EPIC counterparts by 4 % to 18%. The EOS and EPIC cloud and ocean reflectivity showed similar seasonal variations. This also holds for the Terra MODIS, MISR estimates of land and vegetation reflectivity (Figure 10 and Figure S4 in Supplementary Materials).
Overall, the EPIC observations illustrate that diurnal, daily and monthly variations in the Earth’s reflectivity are mostly determined by the distribution of clouds. The cloud fractions from measurements around noon (10:30 a.m. Terra MODOS/MISR, 1:30 p.m. Aqua MODIS) may disagree with the daily average. Thus, sampling areas of the LEO sensors may not be sufficient to represent cloud variability and consequently may impact estimates of the Earth’s reflectivity. Two types of uncertainties should be accounted for in estimating the Earth’s reflectivity using data from LEO sensors. The first arises from their spatial and temporal sampling. The second is due to the Sun-sensor bidirectional effects. Our assessments refer to estimates based on a simple averaging of EOS-like data. Analyses of various approaches to the extrapolation of the EOS observations to the entire sunlit Earth that would minimize the sampling effects is another important research problem in which the DSCOVR EPIC observations play a key role.

Supplementary Materials

The following are available online at https://www.mdpi.com/2072-4292/10/10/1594/s1. Figure S1: Daily and monthly average reflector type fractions for all samplings in August 2016 and the entire Year 2016. Figure S2: Daily and monthly average scattering functions for all samplings for August 2016 and the entire Year 2016. Figure S3: Daily and monthly average scattering functions over clouds and cloud-free ocean for all samplings for August 2016 and the entire Year 2016. Figure S4: The same as Figure S3 except for cloud-free land and vegetation.

Author Contributions

W.S., Y.K., G.W. and A.M. conceived and designed the experiments; W.S. and Y.K. performed the experiments; W.S., Y.K., G.W. and A.M. analyzed the data; and all authors wrote and modified the paper.

Funding

This research received no external funding

Acknowledgments

The NASA/GSFC DSCOVR project is funded by NASA Earth Science Division. W. Song, G. Yan, and X. Mu were also supported by the key program of National Natural Science Foundation of China (NSFC; Grant No.41331171). This research was conducted and completed during a 13-month research stay of the lead author in the Department of Earth and Environment, Boston University as a joint Ph.D. student, which was supported by the Chinese Scholarship Council (201606040098). DSCOVR EPIC L1B data were obtained from the NASA Langley Research Center Atmospheric Science Data Center. The authors would like to thank the editor who handled this paper and the two anonymous reviewers for providing helpful and constructive comments and suggestions that significantly helped us improve the quality of this paper.

Conflicts of Interest

The authors declare no conflict of interest.

Appendix A. Comment on Equation (2)

Equation (1) coincides with 2 Γ ( Ω 0 , Ω ; ρ , 0 ) , where Γ ( Ω 0 , Ω ; ρ , τ ) is the Ross–Nilson area scattering phase function for bi-Lambertian spherically oriented leaves [42], p. 140,
2 Γ ( Ω 0 Ω ; ρ , τ ) = 1 π 4 π | ( Ω 0 , Ω n ) ( Ω , Ω n ) | γ L ( Ω n , Ω 0 , Ω ) d Ω n .
Here γ L is the leaf scattering phase function which takes the value ρ λ if ( Ω n , Ω ) ( Ω 0 , Ω ) < 0 , and τ λ otherwise; ρ λ and τ λ represent leaf reflectance and transmittance [42] (pp. 135–136). It was shown that Γ depends on the scattering angle β = ( Ω 0 , Ω ) and is given by [42] (p. 257),
  Γ ( β ,   ρ , τ ) = ρ λ + τ λ 3 π ( sin β β cos β ) + τ λ 3 cos β .
Equation (2) is obtained by putting τ λ = 0 and β = π γ .

Appendix B. Properties of the ERTI

Solving Equation (5) for BRF one obtains
  B R F λ ( Ω 0 , Ω ) = ω λ ( 1 p ) 1 ω λ p   · K ( Ω 0 , Ω ) 1 p = W λ · D A S F ( Ω 0 , Ω ) .
Here W λ , is the canopy scattering coefficient, which is the fraction of canopy-intercepted radiation that has been reflected from, or diffusely transmitted through, a medium [22,43]. Obviously, W λ varies between 0 and 1. This takes place if and only if p 1 . The second factor, DASF, is the directional area scattering factor, which describes the fraction of photons exiting the medium in the direction Ω relative to the total number of medium leaving photons (which is given by W λ ) [22,26].
At a weakly absorbing wavelength, any two SSA, say ω λ and ω 0 , λ , are related via spectrally invariant relationship as [23,26,27,44]
ω λ = ω 0 , λ ( 1 p 0 ) 1 p 0 ω 0 , λ ,
where p 0 is a parameter that depends on leaf internal constituencies in the vegetation and sizes of water droplets and in clouds. Details can be found in [20,23,26].
Obviously, the substitution of Equation (A4) into Equation (A3) does not change the BRF value. This, however, results in a transformation of the first and second factors in Equation (A3) into
W λ = ω 0 , λ ( 1 p ¯ ) 1 ω 0 , λ p ¯ ,     D A S F = K ( 1 p 0 ) ( 1 p ) ( 1 p 0 ) ,
where 1 p ¯ = ( 1 p ) ( 1 p 0 ) . This transformation and its various applications are discussed in the above-cited papers.
The transformation has two important properties. First, the DASF does not change: the additional term ( 1 p 0 ) just cancels. Second, the scattering coefficient is expressed via a new SSA and p ¯ . The following identity takes place
  W λ = ω λ ( 1 p ) 1 ω λ p ω 0 , λ ( 1 p ¯ ) 1 ω 0 , λ p ¯ .
Finally, the use of ω 0 , λ in place of its true counterpart, ω λ , also results in a linear B R F λ / ω 0 , λ vs. B R F λ relationship. The choice of ω 0 , λ impacts the slope and intercept: p is transformed into p ¯ and K into K ( 1 p 0 ) . As 0 W λ 1 , both p and p ¯ are below unity.
Now we show that p ¯ takes on a positive value between 0 and 1 if ω λ < ω 0 , λ , and a negative value otherwise. Let ω λ < ω 0 , λ . Note that W λ is an increasing function with respect to SSA. We have
  ω λ ( 1 p ) 1 ω λ p < ω 0 , λ ( 1 p ) 1 ω 0 , λ p .
The transformation Equation (A4) changes p to p ¯ . To keep Equation (A6) unviolated, the transformed parameter p ¯ must be such that ( 1 p ¯ ) / ( 1 ω 0 , λ p ¯ ) 1 . This inequality takes place if and only if 0 p ¯ 1 . If ω 0 , λ > ω λ , a necessary condition for the validity of Equation (A6), is p ¯ 0 .
In our definition, we take the leaf albedo of the brightest leaf as ω 0 , λ . For vegetated land, the actual SSA is always below ω 0 , λ , i.e., ω λ < ω 0 , λ . Parameter p ¯ varies between 0 and 1 and the corresponding ERTI values fall into the interval between 0° and 45°. The values of the scattering coefficient vary between 0 and ω 0 , λ .
The SSA of water droplets and ice crystals at the weakly absorbing green and NIR wavelengths vary in an interval between 0.95 and 1, resulting in the values of the scattering coefficient being close to unity. A value of ω 0 , λ at NIR was set to 0.9798 in our analyses. The corresponding W λ are close to unity for a wide range of p ¯ in this case. At the green spectral band, however, ω 0 , λ = 0.4898 . As the limit of W λ when p ¯ tends to is 1, the values of | p ¯ | should be very large and the corresponding ERTI values should be close to 90° in order to get W λ at the green wavelength close to unity. Based on these obvious properties we set the lower bound of the ERTI for clouds to 90°. ERTI values around 90° correspond to a dense cloud. To specify its upper bound, we tended cloud optical depth to zero (i.e., p 0 ). In limit, p ¯ = p 0 . A value of p 0 was selected such that the ratio W 779 / W 551 would be close to the ratio between the reflectance of bare soil at these wavelengths. We used the data on spectral soil reflectance documented in [45] to estimate this ratio, which was found to be ~1.2–1.5. We set the upper bound for p 0 to −1.42, which corresponded to a soil reflectance ratio of 1.4. The corresponding ERTI upper bound was set to 125°.
Pixels with an effective leaf area index (LAI) larger than 0.5 are attributed to vegetated land in our analyses. The recollision probability varies from 0.2 to 0.25 in this case [43]. The threshold between bare and vegetated land was set to 15°.
The spectral invariant approach is not applicable in the case of the ocean. As a result, the ratio W λ = B R F λ / D A S F exceeded unity and, consequently, p > 1. The variation range of ERTI for ocean was set between 45° and 90°.

Appendix C. Adjustment of the Cloud–Ocean Threshold

To minimize impact of the instability, we decreased our theoretical values for clouds and ocean by ϵ such that 90 ° ϵ was above a maximum ERTI value over the ocean. To specify ϵ , we estimated the annual average fractional cloud cover as a function of ϵ . This variable was calculated as the probability of finding ERTI values within the interval between 90 ° ϵ and the theoretical upper bound of 125°. The 2016 EPIC TOA reflectance data were used to estimate probabilities. The tuning parameter,   ϵ = 10 ° , was selected to match within 4% an average fractional cloud cover value of 0.56 for clouds with the cloud optical depth above 2.

References

  1. Eck, T.F.; Bhartia, P.K.; Hwang, P.H.; Stowe, L.L. Reflectivity of earth’s surface and clouds in ultraviolet from satellite observations. J. Geophys. Res. Atmos. 1987, 92, 4287–4296. [Google Scholar] [CrossRef]
  2. Myhre, G.; Shindell, D.; Bréon, F.-M.; Collins, W.; Fuglestvedt, J.; Huang, J.; Koch, D.; Lamarque, J.-F.; Lee, D.; Mendoza, B. Anthropogenic and natural radiative forcing. Climate Chang. 2013, 423, 658–740. [Google Scholar]
  3. Otterman, J.; Fraser, R.S. Earth-atmosphere system and surface reflectivities in arid regions from landsat mss data. Remote Sensing Environ. 1976, 5, 247–266. [Google Scholar] [CrossRef]
  4. Stephens, G.L.; Heidinger, A.K.; Gabriel, P.M. Photon paths and cloud heterogeneity: An observational strategy to assess effects of 3d geometry on radiative transfer. In 3d radiative transfer in cloudy atmospheres; Marshak, A., Davis, A., Eds.; Springer: Berlin/Heidelberg, Germany, 2005; pp. 587–616. [Google Scholar]
  5. Tilstra, L.G.; Tuinder, O.N.E.; Wang, P.; Stammes, P. Surface reflectivity climatologies from uv to nir determined from earth observations by gome-2 and sciamachy. J. Geophys. Res. Atmos. 2017, 122, 4084–4111. [Google Scholar]
  6. Csiszar, I.; Gutman, G. Mapping global land surface albedo from noaa avhrr. J. Geophys. Res. Atmos. 1999, 104, 6215–6228. [Google Scholar] [CrossRef]
  7. Kandel, R.; Viollier, M. Observation of the earth’s radiation budget from space. Comptes Rendus Geosci. 2010, 342, 286–300. [Google Scholar] [CrossRef]
  8. Koelemeijer, R.B.A.; de Haan, J.F.; Stammes, P. A database of spectral surface reflectivity in the range 335–772 nm derived from 5.5 years of gome observations. J. Geophys. Res. Atmos. 2003, 108. [Google Scholar] [CrossRef]
  9. Stephens, G.L.; O’Brien, D.; Webster, P.J.; Pilewski, P.; Kato, S.; Li, J.-l. The albedo of earth. Rev. Geophys. 2015, 53, 141–163. [Google Scholar] [CrossRef]
  10. Wielicki, B.A.; Barkstrom, B.R.; Harrison, E.F.; Lee III, R.B.; Louis Smith, G.; Cooper, J.E. Clouds and the earth’s radiant energy system (ceres): An earth observing system experiment. Bull. Am. Meteorol. Soc. 1996, 77, 853–868. [Google Scholar] [CrossRef]
  11. Marshak, A.; Herman, J.; Szabo, A.; Blank, K.; Carn, S.; Cede, A.; Geogdzhayev, I.; Huang, D.; Huang, L.-K.; Knyazikhin, Y.; et al. Earth observations from dscovr/epic instrument. Bull. Am. Meteorol. Soc. 2018. [Google Scholar] [CrossRef]
  12. Geogdzhayev, I.V.; Marshak, A. Calibration of the dscovr epic visible and nir channels using modis and epic lunar observations. Atmos. Meas. Tech. Discuss. 2017, 2017, 1–20. [Google Scholar] [CrossRef]
  13. Herman, J.; Huang, L.; McPeters, R.; Ziemke, J.; Cede, A.; Blank, K. Synoptic ozone, cloud reflectivity, and erythemal irradiance from sunrise to sunset for the whole earth as viewed by the dscovr spacecraft from lagrange-1. Atmos. Meas. Tech. Discuss. 2017, 2017, 1–48. [Google Scholar] [CrossRef]
  14. Lester, T.P.; McCall, M.L.; Tatum, J.B. Theory of planetary photometry. J. Royal Astronomical Soc. Canada 1979, 73, 233–257. [Google Scholar]
  15. Yang, W.; Marshak, A.; Várnai, T.; Knyazikhin, Y. Epic spectral observations of variability in earth’s global reflectance. Remote Sensing 2018, 10, 254. [Google Scholar] [CrossRef]
  16. Huang, D.; Knyazikhin, Y.; Dickinson, R.E.; Rautiainen, M.; Stenberg, P.; Disney, M.; Lewis, P.; Cescatti, A.; Tian, Y.; Verhoef, W.; et al. Canopy spectral invariants for remote sensing and model applications. Remote Sensing Environ. 2007, 106, 106–122. [Google Scholar] [CrossRef] [Green Version]
  17. Knyazikhin, Y.; Schull, M.; Xu, L.; Myneni, R.; Samanta, A. Canopy spectral invariants. Part 1: A new concept in remote sensing of vegetation. J. Quantitative Spectroscopy & Radiative Transfer 2011, 112, 727–735. [Google Scholar]
  18. Stenberg, P.; Mõttus, M.; Rautiainen, M. Photon recollision probability in modelling the radiation regime of canopies — a review. Remote Sensing Environ. 2016, 183, 98–108. [Google Scholar] [CrossRef]
  19. Marshak, A.; Knyazikhin, Y. The spectral invariant approximation within canopy radiative transfer to support the use of the epic/dscovr oxygen b-band for monitoring vegetation. J.Quantitative Spectroscopy Radiative Transfer 2017, 191, 7–12. [Google Scholar] [CrossRef] [PubMed]
  20. Lewis, P.; Disney, M. Spectral invariants and scattering across multiple scales from within-leaf to canopy. Remote Sensing Environ. 2007, 109, 196–206. [Google Scholar] [CrossRef]
  21. Zeng, Y.; Xu, B.; Yin, G.; Wu, S.; Hu, G.; Yan, K.; Yang, B.; Song, W.; Li, J. Spectral invariant provides a practical modeling approach for future biophysical variable estimations. Remote Sensing 2018, 10, 1508. [Google Scholar] [CrossRef]
  22. Marshak, A.; Knyazikhin, Y.; Chiu, J.C.; Wiscombe, W. Spectrally invariant approximation within atmospheric radiative transfer. J. Atmospheric Sci. 2011, 68, 3094–3111. [Google Scholar] [CrossRef]
  23. Marshak, A.; Knyazikhin, Y.; Chiu, J.C.; Wiscombe, W.J. On spectral invariance of single scattering albedo for water droplets and ice crystals at weakly absorbing wavelengths. J. Quant. Spectrost. Radiat. Trans. 2012, 113, 715–720. [Google Scholar] [CrossRef]
  24. Baret, F.; Jacquemoud, S.; Hanocq, J.F. About the soil line concept in remote sensing. Adv. Space Res. 1993, 13, 281–284. [Google Scholar] [CrossRef]
  25. Jacquemoud, S.; Baret, F.; Hanocq, J.F. Modeling spectral and bidirectional soil reflectance. Remote Sensing Environ. 1992, 41, 123–132. [Google Scholar] [CrossRef]
  26. Knyazikhin, Y.; Schull, M.A.; Stenberg, P.; Mottus, M.; Rautiainen, M.; Yang, Y.; Marshak, A.; Carmona, P.L.; Kaufmann, R.K.; Lewis, P.; et al. Hyperspectral remote sensing of foliar nitrogen content. Proc. Nat. Acad. Sci. USA 2013, 110, E185–E192. [Google Scholar] [CrossRef] [PubMed]
  27. Latorre-Carmona, P.; Knyazikhin, Y.; Alonso, L.; Moreno, J.F.; Pla, F.; Yan, Y. On hyperspectral remote sensing of leaf biophysical constituents: Decoupling vegetation structure and leaf optics using chris-proba data over crops in barrax. Geosci. Remote Sensing Lett. IEEE 2014, PP, 1–5. [Google Scholar] [CrossRef]
  28. Féret, J.B.; Francois, C.; Asner, G.P.; Gitelson, A.A.; Martin, R.E.; Bidel, L.P.R.; Ustin, S.L.; le Maire, G.; Jacquemoud, S. Prospect-4 and 5: Advances in the leaf optical properties model separating photosynthetic pigments. Remote Sensing Environ. 2008, 112, 3030–3043. [Google Scholar] [CrossRef]
  29. Jacquemoud, S.; Baret, F. Prospect: A model of leaf optical properties spectra. Remote Sensing Environ. 1990, 34, 75–91. [Google Scholar] [CrossRef]
  30. Stubenrauch, C.; Rossow, W.; Kinne, S.; Ackerman, S.; Cesana, G.; Chepfer, H.; Di Girolamo, L.; Getzewich, B.; Guignard, A.; Heidinger, A. Assessment of global cloud datasets from satellites: Project and database initiated by the gewex radiation panel. Bull. Am. Meteorol. Soc. 2013, 94, 1031–1049. [Google Scholar] [CrossRef]
  31. Gerstl, S.A.W. Building a global hotspot ecology with triana data. P. Soc. Photo Opt. Ins. 1999, 3868, 184–194. [Google Scholar]
  32. Kuusk, A. The Hot Spot Effect in Plant Canopoy Reflectance. In Photon-Vegetation Interactions: Applications in Plant Physiology and Optical Remote Sensing; Myneni, R.B., Ross, J., Eds.; Springer: Berlin/Heidelberg, Germany, 1991. [Google Scholar]
  33. Ross, J.K.; Marshak, A.L. Calculation of canopy bidirectional reflectance using the monte-carlo method. Remote Sensing Environ. 1988, 24, 213–225. [Google Scholar] [CrossRef]
  34. Huang, D.; Knyazikhin, Y.; Wang, W.; Deering, D.W.; Stenberg, P.; Shabanov, N.; Tan, B.; Myneni, R.B. Stochastic transport theory for investigating the three-dimensional canopy structure from space measurements. Remote Sensing Environ. 2008, 112, 35–50. [Google Scholar] [CrossRef]
  35. Yang, B.; Knyazikhin, Y.; Mõttus, M.; Rautiainen, M.; Stenberg, P.; Yan, L.; Chen, C.; Yan, K.; Choi, S.; Park, T. Estimation of leaf area index and its sunlit portion from dscovr epic data: Theoretical basis. Remote Sensing Environ. 2017, 198, 69–84. [Google Scholar] [CrossRef] [PubMed]
  36. Matsuyama, H.; Masuda, K. Seasonal/interannual variations of soil moisture in the former ussr and its relationship to indian summer monsoon rainfall. J. Clim. 1998, 11, 652–658. [Google Scholar] [CrossRef]
  37. Illston, B.G.; Basara, J.B.; Crawford, K.C. Seasonal to interannual variations of soil moisture measured in oklahoma. Int. J. Climatol. 2004, 24, 1883–1896. [Google Scholar] [CrossRef]
  38. Bedidi, A.; Cervelle, B.; Madeira, J.; Pouget, M. Moisture effects on visible spectral characteristics of lateritic soils. Soil Sci. 1992, 153, 129–141. [Google Scholar] [CrossRef]
  39. Wu, C.-Y.; Jacobson, A.R.; Laba, M.; Baveye, P.C. Alleviating moisture content effects on the visible near-infrared diffuse-reflectance sensing of soils. Soil Sci. 2009, 174, 456–465. [Google Scholar] [CrossRef]
  40. Kileshye Onema, J.-M.; Taigbenu, A. Ndvi–rainfall relationship in the semliki watershed of the equatorial nile. Phys. Chem. Earth Parts A/B/C 2009, 34, 711–721. [Google Scholar] [CrossRef]
  41. Bi, J.; Knyazikhin, Y.; Choi, S.H.; Park, T.; Barichivich, J.; Ciais, P.; Fu, R.; Ganguly, S.; Hall, F.; Hilker, T.; et al. Sunlight mediated seasonality in canopy structure and photosynthetic activity of amazonian rainforests. Environ. Res. Lett. 2015, 10. [Google Scholar] [CrossRef]
  42. Ross, J. The Radiation Regime and Architecture of Plant Stands; Dr W. Junk Publishers: Hague, The Netherlands, 1981; 391p. [Google Scholar]
  43. Smolander, S.; Stenberg, P. Simple parameterizations of the radiation budget of uniform broadleaved and coniferous canopies. Remote Sensing Environ. 2005, 94, 355–363. [Google Scholar] [CrossRef]
  44. Yang, B.; Knyazikhin, Y.; Lin, Y.; Yan, K.; Chen, C.; Park, T.; Choi, S.; Mõttus, M.; Rautiainen, M.; Myneni, R.; et al. Analyses of impact of needle surface properties on estimation of needle absorption spectrum: Case study with coniferous needle and shoot samples. Remote Sensing 2016, 8, 563. [Google Scholar] [CrossRef] [PubMed]
  45. Knyazikhin, Y.; Martonchik, J.V.; Myneni, R.B.; Diner, D.J.; Running, S.W. Synergistic algorithm for estimating vegetation canopy leaf area index and fraction of absorbed photosynthetically active radiation from modis and misr data. J. Geophys. Res. Atmos. 1998, 103, 32257–32275. [Google Scholar] [CrossRef]
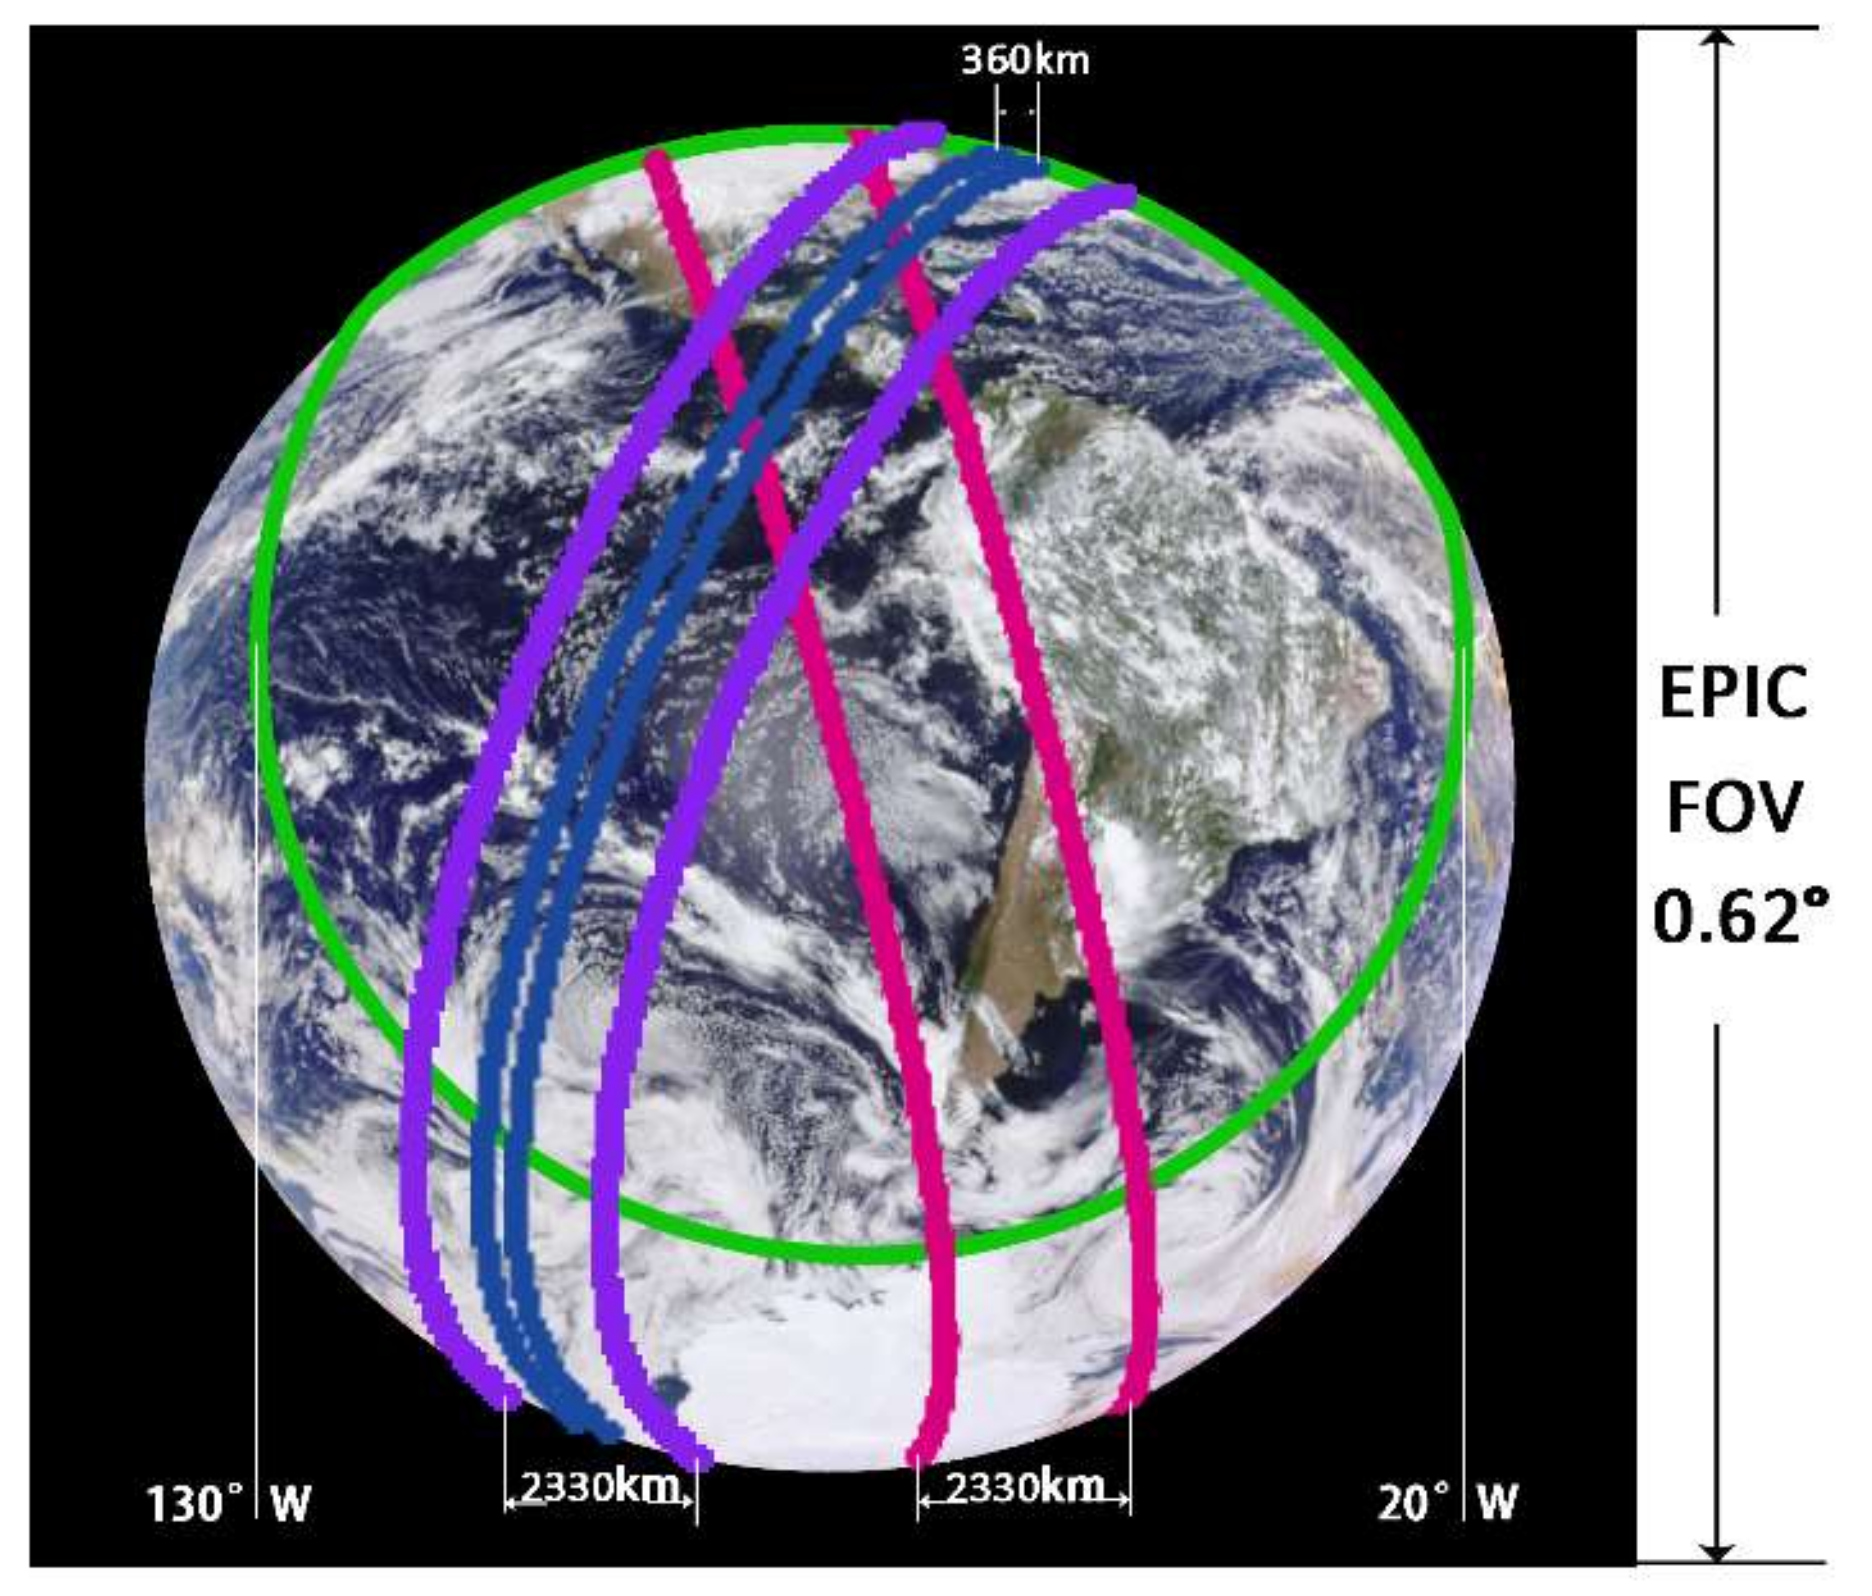
Figure 1. Earth Polychromatic Imaging Camera (EPIC) enhanced Red-Green-Blue (RGB) image of the sunlit Earth taken on 15 January 2017 at 18:37:04 Greenwich mean time (GMT) (https://epic.gsfc.nasa.gov/enhanced?date=2017-01-15). Areas between purple and red lines are Terra and Aqua Moderate Resolution Imaging Spectroradiometer (MODIS) 2330 km wide swaths. Blue lines depict a 360 km swath of the Multi-Angle Imaging SpectroRadiometer (MISR) sensor on the Terra platform. Terra MODIS and MISR cross the equator at 10:30 local solar time (LST) while Aqua MODIS sees the Earth at 13:30 LST. A fixed sampling area of the NASA’s Geostationary Operational Environmental Satellite East (GOES-East) is bounded by a green line. MODIS and MISR sensors on low-earth-orbiting platforms acquires radiance data over swaths at a specific LST. The geostationary GOES-East satellite collects data over a specific area of the Earth. Technical details on sensor sampling areas are given in Section 2.3.
Remotesensing 10 01594 g001
Figure 2. Scattering function of an ideal Lambertian sphere ( ρ λ   = 1). The two dashed lines illustrate the variation range of the EPIC phase angle.
Remotesensing 10 01594 g002
Figure 3. Hourly variation in sampling areas of Terra/Aqua MODIS, Terra MISR sensors, and GOES-East satellite. The MODIS and MISR swaths cover 20% and 5% of the sunlit Earth disk, respectively. The Earth sunlit area as seen from the GOES-East satellite varies during a day.
Remotesensing 10 01594 g003
Figure 4. Left panel shows an EPIC RGB image taken on 23 August 2016 at 15:24:58 GMT. Equation (7) was applied to each image pixel. Right panel shows the distribution of ERTI over sunlit Earth. Its values corresponding to cloud-free ocean, land, vegetation, and cloudy pixels tend to occupy different spaces within the 0° to 180° interval. Phase angle is 5.65°. Color bar shows thresholds for different reflector types.
Remotesensing 10 01594 g004
Figure 5. (a) Diurnal course of the scattering function on the near infrared (NIR) vs. red spectral plane (block “global”). The blocks “cloud,” “ocean”, “land” and “vegetation” show the trajectories of the mean scattering function over cloudy and cloud-free ocean, land, and vegetated pixels, respectively. (b) Domain of variation in red and NIR reflectance of bare and vegetated land simulated with the stochastic radiative transfer equation. SZA = 0°~15°, phase angle = 0°~9°. Lines show leaf area index (LAI) isolines (i.e., LAI is constant while soil reflectance varies). Circles are points from the blocks “vegetation” and “land”. DSCOVR EPIC images taken on 23 August 2016 (https://epic.gsfc.nasa.gov/?date=2016-08-23) were used.
Remotesensing 10 01594 g005
Figure 6. Diurnal variations of the fractional coverage of different Earth components (left vertical axis) and EPIC scattering function at the blue (443 nm), green (551 nm), red (680 nm) and NIR (780 nm) wavelengths (right vertical axis). Continents present in the image are shown on the horizontal axis.
Remotesensing 10 01594 g006
Figure 7. Diurnal variations of the fractional coverage of different Earth components (left vertical axis) and scattering functions at blue (443 nm), green (551 nm), red (680 nm) and NIR (780 nm) wavelengths (right vertical axis) averaged over the sampling areas of (a) Terra MODIS, (b) Aqua MODIS, (c) Terra MISR and (d) GOES-East for EPIC images acquired on 23 August 2016. Sampling areas are shown in Figure 1. Continents present in the image are shown on the horizontal axis.
Remotesensing 10 01594 g007
Figure 8. Correlation between Earth Orbiting Satellites (EOS) and EPIC scattering functions at blue (443 nm), green (551 nm), red (680 nm) and NIR (780 nm) spectral bands. Upper (lower) panels show daily (monthly) averaged scattering functions over LEO (left) and GOES (right) sampling areas.
Remotesensing 10 01594 g008
Figure 9. Mean biases at 780 nm, P 780 nm ( S E O S ) P 780 nm ( S E P I C ) , as a function of averaging timescale for the MODIS, MISR and GOES East sampling areas for the period from 1 January (first point) through 31 December 2016 (last point). EPIC L1B data were available for 346 days in Year 2016.
Remotesensing 10 01594 g009
Figure 10. Correlation between EOS and EPIC estimates of cloud, ocean, bare and vegetated land reflectivity at blue (443 nm), green (551 nm), red (680 nm) and NIR (780 nm) spectral bands. Upper two show the daily averaged reflectivity over LEO (left) and GOES (right) sampling areas, while the lower panels are for monthly average reflectivity. The ERTI index was used to identify cloudy and cloud-free scenes.
Remotesensing 10 01594 g010
Figure 11. Monthly average Normalized Difference Vegetation Index (NDVI) over (a) cloudy and cloud-free ocean, (b) cloud-free bare (vertical axis on the left side) and vegetated (vertical axis on the left side) land for the year 2016. The ERTI index was used to discriminate between reflector types.
Remotesensing 10 01594 g011
Figure 12. Probability density function (PDF) of the phase angle during 25 June to 10 July and 13–28 September periods over Amazonian rainforests (0° to 10°S and 60°W to 70°W) for Terra MODIS and MISR Sun-sensor geometries derived from MODIS and MISR data for the period from June 2000 to May 2008. MISR views the Earth’s surface symmetrically about the nadir in the forward and backward directions along the spacecraft’s flight track with nominal view zenith angles relative to the surface reference ellipsoid of 0.0° (camera An), 26.1 ° (Af and Aa), 46.5 ° (Bf and Ba), 60.0 ° (Cf and Ca) and 70.5 ° (Df and Da). MODIS is a single view sensor that scans the Earth’s surface across the spacecraft flight track.
Remotesensing 10 01594 g012
Table 1. Calibration factors for four Earth Polychromatic Imaging Camera (EPIC) spectral bands 1.
EPIC Band NumberEPIC Bands NameEPIC Bands widthCalibration Factors
5Blue 443 nm0.88 × 10−5
6Green 551 nm0.69 × 10−5
7Red 680 nm1.00 × 10−5
10NIR 780 nm1.50 × 10−5
1 Calibration factor for all 10 EPIC bands are available at https://eosweb.larc.nasa.gov/project/dscovr/DSCOVR_EPIC_Calibration_Factors_V02.pdf.
Table 2. Variation of reflector type fractions for 23 August 2016.
Reflector TypeVariationRelative Variation, V(S)/V(E)
EPIC ImageTerra MODISTerra MISRAqua MODISGOES-East
Clouds0.2994.5046.5154.7361.393
Cloud-free ocean0.3913.3123.9243.6581.017
Cloud-free land0.4473.1204.1873.2290.558
Cloud-free vegetation0.1323.1043.9273.0201.071
Cloud-free surface (land + vegetation)0.4903.5464.6513.6620.673
Table 3. Statistical characteristics of scattering function for 23 August 2016.
SamplingWavelength, nm
443551680780443551680780443551680780
MeanPrecisionVariation
DSCOVR EPIC0.2800.2170.2190.2440.1250.1230.1380.1490.1000.1130.1200.192
Relative bias1(%)PrecisionRelative variation, V(S)/V(E)
Terra MODIS 0.842.893.744.980.1380.1370.1530.1665.6705.6025.8334.479
Terra MISR 2.444.505.385.980.1410.1400.1570.1698.0108.0718.6676.042
Aqua MODIS 2.915.316.057.110.1320.1320.1490.1623.7364.3174.9204.051
GOES-East -11.59-5.45-8.67-6.010.1360.1160.1280.1380.6240.6840.7690.835
1 Relative bias was calculated as (P(S) − P(E))/P(E) where P(E) and P(S) are daily average scattering functions over EPIC image and other sampling area S, respectively.
Table 4. Contribution of the Earth’s components to the annual average scattering function, %.
EPIC Spectral BandsCloudOceanLandVegetation
Blue (443 nm)76.015.99.00.7
Green (551 nm)80.210.610.40.7
Red (680 nm)81.77.512.10.6
NIR (780 nm)77.25.916.41.8