1. Introduction
Earth’s climate is determined by the Earth Radiation Budget (ERB). For a climate in equilibrium, the gain of energy from Absorbed Solar Radiation (ASR) is in balance with the loss of energy through Outgoing Longwave Radiation (OLR). Any perturbation of this radiative energy balance at the Top of Earth’s Atmosphere (TOA) is known as a radiative forcing, and is a driver of climate change [
1]. Compared to the pre-industrial period, the increase of Greenhouse Gasses (GHG) primarily CO
reduces the OLR; this represents a positive (heating) radiative forcing [
2]. This positive GHG radiative forcing is partially compensated by a negative (cooling) radiative forcing of aerosols, which increase the amount of Reflected Solar Radiation (RSR) and hence decrease the ASR [
3]. Variations of the incoming solar radiation could also create a radiative forcing, but in practice the solar irradiance variations are small [
4].
For understanding current and past climate change, and for increasing the confidence with which future climate change can be predicted, the analysis of long-term changes of the ERB is essential. The measurement of the ERB from space has a long history [
5], but the availability of long-term homogeneous ERB Climate Data Records (CDRs) is relatively recent.
In this paper, we analyse the long-term variation of selected OLR CDR’s in order to increase our understanding of climate change. In
Section 2, we describe the used data and the main features of the climatological mean OLR. In
Section 3, we analyse the decadal change of the global annual mean OLR over the period 1985–2018. In
Section 4, we investigate the regional patterns of the OLR change. In
Section 5, we discuss our results.
2. Outgoing Longwave Radiation
The earth surface and the constituents of the earth’s atmosphere emit thermal radiation. The OLR is defined as the emitted thermal radiation that is radiated to space at the TOA. In this paper, we consider the following long-term measurements of the OLR:
Broadband scanner measurements made by the National Aeronautics and Space Administration (NASA) Clouds and the Earth’s Radiant Energy System (CERES) [
6] instruments. We use the CERES EBAF Ed4.0 following [
7] from 2000 to 2018.
Broadband non scanner measurements made with the NASA Earth Radiation Budget Experiment (ERBE) [
8] Earth Radiation Budget Satellite (ERBS) Wide Field Of View (WFOV) instrument. We use the ERBE WFOV Ed4.0 following [
9] from 1985 to 1998.
Broadband estimates derived from multichannel narrowband measurements made by the High-resolution Infrared Radiation Sounder (HIRS) instruments on the National Oceanic and Atmospheric Administration (NOAA) and Eumetsat’s Metop satellites. We use the HIRS OLR version 2.7 following [
10]. Intersatellite calibrations were performed to remove possible discontinuity in the HIRS OLR product from different satellites. In the 2012, Gewex Radiative Flux Assessment (RFA) [
11], the HIRS OLR was the only long-term OLR dataset comparing favourably with both the ERBE scanner and CERES reference datasets for the periods of 1985–1989 and 2001–2004, respectively.
Following [
5], we put the HIRS and CERES OLR on the same absolute scale. We make the OLR equal to the reference value of 238 W/m
for the period 2005–2014. Therefore, we multiply the HIRS OLR with a factor 0.997134 and we multiply the CERES OLR with a factor 0.990837. The ERBE WFOV OLR is made equal to the HIRS OLR over the period 1985–1998. Therefore, we multiply the ERBE WFOV OLR by 0.995169.
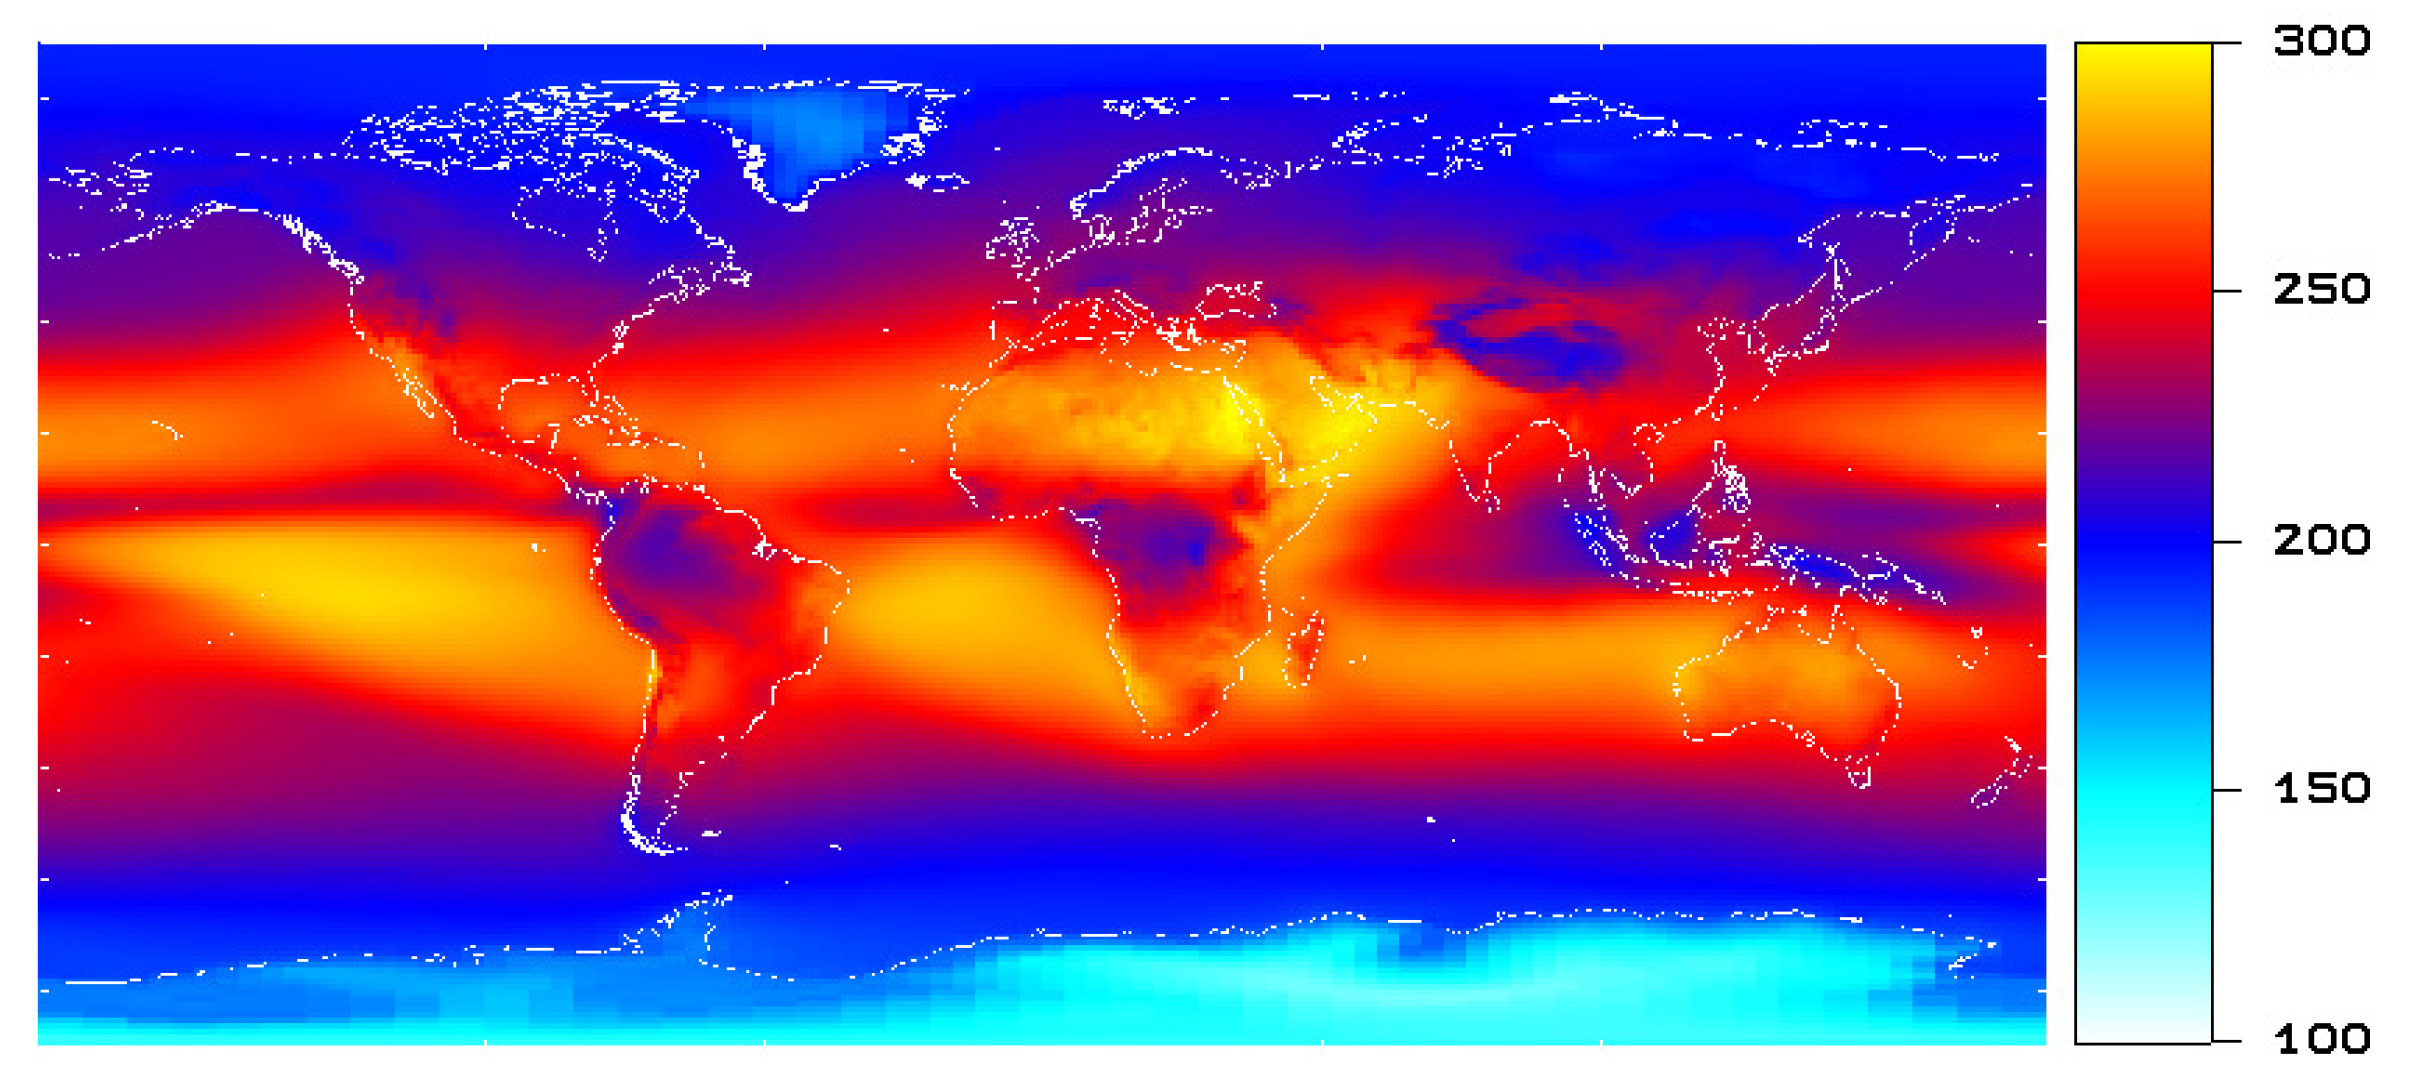
Figure 1 shows the 17-year CERES mean ‘all sky’ OLR over the period 2001–2017.
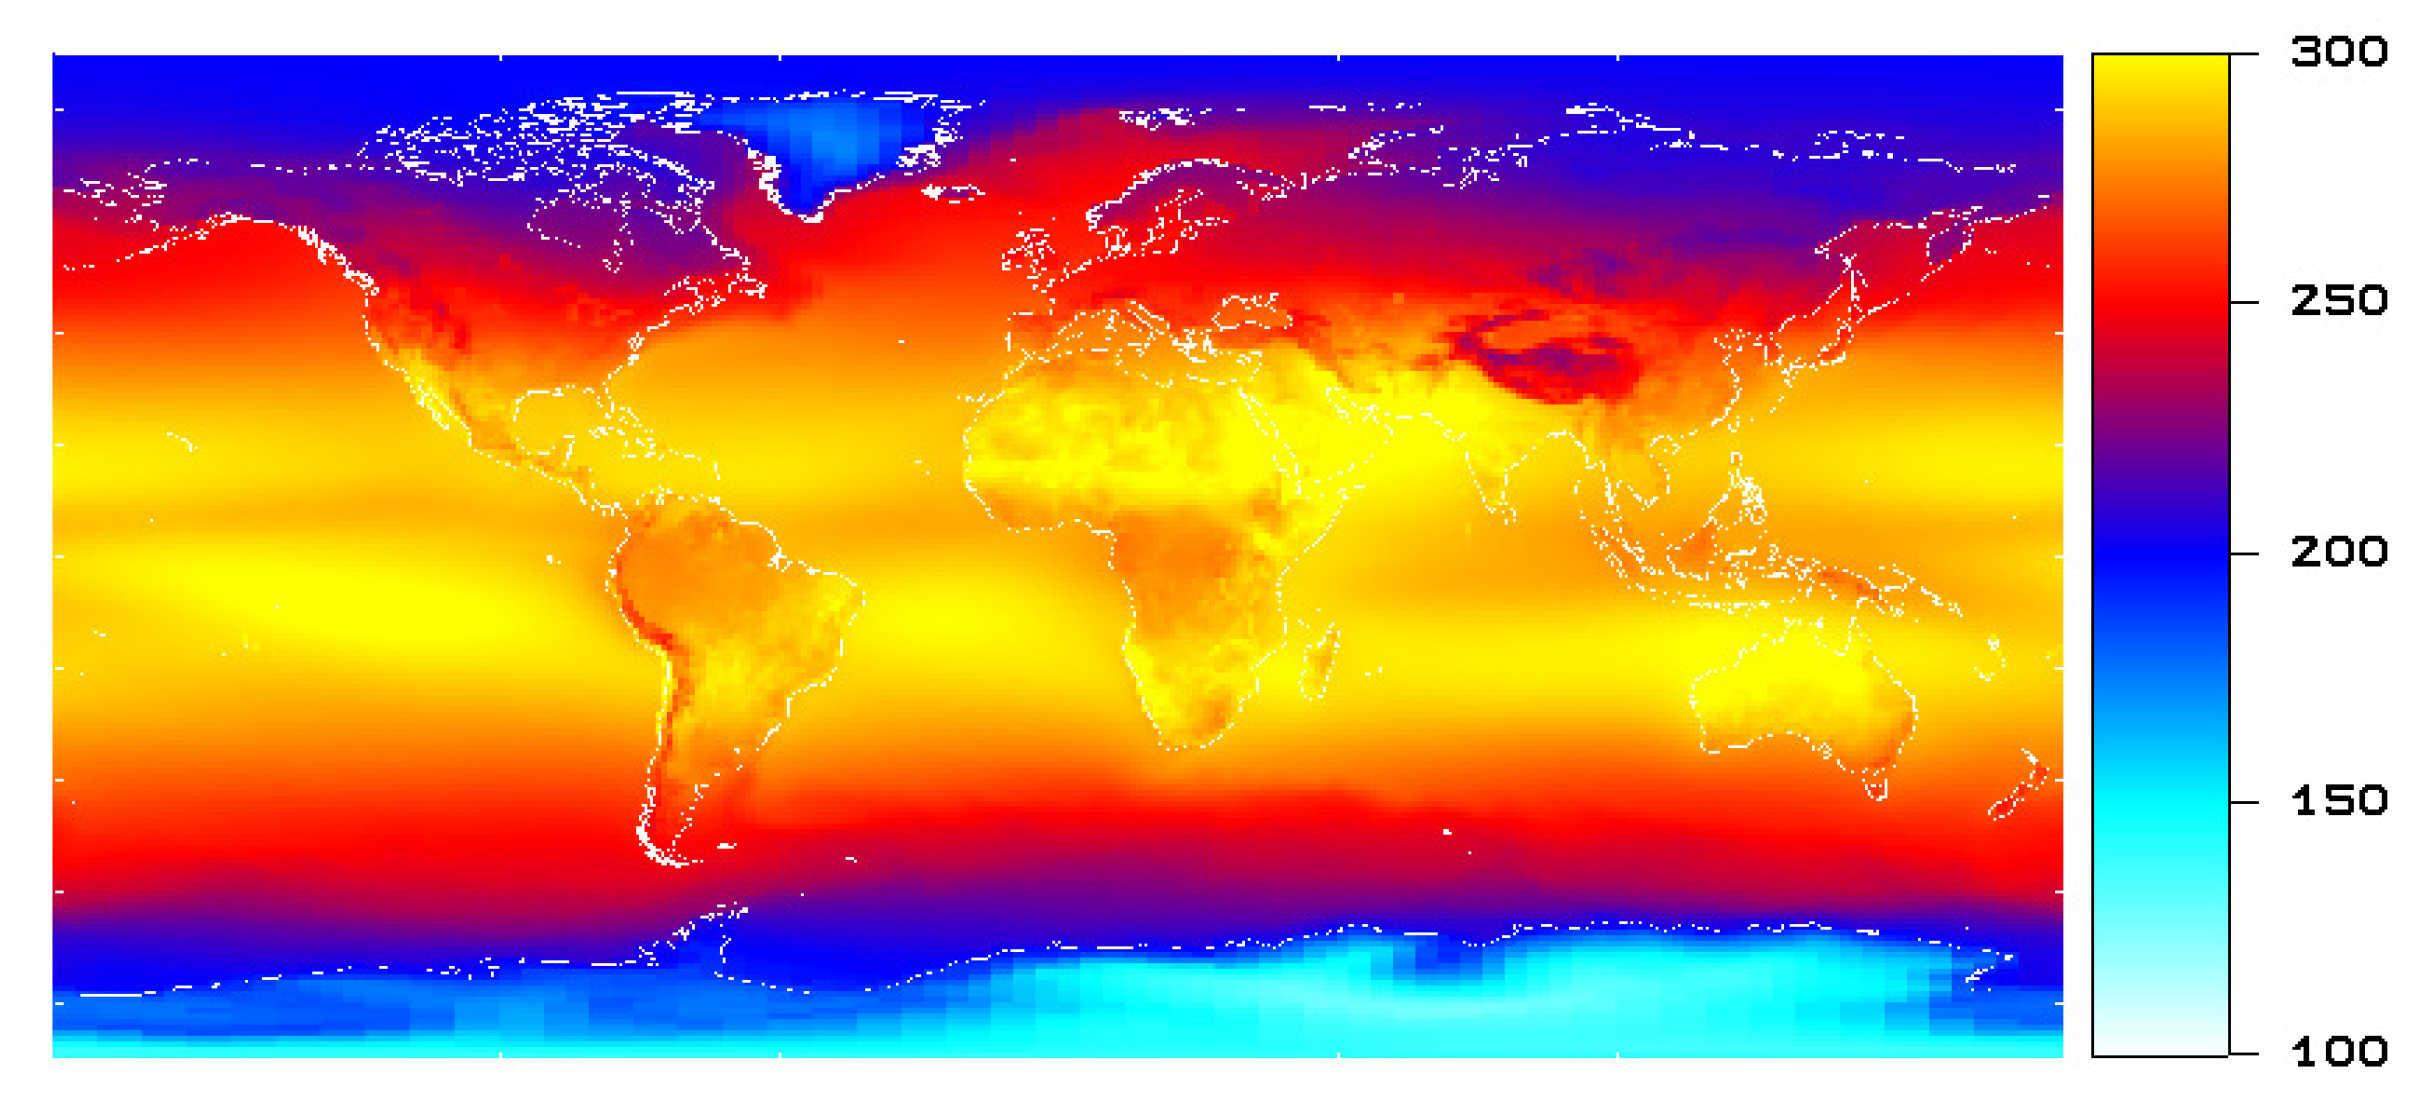
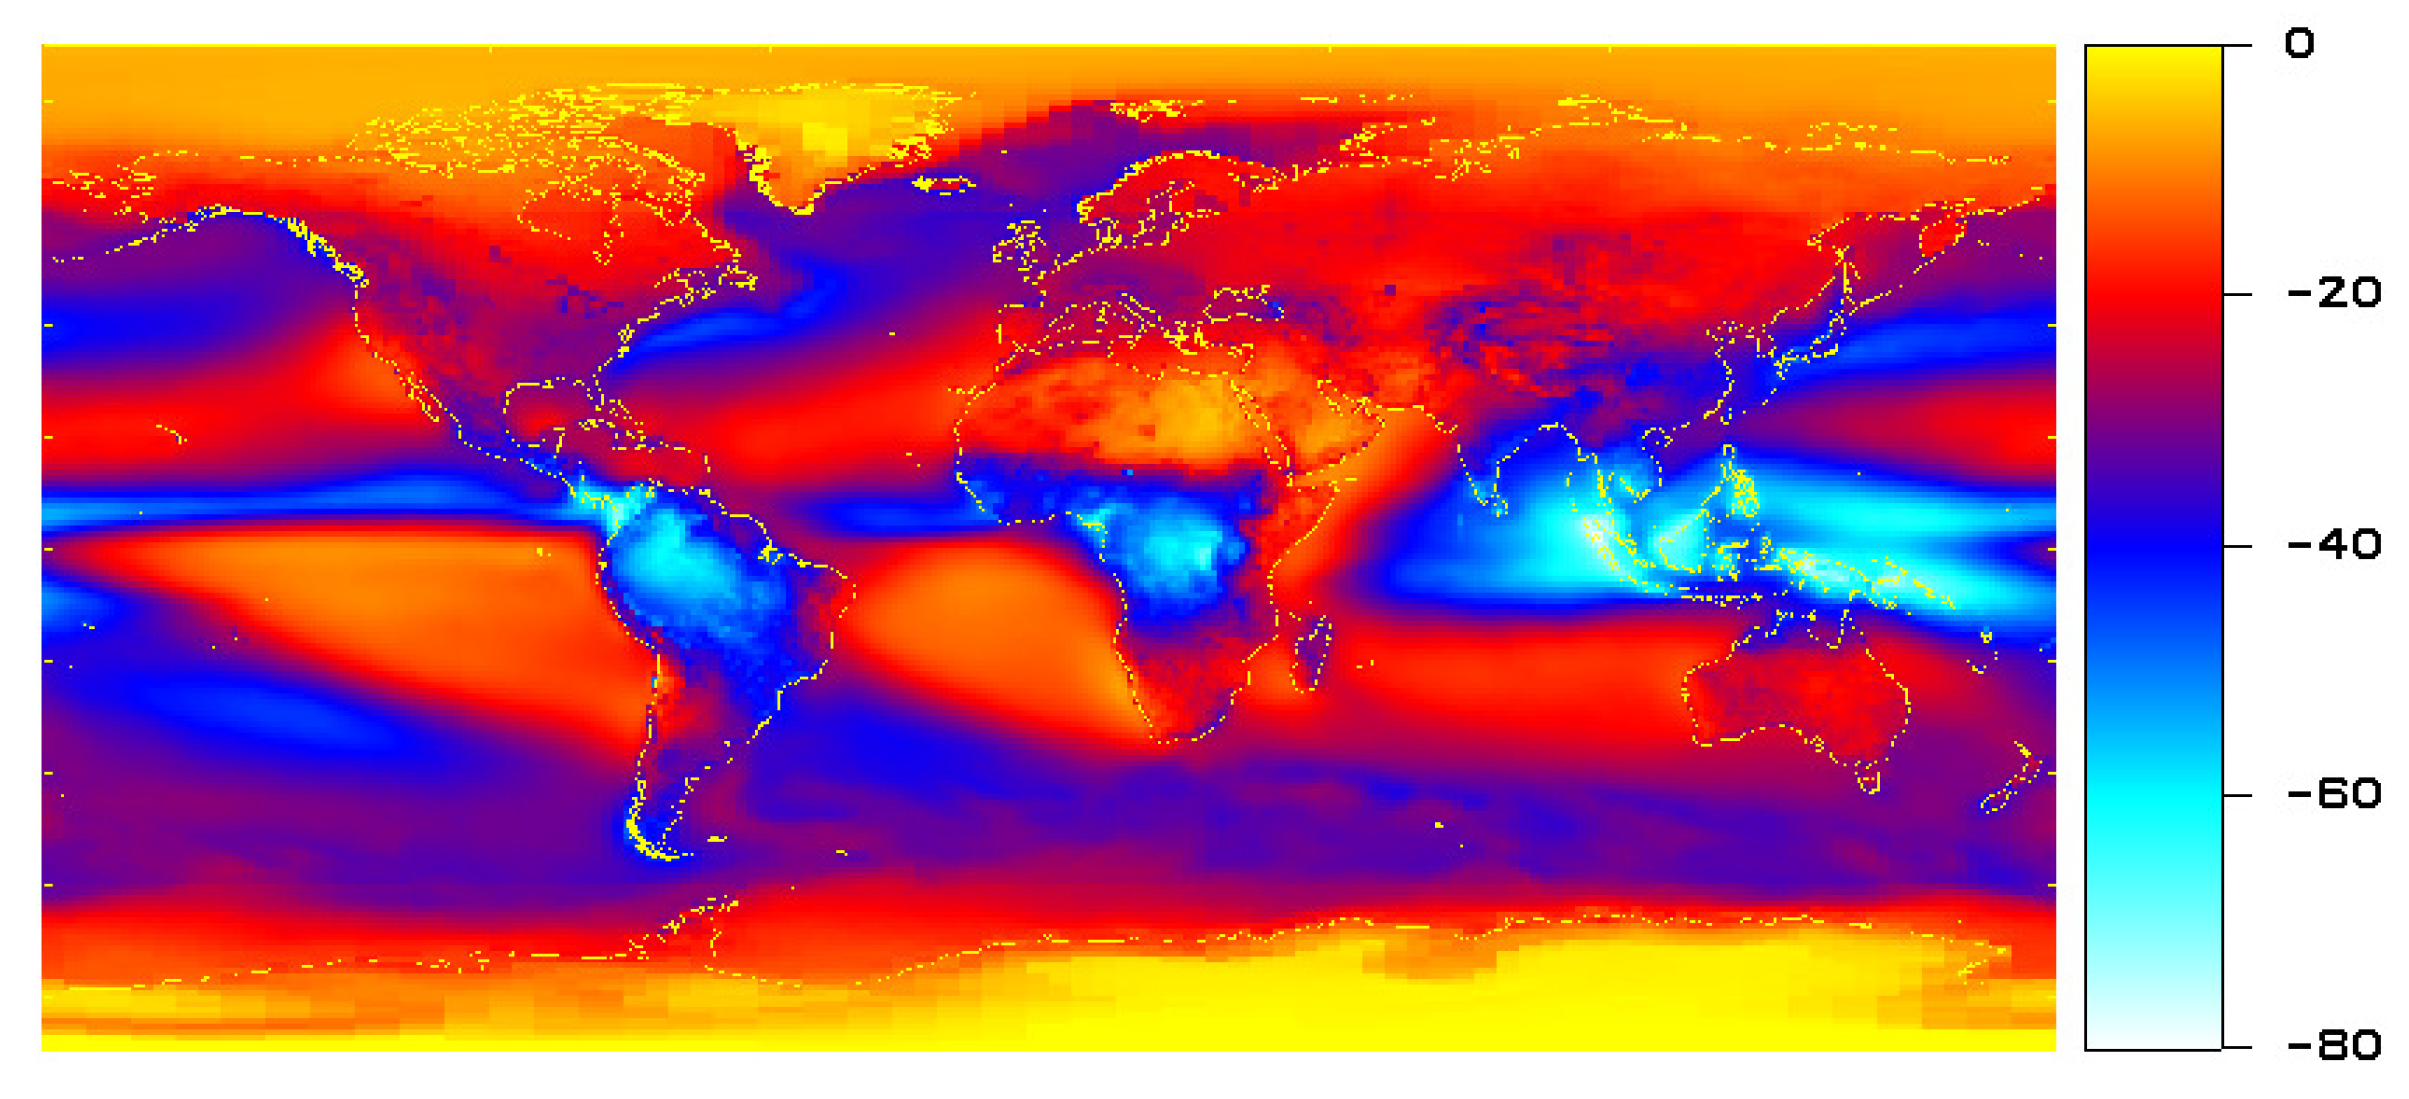
Figure 2 shows the corresponding clear sky OLR, and
Figure 3 shows the OLR cloud effect defined as the all sky OLR minus the clear sky OLR.
The clear sky OLR (
Figure 2) shows the variation of high thermal emission (yellow and red colors) linked to high surface temperatures at the equator towards low thermal emission (blue and light blue colors) linked to low surface temperatures at the poles. In the equatorial convective regions, the clear sky thermal emission is slightly reduced (light red color) due to water vapour absorption compared to the subtropical high pressure regions (yellow color).
Near the equator, tropical convective clouds cause OLR minima that can be seen in
Figure 1 (blue color) and
Figure 3 (light blue and blue color). Tropical convection is caused by the diurnal heating of the earth surface by the sun [
12]. This heating causes a faster temperature rise over land than over ocean, hence tropical convection, and the associated OLR minima, form preferentially over land.
At midlatitudes, the OLR is also reduced by clouds—particularly over the oceans—as can be seen in
Figure 3 (blue color). In the Northern Hemisphere, OLR minima form over ocean, and correspond more or less to the Icelandic and Aleutian low pressure systems [
13]. These low pressure systems are the strongest in winter, when the ocean is warmer than the land. In the Southern Hemisphere, there exists a zonally extended low pressure system and corresponding OLR minimum over the Southern Ocean.
3. Global Annual Mean Outgoing Longwave Radiation Change 1985–2017
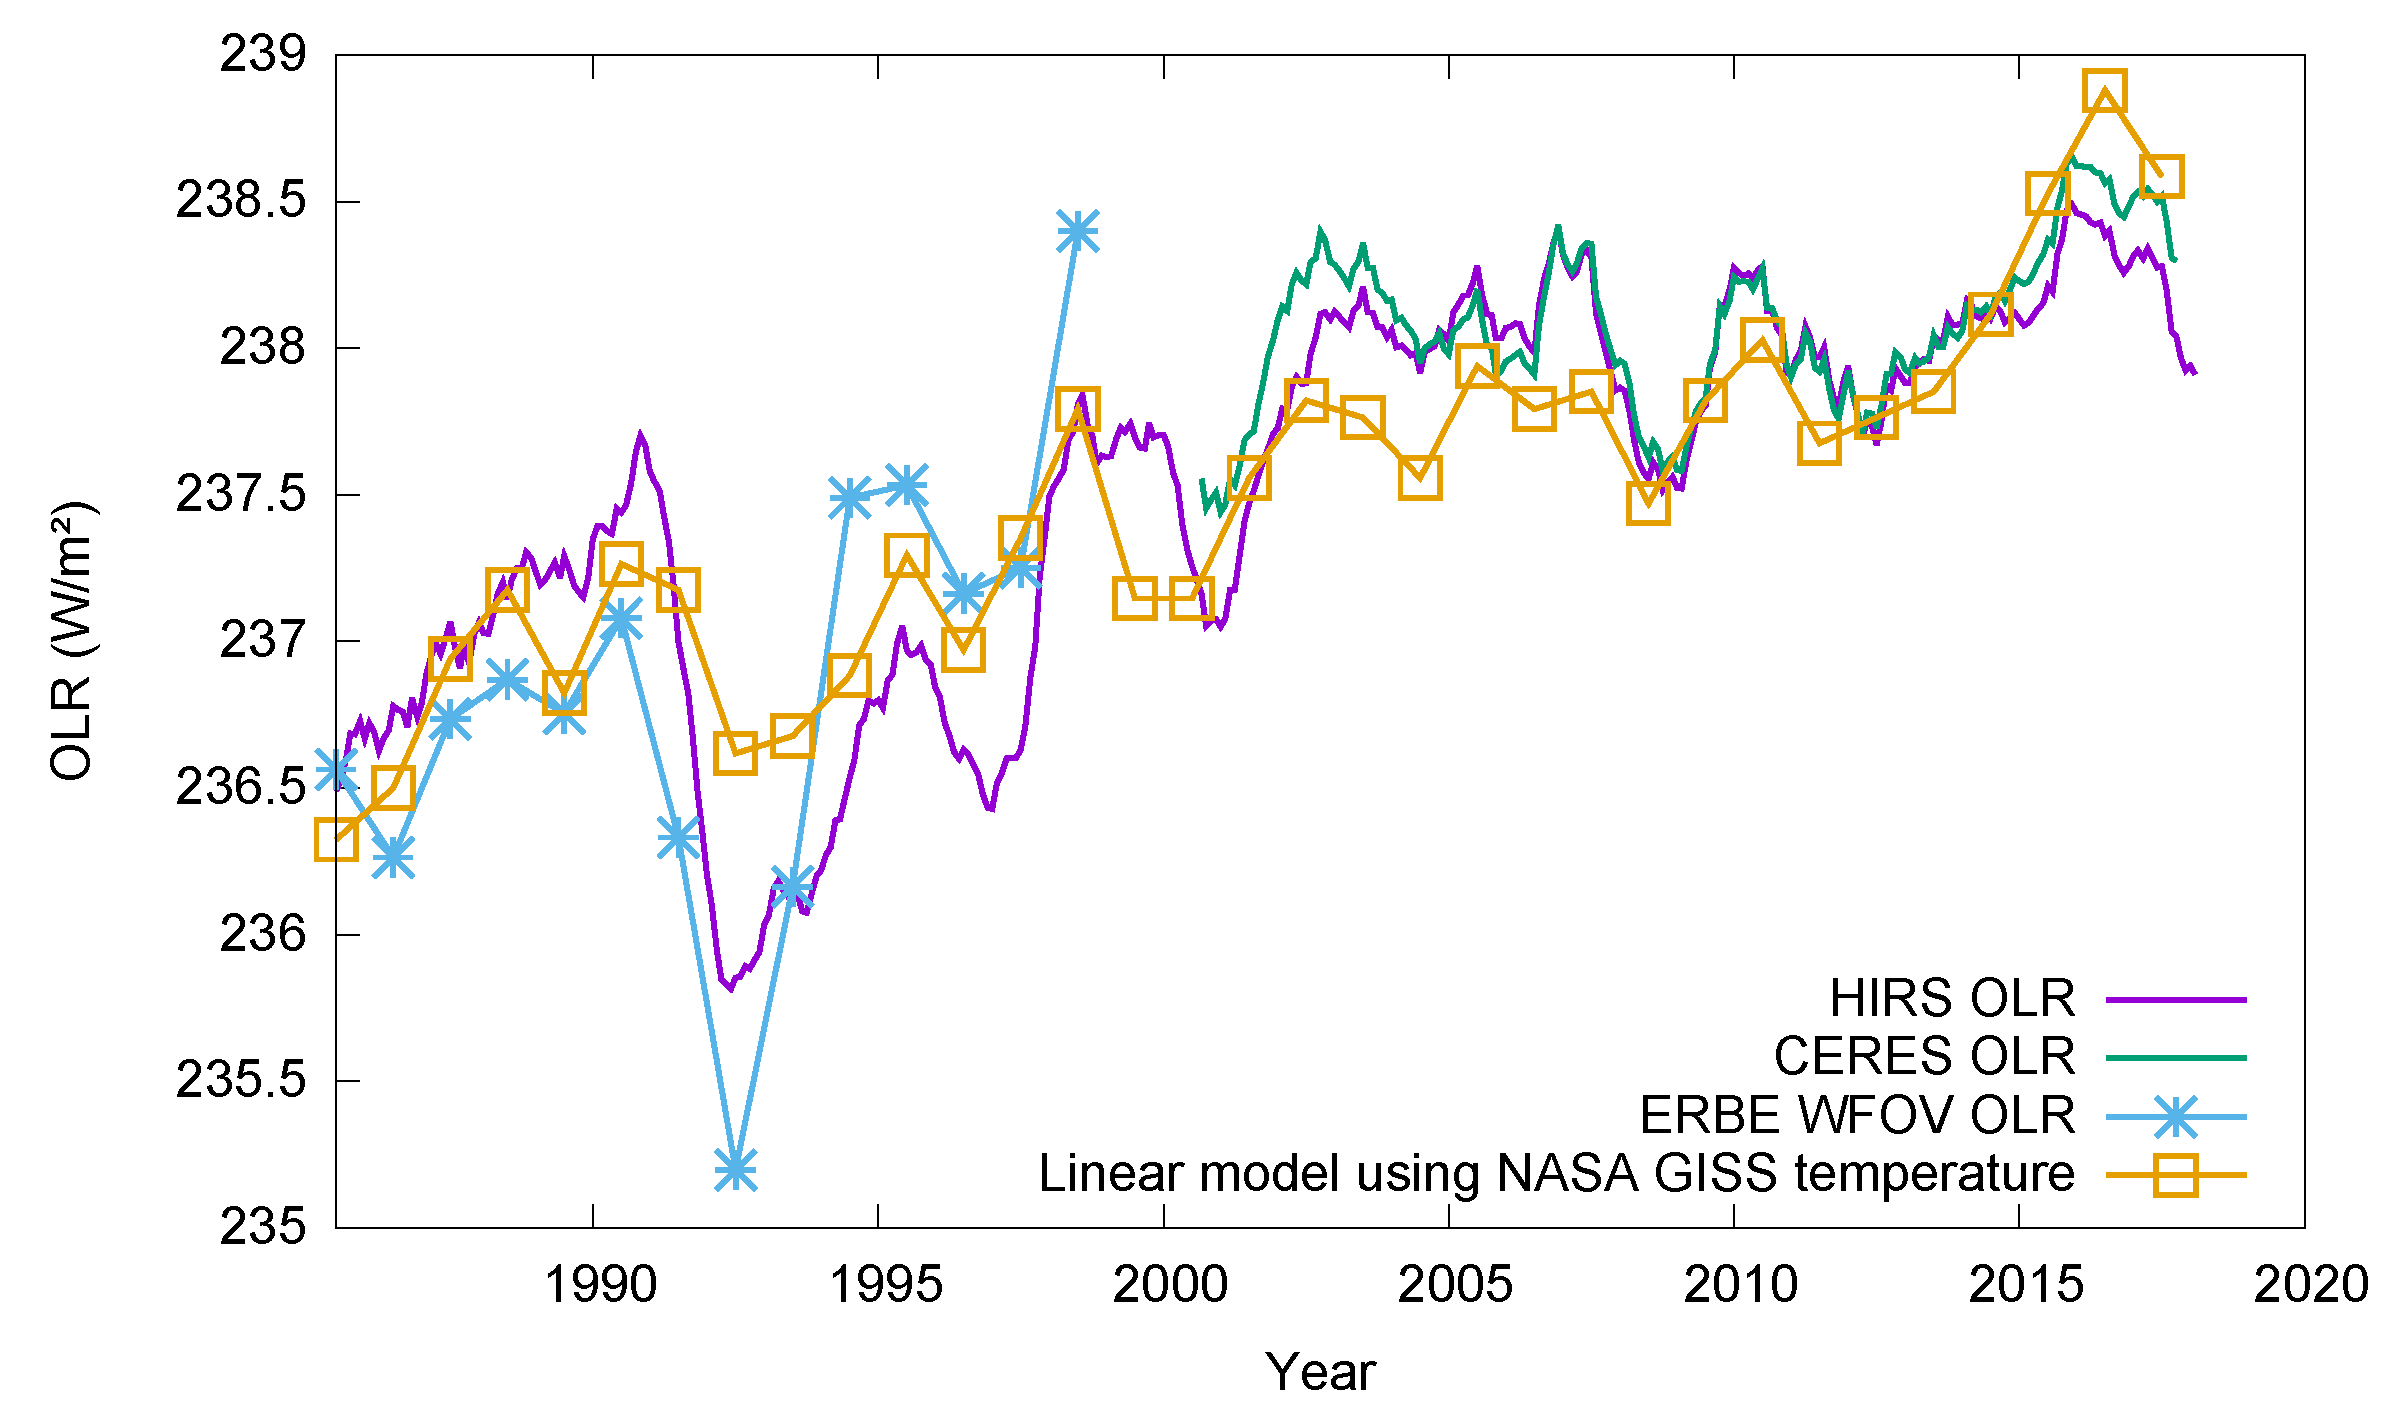
Figure 4 shows the running yearly mean of the global average OLR as measured by HIRS, ERBE and CERES, as well as a linear regression model based on the yearly NASA GISS T anomaly [
14] over the period 1985–2018.
The linear regression model is
with
the NASA GISS T anomaly, and
and
as regression parameters.
The Root Mean Square Difference (RMSD) between the data plotted in
Figure 4 give an indication of their accuracy. For the measurements, the RMSD between HIRS and CERES is 0.15 W/m
, and the RMSD between HIRS and ERBE is 0.53 W/m
. For the regression model, the RMSD between the model and HIRS is 0.34 W/m
.
The slope
from Equation (
1) is the derivative of the OLR with respect to global surface temperature. It is the longwave part of the climate feedback parameter as defined in [
15]. The measured value with 1
uncertainty interval we obtain is
It can be expected that the OLR rises with increasing global temperature. This is a mechanism by which earth can return to a climate equilibrium after an initial perturbation by an external radiative forcing. Our measured value of
can be compared with the model values from [
15]. If earth were a blackbody without an atmosphere, the derivation of the Planck curve yields
= 3.3 W/m
K. Inclusion of the water vapour feedback—if earth warms, its atmosphere contains more water vapour, which strengthens the greenhouse effect and yields a ‘clear-sky’
= 2.2 W/m
K.
is determined for 19 General Circulation Models (GCMs) in Table 10 of [
15]. The model ‘all-sky’
falls in the range 2.04–3.13. From the 19 models of
, only the six highest ones fall in the interval of Equation (
2). Comparing the measured ‘all-sky’
of Equation (
2) with the ‘clear-sky’
of 2.2 W/m
K, we can conclude there exists a ‘longwave cloud thinning effect’: as the earth warms, it contains less clouds, and becomes a more effective radiator. This cloud thinning effect is underestimated in most of the models.
After the 1991 Pinatubo eruption, there was a temporary drop in the OLR measured by ERBE and by HIRS, as well as in the global temperature. This episode is discussed in detail in [
16].
4. Regional Annual Mean Outgoing Longwave Radiation Change 1985–2017
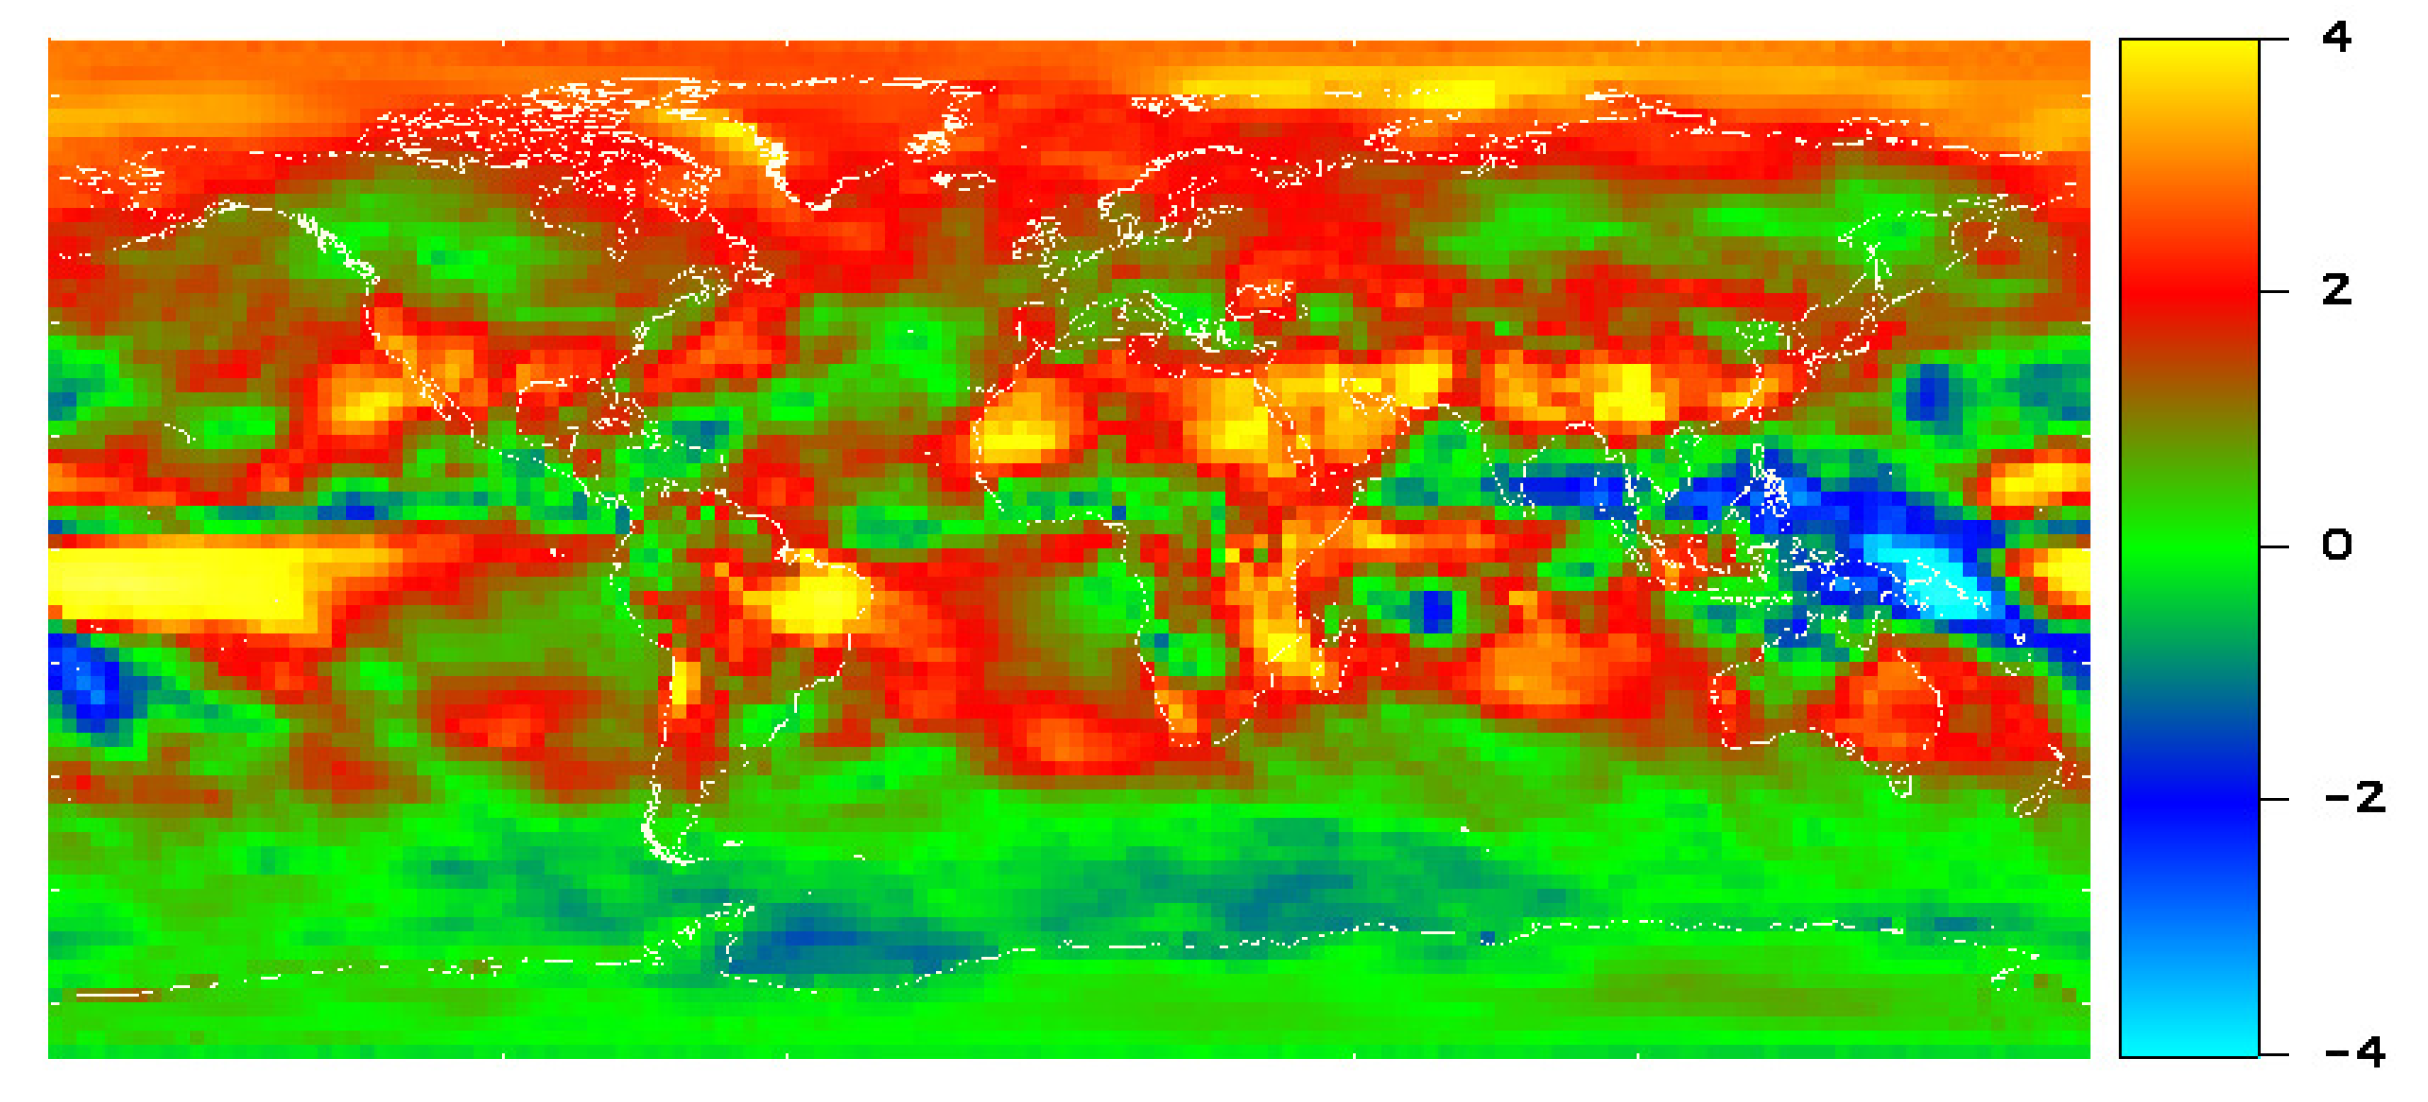
Figure 5 shows the mean HIRS OLR over the period 2001–2017 minus the mean over the period 1985–2000.
In
Figure 5, we can see an increase of the OLR (red-yellow colors) in the subtropical high pressure areas, part of the North-Hemisphere mid-latitude regions, and the Arctic, where the temperature rise is the highest. For reference,
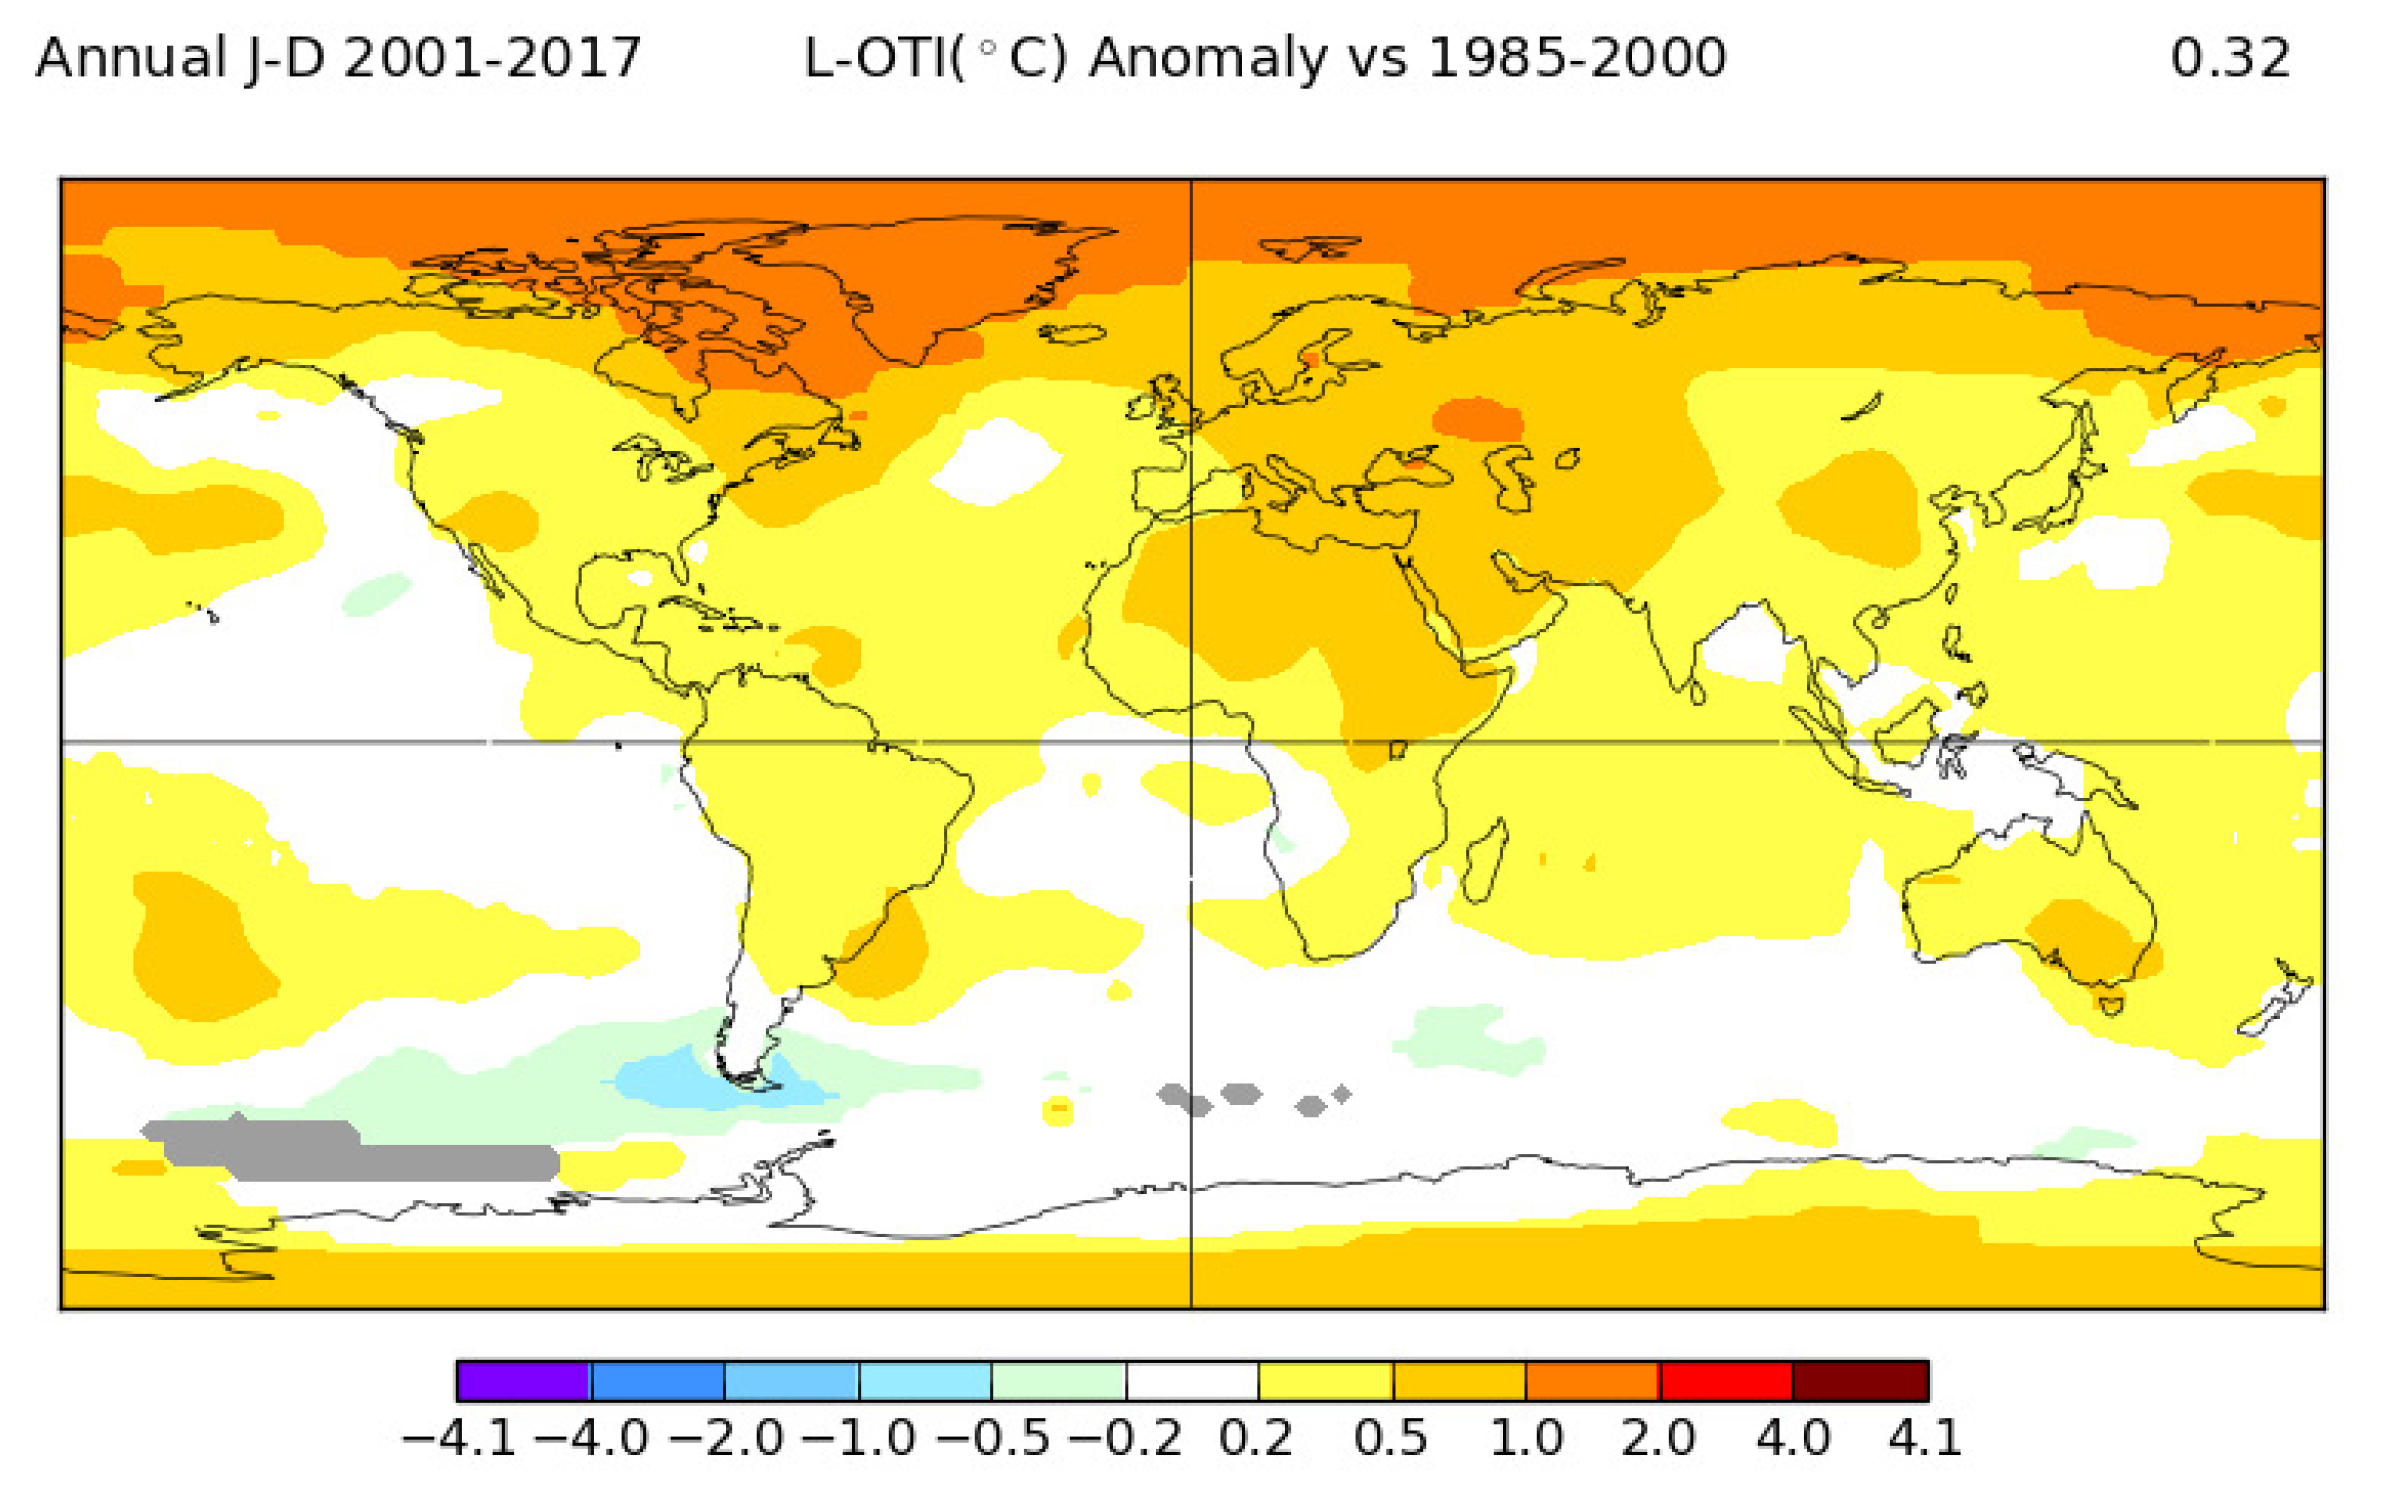
Figure 6 shows the NASA GISS temperature change from 1985–2000 to 2001–2017 [
14].
In the tropics, changes in OLR are visible in
Figure 5, which are related to El Niño/La Niña variability.
We use the Multivariate El Niño Index (MEI) from [
17] to characterise the El Niño/La Niña conditions. The MEI is a dimensionless index where a value of 1 indicates a medium strength El Niño and a value of −1 indicates a medium strength La Niña. From the monthly values provided by [
17], we produce running yearly means.
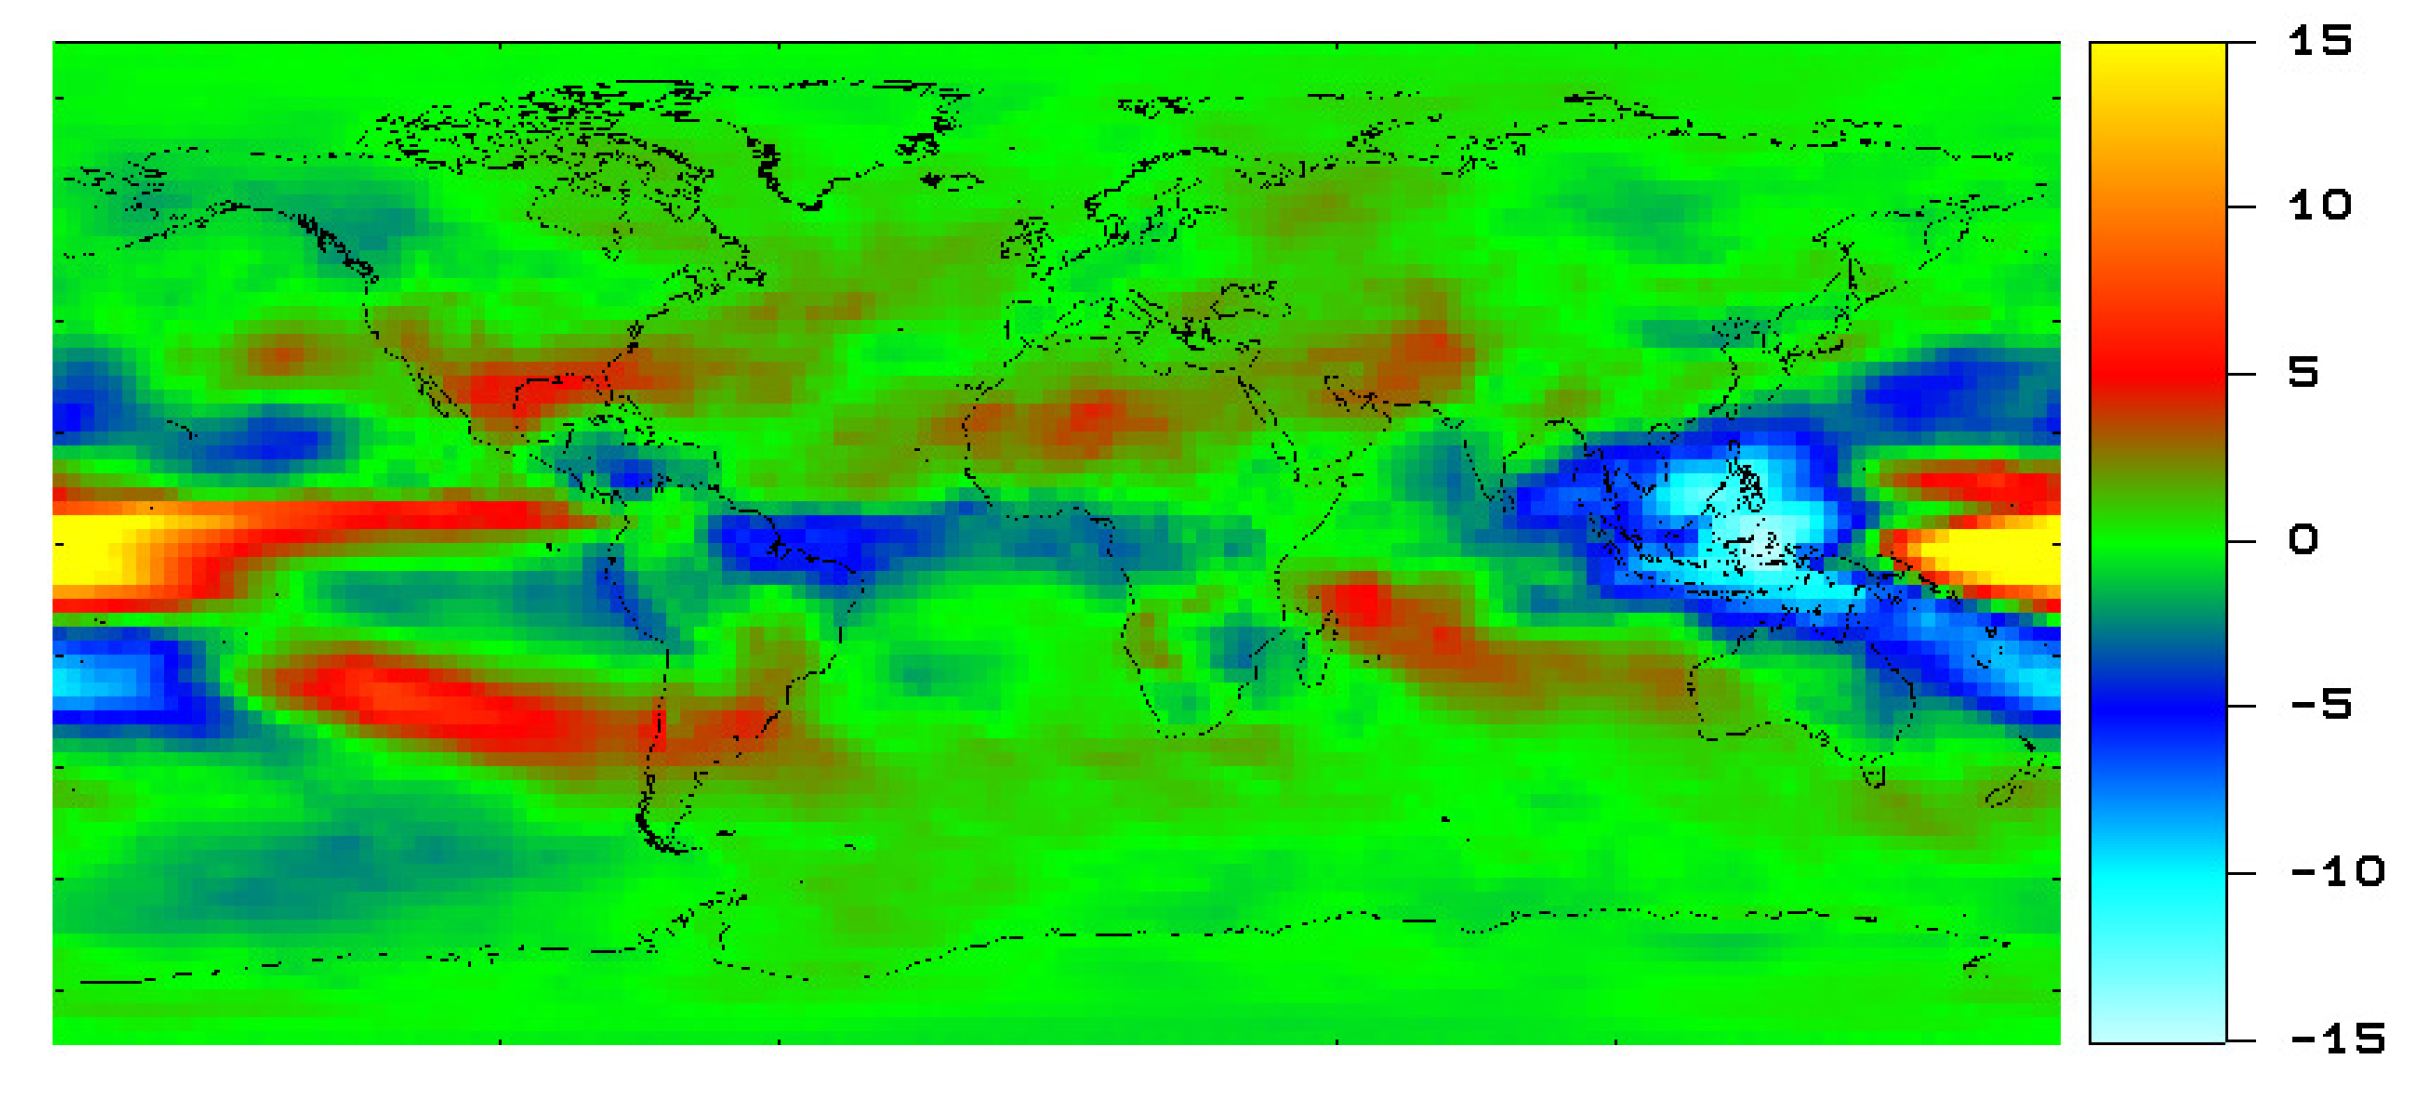
Figure 7 shows the variability of the HIRS OLR between El Niño years identified by a positive MEI and La Niña years identified by a negative MEI. Regions with a decreased OLR (blue colors in
Figure 7) have an increased precipitation during La Niña, regions with an increased OLR (red colors in
Figure 7) have a decreased precipitation during La Niña. The tropical spatial pattern of
Figure 5 shows some resemblance with the tropical spatial pattern of
Figure 7. This indicates a relative strengthening of La Niña after 2000. This is consistent with our earlier findings [
5].
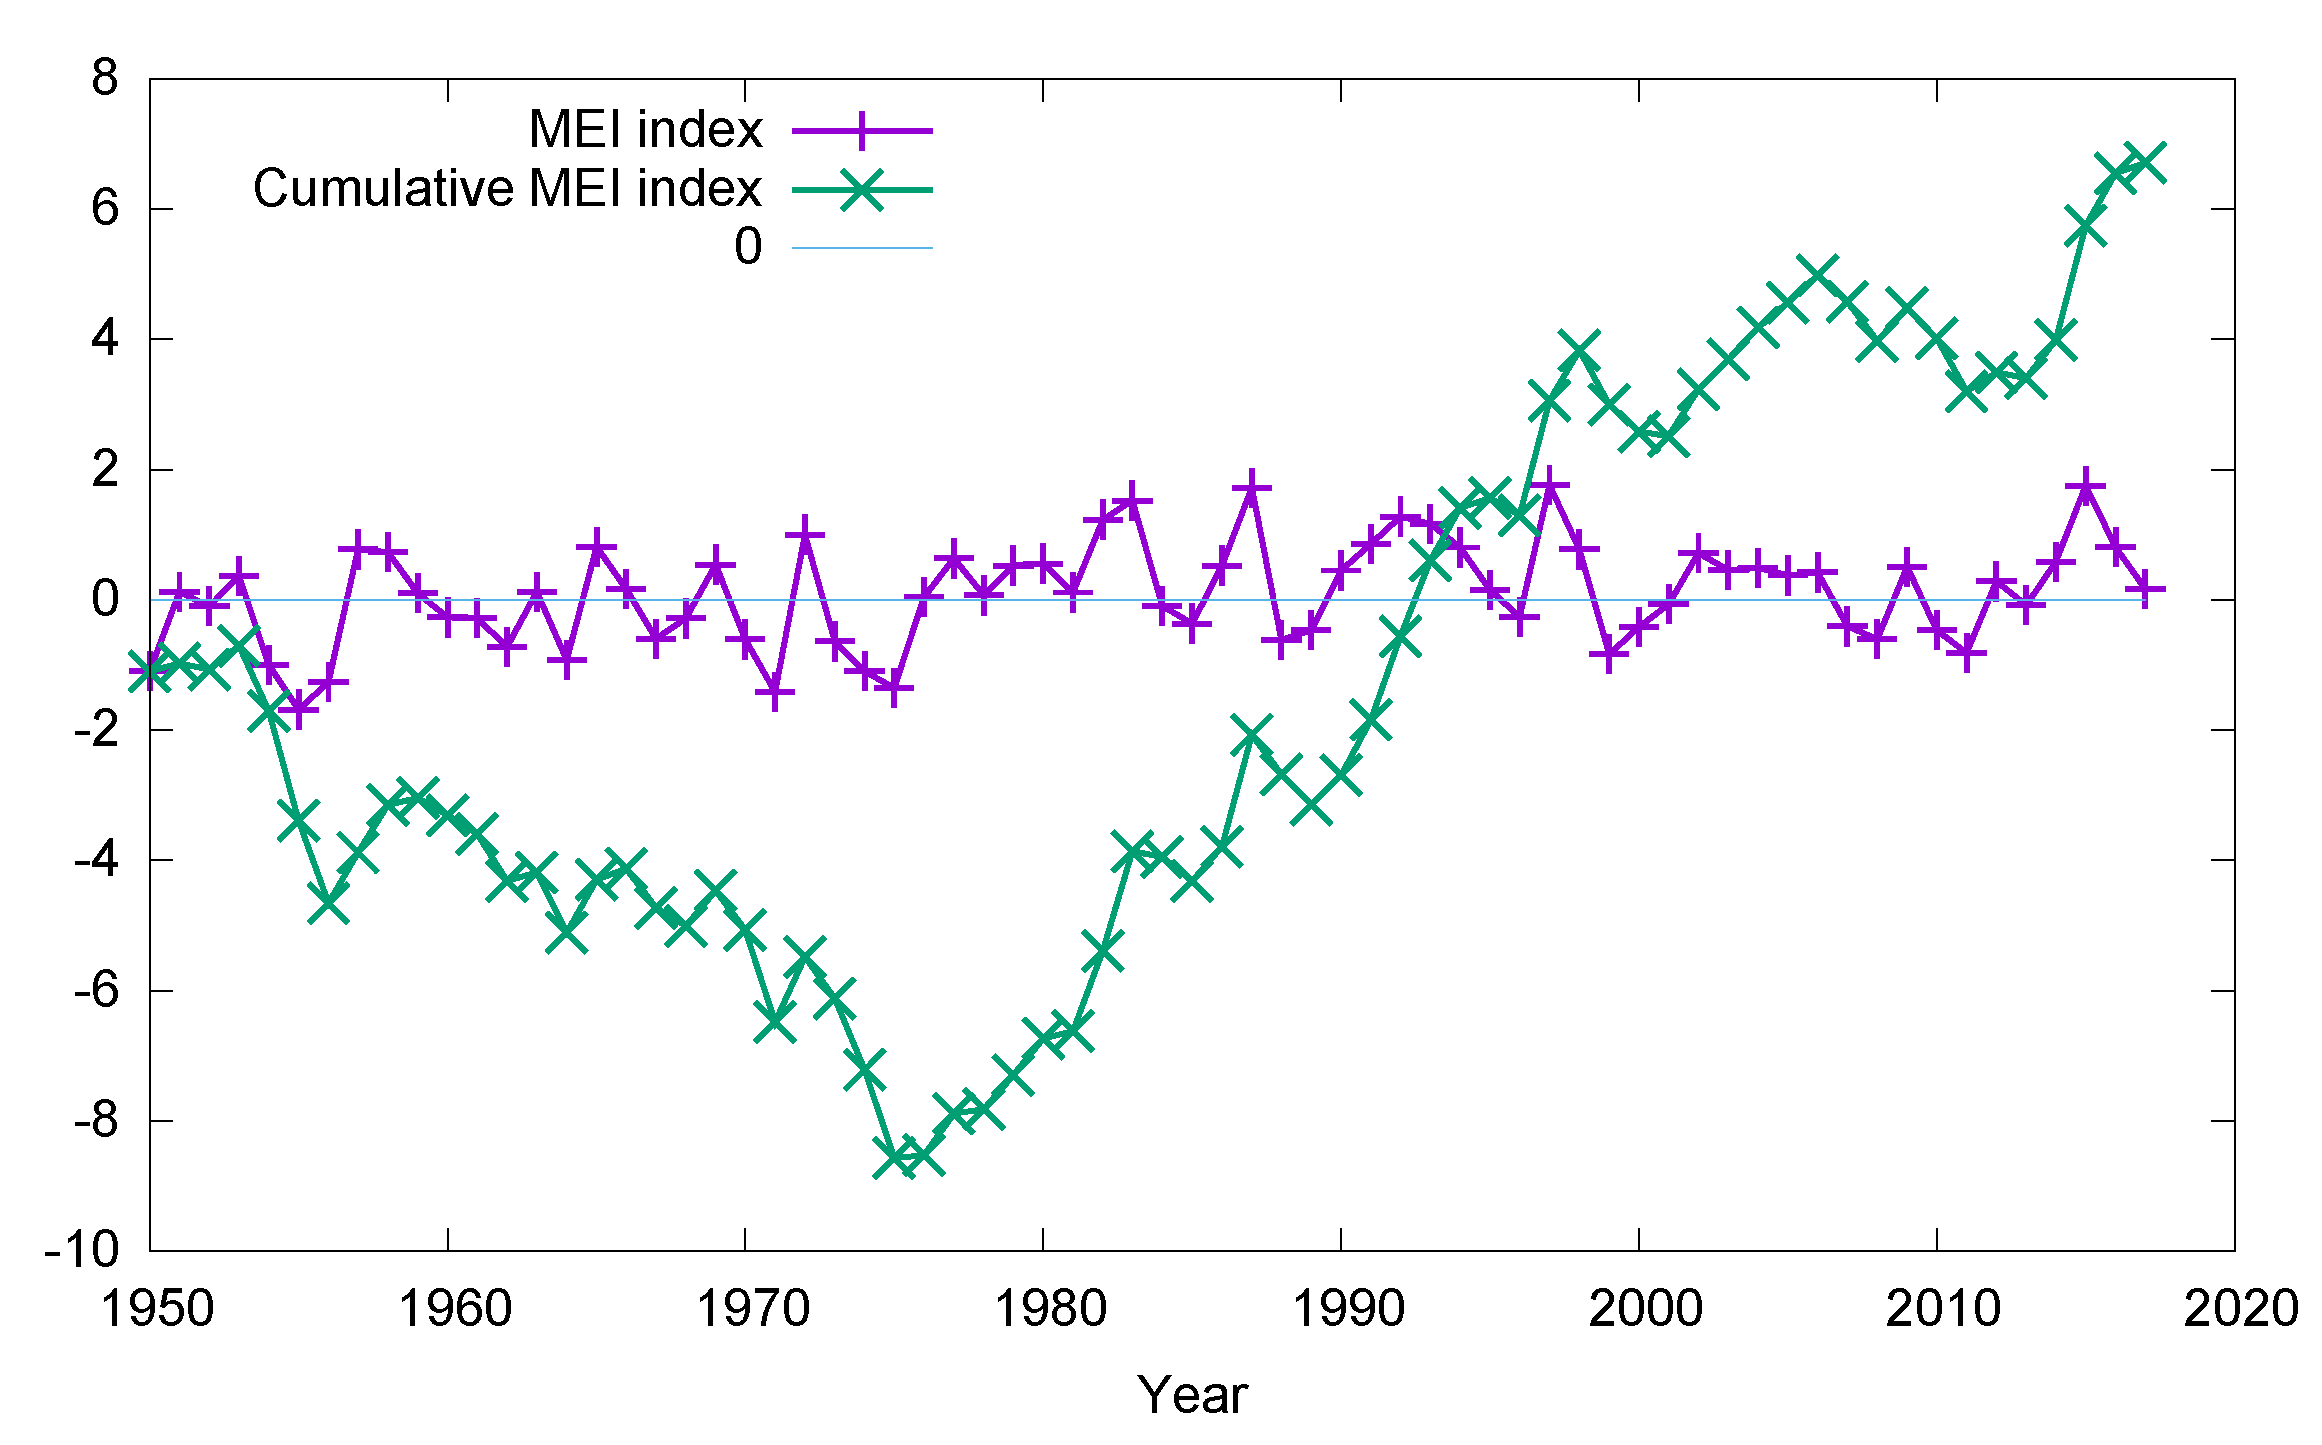
For a more detailed investigation of the decadal ENSO changes, in
Figure 8, we show the yearly MEI index
together with the Cumulative MEI index
defined as
From 1950 to 1975,
was decreasing, indicating a period of strong La Niñas. From 1975 to 1998,
was increasing, indicating a period of strong El Niños. From 1998 to 2014,
was relatively flat, indicating equal strength between La Niña and El Niño during the period. Compared to the period before 1998, this means that there was a relative strengthening of La Niña, and this explains the La Niña pattern we have found above in the tropical OLR variations in
Figure 5.
5. Discussion
We have analysed the long-term OLR change measured by the HIRS instruments over the period 1985–2017. The HIRS measurements were previously found to be of good quality [
10,
11] and are further validated in this study by comparison with the CERES Edition 4 OLR after 2000, and by comparison with the ERBE Edition 4 OLR before 1998. The RMSD with CERES is 0.15 W/m
, and the RMSD with ERBE is 0.53 W/m
.
From the joint analysis of the HIRS OLR and the NASA GISS global surface temperature anomaly, we derive an empirical estimate of the longwave climate feedback parameter
of 2.93 +/− 0.3 W/m
K 1
uncertainty interval. It is well known [
15,
18] that the ability of Global Climate Models (GCMs) to predict future climate change is limited by the knowledge of cloud feedback processes. Our empirical measurement of
allows for putting a constraint on the GCM longwave cloud feedback processes. Most of the GCMs in the [
15] study have too low of a
, indicating an underestimating of the ‘longwave cloud thinning effect’: as the earth warms, it contains less clouds and becomes a more effective radiator.
The spatial analysis of the regional OLR change from 1985–2000 to 2001–2017 shows a ‘clear-sky effect’ mixed a ‘tropical cloud’ effect.
Concerning the clear sky effect, we see regional changes of the OLR which are correlated with surface temperature changes. In the Arctic—where the strongest temperature increase occurs—we also see a strong increase in the OLR. In general, in the Northern Hemisphere—where the surface temperature increase is stronger than in the Southern Hemisphere—we also see an OLR increase.
Concerning the tropical cloud effect, we see regional patterns in the changes of the OLR, which are suggesting a relative strengthening of La Niña conditions compared to El Niño conditions. These changes imply societally important regional changes in precipitation. The relative La Niña strengthening can also be seen in the ‘cumulative MEI index’ that we have introduced.
Due to its fundamental importance for climate change, the monitoring and analysis of Earth’s Outgoing Longwave Radiation should be continued.
Author Contributions
S.D. made the data analysis and wrote this paper. N.C. made a validation of the manuscript.
Funding
This research received no external funding.
Acknowledgments
This paper was written in the context of projects funded by the Belgian Science Policy Office Belspo, Eumetsat and ESA. Data was provided by NASA, NOAA, and the University of Maryland.
Conflicts of Interest
The author declares no conflict of interest.
References
- IPCC. The Physical Science Basis; Cambridge University Press: Cambridge, UK; New York, NY, USA, 2013. [Google Scholar] [CrossRef]
- Arhenius, S. On the influence of carbonic acid in the air upon the temperature of the ground. Lond. Edinb. Dublin Philos. Mag. J. Sci. 1896, 41, 237–276. [Google Scholar] [CrossRef]
- Hansen, J.; Sato, M.; Kharecha, P.; von Schuckmann, K. Earth’s energy imbalance and implications. Atmos. Chem. Phys. 2011, 11, 13421–13449. [Google Scholar] [CrossRef] [Green Version]
- Dewitte, S.; Nevens, S. The Total Solar Irradiance Climate Data Record. Astrophys. J. 2016, 830, 25. [Google Scholar] [CrossRef]
- Dewitte, S.; Clerbaux, N. Measurement of the Earth Radiation Budget at the top of atmosphere—A review. Remote Sens. 2017, 9, 1143. [Google Scholar] [CrossRef]
- Wielicki, B.; Barkstrom, B.; Harrison, E.; Lee, R.; Smith, G.; Cooper, J. Clouds and the Earth’s Radiant Energy System (CERES): An earth observing experiment. Bull. Am. Meteorol. Soc. 1996, 77, 853–868. [Google Scholar] [CrossRef]
- Loeb, N.; Doelling, D.; Wang, H.; Su, W.; Nguyen, C.; Corbett, J.; Liang, L.; Mitrescu, C.; Rose, F.; Kato, S. Clouds and the Earth’s Radiant Energy System (CERES) Energy Balanced and Filled (EBAF) Top-of-Atmosphere (TOA) Edition-4.0 Data Product. J. Clim. 2018, 31, 895–918. [Google Scholar] [CrossRef]
- Barkstrom, B.; Smith, G. The Earth Radiation Budget Experiment: Science and implementation. Rev. Geophys. 1986, 24, 379–390. [Google Scholar] [CrossRef]
- Data Quality Summary. ERBE S10n Ed4.0. Distributed by the Atmospheric Science Data Center. 2017. Available online: http://eosweb.larc.nasa.gov (accessed on 24 September 2018).
- Lee, H.-T.; Gruber, A.; Ellingson, R.; Laszlo, I. Development of the HIRS Outgoing Longwave Radiation Climate Dataset. J. Atmos. Ocean. Technol. 2007, 24, 2029–2047. [Google Scholar] [CrossRef] [Green Version]
- Raschke, E.; Kinne, S.; Stackhouse, P. Gewex Radiative Flux Assessment; WCRP Report No. 19/2012; World Climate Research Programme (WCRP): Geneva, Switzerland, December 2012. [Google Scholar]
- Yang, G.-Y.; Slingo, J. The diurnal cycle in the tropics. Mon. Weather Rev. 2001, 129, 784–801. [Google Scholar] [CrossRef]
- Wallace, J.; Hobbs, P. Atmospheric Science: An Introductory Survey; Academic Press: Cambridge, MA, USA, 1977. [Google Scholar]
- Hansen, J.; Ruedy, R.; Sato, M.; Lo, K. Global surface temperature change. Rev. Geophys. 2010, 48, RG4004. [Google Scholar] [CrossRef]
- Cess, R.; Potter, G.L.; Blanchet, J.P.; Boer, G.J.; del Genio, A.D.; Déqué, M.; Dymnikov, V.; Galin, V.; Gates, W.L.; Ghan, S.J.; et al. Intercomparison and interpretation of climate feedback processes in 19 Atmospheric General Circulation Models. J. Geophys. Res. 1990, 95, 16601–16615. [Google Scholar] [CrossRef]
- Soden, B.; Wetherald, R.; Stenchikov, G.; Robock, A. Global cooling after the eruption of Mount Pinatubo: A test of climate feedback by water vapor. Science 2002, 296, 727–730. [Google Scholar] [CrossRef] [PubMed]
- Wolter, K.; Timlin, M. El Niño/Southern Oscillation behaviour since 1871 as diagnosed in an extended multivariate ENSO index (MEI.ext). Int. J. Clim. 2011, 31, 1074–1087. [Google Scholar] [CrossRef] [Green Version]
- Boucher, O.; Randall, D.; Artaxo, P.; Bretherton, C.; Feingold, G.; Forster, P.; Kerminen, V.-M.; Kondo, Y.; Liao, H.; Lohmann, U.; et al. Chapter 7: Clouds and Aerosols. In Climate Change 2013: The Physical Science Basis. Contribution of Working Group I to the Fifth Assessment Report of the Intergovernmental Panel on Climate Change; Cambridge University Press: Cambridge, UK; New York, NY, USA, 2013. [Google Scholar]
© 2018 by the authors. Licensee MDPI, Basel, Switzerland. This article is an open access article distributed under the terms and conditions of the Creative Commons Attribution (CC BY) license (http://creativecommons.org/licenses/by/4.0/).
