Article

Water Loss Due to Increasing Planted Vegetation over the Badain Jaran Desert, China

1
Center for Hydrologic Cycle and Water Resources in Arid Region, College of Earth and Environmental Sciences, Lanzhou University, Lanzhou 730000, China
2
Climate Change Cluster (C3), University of Technology Sydney, Ultimo, NSW 2007, Australia
3
Centre for Biodiversity and Conservation Science, School of Earth and Environmental Sciences, University of Queensland, St Lucia, QLD 4069, Australia
4
Department Biogeochemical Integration, Max-Planck Institute for Biogeochemistry, 07745 Jena, Germany
*
Author to whom correspondence should be addressed.
Remote Sens. 2018, 10(1), 134; https://doi.org/10.3390/rs10010134
Submission received: 5 December 2017 / Revised: 4 January 2018 / Accepted: 15 January 2018 / Published: 18 January 2018
(This article belongs to the Special Issue Remote Sensing of Arid/Semiarid Lands)

Abstract

:
Water resources play a vital role in ecosystem stability, human survival, and social development in drylands. Human activities, such as afforestation and irrigation, have had a large impact on the water cycle and vegetation in drylands over recent years. The Badain Jaran Desert (BJD) is one of the driest regions in China with increasing human activities, yet the connection between human management and the ecohydrology of this area remains largely unclear. In this study, we firstly investigated the ecohydrological dynamics and their relationship across different spatial scales over the BJD, using multi-source observational data from 2001 to 2014, including: total water storage anomaly (TWSA) from Gravity Recovery and Climate Experiment (GRACE), normalized difference vegetation index (NDVI) from Moderate Resolution Imaging Spectroradiometer (MODIS), lake extent from Landsat, and precipitation from in situ meteorological stations. We further studied the response of the local hydrological conditions to large scale vegetation and climatic dynamics, also conducting a change analysis of water levels over four selected lakes within the BJD region from 2011. To normalize the effect of inter-annual variations of precipitation on vegetation, we also employed a relationship between annual average NDVI and annual precipitation, or modified rain-use efficiency, termed the RUEmo. A focus of this study is to understand the impact of the increasing planted vegetation on local ecohydrological systems over the BJD region. Results showed that vegetation increases were largely found to be confined to the areas intensely influenced by human activities, such as croplands and urban areas. With precipitation patterns remaining stable during the study period, there was a significant increasing trend in vegetation greenness per unit of rainfall, or RUEmo over the BJD, while at the same time, total water storage as measured by satellites has been continually decreasing since 2003. This suggested that the increased trend in vegetation and apparent increase in RUEmo can be attributed to the extraction of ground water for human-planted irrigated vegetation. In the hinterland of the BJD, we identified human-planted vegetation around the lakes using MODIS observations and field investigations. Four lake basins were chosen to validate the relationship between lake levels and planted vegetation. Our results indicated that increasing human-planted vegetation significantly increased the water loss over the BJD region. This study highlights the value of combining observational data from space-borne sensors and ground instruments to monitor the ecohydrological dynamics and the impact of human activities on water resources and ecosystems over the drylands.

Graphical Abstract

1. Introduction

Drylands, including arid, semi-arid, and dry sub-humid areas, characterized by limited precipitation and scarce rivers, cover about 41% of the Earth’s land surface and are home to more than one-third of the global population [1]. In the arid areas, ecosystems are highly fragile due to insufficient water supplementation and are sensitive to evaporation changes caused by global warming [2]. With the repaid growth of the human population and the development of technology, the alteration of environments has become excessive [3]. Threatened by climate change and human impact, water shortages, soil salinization, desertification, and biodiversity reduction have become crucial problems in arid areas worldwide.
In China, arid regions are mainly distributed over the northwestern areas, which are far from the oceans, and occupy about 2.34 million km2 or 24.5% of the Chinese territory. Although global warming has become evident, the temperature rise is spatially and temporally non-uniform. The highest rate of warming was found over the arid and semiarid regions of the northern mid-latitudes during recent decades [4,5,6], with Inner Mongolia having the largest temperature rise rate of 0.4 °C per decade [7]. It was also found that climate changes in the northwestern part are the most intensive and have been aggravated by human activities [8,9]. In the arid regions of China, human activities are mainly located on river deltas or alluvial-diluvial plains where oases exist [10,11]. However, with the rapid population increase and land development, groundwater has been extracted to supply increasing water demands for irrigation and civilian consumption [12]. Meanwhile, large-scale afforestation projects were implemented to improve the environment in arid and semi-arid areas by the Chinese government [13,14,15]. However, afforestation and irrigation can alter the hydrological cycle, enlarge regional evapotranspiration, and reduce stream flow and groundwater, which in turn may harm the dryland ecosystems [16,17,18]. While afforestation and irrigation implementation have improved the environment to a limited spatial extent and temporal duration, overall desertification has deteriorated continuously in oasis-desert ecotones [15].
In north-central China, one of the arid areas, as the altitude decreases, the Qilian Mountain, the Hexi Corridor (a string of oases), and the Badain Jaran Desert are spatially distributed from southwest to northeast. Oases represent 4% of the total area and are home to more than 95% of the population and over 90% of the social wealth [19]. With the dense and rapidly increasing population, water scarcity has become an urgent issue in this region [20]. The magnitude of human activity has begun to expand to the oasis-desert ecotones, which are highly fragile and easy to transform into desert. Land reclamation and water resource management have become crucial issues, along with social development in drylands. Disturbances were also found at the lake group region in the hinterland of the BJD in recent years, which was previously rarely affected by humans due to its remote location and the lack of transportation into the area. Plants such as Haloxylon, Salix, and Populus have been planted through the years around many lakes for the purposes of desertification control and tourism development. As water resources provide vital life-support systems for the survival of plants and animals, as well as human habitation over this region, a better understanding of the impact of human influences on water resources and the associated ecosystem is urgently needed for future sustainable development over the BJD region and other drylands across the globe.
Due to the harsh environment, there is an absence of studies and long-term in-situ observations in the hinterland of the BJD and surrounding areas. The Remote Sensing technique can now provide the potential to retrospectively monitor the meteorological and ecological elements over these drylands. From the early 1980s, researchers began to use satellite derived vegetation index data (e.g., NDVI) to track ecological dynamics [21,22,23,24], and through the years, the remote sensing technique for monitoring ecohydrological variations has been demonstrated to be useful at regional to global spatial scales [25,26,27,28,29,30,31,32,33]. In addition, rain-use efficiency (RUE; the ratio of vegetation productivity to annual precipitation) has been widely used as a proxy to assess land degradation and improvement in drylands [31,34,35,36]. Moreover, surface water extent and total water storage variations derived from various satellite data have also been introduced to the study of ecological dynamics and hydrological processes over drylands [37,38,39,40]. However, most former studies focused on land degradation, while studies on human induced vegetation improvements and their interactions with the ecohydrological processes are still insufficient.
In this study, we combined multi-sensor satellite observations with in-situ hydrometeorological measurements to investigate the effect of human activities on dryland ecohydrology at local desert lake basins and over the whole BJD region. In particular, we aimed to (1) examine the spatial-temporal patterns of large-scale hydrological dynamics (TWS and precipitation); (2) extract the planted vegetation and assess their trends over the study area; and (3) quantify the responses of lake levels to planted vegetation changes and relate them to human activities at regional study sites. Results from this research will generate a better understanding of the human influence on ecohydrological processes in dryland environments.

2. Materials and Methods
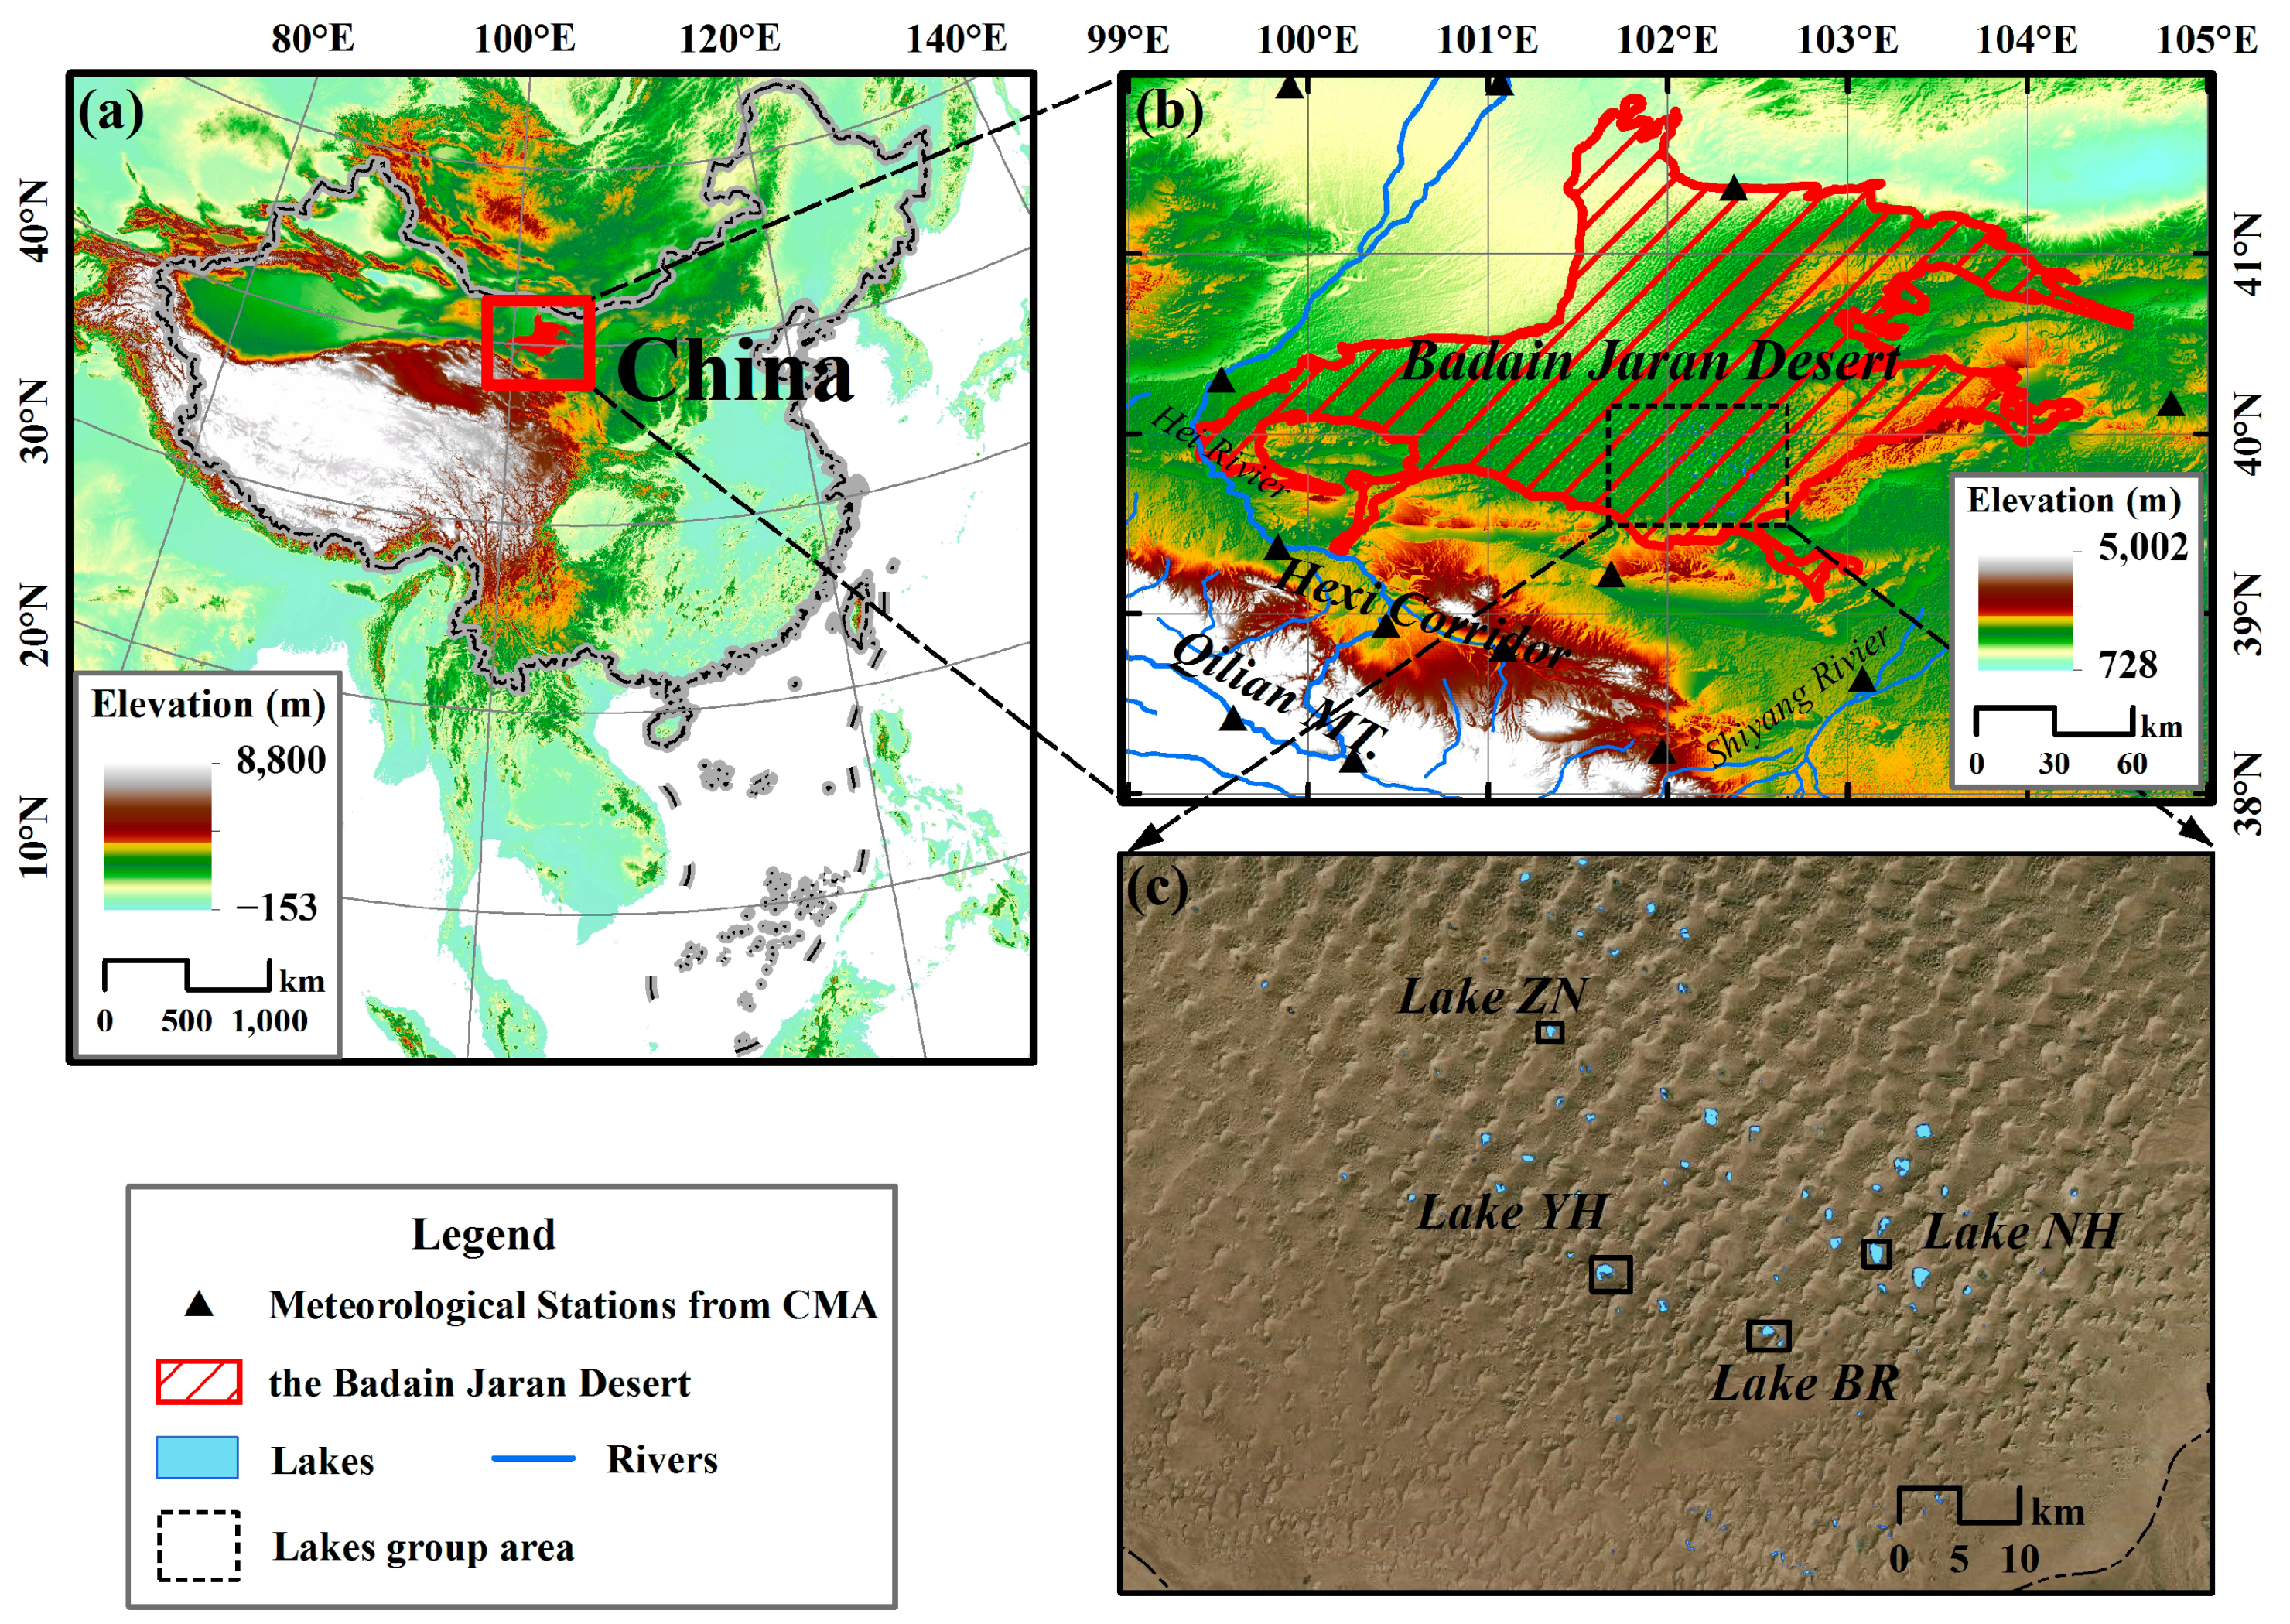
2.1. Study Area

The study area (approximately 22.6 × 10⁴ km2) covers the BJD and parts of the Hexi Corridor and the Qilian Mountains (38°N–42°N, 99°E–105°E) (Figure 1). The climate in the study area varies with topography and environmental gradients. From the BJD to the Qilian Mountains, there is a significant increment in precipitation (from 40 mm to 700 mm) with increasing altitude and decreasing latitude. The Hei River and Shiyang River are the main surface water sources originating from the Qilian Mountains, running through the Hexi Corridor, and terminate at the edge of the BJD. Runoff and melted snow water from higher altitudes are the main water supplies for these rivers. Driven by the water availability of rivers, cities and oases are distributed along the Hexi Corridor. The Hexi Corridor is an important sector of the Silk Road and the New Asia–European Railway, and it has five administrative areas including the Jinchang Region, Wuwei Region, Zhangye Region, Jiayuguan Region, and Jiuquan Region. The population of the Hexi Corridor increased from 3.8 million in 1985 to 4.86 million in 2015. Apart from the barren lands, croplands are the main land cover type in the Hexi Corridor. Due to the rapid increase in population and cultivation of lands, water usage has exceeded the water resources carrying capacity here.
The BJD is located within the Alxa Plateau in western Inner Mongolia. With an area of 5.2 × 10⁴ km2, it is the second-largest desert in China [41]. The climate of the BJD is the extreme continental desert type [42]. The regional mean annual precipitation is 77 mm, mainly concentrated from July through September. Rainfall declines from the southeast to the northwest. Over 110 perennial lakes are spread among the mega-dunes in the southeastern margin of the BJD, here referred to as the BJD lake group area. The largest lake has an area of 2.32 km2 and the majority of the lakes are smaller than 0.5 km2. The major phreatic aquifer in the BJD is formed by the principally Holocene Aeolian sands, which are deposited unconformably above the older sediments [43]. Most of the lakes in the hinterland of the BJD are hypersaline lakes (the highest total dissolved solids can reach to 300 g/L) under the high evaporation circumstance [44,45]. By contrast, all the springs and groundwater from the deep wells are fresh water with the TDS below 1 g/L, and serve as critical water sources for the animals and humans living in the desert. Terrestrial vegetation is distributed like belts around the lake shores with areal extents of more than 100 m. With increasing distance from the lake shores, the depth of groundwater deepens gradually and vegetation coverage decreases accordingly [46].

2.2. Terrestrial Total Water Storage

To explore the large-scale hydrological dynamics over the BJD region, we used a decade (2003–2014) of Total Water Storage Anomaly (TWSA) data derived from the Gravity Recovery and Climate Experiment (GRACE) satellites. The GRACE twin satellites system, launched in March 2002, has an advantage of measuring the water changes over large regions. Total water storage anomaly data used in this study are release-5, level-2 GRACE data, which were obtained from NASA’s GRACE Tellus website [47] for the BJD area. To reduce the uncertainties, the ensemble mean values of TWSA data were calculated using GRACE data processed independently by three research centers: the NASA Jet Propulsion Laboratory (JPL), University of Texas Center for Space Research (CSR), and the GeoForschungsZentrum Potsdam (GFZ). TWSA represents the changes in vertically integrated water storage, including groundwater, surface water, soil moisture, snow water, and biological water. As surface water, snow, and biological water are scarce over the BJD region, GRACE-derived TWSA patterns mainly represent the variations in the sum of surface soil moisture and groundwater. In order to ascertain the changes of water and remove the effect of the mass from solid earth, TWSA was calculated by subtracting the monthly GRACE data by a time-mean baseline (2004–2009). We used a scaling factor derived from the NCAR’s Community Land Model 4.0 (CLM4.0) [48,49,50]. Scaling factors are used to reduce the bias and leakage errors that resulted from filtering or removing high-frequency noise in GRACE signals, thus a suitable scaling factor approach is important for the meticulous quantification of GRACE observed TWSA [51]. The spatial resolution of gridded GRACE is one-degree and the temporal resolution is monthly.

2.3. Precipitation

Monthly precipitation data products were downloaded from the China Meteorological Administration directly [52]. This product was derived from observations of meteorological stations since 1961 and spatially interpolated by using the thin plate spline method to obtain 0.5-degree resolution raster data [53]. In total, 13 meteorological stations are distributed in the study areas. In order to analyze the relationship between precipitation and desert vegetation at the pixel-scale, the 0.5-degree resolution precipitation products were further resampled to the same resolution as the MODIS NDVI data (250 m and 1000 m resolutions) using the bilinear resampling method.

2.4. In Situ Lake Level Measurements

Lake level changes were monitored by several self-contained water level data loggers (Solinst, 3001 Gold, piezoresistive sensor) sited under the lake’s water surface since 2011 in the BJD. The water levels were calibrated by subtracting the air pressure value through a separate sensor installed at Lake Nanhaizi. Lake level data of four specific lakes were selected in this study, including Lake Nanhaizi (NH) (102.43°E, 39.79°N), Lake Barunyikeri (BR) (102.31°E, 39.72°N), Lake Zhongnuoertu (ZN) (102.09°E, 39.94°N), and Lake Yihejigede (YH) (102.15°E, 39.7°N). Original 30 min frequency lake level data were averaged into monthly periods to reduce high-frequency fluctuations. To eliminate differences in the depth of the data loggers from the water surface, we subtracted the first year mean value from the lake levels data to investigating the relative variations of the lake levels, and this process has no effect on the lake levels trend analysis.

2.5. Other Supplementary Data

A land cover map for 2000 was generated from the WESTDC Land Cover Products [54], which has a 1 km spatial resolution. The land cover map used the IGBP (International Geosphere-Biosphere Programme) land cover classification system for reference. The land cover map can help identify the human activity area.
The Digital Elevation Model (DEM) data of the BJD from Shuttle Radar Topography Mission (SRTM) version 3.0 was downloaded from USGS [55]. The DEM data has a 30 m spatial resolution and was used to extract the sub basin of lakes in the BJD.

2.6. Vegetation Extraction

The normalized difference vegetation index (NDVI) represents vegetation greenness based on the differences in surface reflectance averaged over ranges of wavelengths in the visible (~ 0.660 µm) and near-infrared (~ 0.860 µm) regions of the spectrum [56]. The formulation of NDVI is defined as:
NDVI = ( N I R R e d ) ( N I R + R e d )
where NIR is the reflectance of near-infrared (~0.860 µm) and Red is the reflectance of visible (~0.660 µm).
MODIS-derived NDVI, level-3, collection-6 MODIS data, was retrieved from the online Data Pool, courtesy of the NASA Land Processes Distributed Active Archive Center (LP DAAC), USGS/Earth Resources Observation and Science (EROS) Center, Sioux Falls, South Dakota [57]. MOD13Q1 and MOD13A2 were used here for different spatial scales. MOD13Q1 data with resolutions of 250 m and 16 days were used for monitoring the limited vegetation around the lakes in the desert, and MOD13A2 data with resolutions of 1000 m and one-month were used for the whole study area. High-quality pixels were selected by using the pixel reliability band contained in MODIS products [58]. A linear interpolation method was used for gap-filling the missing NDVI values. The distributions of the vegetation variability trend and aggregated average over the study area from 2001 to 2014 were mapped. To extract the vegetation around lakes in the desert, we averaged summer (from June to August) NDVI from 14 years into one image, and the vegetation growth area was defined as the vegetation amounts exceeding an NDVI threshold value in the average summer image. The vegetation in the desert was relatively sparse, and according to other vegetation retrieval methods in the dry land, we used a threshold NDVI = 0.15 to extract the vegetation around the desert lakes [38]. Sub-basins of lakes and vegetation were divided by using digital elevation data (STRM, version 3.0). Time series of spatial average NDVI in different sub-basins were obtained to investigate the vegetation variations around four lakes.

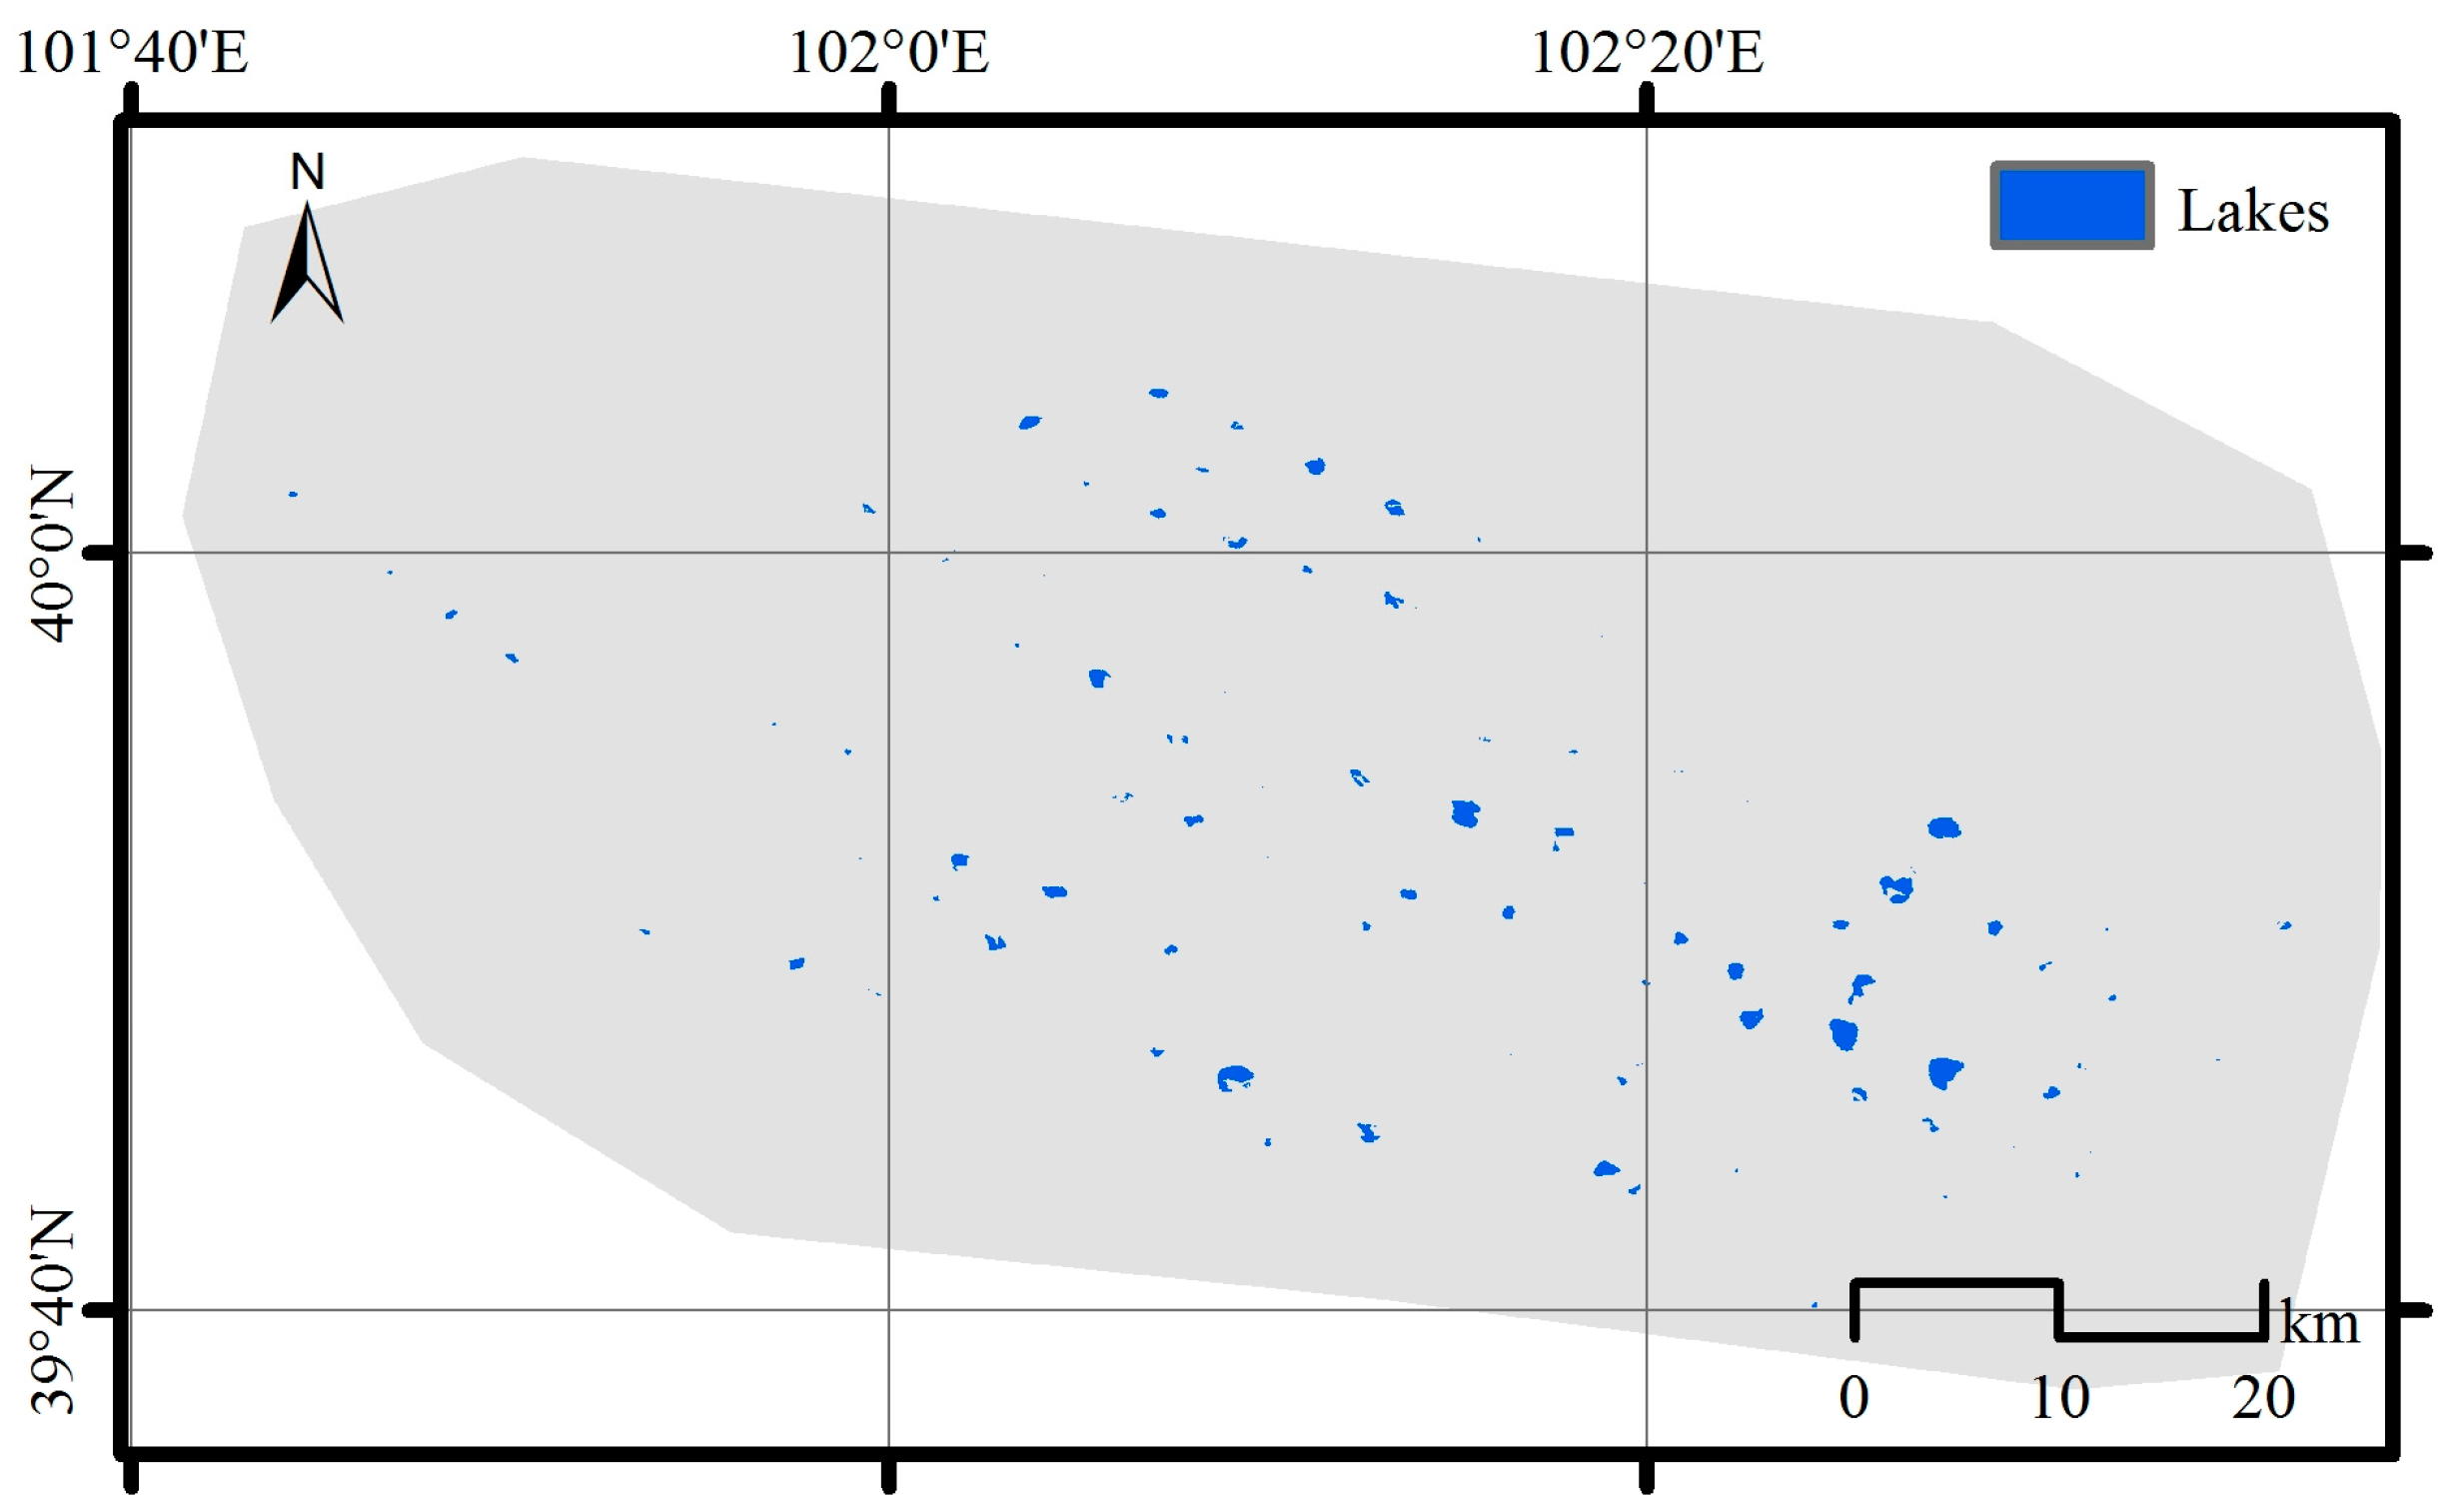
2.7. Lake Area Mapping

We used Landsat data of the Climate Data Record (CDR) surface reflectance product retrieved from Thematic Mapper (TM Landsat 4–5) and Enhanced Thematic Mapper Plus (ETM+ Landsat-7) sensors in this study. TM and ETM+ imagery have the same seven spectral bands, including band 1 Visible (0.45–0.52 µm), band 2 Visible (0.52–0.60 µm), band 3 Visible (0.63–0.69 µm), Band 4 Near-Infrared (0.76–0.90 µm), band 5 Near-Infrared (1.55–1.75 µm), and band 7 Mid-Infrared (2.08–2.35 µm) of a 30 m resolution, and a thermal band (10.40–12.50 µm) of a 120 m resolution. The TM/ETM+ images (path 132, row 32) with cloud cover of less than 5% were carefully selected and downloaded from the USGS website [59]. To solve the shadow effect of the sand dunes, the automated water extraction index without shadow (AWEIsh) was selected as the water index to retrieve the water surface and a threshold of AWEIsh larger than −0.05 was set to extract water surface extent [39,60,61]. AWEIsh was defined as:
AWEI sh = ρ b a n d 1 + 2.5 × ρ b a n d 2 1.5 × ( ρ b a n d 4 + ρ b a n d 5 ) 0.25 × ρ b a n d 7
where ρband is the surface reflectance from TM/ETM data.
The images extent covered over 95% of the water surface areas in the BJD, and we calculated the total water surface areas in each image from 2003 to 2011 (Figure 2). Winter period (December, January, and February) data were excluded due to unavoidable shadows overlaying the water surface caused by the mega sand dunes and the low solar elevation at midday in the mid-latitudes location (40°N) during winter. We averaged the water surface areas data in spring (March–May), summer (June–August), and autumn (September–November), and obtained the lake area time series.

2.8. Identification of the Increase in Planted Vegetation

We used the Rain-Use Efficiency (RUE) concept in this study for identifying the increment of planted vegetation. Originally, RUE was treated as a steady value throughout the various arid and semi-arid zones of the world, so the spatio-temporal changes in RUE have been suggested for evaluating land degradation and improvement [28,34,62,63]. Since a near-linear relation may be assumed to exist between annual NDVI and primary productivity, NDVI was generally used as a proxy of primary productivity to calculate RUE [64,65,66,67]. The theoretical basis for the concept of RUE assumes a proportionality between NDVI and precipitation, which means that NDVI and rainfall should be forced to intercept at zero with changes in the precipitation. However, NDVI is always slightly positive, even on bare soils, which means that the intercept is larger than zero [36,68]. In addition, NDVI from the irrigated areas was also larger than zero as precipitation approaches zero. If this intercept is not considered, the ratio of NDVI to annual precipitation will decrease with increasing precipitation [36].
In order to monitor the land degradation and improvement unambiguously, we modified the RUE by subtracting the intercept from NDVI before calculating the NDVI to annual precipitation ratio. A strong linear relationship between NDVI and precipitation amount has been identified by studies in drylands [69,70], and the influence of the changes in NDVI can be divided into climate and human-induced parts, so the relationship of pixel scale NDVI, precipitation, and human influence have a relation defined as:
NDVI = a × P + b + Δ c human
where NDVI is the annual mean MODIS NDVI and P is the annual accumulated precipitation; a and b are the slope and intercept of the linear regression, respectively; and ∆chuman represents the human activity changes on the vegetation in this study. If the human activity on the vegetation stayed stable, ∆chuman would be zero. Changes in human activities mainly include land reclamation, agricultural activities, and afforestation in this region. To calculate the intercept b, we assumed that the human activity stayed relatively stable during 2001 to 2007, and pixel-wise ordinary least squares (OLS) regression of annual mean NDVI against annual precipitation from 2001 to 2007 were computed. The intercept b2001–2007 then used in the modified RUE, termed RUEmo, for time series during 2001 to 2014:
RUE mo = ( NDVI b 2001 2007 P ) × L
A scale (L) of 10,000 was used here to enlarge the RUEmo value. The RUEmo trend of each pixel from 2001 to 2014 was calculated by using linear regressions. A stable trend of RUEmo means human activity was stable or no human activity occurs in this region, and a changing RUEmo trend indicated that human activity promoted vegetation growth during the observation period. In addition, an NDVI annual time series was also calculated to monitor the vegetation changes.

2.9. Statistical Methods

To reveal the intra-annual and inter-annual variability of TWS, precipitation, NDVI, and water level, we decomposed these monthly time series data into seasonal, trend, and irregular components using the “Seasonal Decomposition of Time Series by LOESS” (STL) method [71]. The trend is calculated as the slope of the linear regressions of deseasonalized data during our study period. The Mann-Kendall trend test was used to detect the significance level of the linear trend.
To relate TWSA changes to the precipitation in the arid regions, cross-correlation analysis was applied to quantify the relationships between them with different time lags. Spatial average data were processed into monthly time series to represent the TWSA variations over the study region (38°N to 42°N, 99°E to 105°E). For each pixel, a linear regression with the ordinary least squares method (OLS) was applied to estimate the inter-annual trends in NDVI and RUEmo over the study area from 2003 to 2014.

3. Results

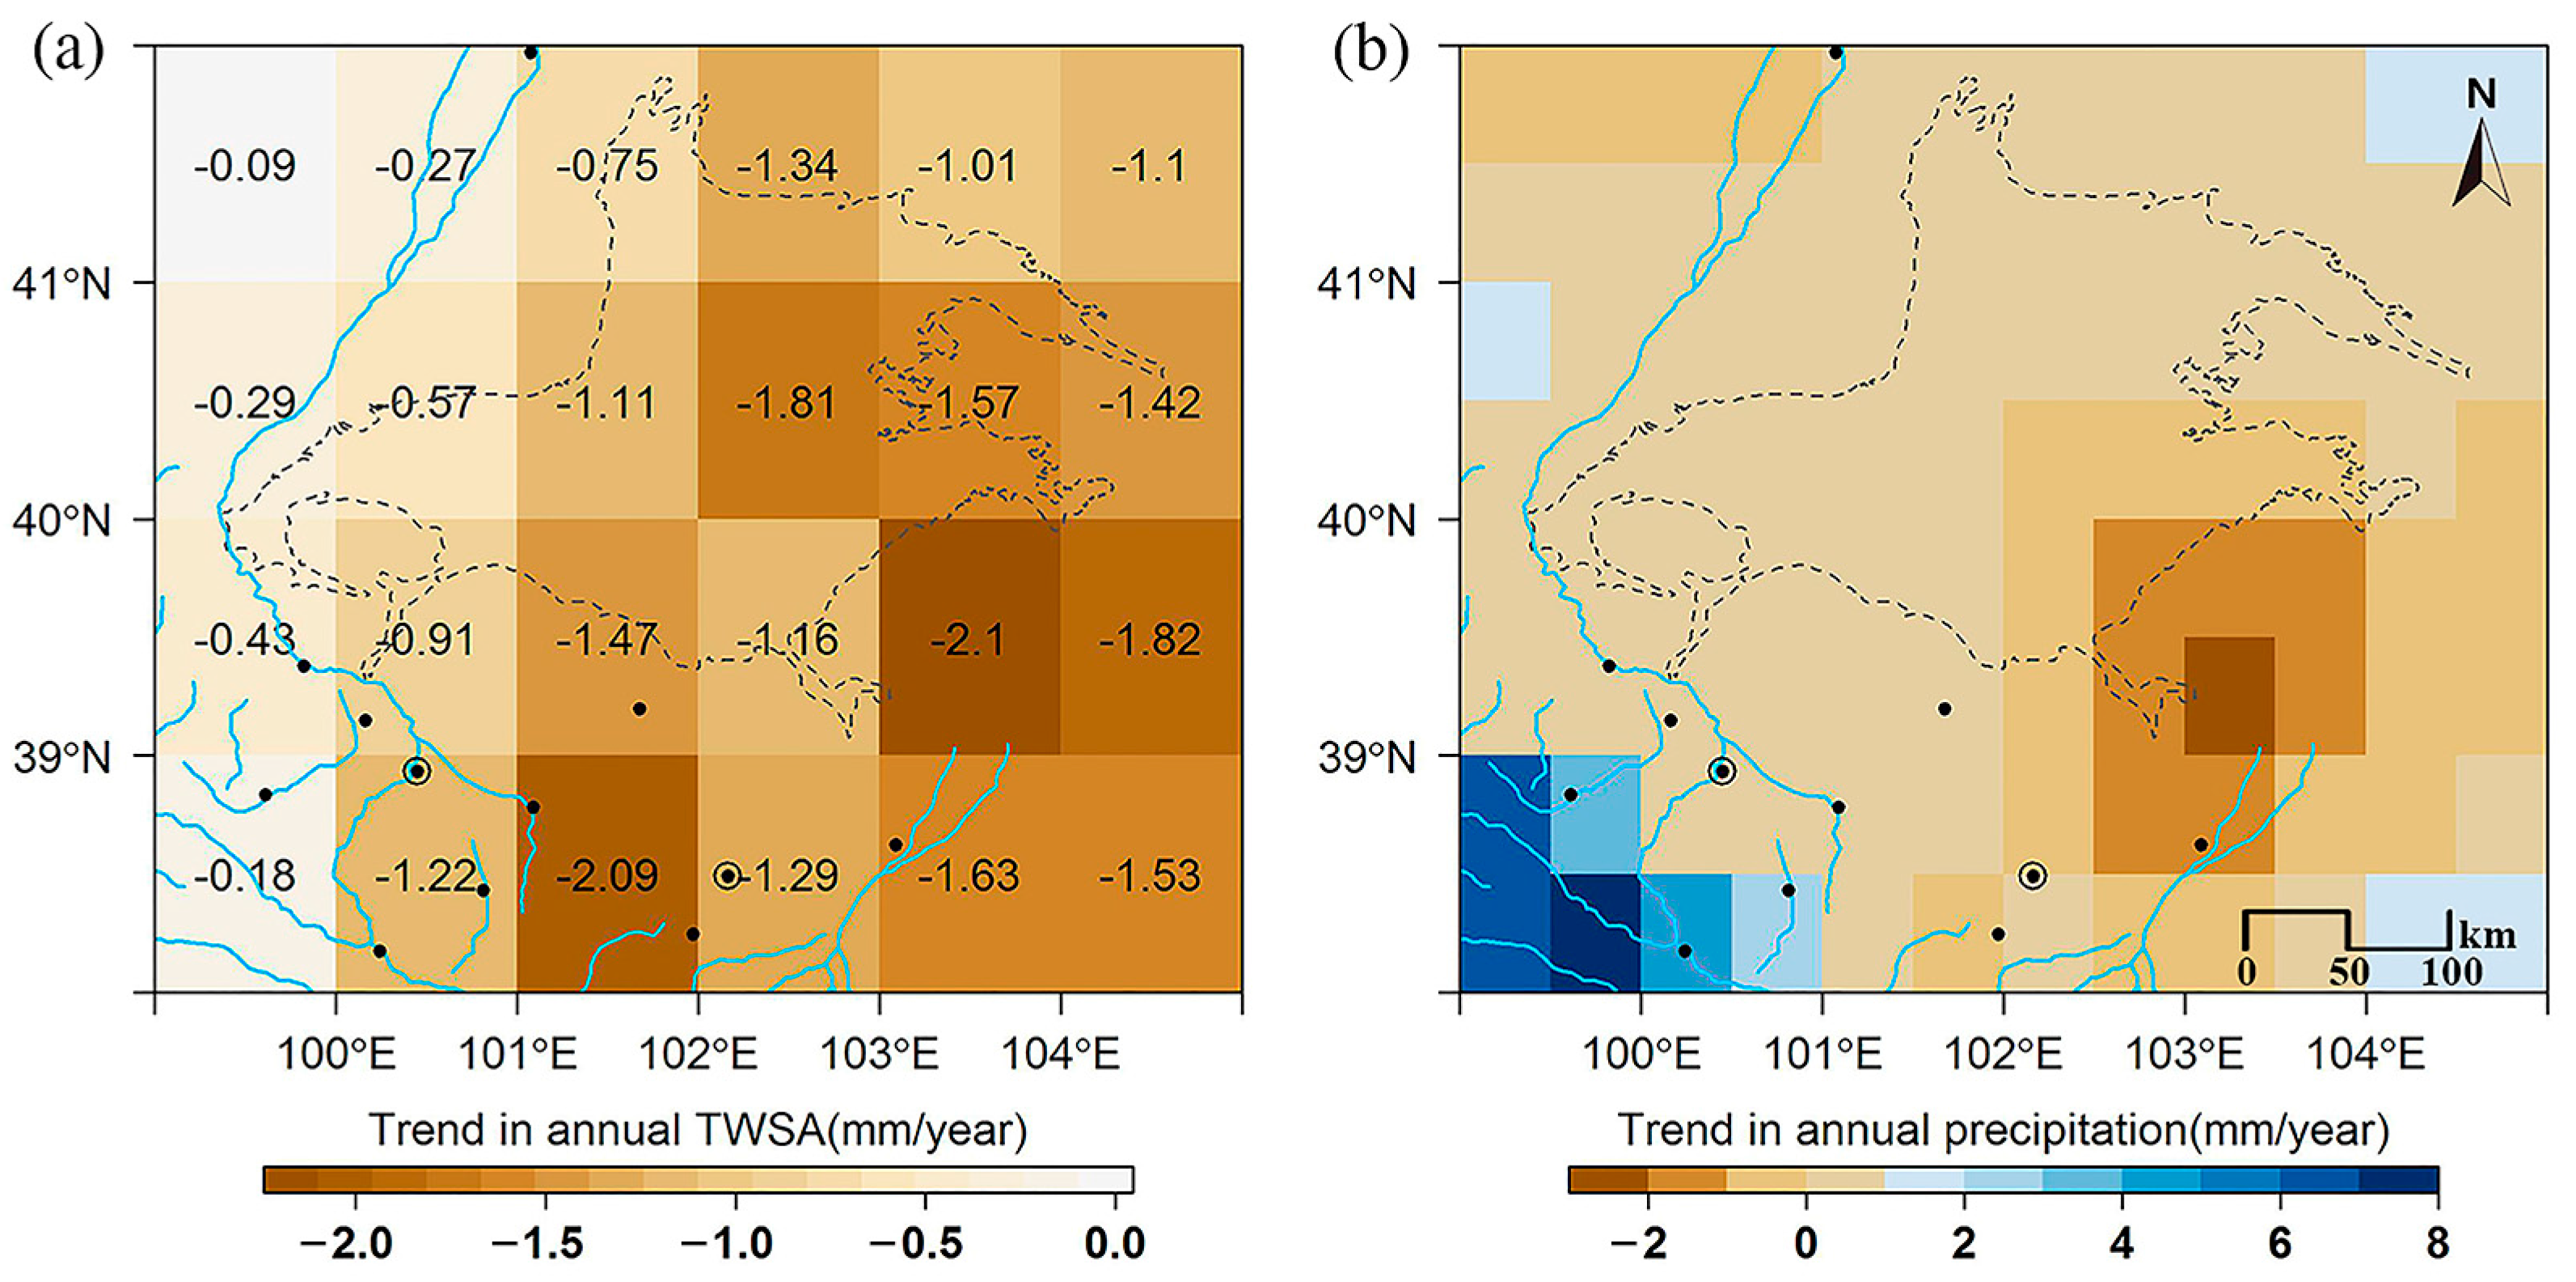
3.1. Spatial-Temporal TWS Change Patterns over the BJD Region

Monthly time series of spatially averaged TWSA and precipitation over the BJD show that TWS and precipitation fluctuated at both seasonal and inter-annual scales (Figure 3). The highest TWSA was found in summer (June to August, when most of the annual precipitation occurred (Figure 3)). Meanwhile, the lowest TWSA was found in winter (December to January), when the precipitation amount was very low (Figure 3). Seasonal variations in precipitation and TWS correlated with each other very well, with a high correlation coefficient of 0.939 (p-value < 0.005) and one- month lag (precipitation antecedent) (Figure 3). For inter-annual variations, while TWSA exhibited a persistent and significant decline across the years (1.13 mm/per year), there was no significant trend found in precipitation during the same period (Figure 3).
The spatial trends in TWS (Figure 4a) showed that TWS decreased greatly in the southern and eastern parts of the BJD study area (close to the Minqin County and the Zhangye City). Over the BJD desert region, TWS decreased at a rate ranging from 1.11 mm per year to 1.81 mm per year (Figure 4a). In the western part of the BJD, the region next to the Hei River, TWS decreased slightly with an increase in precipitation in the upstream area of the Hei River during 2003 to 2014 (Figure 4).

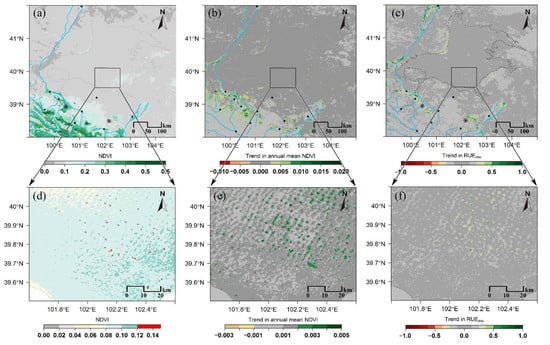
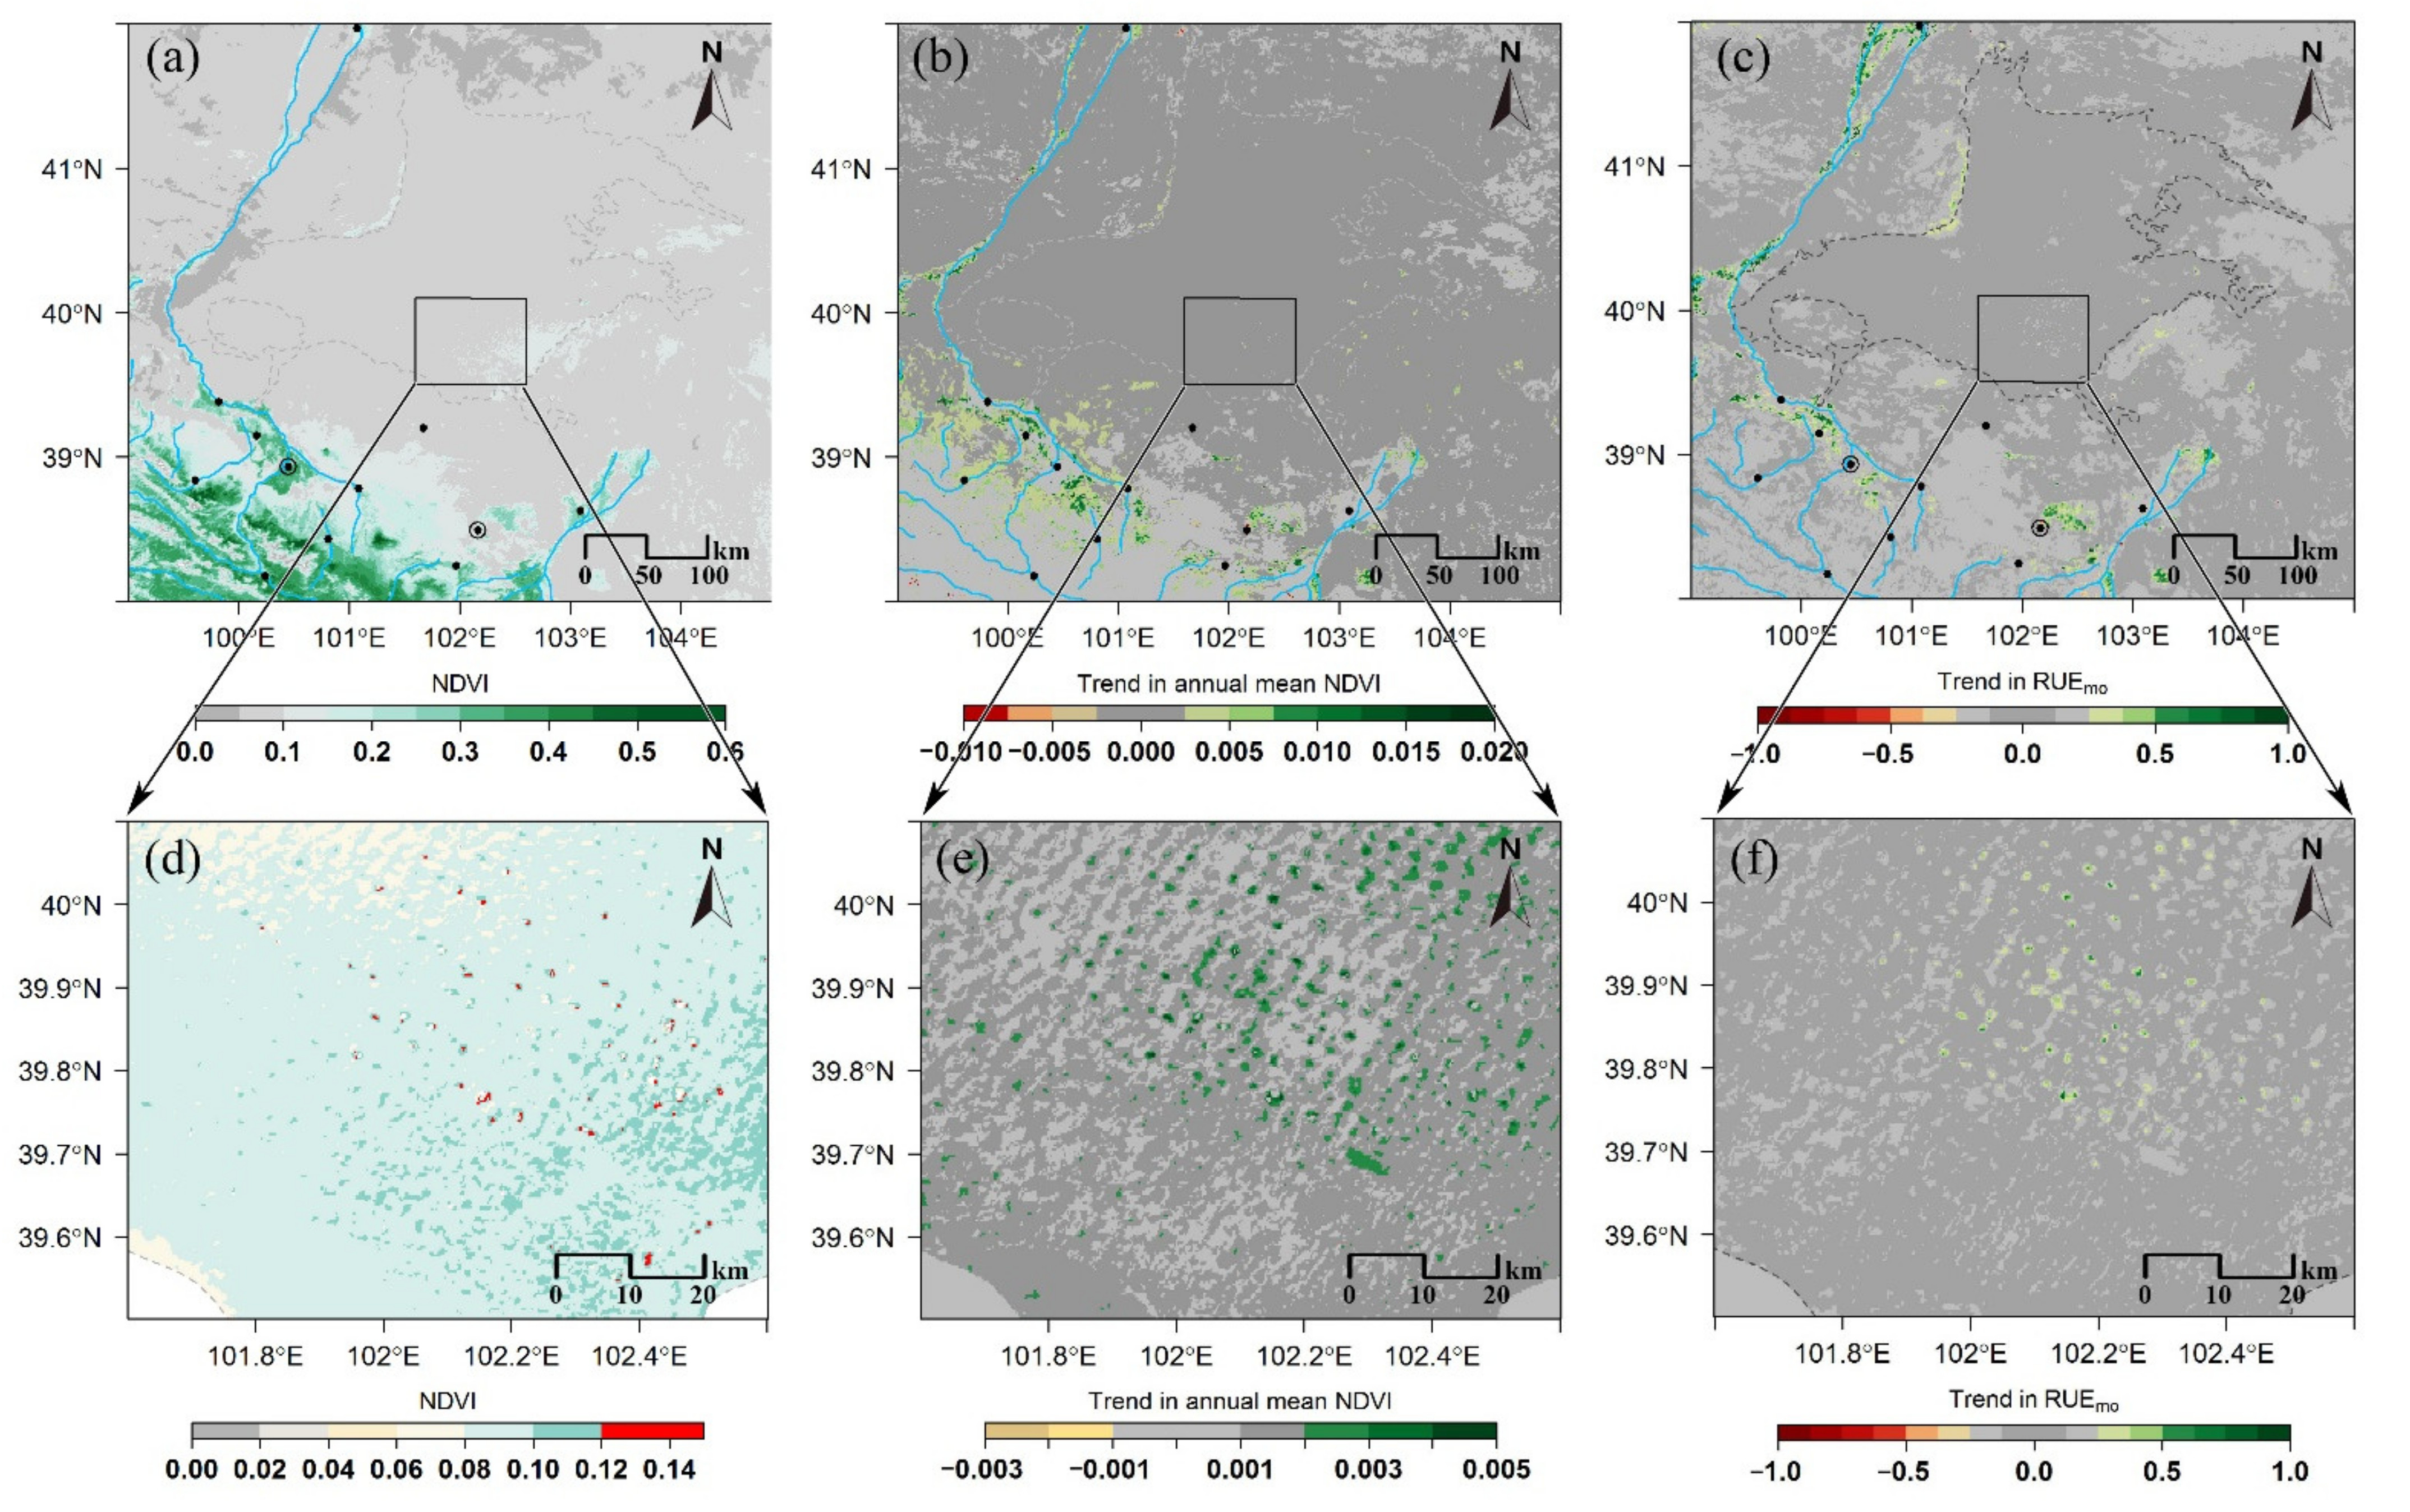
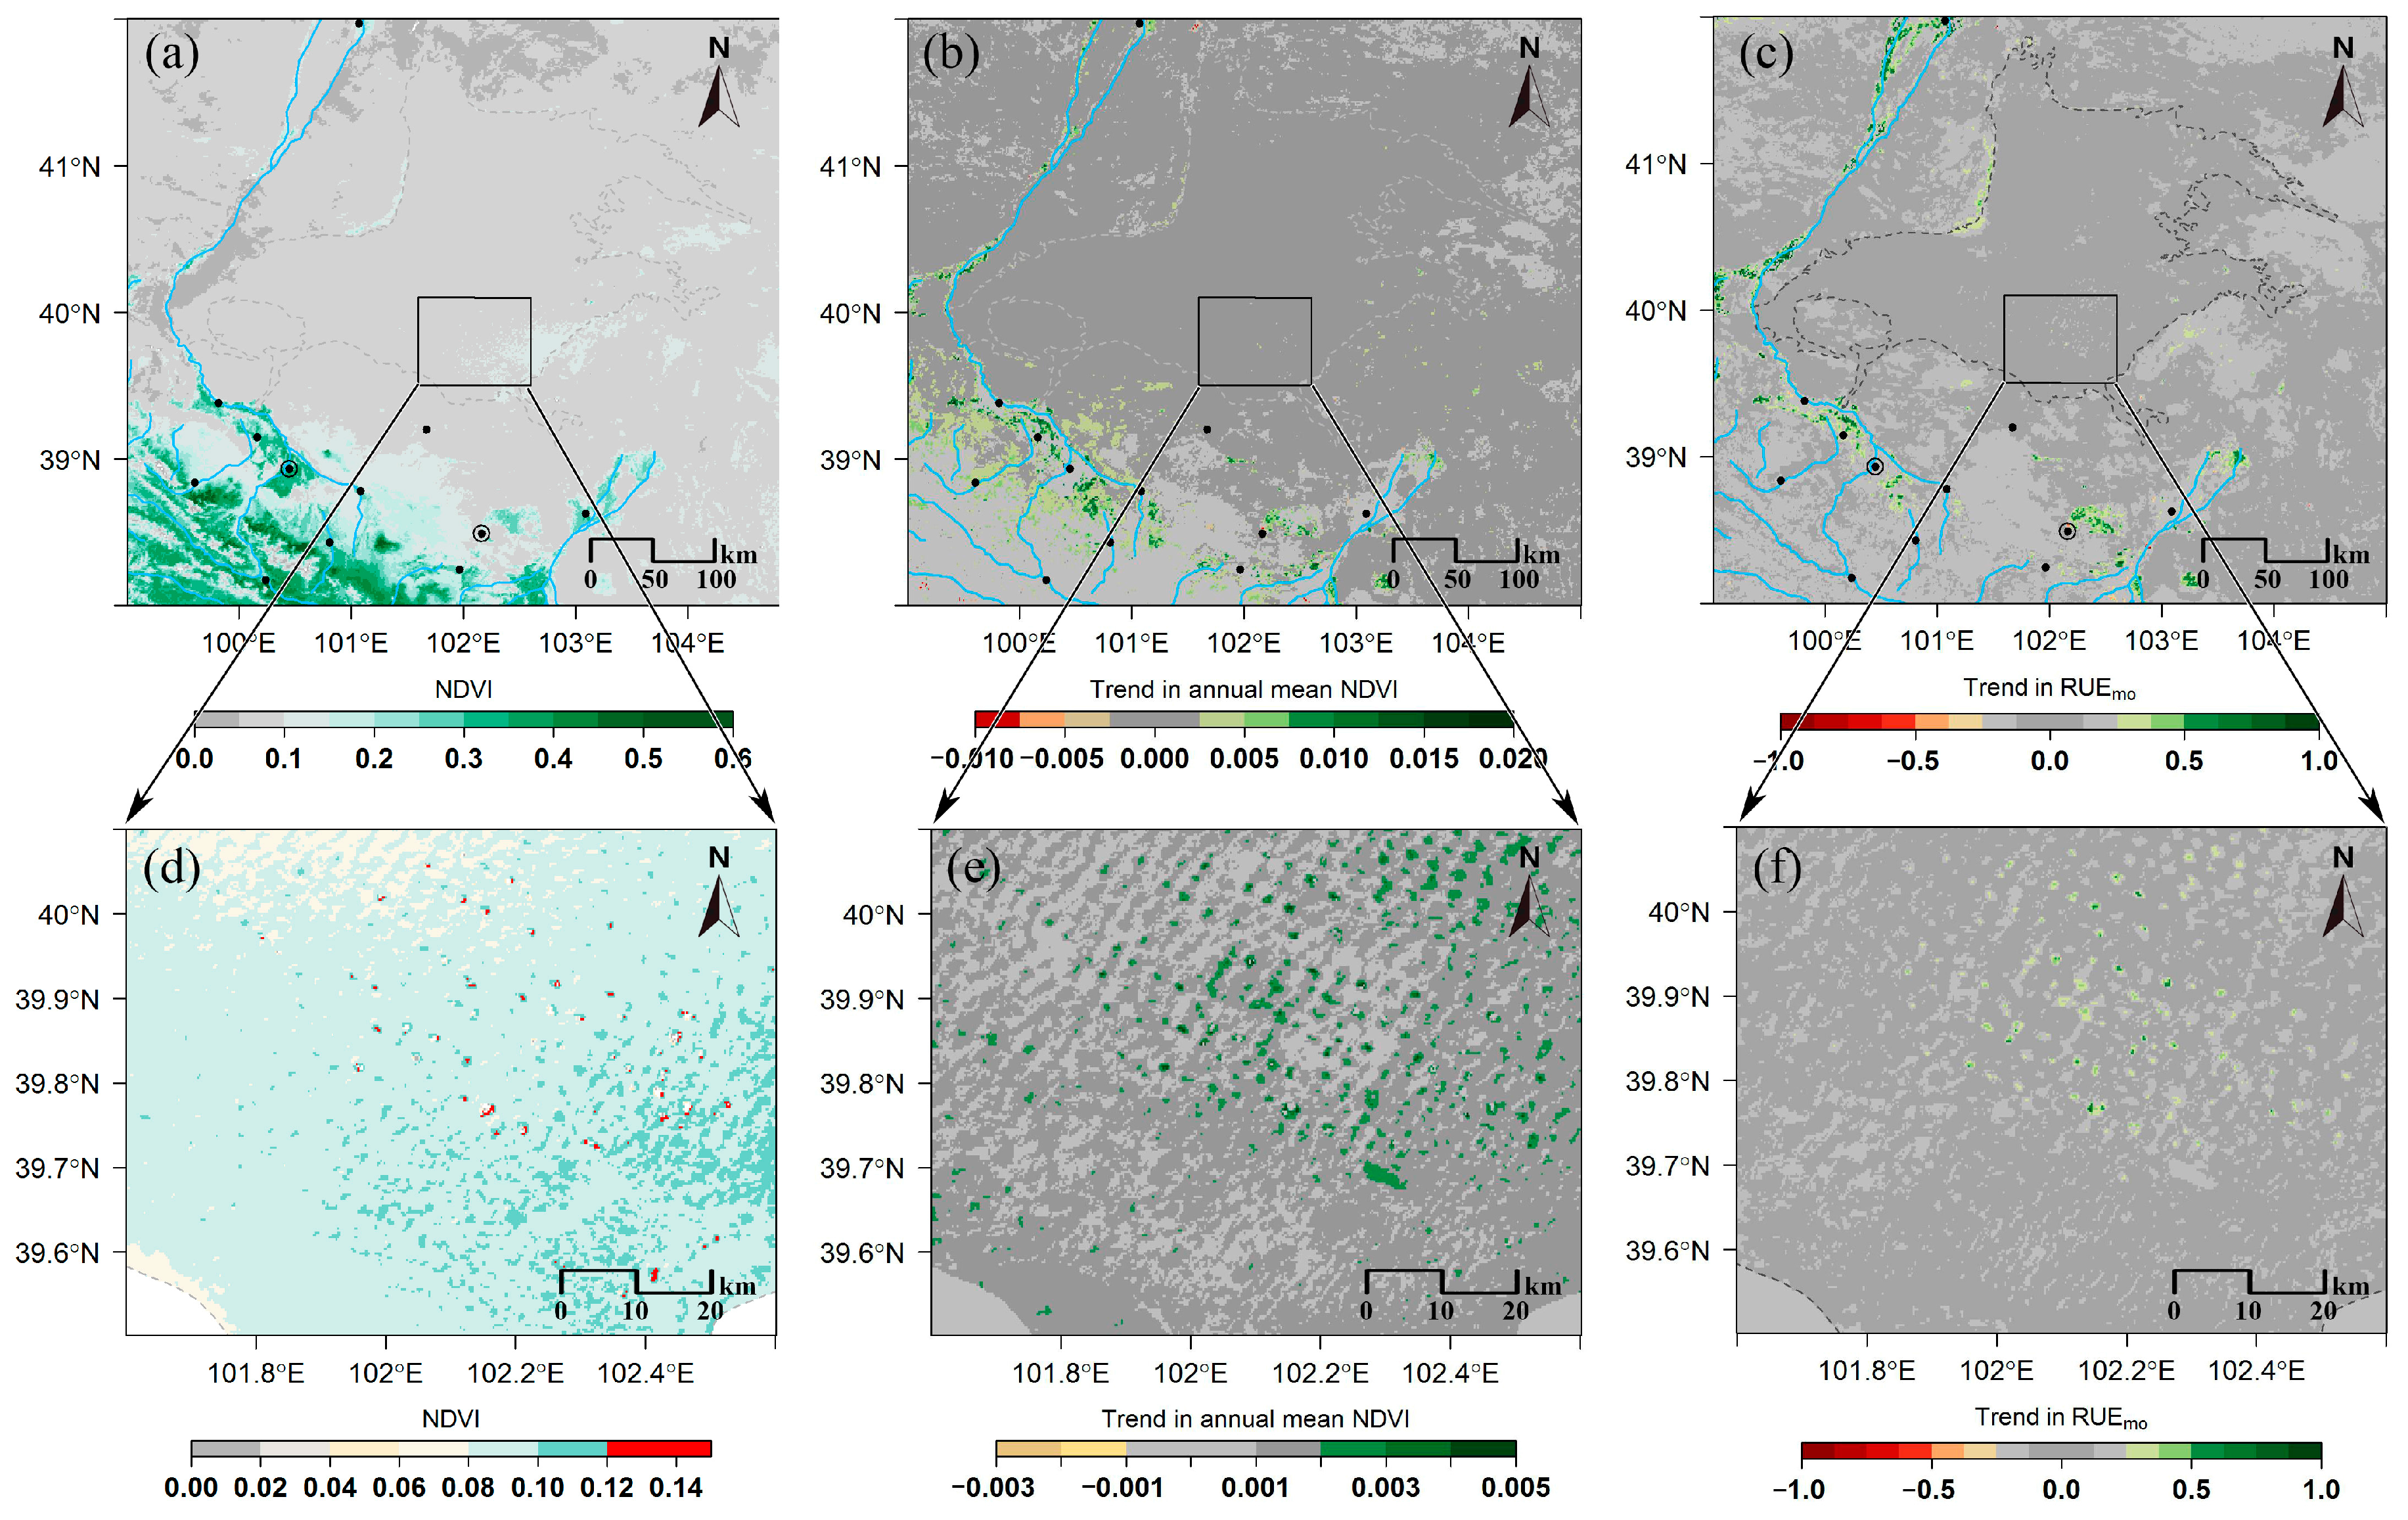
3.2. Trends in Planted Vegetation over the Study Area

To investigate the vegetation distributions and human activity intensity over the study area, maps of mean NDVI (Figure 5a,d), NDVI trend (Figure 5b,e), and the RUEmo (Figure 5c,f) from 2001 to 2014 were generated. The maps showed that vegetation was mainly distributed in the Hexi Corridor and the Qilian Mountains in the study area with over 3/4 of the study area covered by barren land (Figure 5a). After excluding the effect of precipitation variations in different regions by using RUEmo, the map showed that extra planted vegetation was found to be mainly distributed in the downstream areas of the rivers (Figure 5a–c). In addition, over the Lake Group area (the only surface water) in the hinterland of the BJD, considerable greenness was found around the lakes in the hyper-arid region (Figure 5d). This indicated that apart from the naturally growing vegetation, a significant amount of vegetation was also planted over the Lake Group areas (Figure 5e,f).
A land cover map in 2000 generated from the WESTDC Land Cover Products showed the patterns of the land cover in the study region (Figure 6). Vegetation type changes from savanna to forest along the altitude from the Hexi Corridor to the Qilian Mountain (Figure 6). Cities and croplands, which are human-influenced areas, were mainly distributed in the alluvial-diluvial fans between the BJD and the Qilian Mountains (Figure 6). From 2001 to 2014, the area of barren land (NDVI within 0 to 0.1) was reduced from 19.05 × 10⁴ km2 in 2001 to 16.73 × 10⁴ km2 in 2014 over the study region, which was mainly transformed to greener lands (NDVI within 0.1 to 0.3) (Figure 7). Spatially, the changes happened mostly in the oases edges or the oasis-desert ecotone close to the croplands and cities, where the NDVI and RUEmo time series increased significantly during the same period (Figure 5 and Figure 6).

3.3. The Changes in Lake Area Associated with the Decline in TWS

We selected the TWSA pixels that cover the entire Lake Group area and averaged the monthly data into four seasons (Figure 8). We found that the total lake area varied between 17.96 km2 to 20.97 km2 during 2001 to 2014. The Mann-Kendall test was used to detect the seasonal variations in the lake area, of which the results showed that the lake area had an overall decreasing trend but that it was not statistically significant (p-value = 0.28). Thus, despite the decreasing trend in the TWS, we found that the lake area over the BJD seemed to be stable over the years. This result was also corroborated by a recent study monitoring global surface water changes based on Landsat images acquired during a recent 30-year period, which observed no significant decrease in the Lake Group area in the BJD [72,73].

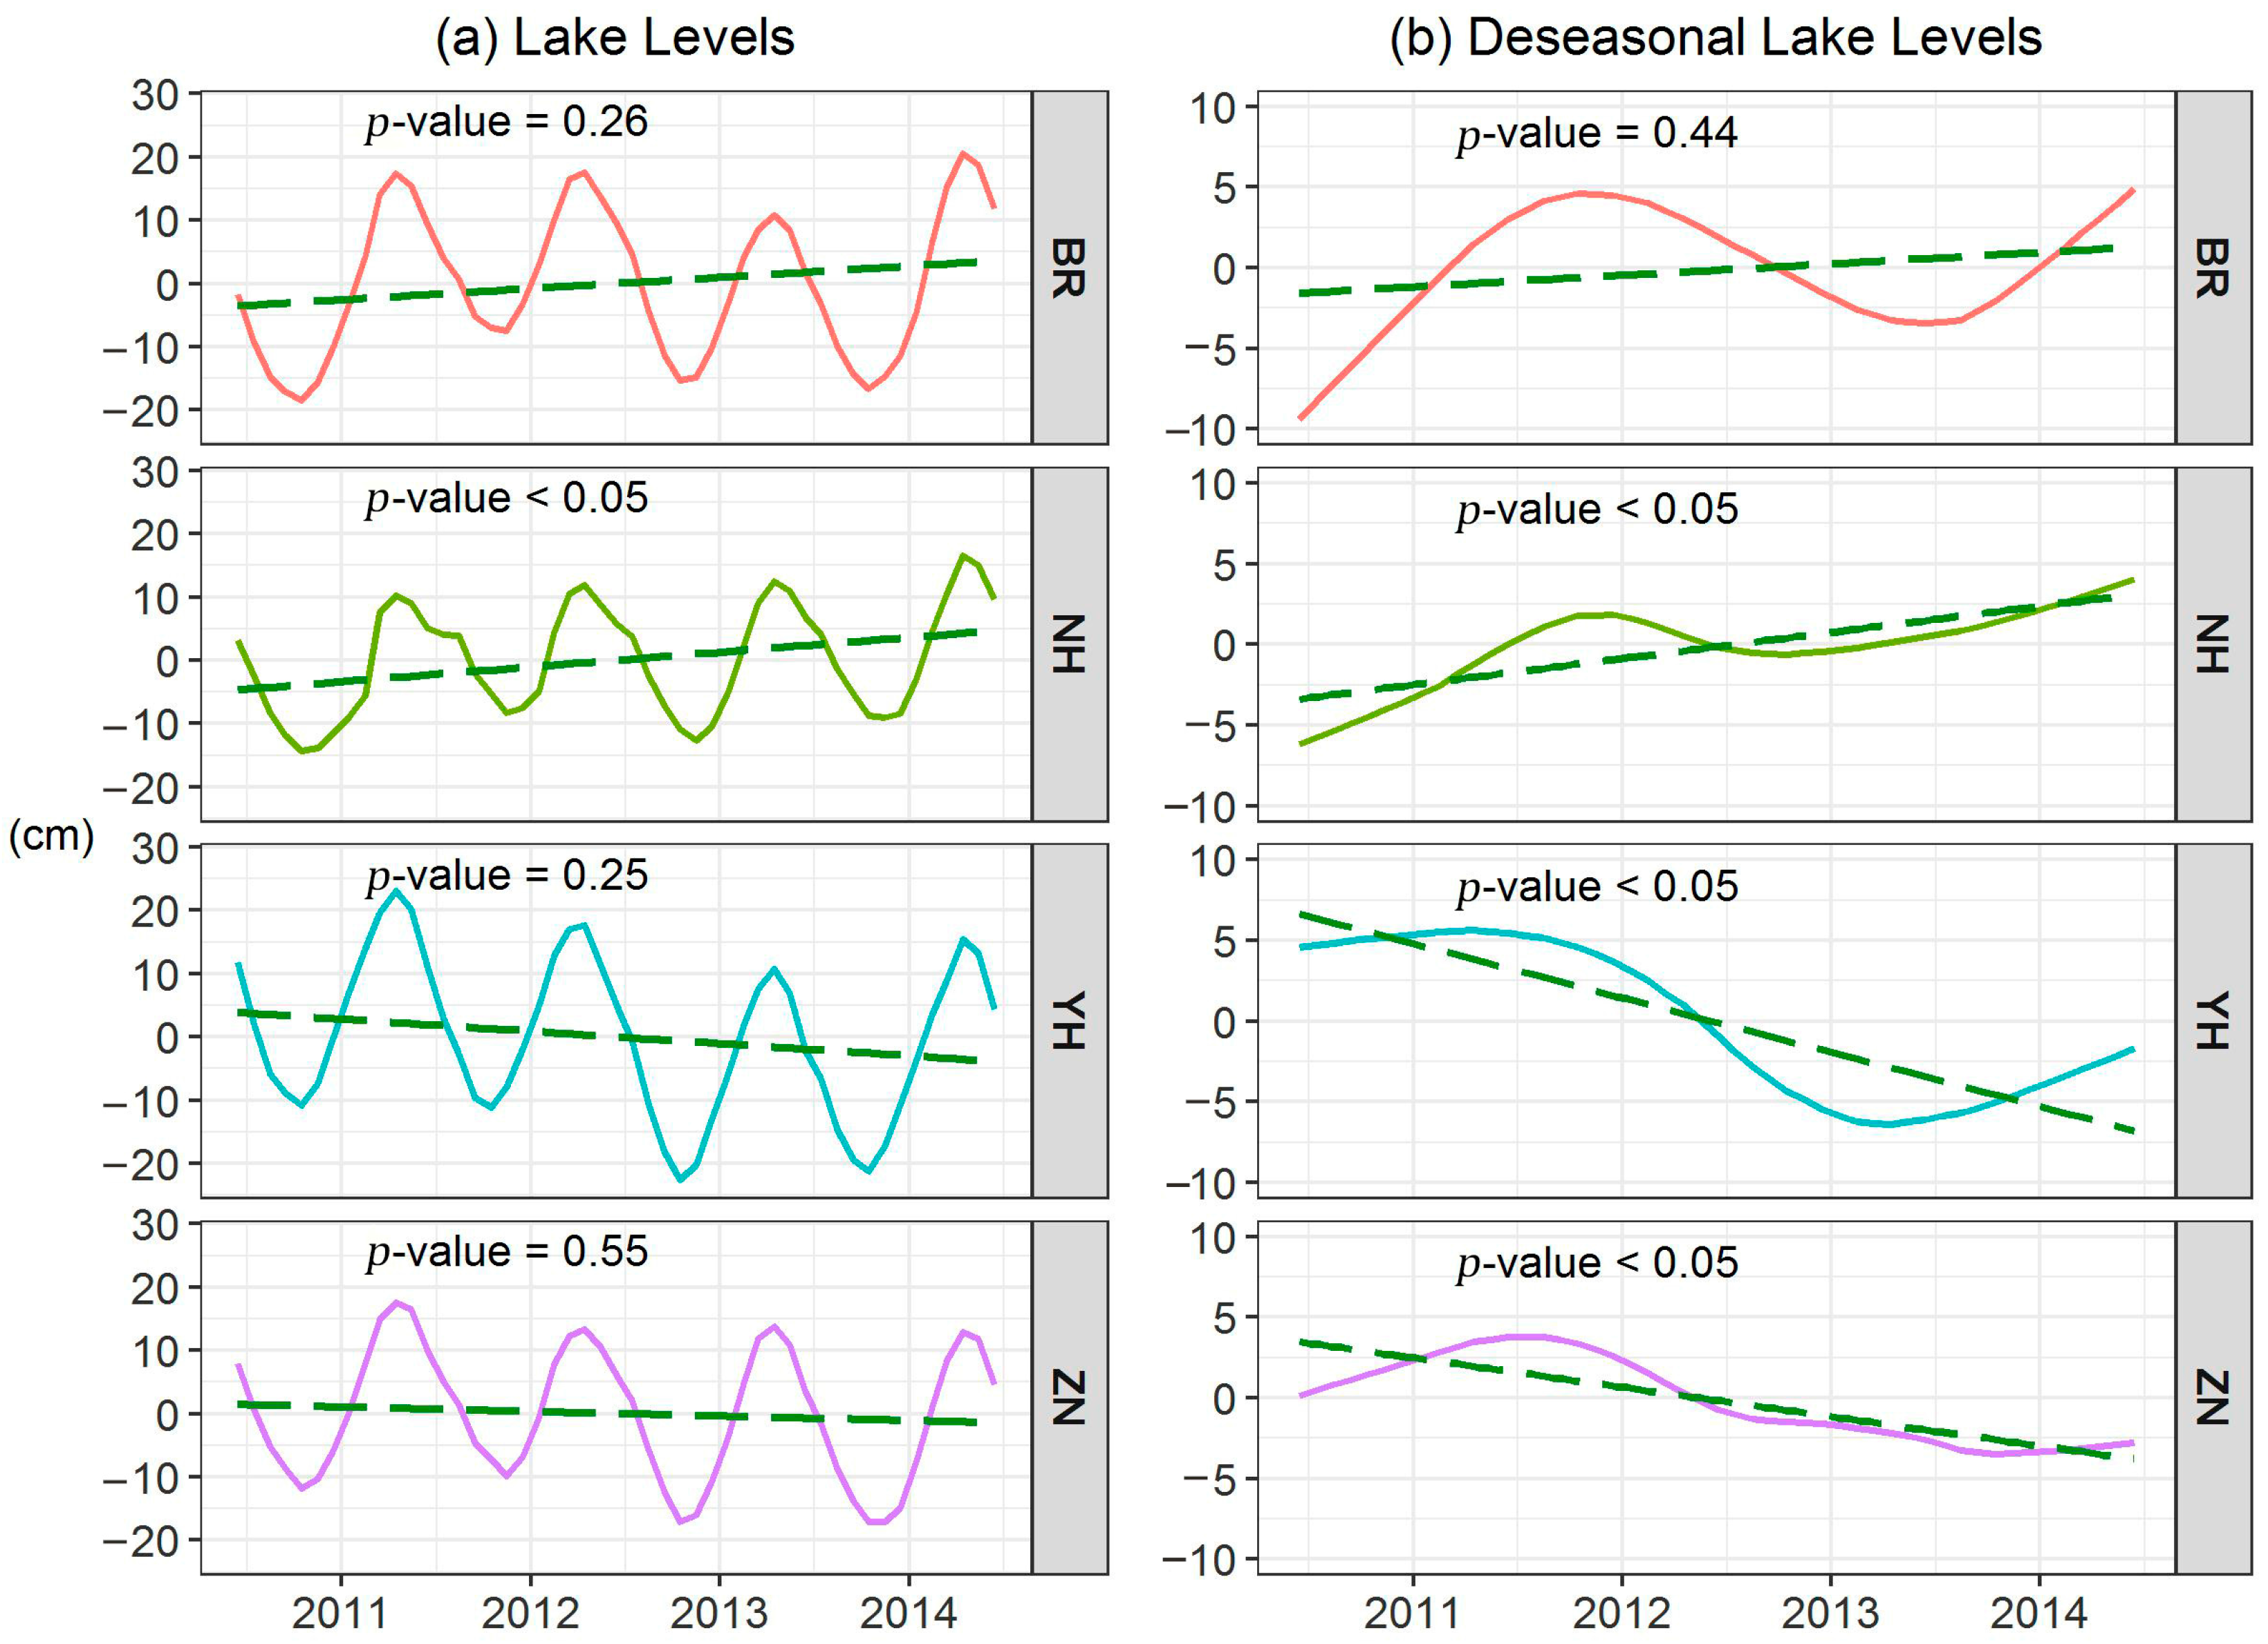
3.4. Water Level and Vegetation Changes of Four Local Lakes in the BJD Hinterland

A case study of four lakes with in-situ observations in the hinterland of the BJD was carried out to show the relationship between the planted vegetation surrounding the lakes and the changes in the lake levels. In total, the four lakes cover a small area of 900 km2. As the precipitation here was resampled from the 0.5 degree resolution product, the precipitation was the same over the four lakes. Although the MODIS NDVI mixed pixels detected signals from both the vegetation and sand, the NDVI values can still indicate the greenness changes in density and area. Figure 9 shows that the annual mean NDVI values of lake surroundings were between 0.08 to 0.16, and precipitation varied between 75 mm to 88 mm during the study period. Compared to other regions of the desert, the greenness is much more noticeable in the lake surroundings. The majority of plants are grasses and shrubs, but there are also trees. By using the STL method and Mann-Kendall trend test, we found that vegetation around Lake ZN and Lake YH had a pronounced increasing trend during the study period. We used the method described in Section 2.8 to identify the variations only in the human planted vegetation, with effects from the precipitation variations and natural conditions of the vegetation growth being eliminated. RUEmo is the ratio between the annual mean NDVI that was subtracted by the intercept of the linear regression of the former years (2001 to 2007) and the annual accumulated precipitation, and a scale of 10,000 was used to enlarge the RUEmo value. RUEmo should stay stable if there are no additional changes in human influence compared to the former condition. From the results, by using the Mann-Kendall trend test, the RUEmo of Lake YH and Lake ZN increased significantly (Figure 9b,d), while the RUEmo of Lake BR and Lake NH exhibited no significant changes during 2001 to 2014. The results indicated that human influence on the vegetation of Lake YH and Lake ZN obviously increased.
As the lakes in the hinterland of the BJD are saline lakes and the hyper-saline water is not suitable for maintaining the vegetation, the only water for irrigating the planted vegetation was pumped from deep wells beside the lakes. Based on the observed water level changes of the four lakes, we found that the time series of water levels from June 2011 to June 2015 showed two patterns (water levels of Lake YH and Lake ZN decreased significantly while Lake BR and Lake NH did not) at an annual scale that corresponded with those in the planted vegetation (Figure 9 and Figure 10). The seasonal variations of all the four lakes are quite similar, with the highest levels occurring in April and lowest levels normally in October (Figure 10a). However, for the inter-annual variability, Lake ZN and Lake YH decreased, while Lake BR and Lake NH slightly increased over time (Figure 10a). De-seasonal trends and the linear regression results show that lake NH had a significant increasing trend (1.51 cm per year), while lake YH (−3.05 cm per year) and lake ZN (−1.67 cm per year) had significant decreasing trends (p < 0.01) during the observation period (Figure 9b).

4. Discussion

4.1. TWS Decline Despite the Stable Precipitation

Our results from GRACE observations gave us an overview of terrestrial total water storage in seasonal and long-term variations from 2003 to 2014 over our study region. As an integrative measure of vertical changes in total water storage, the results of GRACE trend analyses have been validated by multi-source data such as finer satellite observations, modelling data, and lots of in-situ data [74,75,76,77,78,79,80,81,82,83,84,85,86,87]. The BJD region is characterized as having a typical arid or hyper arid climate, with the annual potential evaporation exceeding over four times that of the amount of annual precipitation [88]. The surface soil moisture content was too low for precipitation to infiltrate well into the deeper soil, and at same time, dry sand layers also prevent deep soil moisture or groundwater from evaporating [89], and thus, the seasonal variations of TWSA were related to shallow soil moisture dynamics sourced from the precipitation and the subsequent rapid evaporation in this arid area. However, in the long run, there should be a muted TWS change due to the stable annual precipitation and subsequent limited evaporation. When also considering the scarcity of surface water and soil moisture in this region, the decrease in TWS found in our results should be attributed to the decrease in deep groundwater over the BJD and surrounding regions.
According to previous studies, the groundwater in most parts of the Hexi Corridor has been over-exploited to support the rapid growth of population, urbanization, and cultivated land since the 1980s [20]. Based on the field observations of nearly 30 years, groundwater levels have been decreasing with a range of 0.1 to 1.0 m per year at specific sites in the Hexi Corridor since 1975 [90]. Our results of the GRACE observations showed that the average TWSA over the study region decreased by 1.13 mm per year, which was equivalent to 1130 tons of water lost per square kilometer each year from 2003 to 2014. Continuation of this groundwater loss rate may eventually cause irreversible ecological problems in this region and associated human communities.

4.2. Eco-Hydrological Changes of the BJD and Adjacent Region

Human activities have been exerting a noticeable influence on the groundwater in history, mainly through agricultural irrigation and human use [91,92,93]. In the last few decades, additional activities such as afforestation projects were widely implemented to improve the vegetation cover in drylands around the world. In particular, groundwater has been increasingly exploited to increase the vegetation and sustain it in the arid and semi-arid lands of China [15]. In this study, in order to focus on the impact solely from human activities on vegetation and water resources over the BJD region, we had to firstly remove the effect from the natural precipitation variability.
In general, annual precipitation and the proxy for vegetation productivity (NDVI in this study) have a linear relationship in arid regions without considering the anthropogenic influence. Thus, the negative trends in the RUE were widely used to detect land degradation around the world [26,30,31,32,36,63,94]. Human influence was considered in order to identify land degradation, using the residual trend method by calculating the difference between observed NDVI and NDVI as predicted from precipitation [26,33,94,95]. Unlike the general degradation phenomenon, we detected an increase in land vegetation cover which was a reverse process of the land degradation. Although the degree of human influence was hard to detect if the human influence stayed stable, we could detect the variations of human influence by comparing the difference between the RUEmo in early years to recent years. Therefore, RUEmo was developed in this study to monitor the unnatural vegetation changes with the intensification of human activities.
In our study area, the vegetation cover increases were mainly found in the regions that are close to croplands and cities (Figure 5 and Figure 6), which used to be oasis–desert ecotones. Within these oasis–desert ecotones, groundwater or river water was relatively sufficient and easily exploited for converting the barren lands into cultivated lands by agriculture and afforestation projects. The alternation of lands was of benefit to the locals in some aspects, such as increasing crop yields and protection from sandstorms [11]. Over such an arid region, precipitation would have a very limited influence on vegetation changes, and as a result, the consistent increasing vegetation cover in the region should be ascribed to the increasing intensity of human activities, such as the exploitation of limited water resources to irrigate vegetation. However, ecosystems of the oasis–desert ecotones will become more fragile to the future degraded environment when the water resources have become over exploited and human intervention is gone. The expanded cultivated lands not only consumed groundwater, but also slowed runoff recharge to the rivers and reduced the downstream water supply. Additionally, irrigation increases the soil moisture of the croplands, as well as total evapotranspiration, and further speeds up the water losses over the study region. Although human activities such as afforestation projects aimed at improving the environment by increasing the vegetation in arid areas, the over use of groundwater, on the other hand, would speed up the progress of desertification. China has implemented afforestation programs to prevent the desertification, but as the policy may not sufficiently consider the local environmental conditions, these programs may lead to some unforeseen side-effects [15].

4.3. The Impact of the Increasing Tourism on Desert Lakes

It is widely accepted that the groundwater has been recharging the hundreds of permanent lakes in the BJD under the hyper-arid environment, which are increasing the attraction for tourists [45,96,97,98,99]. Although the total area of the lake region is small (approximately 20 km2) compared with the whole study region, the groundwater resources underneath the desert are considered to be rich [100]. However, the upstream water consumption from the Hexi Corridor could reduce groundwater in the Badain Jaran Desert. Thus, although the resolution of GRACE is coarse, it is needed for groundwater monitoring, which in turn improves our understanding of the changes in these groundwater-fed lakes. We found that Landsat-derived lake areas could not sufficiently explain the decline in TWS. This may be due to the fact that (1) the changes in the lake areas were smaller than the sensors could capture (30 × 30 m) or (2) the steep slope of the lake shores may prevent the decrease in the lake areas from being shown. Whatever the reason, the continuous TWS decline over a decade is an early warning of large scale hydrological degradation over the BJD region, which may eventually affect the lakes.
This study also highlights the in-situ observations, such as water level measurements, to supplement the limits of the low spatial resolution satellite data [101]. We monitored the changes in lake levels to investigate the human influence on ecohydrological dynamics of the small areas in the BJD region. According to the field observations, water levels of all lakes had similar seasonal variations, presenting a higher lake level in spring and a lower one in autumn. This is different from the GRACE-TWSA seasonal patterns over our study area, which shows a higher TWSA in summer and lower TWSA in winter. This was ascribed to the variations of seasonal lake levels being influenced by both the groundwater recharge rate and continuous lake evaporation in the hinterland of the BJD, while seasonal TWSA variations mainly related to the precipitation and limited soil evaporation. This is because intra annual changes in the water levels of the lakes may lag behind those of TWSA over a large spatial-scale. According to a tritium dating study on groundwater, the age of groundwater at Lake Nuoertu (102.46°E, 39.76°N) in the BJD is about 75–80 years [45], which means that lake level variations may have a lag and do not reflect the direct TWS variations of the wider region over a short period. Moreover, as pumping water in the desert was limited, the water loss over the lake group area cannot account for the decline of TWS over the whole study region. As a result, the main water loss presented by the TWS decline should be due to the excessive use of groundwater in the BJD adjacent region.
On a smaller scale, the in-situ lake level analysis corroborated the satellite derived RUEmo results, indicating that planted vegetation irrigated by pumping groundwater had a great impact on the water levels of the closed lakes. Shown by the multi-source observations, two of the four lakes (Lake ZN and Lake YH) were affected by the increasing human activities, which subsequently lowered their water levels. The increasing human activities over these two lakes areas were further checked by our field investigation. In contrast, the changes in vegetation over Lake NH and Lake BR, where there are no changes in the intensity of human-related activities, were insignificant and the water levels even exhibited a slight increase during the observation period. The difference in human induced impact between the two groups of lakes was mainly due to the tourism development in the past few years. Especially in recent years, the tourism industry has greatly developed over the BJD lake group area, and the number of tourists increased from just over 5500 in 1999 to 584,300 in 2015 [102]. Note that not all the lakes are in the tourist places, providing us with the opportunity to compare the ecohydrological conditions under and not under human management. In some accessible lake areas, tourism development prompted local residents to plant more trees and grasses for environmental improvement, thus making it more attractive for tourists. Although the tourism development improved the local economics, changes of the ecohydrological systems caused by human activities over the desert lake basins may lead to many problems.
Studies conducted in other arid regions found that when natural grasslands were replaced by planted trees or shrubs, the more deeply rooted woody vegetation transpired a large amount of deep groundwater, lowered the water table, and made it harder for native plants to survive [103]. The decreased water levels also lowered the soil moisture, and led to soil salinization and land desertification [104]. Afforestation programs have been implemented over many drylands around the world [15,105,106,107]. With the speed-up of the population growth and climate change in drylands, the influence of human beings on the environment through afforestation and irrigation will be exacerbated. Although increasing vegetation, such as crops and trees, seems to improve the environment and economics in the short-term, the increasing water demand on the other hand for more vegetation growth needs to be consistently monitored and evaluated.

5. Conclusions

In this study, we investigated the ecohydrological changes over the Badain Jaran Desert under human influence by integrating the remote sensing technique with in-situ measurements. We proposed a method for distinguishing the planted vegetation from natural plants in order to study the human influences without effects from the precipitation variability. The extra consumption of water by human-planted vegetation over the BJD and adjacent region could explain the declining TWS along with vegetation cover increases. Changes in annual lake levels and vegetation over four lake basins in the hinterland of the BJD during a four-year period provided evidence that human activities have altered the water balance through planting vegetation at the lake basin scale.
We also found that seasonal variations in TWS were influenced by variations in precipitation; however, local precipitation was unable to recharge the groundwater and instead would evaporate into the atmosphere within a one-month period in the drylands. The lake area variations derived from the Landsat images could not explain the decline of TWS over the BJD, and long-term in situ observed data along with GRACE monitoring were thus crucial for water cycle research in the drylands.
Our results provided an improved understanding of human influence on vegetation and hydrological dynamics in the arid environment. The methods developed herein demonstrated the potential of the remote sensing technique with multi-sensor systems of various spatial resolutions and physical properties in studying the ecohydrological variations over remote arid regions across the globe. Therefore, our research will provide valuable guidance for assessing and monitoring the environmental effects of human activities over broad dryland areas. In addition, the GRACE follow-on mission GRACE-FO with the development of other future earth observation satellites will enhance the ability of similar research to be applied for protecting dryland ecohydrology. Future studies on regional ecohydrological dynamics and lake evaporation are needed to further partition the water cycle into different components and study their links and interactions in this study region.

Acknowledgments

This research was supported by the Key Project of National Natural Science Foundation of China (No. 41530745) and the National Natural Science Foundation of China (No. 41371114). We are grateful to three anonymous reviewers for their valuable comments and constructive suggestions. The first author also appreciates the financial support from the Chinese Scholarship Council, Ministry of Education, China as well as Ruolan Li and Geoffrey Pearce for their help on the writing of this paper. Alfredo Huete and Xuanlong Ma were supported by an Australian Research Council Discovery Project (ARC-DP140102698, CI Huete). Xuanlong Ma was also supported by an Early Career Research Grant (ECRG) from the University of Technology Sydney (PRO16-1358, CI Ma).

Author Contributions

All authors worked together to design this work. Nai’ang Wang and Xunhe Zhang collected the data. Xunhe Zhang did the analysis and wrote this paper. Zunyi Xie, Xuanlong Ma and Alfredo Huete revised this paper.

Conflicts of Interest

The authors declare no conflict of interest.

References

  1. Reynolds, J.F.; Smith, D.M.; Lambin, E.F.; Turner, B.L., 2nd; Mortimore, M.; Batterbury, S.P.; Downing, T.E.; Dowlatabadi, H.; Fernandez, R.J.; Herrick, J.E.; et al. Global desertification: Building a science for dryland development. Science 2007, 316, 847–851. [Google Scholar] [CrossRef] [PubMed]
  2. Goyal, R.K. Sensitivity of evapotranspiration to global warming: A case study of arid zone of rajasthan (India). Agric. Water Manag. 2004, 69, 1–11. [Google Scholar] [CrossRef]
  3. Vitousek, P.M. Human domination of earth’s ecosystems. Science 1997, 277, 494–499. [Google Scholar] [CrossRef]
  4. Ji, F.; Wu, Z.; Huang, J.; Chassignet, E.P. Evolution of land surface air temperature trend. Nat. Clim. Chang. 2014, 4, 462–466. [Google Scholar] [CrossRef]
  5. Shi, Y.; Shen, Y.; Kang, E.; Li, D.; Ding, Y.; Zhang, G.; Hu, R. Recent and future climate change in northwest China. Clim. Chang. 2007, 80, 379–393. [Google Scholar] [CrossRef]
  6. Chen, Y.; Deng, H.; Li, B.; Li, Z.; Xu, C. Abrupt change of temperature and precipitation extremes in the arid region of northwest China. Quat. Int. 2014, 336, 35–43. [Google Scholar] [CrossRef]
  7. Piao, S.; Ciais, P.; Huang, Y.; Shen, Z.; Peng, S.; Li, J.; Zhou, L.; Liu, H.; Ma, Y.; Ding, Y.; et al. The impacts of climate change on water resources and agriculture in China. Nature 2010, 467, 43–51. [Google Scholar] [CrossRef] [PubMed]
  8. Chen, Y.; Li, Z.; Fan, Y.; Wang, H.; Deng, H. Progress and prospects of climate change impacts on hydrology in the arid region of northwest China. Environ. Res. 2015, 139, 11–19. [Google Scholar] [CrossRef] [PubMed]
  9. Huo, Z.; Dai, X.; Feng, S.; Kang, S.; Huang, G. Effect of climate change on reference evapotranspiration and aridity index in arid region of China. J. Hydrol. 2013, 492, 24–34. [Google Scholar] [CrossRef]
  10. Zhang, H.; Wu, J.W.; Zheng, Q.-H.; Yu, Y.-J. A preliminary study of oasis evolution in the tarim basin, Xinjiang, China. J. Arid Environ. 2003, 55, 545–553. [Google Scholar]
  11. Su, Y.Z.; Zhao, W.Z.; Su, P.X.; Zhang, Z.H.; Wang, T.; Ram, R. Ecological effects of desertification control and desertified land reclamation in an oasis–desert ecotone in an arid region: A case study in Hexi corridor, northwest China. Ecol. Eng. 2007, 29, 117–124. [Google Scholar] [CrossRef]
  12. Wang, G.; Cheng, G. The characteristics of water resources and the changes of the hydrological process and environment in the arid zone of northwest China. Environ. Geol. 2000, 39, 783–790. [Google Scholar] [CrossRef]
  13. Wenhua, L. Degradation and restoration of forest ecosystems in China. For. Ecol. Manag. 2004, 201, 33–41. [Google Scholar] [CrossRef]
  14. Wang, G.; Innes, J.L.; Lei, J.; Dai, S.; Wu, S.W. China’s forestry reforms. Science 2007, 318, 1556–1557. [Google Scholar] [CrossRef] [PubMed]
  15. Cao, S.; Chen, L.; Shankman, D.; Wang, C.; Wang, X.; Zhang, H. Excessive reliance on afforestation in China’s arid and semi-arid regions: Lessons in ecological restoration. Earth-Sci. Rev. 2011, 104, 240–245. [Google Scholar] [CrossRef]
  16. Ma, Z.; Kang, S.; Zhang, L.; Tong, L.; Su, X. Analysis of impacts of climate variability and human activity on streamflow for a river basin in arid region of northwest China. J. Hydrol. 2008, 352, 239–249. [Google Scholar] [CrossRef]
  17. Huang, M.; Zhang, L. Hydrological responses to conservation practices in a catchment of the loess plateau, China. Hydrol. Process. 2004, 18, 1885–1898. [Google Scholar] [CrossRef]
  18. Allan, J.D. Landscapes and riverscapes: The influence of land use on stream ecosystems. Annu. Rev. Ecol. Evol. Syst. 2004, 35, 257–284. [Google Scholar] [CrossRef]
  19. Delin, H. The progress of research on oasis in China. Sci. Geogr. Sin. 1999, 19, 313–319. [Google Scholar]
  20. Bao, C.; Fang, C. Water resources constraint force on urbanization in water deficient regions: A case study of the Hexi Corridor, arid area of NW China. Ecol. Econ. 2007, 62, 508–517. [Google Scholar] [CrossRef]
  21. Goward, S.N.; Tucker, C.J.; Dye, D.G. North american vegetation patterns observed with the NOAA-7 advanced very high resolution radiometer. Plant Ecol. 1985, 64, 3–14. [Google Scholar] [CrossRef]
  22. Justice, C.O.; Townshend, J.; Holben, B.; Tucker, E.C. Analysis of the phenology of global vegetation using meteorological satellite data. Int. J. Remote Sens. 1985, 6, 1271–1318. [Google Scholar] [CrossRef]
  23. Townshend, J.R.; Goff, T.E.; Tucker, C.J. Multitemporal dimensionality of images of normalized difference vegetation index at continental scales. IEEE Trans. Geosci. Remote Sens. 1985, GE-23, 888–895. [Google Scholar] [CrossRef]
  24. Tucker, C.J.; Vanpraet, C.L.; Sharman, M.; Van Ittersum, G. Satellite remote sensing of total herbaceous biomass production in the senegalese sahel: 1980–1984. Remote Sens. Environ. 1985, 17, 233–249. [Google Scholar] [CrossRef]
  25. Tucker, C.J.; Nicholson, S.E. Variations in the size of the sahara desert from 1980 to 1997. Ambio 1999, 28, 587–591. [Google Scholar]
  26. Evans, J.; Geerken, R. Discrimination between climate and human-induced dryland degradation. J. Arid Environ. 2004, 57, 535–554. [Google Scholar] [CrossRef]
  27. Olsson, L.; Eklundh, L.; Ardö, J. A recent greening of the sahel—Trends, patterns and potential causes. J. Arid Environ. 2005, 63, 556–566. [Google Scholar] [CrossRef]
  28. Bai, Z.; Dent, D.; Olsson, L.; Schaepman, M. Global Assessment of Land Degradation and Improvement: 1. Identification by Remote Sensing; FAO-Food and Agriculture Organization/ISRIC-World Soil Information: Rome, Italy; Wageningen, The Netherlands, 2008. [Google Scholar]
  29. Nkonya, E.; Gerber, N.; Baumgartner, P.; von Braun, J.; De Pinto, A.; Graw, V.; Kato, E.; Kloos, J.; Walter, T. The Economics of Desertification, Land Degradation, and Drought toward An Integrated Global Assessment; Center for Development Research(ZEF): Bonn, Germany, 2011. [Google Scholar]
  30. Fensholt, R.; Rasmussen, K.; Kaspersen, P.; Huber, S.; Horion, S.; Swinnen, E. Assessing land degradation/recovery in the African sahel from long-term earth observation based primary productivity and precipitation relationships. Remote Sens. 2013, 5, 664–686. [Google Scholar] [CrossRef] [Green Version]
  31. Dardel, C.; Kergoat, L.; Hiernaux, P.; Grippa, M.; Mougin, E.; Ciais, P.; Nguyen, C.-C. Rain-use-efficiency: What it tells us about the conflicting sahel greening and sahelian paradox. Remote Sens. 2014, 6, 3446–3474. [Google Scholar] [CrossRef] [Green Version]
  32. Yengoh, G.T.; Dent, D.; Olsson, L.; Tengberg, A.E.; Tucker, C.J. Use of the Normalized Difference Vegetation Index (NDVI) to Assess Land Degradation at Multiple Scales: Current Status, Future Trends, and Practical Considerations; Springer: Cham, Switzerland, 2015; pp. 9–26. [Google Scholar]
  33. Ibrahim, Y.; Balzter, H.; Kaduk, J.; Tucker, C. Land degradation assessment using residual trend analysis of gimms NDVI3g, soil moisture and rainfall in sub-saharan west Africa from 1982 to 2012. Remote Sens. 2015, 7, 5471–5494. [Google Scholar] [CrossRef]
  34. Le Houerou, H.N. Rain use efficiency: A unifying concept in arid-land ecology. J. Arid Environ. 1984, 7, 213–247. [Google Scholar]
  35. Symeonakis, E.; Drake, N. Monitoring desertification and land degradation over sub-saharan Africa. Int. J. Remote Sens. 2004, 25, 573–592. [Google Scholar] [CrossRef]
  36. Fensholt, R.; Rasmussen, K. Analysis of trends in the sahelian ‘rain-use efficiency’ using gimms NDVI, RFE and GPCP rainfall data. Remote Sens. Environ. 2011, 115, 438–451. [Google Scholar] [CrossRef]
  37. Jiao, J.J.; Zhang, X.; Wang, X. Satellite-based estimates of groundwater depletion in the Badain Jaran Desert, China. Sci. Rep. 2015, 5, 8960. [Google Scholar] [CrossRef] [PubMed] [Green Version]
  38. Xie, Z.; Huete, A.; Ma, X.; Restrepo-Coupe, N.; Devadas, R.; Clarke, K.; Lewis, M. Landsat and grace observations of arid wetland dynamics in a dryland river system under multi-decadal hydroclimatic extremes. J. Hydrol. 2016, 543, 818–831. [Google Scholar] [CrossRef]
  39. Feyisa, G.L.; Meilby, H.; Fensholt, R.; Proud, S.R. Automated water extraction index: A new technique for surface water mapping using landsat imagery. Remote Sens. Environ. 2014, 140, 23–35. [Google Scholar] [CrossRef]
  40. Tulbure, M.G.; Broich, M.; Stehman, S.V.; Kommareddy, A. Surface water extent dynamics from three decades of seasonally continuous landsat time series at subcontinental scale in a semi-arid region. Remote Sens. Environ. 2016, 178, 142–157. [Google Scholar] [CrossRef]
  41. Zhu, J.; Wang, N.; Chen, H.; Dong, C.; Zhang, H. Study on the boundary and the area of Badain Jaran Desert based on remote sensing imagery. Prog. Geogr. 2010, 29, 1087–1094. (In Chinese) [Google Scholar]
  42. Dong, Z.; Wang, T.; Wang, X. Geomorphology of the megadunes in the Badain Jaran Desert. Geomorphology 2004, 60, 191–203. [Google Scholar] [CrossRef]
  43. Ma, J.; Edmunds, W.M. Groundwater and lake evolution in the Badain Jaran Desert ecosystem, Inner Mongolia. Hydrogeol. J. 2006, 14, 1231–1243. [Google Scholar] [CrossRef]
  44. Yang, X.; Williams, M.A. The ion chemistry of lakes and late holocene desiccation in the Badain Jaran Desert, inner mongolia, China. Catena 2003, 51, 45–60. [Google Scholar] [CrossRef]
  45. Wu, Y.; Wang, N.; Zhao, L.; Zhang, Z.; Chen, L.; Lu, Y.; Lü, X.; Chang, J. Hydrochemical characteristics and recharge sources of lake nuoertu in the Badain Jaran Desert. Chin. Sci. Bull. 2014, 59, 886–895. [Google Scholar] [CrossRef]
  46. Wang, N.A.; Ning, K.; Li, Z.L.; Wang, Y.X.; Jia, P.; Ma, L. Holocene high lake-levels and pan-lake period onBadain Jaran Desert. Sci. China Earth Sci. 2016, 59, 1633. [Google Scholar] [CrossRef]
  47. Swenson, S.C. GRACE Monthly Land Water Mass Grids NETCDF RELEASE 5.0. Available online: https://podaac.jpl.nasa.gov/dataset/TELLUS_LAND_NC_RL05 (accessed on 5 December 2017).
  48. Gent, P.R.; Danabasoglu, G.; Donner, L.J.; Holland, M.M.; Hunke, E.C.; Jayne, S.R.; Lawrence, D.M.; Neale, R.B.; Rasch, P.J.; Vertenstein, M.; et al. The community climate system model version 4. J. Clim. 2011, 24, 4973–4991. [Google Scholar] [CrossRef]
  49. Lawrence, D.M.; Oleson, K.W.; Flanner, M.G.; Thornton, P.E.; Swenson, S.C.; Lawrence, P.J.; Zeng, X.; Yang, Z.-L.; Levis, S.; Sakaguchi, K.; et al. Parameterization improvements and functional and structural advances in version 4 of the community land model. J. Adv. Model. Earth Syst. 2011, 3, M03001. [Google Scholar] [CrossRef]
  50. Landerer, F.W.; Swenson, S.C. Accuracy of scaled grace terrestrial water storage estimates. Water Resour. Res. 2012, 48, 1–11. [Google Scholar] [CrossRef]
  51. Long, D.; Yang, Y.; Wada, Y.; Hong, Y.; Liang, W.; Chen, Y.; Yong, B.; Hou, A.; Wei, J.; Chen, L. Deriving scaling factors using a global hydrological model to restore grace total water storage changes for China’s Yangtze river basin. Remote Sens. Environ. 2015, 168, 177–193. [Google Scholar] [CrossRef]
  52. China Meteorological Data Service Center (CMDC). Available online: http://data.cma.cn/data/detail/dataCode/SURF_CLI_CHN_PRE_MON_GRID_0.5/ (accessed on 5 December 2017).
  53. Bookstein, F.L. Principal warps: Thin-plate splines and the decomposition of deformations. IEEE Trans. Pattern Anal. Mach. Intell. 1989, 11, 567–585. [Google Scholar] [CrossRef]
  54. Ran, Y.; Li, X.; Lu, L. Land Cover Products of China. Available online: http://westdc.westgis.ac.cn/data/f1aaacad-9f42-474e-478aa474-d437f437d6482f (accessed on 5 December 2017).
  55. NASA LP DAAC, STRM. Available online: https://lpdaac.usgs.gov/data_access/data_pool (accessed on 5 December 2017).
  56. Rouse, J.W., Jr.; Haas, R.; Schell, J.; Deering, D. Monitoring vegetation systems in the great plains with erts. NASA Spec. Publ. 1974, 351, 309. [Google Scholar]
  57. NASA LP DAAC, MODIS. Available online: https://lpdaac.usgs.gov/data_access/data_pool (accessed on 5 December 2017).
  58. Solano, R.; Didan, K.; Jacobson, A.; Huete, A. Modis Vegetation Index User’s Guide (Mod13 Series); Vegetation Index and Phenology Lab, The University of Arizona: Tucson, AZ, USA, 2010; pp. 1–38. [Google Scholar]
  59. USGS, GloVis. Available online: https://glovis.usgs.gov/ (accessed on 5 December 2017).
  60. Jiang, H.; Feng, M.; Zhu, Y.; Lu, N.; Huang, J.; Xiao, T. An automated method for extracting rivers and lakes from landsat imagery. Remote Sens. 2014, 6, 5067–5089. [Google Scholar] [CrossRef]
  61. Fisher, A.; Flood, N.; Danaher, T. Comparing landsat water index methods for automated water classification in eastern Australia. Remote Sens. Environ. 2016, 175, 167–182. [Google Scholar] [CrossRef]
  62. Justice, C.; Dugdale, G.; Townshend, J.; Narracott, A.; Kumar, M. Synergism between NOAA-AVHRR and meteosat data for studying vegetation development in semi-arid west Africa. Int. J. Remote Sens. 1991, 12, 1349–1368. [Google Scholar] [CrossRef]
  63. Prince, S.D.; Colstoun, D.; Brown, E.; Kravitz, L. Evidence from rain-use efficiencies does not indicate extensive sahelian desertification. Glob. Chang. Biol. 1998, 4, 359–374. [Google Scholar] [CrossRef]
  64. Prince, S.D.; Justice, C.O. Coarse resolution remote sensing of the Sahelian environment. Int. J. Remote Sens 1991, 12, 1137–1146. [Google Scholar]
  65. Rasmussen, M.S. Developing simple, operational, consistent NDVI-vegetation models by applying environmental and climatic information: Part I. Assessment of net primary production. Int. J. Remote Sens. 1998, 19, 97–117. [Google Scholar] [CrossRef]
  66. Fensholt, R.; Sandholt, I.; Rasmussen, M.S.; Stisen, S.; Diouf, A. Evaluation of satellite based primary production modelling in the semi-arid sahel. Remote Sens. Environ. 2006, 105, 173–188. [Google Scholar] [CrossRef]
  67. Tucker, C.; Vanpraet, C.; Boerwinkel, E.; Gaston, A. Satellite remote sensing of total dry matter production in the senegalese sahel. Remote Sens. Environ. 1983, 13, 461–474. [Google Scholar] [CrossRef]
  68. Verón, S.R.; Oesterheld, M.; Paruelo, J.M.; Díaz, S. Production as a function of resource availability: Slopes and efficiencies are different. J. Veg. Sci. 2005, 16, 351–354. [Google Scholar] [CrossRef]
  69. Malo, A.R.; Nicholson, S.E. A study of rainfall and vegetation dynamics in the African sahel using normalized difference vegetation index. J. Arid Environ. 1990, 19, 1–24. [Google Scholar]
  70. Wang, J.; Rich, P.M.; Price, K.P. Temporal responses of NDVI to precipitation and temperature in the central great plains, USA. Int. J. Remote Sens. 2003, 24, 2345–2364. [Google Scholar] [CrossRef]
  71. Cleveland, R.B.; Cleveland, W.S.; McRae, J.E.; Terpenning, I. Stl: A seasonal-trend decomposition procedure based on loess. J. Off. Stat. 1990, 6, 3–73. [Google Scholar]
  72. Donchyts, G.; Baart, F.; Winsemius, H.; Gorelick, N.; Kwadijk, J.; van de Giesen, N. Earth’s surface water change over the past 30 years. Nat. Clim. Chang. 2016, 6, 810–813. [Google Scholar] [CrossRef]
  73. Pekel, J.F.; Cottam, A.; Gorelick, N.; Belward, A.S. High-resolution mapping of global surface water and its long-term changes. Nature 2016, 540, 418–422. [Google Scholar] [CrossRef] [PubMed]
  74. Famiglietti, J.S.; Rodell, M. Water in the balance. Science 2013, 340, 1300–1301. [Google Scholar] [CrossRef] [PubMed]
  75. Richey, A.S.; Thomas, B.F.; Lo, M.H.; Reager, J.T.; Famiglietti, J.S.; Voss, K.; Swenson, S.; Rodell, M. Quantifying renewable groundwater stress with GRACE. Water Resour. Res. 2015, 51, 5217–5238. [Google Scholar] [CrossRef] [PubMed]
  76. Chen, J.; Wilson, C.; Tapley, B.; Scanlon, B.; Güntner, A. Long-term groundwater storage change in Victoria, Australia from satellite gravity and in situ observations. Glob. Planet. Chang. 2016, 139, 56–65. [Google Scholar] [CrossRef]
  77. Scanlon, B.R.; Zhang, Z.; Save, H.; Wiese, D.N.; Landerer, F.W.; Long, D.; Longuevergne, L.; Chen, J. Global evaluation of new GRACE mascon products for hydrologic applications. Water Resour. Res. 2016, 52, 9412–9429. [Google Scholar] [CrossRef]
  78. Swenson, S.; Yeh, P.J.F.; Wahr, J.; Famiglietti, J. A comparison of terrestrial water storage variations from grace with in situ measurements from Illinois. Geophys. Res. Lett. 2006, 33, L16401. [Google Scholar] [CrossRef]
  79. McGrath, G.S.; Sadler, R.; Fleming, K.; Tregoning, P.; Hinz, C.; Veneklaas, E.J. Tropical cyclones and the ecohydrology of Australia’s recent continental-scale drought. Geophys. Res. Lett. 2012, 39, L03404. [Google Scholar] [CrossRef]
  80. Leblanc, M.J.; Tregoning, P.; Ramillien, G.; Tweed, S.O.; Fakes, A. Basin-scale, integrated observations of the early 21st century multiyear drought in southeast Australia. Water Resour. Res. 2009, 45, 1–10. [Google Scholar] [CrossRef]
  81. Rodell, M.; Velicogna, I.; Famiglietti, J.S. Satellite-based estimates of groundwater depletion in India. Nature 2009, 460, 999–1002. [Google Scholar] [CrossRef] [PubMed]
  82. Long, D.; Longuevergne, L.; Scanlon, B.R. Global analysis of approaches for deriving total water storage changes from grace satellites. Water Resour. Res. 2015, 51, 2574–2594. [Google Scholar] [CrossRef]
  83. Richey, A.S.; Thomas, B.F.; Lo, M.H.; Famiglietti, J.S.; Swenson, S.; Rodell, M. Uncertainty in global groundwater storage estimates in a total groundwater stress framework. Water Resour. Res. 2015, 51, 5198–5216. [Google Scholar] [CrossRef] [PubMed]
  84. Sun, A.Y. Predicting groundwater level changes using grace data. Water Resour. Res. 2013, 49, 5900–5912. [Google Scholar] [CrossRef]
  85. Tian, S.; Tregoning, P.; Renzullo, L.J.; van Dijk, A.I.; Walker, J.P.; Pauwels, V.; Allgeyer, S. Improved water balance component estimates through joint assimilation of grace water storage and smos soil moisture retrievals. Water Resour. Res. 2017, 53, 1820–1840. [Google Scholar] [CrossRef]
  86. Xie, Z.; Huete, A.; Restrepo-Coupe, N.; Ma, X.; Devadas, R.; Caprarelli, G. Spatial partitioning and temporal evolution of Australia’s total water storage under extreme hydroclimatic impacts. Remote Sens. Environ. 2016, 183, 43–52. [Google Scholar] [CrossRef]
  87. Yang, Y.; Donohue, R.J.; McVicar, T.R.; Roderick, M.L.; Beck, H.E. Long-term CO2 fertilization increases vegetation productivity but has little effect on hydrological partitioning in tropical rainforests. J. Geophys. Res. Biogeosci. 2016, 121, 2125–2140. [Google Scholar] [CrossRef]
  88. Middleton, N.J.; Thomas, D.S. World Atlas of Desertification; Edward Arnold: London, UK, 1992; pp. 1–13. [Google Scholar]
  89. Modaihsh, A.S.; Horton, R.; Kirkham, D. Soil water evaporation suppression by sand mulches. Soil Sci. 1985, 139, 357–361. [Google Scholar] [CrossRef]
  90. Ding, H.; Zhang, H. Changes of groundwater resources in recent 50 years and their impact on ecological environment in Hexi corridor. J. Nat. Resour. 2002, 17, 691–697. [Google Scholar]
  91. Ma, J.Z.; Wang, X.S.; Edmunds, W.M. The characteristics of ground-water resources and their changes under the impacts of human activity in the arid northwest China—A case study of the shiyang river basin. J. Arid Environ. 2005, 61, 277–295. [Google Scholar] [CrossRef]
  92. Ma, Y.; Fan, S.; Zhou, L.; Dong, Z.; Zhang, K.; Feng, J. The temporal change of driving factors during the course of land desertification in arid region of north China: The case of minqin county. Environ. Geol. 2006, 51, 999–1008. [Google Scholar] [CrossRef]
  93. Wang, G.; Liu, J.; Kubota, J.; Chen, L. Effects of land-use changes on hydrological processes in the middle basin of the Heihe river, northwest China. Hydrol. Process. 2007, 21, 1370–1382. [Google Scholar] [CrossRef]
  94. Wessels, K.J.; Prince, S.; Malherbe, J.; Small, J.; Frost, P.; VanZyl, D. Can human-induced land degradation be distinguished from the effects of rainfall variability? A case study in south Africa. J. Arid Environ. 2007, 68, 271–297. [Google Scholar] [CrossRef]
  95. Chen, B.; Zhang, X.; Tao, J.; Wu, J.; Wang, J.; Shi, P.; Zhang, Y.; Yu, C. The impact of climate change and anthropogenic activities on alpine grassland over the Qinghai-Tibet Plateau. Agric. For. Meteorol. 2014, 189, 11–18. [Google Scholar] [CrossRef]
  96. Liu, C.; Liu, J.; Wang, X.-S.; Zheng, C. Analysis of groundwater-lake interaction by distributed temperature sensing in Badain Jaran Desert, northwest China. Hydrol. Process. 2016, 30, 1330–1341. [Google Scholar] [CrossRef]
  97. Dong, C.; Wang, N.; Chen, J.; Li, Z.; Chen, H.; Chen, L.; Ma, N. New observational and experimental evidence for the recharge mechanism of the lake group in the Alxa Desert, north-central China. J. Arid Environ. 2016, 124, 48–61. [Google Scholar] [CrossRef]
  98. Gong, Y.; Wang, X.; Hu, B.X.; Zhou, Y.; Hao, C.; Wan, L. Groundwater contributions in water-salt balances of the lakes in the Badain Jaran Desert, China. J. Arid Land 2016, 8, 694–706. [Google Scholar] [CrossRef]
  99. Luo, X.; Jiao, J.J.; Wang, X.; Liu, K. Temporal 222Rn distributions to reveal groundwater discharge into desert lakes: Implication of water balance in the Badain Jaran Desert, China. J. Hydrol. 2016, 534, 87–103. [Google Scholar] [CrossRef]
  100. Chen, J.S.; Li, L.; Wang, J.Y.; Barry, D.; Sheng, X.F.; Gu, W.Z.; Zhao, X.; Chen, L. Water resources: Groundwater maintains dune landscape. Nature 2004, 432, 459–460. [Google Scholar] [CrossRef] [PubMed]
  101. Jarihani, A.A.; Callow, J.N.; Johansen, K.; Gouweleeuw, B. Evaluation of multiple satellite altimetry data for studying inland water bodies and river floods. J. Hydrol. 2013, 505, 78–90. [Google Scholar] [CrossRef]
  102. Yin, Z. A study on life cycle of desert tourist area—A case study of Badain Jaran Desert. Econ. Geogr. 2011, 31, 1042–1046. [Google Scholar]
  103. Normile, D. Getting at the roots of killer dust storms. Science 2007, 317, 314–316. [Google Scholar] [CrossRef] [PubMed]
  104. Williams, W. Anthropogenic salinisation of inland waters. Hydrobiologia 2001, 466, 329–337. [Google Scholar] [CrossRef]
  105. Farley, K.A.; Jobbágy, E.G.; Jackson, R.B. Effects of afforestation on water yield: A global synthesis with implications for policy. Glob. Chang. Biol. 2005, 11, 1565–1576. [Google Scholar] [CrossRef]
  106. Zomer, R.J.; Trabucco, A.; Bossio, D.A.; Verchot, L.V. Climate change mitigation: A spatial analysis of global land suitability for clean development mechanism afforestation and reforestation. Agric. Ecosyst. Environ. 2008, 126, 67–80. [Google Scholar] [CrossRef]
  107. Wilcox, B.P.; Sorice, M.G.; Young, M.H. Dryland ecohydrology in the anthropocene: Taking stock of human–ecological interactions. Geogr. Compass 2011, 5, 112–127. [Google Scholar] [CrossRef]
Figure 1. (a,b) The location of the BJD (Badain Jaran Desert) region in China; (c) the location of the lake group area in the BJD and four lakes where the lake water level was monitored by in situ instruments in this study.
Remotesensing 10 00134 g001
Figure 2. Lakes extent in the BJD retrieved from Landsat images in 24 July 2002 by using the AWEIsh index.
Remotesensing 10 00134 g002
Figure 3. Monthly TWSA (solid blue line) averaged over the BJD from 2003 to 2014 with a green line indicating the smoothed and deseasonalized TWSA. The dark blue dashed line is the linear trend of the deseasonalized TWSA. The red line is the monthly precipitation and gray bars are the annual accumulated precipitation.
Remotesensing 10 00134 g003
Figure 4. (a) Spatial trends in annual TWSA from 2001 to 2014; (b) and in annual precipitation from 2001 to 2014 over the BJD study area. The blue lines represent rivers and the gray dashed lines stand for the boundary of the BJD.
Remotesensing 10 00134 g004
Figure 5. Spatial distributions of mean NDVI (a,d); significant NDVI annual trends (p < 0.05) (b,e); and the RUEmo trends (c,f) over the BJD and lake group area from 2001 to 2014 (p < 0.05).
Remotesensing 10 00134 g005
Figure 6. The land cover map of the study area in 2000.
Remotesensing 10 00134 g006
Figure 7. Variations in the areas with different NDVI ranges (>0.1) from 2001 to 2014 over the study region.
Remotesensing 10 00134 g007
Figure 8. The seasonal average lakes area and TWSA over the study area.
Remotesensing 10 00134 g008
Figure 9. Annual average values of NDVI (red lines), precipitation (green lines), and the RUEmo (blue lines) from 2001 to 2014 over the four selected lake basins of (a) Lake BR; (b) Lake YH; (c) Lake NH; and (d) Lake ZN.
Remotesensing 10 00134 g009
Figure 10. (a) The aggregated monthly in-situ lake water levels of the four lakes (Lake BR, Lake NH, Lake YH, and Lake ZN) from June 2011 to June 2015; (b) The deseasonalized lake water levels of the four lakes during the observation period with the green dashed lines representing the linear trends of lake water levels.
Remotesensing 10 00134 g010

