Article

The Effect of Three Different Data Fusion Approaches on the Quality of Soil Moisture Retrievals from Multiple Passive Microwave Sensors

by
Robin Van der Schalie
1,2,*,
Richard De Jeu
2,
Robert Parinussa
2,
Nemesio Rodríguez-Fernández
3,
Yann Kerr
3,
Amen Al-Yaari
4,
Jean-Pierre Wigneron
4 and
Matthias Drusch
5
1
Faculty of Earth and Life Sciences, VU University Amsterdam (VUA), 1081HV Amsterdam, The Netherlands
2
VanderSat B.V., 2011VK Haarlem, The Netherlands
3
Centre d’Etudes Spatiales de la Biosphere (CESBIO), 31400 Toulouse, France
4
INRA, UMR1391 ISPA, Villenave d’Ornon, France
5
European Space Research and Technology Centre (ESTEC), ESA, 2201AZ Noordwijk, The Netherlands
*
Author to whom correspondence should be addressed.
Remote Sens. 2018, 10(1), 107; https://doi.org/10.3390/rs10010107
Submission received: 22 September 2017 / Revised: 27 December 2017 / Accepted: 9 January 2018 / Published: 13 January 2018
(This article belongs to the Special Issue Retrieval, Validation and Application of Satellite Soil Moisture Data)

Abstract

:
Long-term climate records of soil moisture are of increased importance to climate researchers. In this study, we aim to evaluate the quality of three different fusion approaches that combine soil moisture retrieval from multiple satellite sensors. The arrival of L-band missions has led to an increased focus on the integration of L-band-based soil moisture retrievals in climate records, emphasizing the need to improve our understanding based on its added value within a multi-sensor framework. The three evaluated approaches were developed on 10-year passive microwave data (2003–2013) from two different satellite sensors, i.e., SMOS (2010–2013) and AMSR-E (2003–2011), and are based on a neural network (NN), regressions (REG), and the Land Parameter Retrieval Model (LPRM). The ability of the different approaches to best match AMSR-E and SMOS in their overlapping period was tested using an inter-comparison exercise between the SMOS and AMSR-E datasets, while the skill of the individual soil moisture products, based on anomalies, was evaluated using two verification techniques; first, a data assimilation technique that links precipitation information to the quality of soil moisture (expressed as the Rvalue), and secondly the triple collocation analysis (TCA). ASCAT soil moisture was included in the skill evaluation, representing the active microwave-based counterpart of soil moisture retrievals. Besides a semi-global analysis, explicit focus was placed on two regions that have strong land–atmosphere coupling, the Sahel (SA) and the central Great Plains (CGP) of North America. The NN approach gives the highest correlation coefficient between SMOS and AMSR-E, closely followed by LPRM and REG, while the absolute error is approximately the same for all three approaches. The Rvalue and TCA show the strength of using different satellite sources and the impact of different merging approaches on the skill to correctly capture soil moisture anomalies. The highest performance is found for AMSR-E over sparse vegetation, for SMOS over moderate vegetation, and for ASCAT over dense vegetation cover. While the two SMOS datasets (L3 and LPRM) show a similar performance, the three AMSR-E datasets do not. The good performance for AMSR-E over spare vegetation is mainly perceived for AMSR-E LPRM, benefiting from the physically based model, while AMSR-E NN shows improved skill in densely vegetated areas, making optimal use of the SMOS L3 training dataset. AMSR-E REG has a reasonable performance over sparsely vegetated areas; however, it quickly loses skill with increasing vegetation density. The findings over the SA and CGP mainly reflect results that are found in earlier sections. This confirms that historical soil moisture datasets based on a combination of these sources are a valuable source of information for climate research.

1. Introduction

Long-term, consistent soil moisture records are essential to improving our understanding of the impact of climate change, as already demonstrated in many research studies (e.g., see [1] for a comprehensive overview). In 2010, the importance of soil moisture was recognized by the Global Climate Observation System (GCOS), which labeled this important variable an Essential Climate Variable (ECV) [2].
Direct measurements of soil moisture can be done with in situ sensor networks, but the current coverage is sparse and unequally distributed worldwide. In addition, soil moisture from in situ sensors generally has a small spatial support, which makes the use of in situ networks unsuitable for providing reliable global soil moisture climate records. Problems with continuity, sensor characteristics, and non-uniform data processing make consistency a significant issue; however, initiatives like the International Soil Moisture Network (ISMN) [3,4] aim at providing this. Satellite observations from both active and passive microwave sensors are able to fill this gap as they are able to measure variations in water content of the top layer of the soil, especially at lower frequencies [5].
Over the last two decades, an increased effort has been made to develop algorithms that can derive soil moisture from both passive and active microwave observations [6,7,8,9,10], for which observations from the Advanced Microwave Scanning Radiometer—Earth Observing System (AMSR-E) often formed the basis for the development (i.e., C- and X-band frequencies [11]). For active microwave-based soil moisture retrieval, observations from ESA’s two European Remote Sensing (ERS) satellites, ERS-1 and -2, provided researchers with a source of input [7]. Recently, two soil moisture missions have been launched, the Soil Moisture and Ocean Salinity mission in 2009 (SMOS) [12] and the Soil Moisture Active Passive mission in 2015 (SMAP) [13], which observe the Earth in the L-band frequency (1.4 GHz). Theoretically, this is the optimal frequency for surface soil moisture sensing due to its increased sensing depth (approximately the first 5 cm instead of the first 2 cm from C- and X-band) and decreased sensitivity to vegetation as compared to the higher frequencies. This gave way to the development of L-band specific algorithms [13,14,15,16,17].
In 2010, ESA initiated a project with the goal of developing a consistent long-term dataset of soil moisture derived from a wide range of active and passive microwave sensors (http://www.esa-soilmoisture-cci.org) [18]. The CCI soil moisture dataset (ESA-CCI-SM) is currently the most popular ESA CCI product, with over 4000 registered users. The ESA-CCI-SM consists of a merger between active and passive soil moisture retrievals, following the baseline methodology of Liu et al. [19,20], which was recently further advanced [21]. This merging of active and passive is based on the complementary nature of the two data sources, with passive soil moisture retrievals performing better over sparsely vegetated areas, and active sensors performing better over more densely vegetated areas [22,23,24]. The specific contribution of L-band based retrievals within such a multi-sensor approach is currently not well understood.
Building a consistent long-term soil moisture dataset is not straightforward due to large differences in satellite sensor characteristics and retrieval algorithms. Therefore, several alternative fusion approaches that aim to construct coherent time series from instruments that were only working at the same time for a limited time period are currently being explored [25,26,27]. With the arrival of L-band missions, these fusion approaches have an increased focus on the integration of L-band-based soil moisture retrievals. However, it is still unclear how the use of different fusion approaches will affect the quality of single-sensor soil moisture datasets and how L-band inclusion in a multi-sensor approach adds value. This study aims to provide insight into these questions by evaluating three different fusion approaches that have been applied to satellite observations from both AMSR-E (2003–2011) and SMOS (2010-onwards).
The first evaluated fusion approach is based on a global neural network approach (NN) [26,28], which uses AMSR-E brightness temperature observations from several frequencies as input and uses the SMOS Level 3 soil moisture product from CATDS (Centre Aval de Traitement de Données SMOS) as a reference dataset for the training phase in the common ASMSR-e and SMOS period. Once trained, the NN is applied to the whole AMSR-E data record for 2003–2010. The second fusion approach also uses SMOS L3 soil moisture as the training dataset for AMSR-E observations, and the training is based on local regressions (REG) [14,25] and applying regression coefficients to the AMSR-E period retrospectively. The third approach uses a refined version of the Land Parameter Retrieval Model (LPRM) [27,29], which is the current baseline algorithm for passive microwave component in the ESA-CCI-SM. The LPRM was further developed for the application to SMOS L-band observations [27,30]. To put the results in perspective considering an existing multi-sensor approach like the ESA-CCI-SM, soil moisture retrievals based on observations from the Advanced Scatterometer (ASCAT) [31] are also included in the evaluation. The ASCAT soil moisture reflects the active counterpart and is retrieved using the Change Detection Algorithm (CDA) [7]. This will provide users from datasets like the ESA-CCI-SM the opportunity to better understand the pros and cons of these different sensors and merging strategies.
A first indication of the quality of these fusion approaches was provided by Rodriguez-Fernandez et al. [26], in whose study the three different AMSR-E datasets (NN, REG and LPRM) were compared against in situ data and modeled data from NASA’s Modern-Era Retrospective analysis for Research and Applications—Land (MERRA-Land) [32] and from the European Centre for Medium-Range Weather Forecasts its ERA-Interim/Land [33]. Van der Schalie et al. [17] presented an extensive comparison between the two SMOS datasets (L3 and LPRM) against in situ measurements from the ISMN. However, as discussed earlier, the use of ground observations has its shortcomings. Models, on the other hand, have global coverage but contain unique error characteristics and the results are therefore difficult to interpret. The evaluations, as done in these paper, are also based on the bulk statistics of soil moisture time series, which could be heavily influenced by structural differences in seasonal cycles, and do not necessarily provide information on the ability of a dataset to capture individual soil moisture anomalies [34].
In order to overcome these problems, several methods have been developed that are better able to quantify the skill of soil moisture datasets. One of these is a large-scale precipitation-based validation technique that provides a robust representation of (anomaly) correlation-based skills in satellite soil moisture retrieval through data assimilation (expressed as the Rvalue) [35,36]. Another method is the Triple Collocation Analysis (TCA) [24,37,38,39], which uses three collocated soil moisture datasets in order to estimate the root mean square error (rmse) of the random error component of the actual estimate, in the absence of a dataset that can be used as the absolute truth at the global scale and provided some conditions are satisfied. As these statistical methods also have their limitations (for example, correlated errors in soil moisture datasets could lead to uncertainties in TCA results), it is important to interpret them together instead of using a single metric.
In this study, the different fusion approaches are evaluated, focusing on the ability of the different approaches to best match AMSR-E and SMOS in their overlapping period and defining the skill of the individual datasets in the next steps. The four steps are: (1) A comparison exercise between the AMSR-E and SMOS fusion approaches, i.e., LPRM/NN/REG, to check the consistency between the datasets in their overlapping period. The skills of the SMOS, AMSR-E and ASCAT soil moisture anomalies were determined through (2) the Rvalue technique with precipitation data from the Tropical Rainfall Measuring Mission (TRMM), and (3) TCA based on combining soil moisture from a passive (AMSR-E/SMOS), active (ASCAT), and modeled source (Modern-Era Retrospective analysis for Research and Applications, MERRA). In a final exercise, (4) explicit focus is placed on two regions that have strong land–atmosphere coupling, the Sahel and the central Great Plains of North America [40,41,42], which means soil moisture plays an important role here from a climate perspective as soil moisture variability directly affects the energy fluxes and weather patterns over these regions.

2. Data

2.1. AMSR-E

The AMSR-E is a sensor on the Aqua satellite, which is a joint collaboration of the Japan Aerospace Exploration Agency (JAXA) and NASA. AMSR-E is a passive microwave radiometer that was in operation between 2002 and 2011, and measured the Earth’s emission in six different frequencies (6.9–89.0 GHz), in both horizontal and vertical polarization. The mean spatial resolution of the radiometer observations decreases from 56 to 5.4 km with increasing frequency. Before the arrival of the new-generation L-band missions, AMSR-E was an important data source for the development of passive microwave soil moisture retrieval algorithms [11]. Although the C- and X-band (6.9 and 10.7 GHz) observations are theoretically not as optimal for soil moisture retrievals as L-band, this downside can potentially be balanced out by the higher radiometric accuracy of the sensor. Secondly, the multi-frequency observations from AMSR-E give a unique ability to switch between frequencies when the frequency is disturbed by artificial noise, which is often named Radio Frequency Interference (RFI) [43,44,45], and to simultaneously retrieve the soil temperature from higher frequencies (e.g., from 36.5 GHz observations) [36,46]. Three different soil moisture datasets derived from AMSR-E observations are used in this study, the AMSR-E NN, AMSR-E REG and AMSR-E LPRM. Only observations from the descending overpasses of AMSR-E (01.30 AM) are used, as it generally results in higher-quality retrievals [22,45], which is caused by the increased thermodynamic equilibrium conditions of the soil and canopy at night, leading to more reliable temperature estimates [36]. The AMSR-E-based datasets were provided in a 25 km EASE2 grid and regridded to a quarter degree grid using bilinear interpolation. Pixels with RFI and frozen soil [46] were removed.

2.1.1. AMSR-E NN Soil Moisture

The first AMSR-E soil moisture dataset evaluated in this study was developed by Rodriguez-Fernandez et al. [26] using a Neural Network approach (hereafter, this dataset will be called AMSR-E NN). Soil moisture from AMSR-E observations is retrieved using a global non-linear relationship linking AMSR-E brightness temperatures to SMOS L3 soil moisture. This relationship was obtained using a neural network. A large number of input data configurations and NN architecture were studied. The optimal input configuration was suing ASMR-E brightness temperatures at 6.9 GHz (H/V), 10.7 GHz (H/V), 23.8 GHz (H) and 36.5 GHz (H/V), with the first two frequencies giving information on soil moisture and the last two frequencies giving additional information on the soil temperature, which improve the NN performance to retrieve soil moisture by ~2%. A local normalization of the brightness temperatures at 6.9 GHz and 10.7 GHz was also used as input. Using together the brightness temperatures and the local normalized indexes improve the results by 10%. Thus, in the final configuration the input vectors have eleven elements. Regarding the architecture, one single hidden layer with five non-linear neurons (hyperbolic tangents) was used, as it was enough to capture the relationship between the input data and the reference SM and tests with more neurons did not improve the results. The output layer is a single linear neuron. Taking into account the input vector size and the NN architecture, the total number of synaptic weights to fix during the training phase is 66. The training was done for the overlapping time period of SMOS and AMSR-E, from July 2010 to October 2011, and afterward the optimized neural network was retrospectively applied to the AMSR-E period of 2003 to 2011.

2.1.2. AMSR-E REG Soil Moisture

The second AMSR-E soil moisture data set is developed by Al-Yaari et al. [25], who tested a physically based statistical regression method. This statistical regression was analytically derived from the L-Band Emission of the Biosphere model (L-MEB), based on bi-polarization brightness temperatures [14,47]. It is assumed that the values of optical depth are the same for both polarizations (H & V) and the single scattering albedo value is negligible. In a first step, the coefficients of the regression equation were calibrated using SMOS L3 soil moisture as a reference to optimally match the AMSR-E 6.9 GHz (H/V) brightness temperatures and soil temperature derived from 36.5 GHz [46] to SMOS L3 soil moisture on a point to point basis. The calibration was done during the overlapping time period for SMOS and AMSR-E, July 2010 to October 2011. This was evaluated by comparing the AMSR-REG soil moisture product against the reference (i.e., SMOS L3 soil moisture product) over the calibration period. A reasonable agreement was obtained with global mean correlation of 0.60 and rmse = 0.057 m3 m−3 as shown by Al-Yaari et al. [25]. These regression coefficients where applied to AMSR-E brightness temperature datasets for the period of 2003 to 2011, to retrieve the AMSR-E REG soil moisture dataset. The accuracy of AMSR-REG soil moisture retrievals was assessed by comparing them with an old version of AMSR-E soil moisture retrievals derived from LPRM against the global MERRA-Land soil moisture simulations and ground-based measurements over 2003–2009, showing a with respect to in situ observations and higher (lower) correlations (ubrmse) with MERRA-land over the boreal regions.

2.1.3. AMSR-E LPRM Soil Moisture

The third AMSR-E dataset that is evaluated in this study is developed by [27], and uses the physically based Land Parameter Retrieval Model [29], which was further developed to specifically allow for the direct integration with SMOS LPRM soil moisture data (see section below). The internal parameterization, e.g., surface roughness and single scattering albedo, of the LPRM model as used for AMSR-E-based soil moisture retrievals was revisited using SMOS LPRM as a training dataset. The final dataset also includes a linear scaling to SMOS LPRM, bringing the datasets within the same absolute range without changing their individual temporal dynamics. [46] established a linear relation for temperature from 36.5 GHz observations, which is used for the temperature input in the LPRM model. The AMSR-E LPRM dataset covers the period of 2003 to 2011. In Van der Schalie et al. [27], a significant increase (decrease) in correlation (ubrmse) was found against both in situ as modeled soil moisture datasets after improving the internal parameterization and using the scaling to SMOS LPRM.

2.2. SMOS

SMOS is an ESA mission with participation of the French Centre National d’Etudes Spatiales (CNES) and the Spanich Centro de Desarrolo Técnico Industrial (CDTI) and was launched at the end of 2009 It is the first soil moisture dedicated satellite mission [12,48]. The satellite’s instrument observes the Earth’s emission at L-band (more specific, at 1.4 GHz), in full polarization and at a wide range of incidence angles (0°–65°). This frequency was chosen since L-band is the only protected frequency below 5 GHz and is optimal for retrieving soil moisture and sea surface salinity [49]. The spatial resolution ranges between 35–50 km; at the equator SMOS has a revisit time of twice every three days, with an ascending overpass around 6 a.m. and a descending overpass around 6 p.m. (local solar time). The ascending data of two SMOS derived soil moisture datasets are used in the evaluation, SMOS Level 3 and SMOS LPRM, which are described below. These datasets are provided in a 25 km Equal Area Scalable Earth (EASE) 2 grid and regridded to a quarter degree grid using a standard bilinear interpolation.

2.2.1. SMOS Level 3 Soil Moisture

Two of the fusion approaches, NN and REG, use the Centre Aval de Traitement de Données SMOS Level 3 soil moisture (SMOS L3, v271). The SMOS L3 retrieval algorithm is developed by Wigneron et al. [50] and Kerr et al. [15] and is based on solving the radiative transfer model (RTM) [51], which calculates the emission of a land area, including vegetation cover, for the main land cover in a grid cell and by making use of the multiple incidence angles. Temporally and spatially interpolated soil temperature data from the European Centre for Medium-Range Weather Forecasts (ECMWF) are used for the effective temperature input. Data was used for the period of July 2010 to May 2015. Only data from the SMOS ascending (06:00 a.m.) overpasses were used in order to have the closest match with the descending (01:30 a.m.) AMSR-E observations. The SMOS L3 flags were used for filtering, removing all observations that were flagged with open water, snow, frost, or coastal areas, or for having an RFI probability of over 0.2. The RFI probability is defined in the SMOS L3 product as the total number of observations in which RFI has been detected divided by the total amount of observations in a certain time frame, for which currently a moving average of ±12 days is used [52]. To minimize the RFI influence on the three fusion approaches, a strict boundary of 0.2 was adopted from recent studies [17,53].

2.2.2. SMOS LPRM Soil Moisture

Van der Schalie et al. [17,30] optimized the Land Parameter Retrieval Model [29] for SMOS L-band observations, which were later updated with a new roughness parameterization and merging strategy [27]. This approach was used for the LPRM fusion approach, which is in contrast with the others (i.e., NN and REG) that rely on the official SMOS soil moisture product. The LPRM is also based on a radiative transfer model [51], however some important points in which the SMOS LPRM distinguishes itself from the SMOS L3 are: (1) the use of a single global parameterization, independent of land cover; (2) the use of an analytical solution for the derivation of the vegetation optical depth [54]; and (3) the retrieval is based on the effective average area for soil moisture, instead of the main land cover in a grid cell [17]. For SMOS data flagging, the same procedure is followed for SMOS LPRM as is for SMOS L3. The SMOS LPRM uses only observations with an incidence angle between 35° and 60°, leading to an average decrease in the number of retrievals by 15% compared to SMOS L3. The SMOS LPRM is available for the period of July 2010 to May 2015.

2.3. ASCAT Soil Moisture

The ASCAT soil moisture data product is used as an independent remotely sensed surface soil moisture dataset, presented as degree of saturation. Backscatter observations derived from the Advanced Scatterometer (ASCAT) instrument are used to retrieve soil moisture. ASCAT is a C-band (5.3 GHz) real aperture radar on board of two satellites that are part of the Meteorological Operational satellite program (MetOp-A and MetOp-B), which is a joint program by ESA and the European Organisation for the Exploitation of Meteorological Satellites (EUMETSAT). The MetOp-A satellite was launched in October 2006, with MetOp-B increasing the coverage from September 2012 onwards. The ASCAT soil moisture dataset used in this study was developed by the Technical University of Vienna and is based on the commonly used Change Detection Algorithm (CDA) [7,31]. In the CDA, reference backscatters for a vegetated land surface under dry and saturated conditions are used to derive the degree of saturation. The signature of the backscatter over multiple incidence angles is used to correct for inter-annual variations in vegetation cover. The retrievals were done for both ascending (9.30 p.m.) and descending (9.30 a.m.) overpasses; when both overpasses are available their average was taken [55]. This gives the ASCAT soil moisture dataset a revisit time of one to two days. Data used are between January 2007 and May 2015.

2.4. MERRA Soil Moisture

Modelled soil moisture from the Modern-Era Retrospective analysis for Research and Applications (MERRA) is used as part of the statistical evaluation strategy (i.e., Triple colocation Analysis (TCA), see Section 3.3). MERRA is an atmospheric reanalysis developed by NASA, which uses the Goddard Earth Observing System model, version 5 (GEOS-5) [56], supported by the Data Assimilation System (DAS) [57]. More specifically, data from the MERRA-Land [32] reanalysis were used, which is specifically developed to improve the output of the model over land and is the recommended dataset for use in hydrological studies over land compared to the regular MERRA model. These improvements are obtained by two changes over the baseline MERRA model, which is the use of a more accurate precipitation forcing and by using an improved Catchment land surface model. The soil moisture from MERRA-Land as used in this study is the top layer, representing the first 2 cm of the soil. Data is provided in a 1/2° (latitude) by 2/3° (longitude) grid, and regridded using bilinear interpolation to a quarter degree grid. For use in the TCA, it is important to note that the data assimilation system of MERRA-Land does not include satellite-retrieved soil moisture, nor passive or active microwave observations. During the evaluation and writing, the latest version of MERRA (MERRA-2) was not yet available; however, Dorigo et al. [24] used several product combinations and showed that the error estimates are only marginally influenced by the choice of the third (independent) dataset.

2.5. TRMM 3B42 Precipitation

The Rvalue evaluation requires a precipitation dataset as input. In line with earlier studies, a dataset based on observations from the Tropical Rainfall Measuring Mission (TRMM) is used (e.g., [35,36]). TRMM was developed in collaboration between NASA and JAXA, with the aim to study precipitation behavior over the tropical regions, and was launched late 1997. Onboard, TRMM carries several rain measuring instruments, the Precipitation Radar, TRMM Microwave Imager and Visible and Infrared Scanner. More specifically, the TRMM 3B42 (v.07) Merged HQ/Infrared Precipitation [58] is used, which provides precipitation rate and precipitation-error estimates between a latitude of 50°N–50°S. Precipitation estimates from multiple microwave and infrared sensors are used, which are calibrated to TRMM-based precipitation estimates, and afterwards a rain-gauge-based correction was applied. The data was provided in a quarter degree grid and daily files were created by accumulating precipitation over a 24-h period.

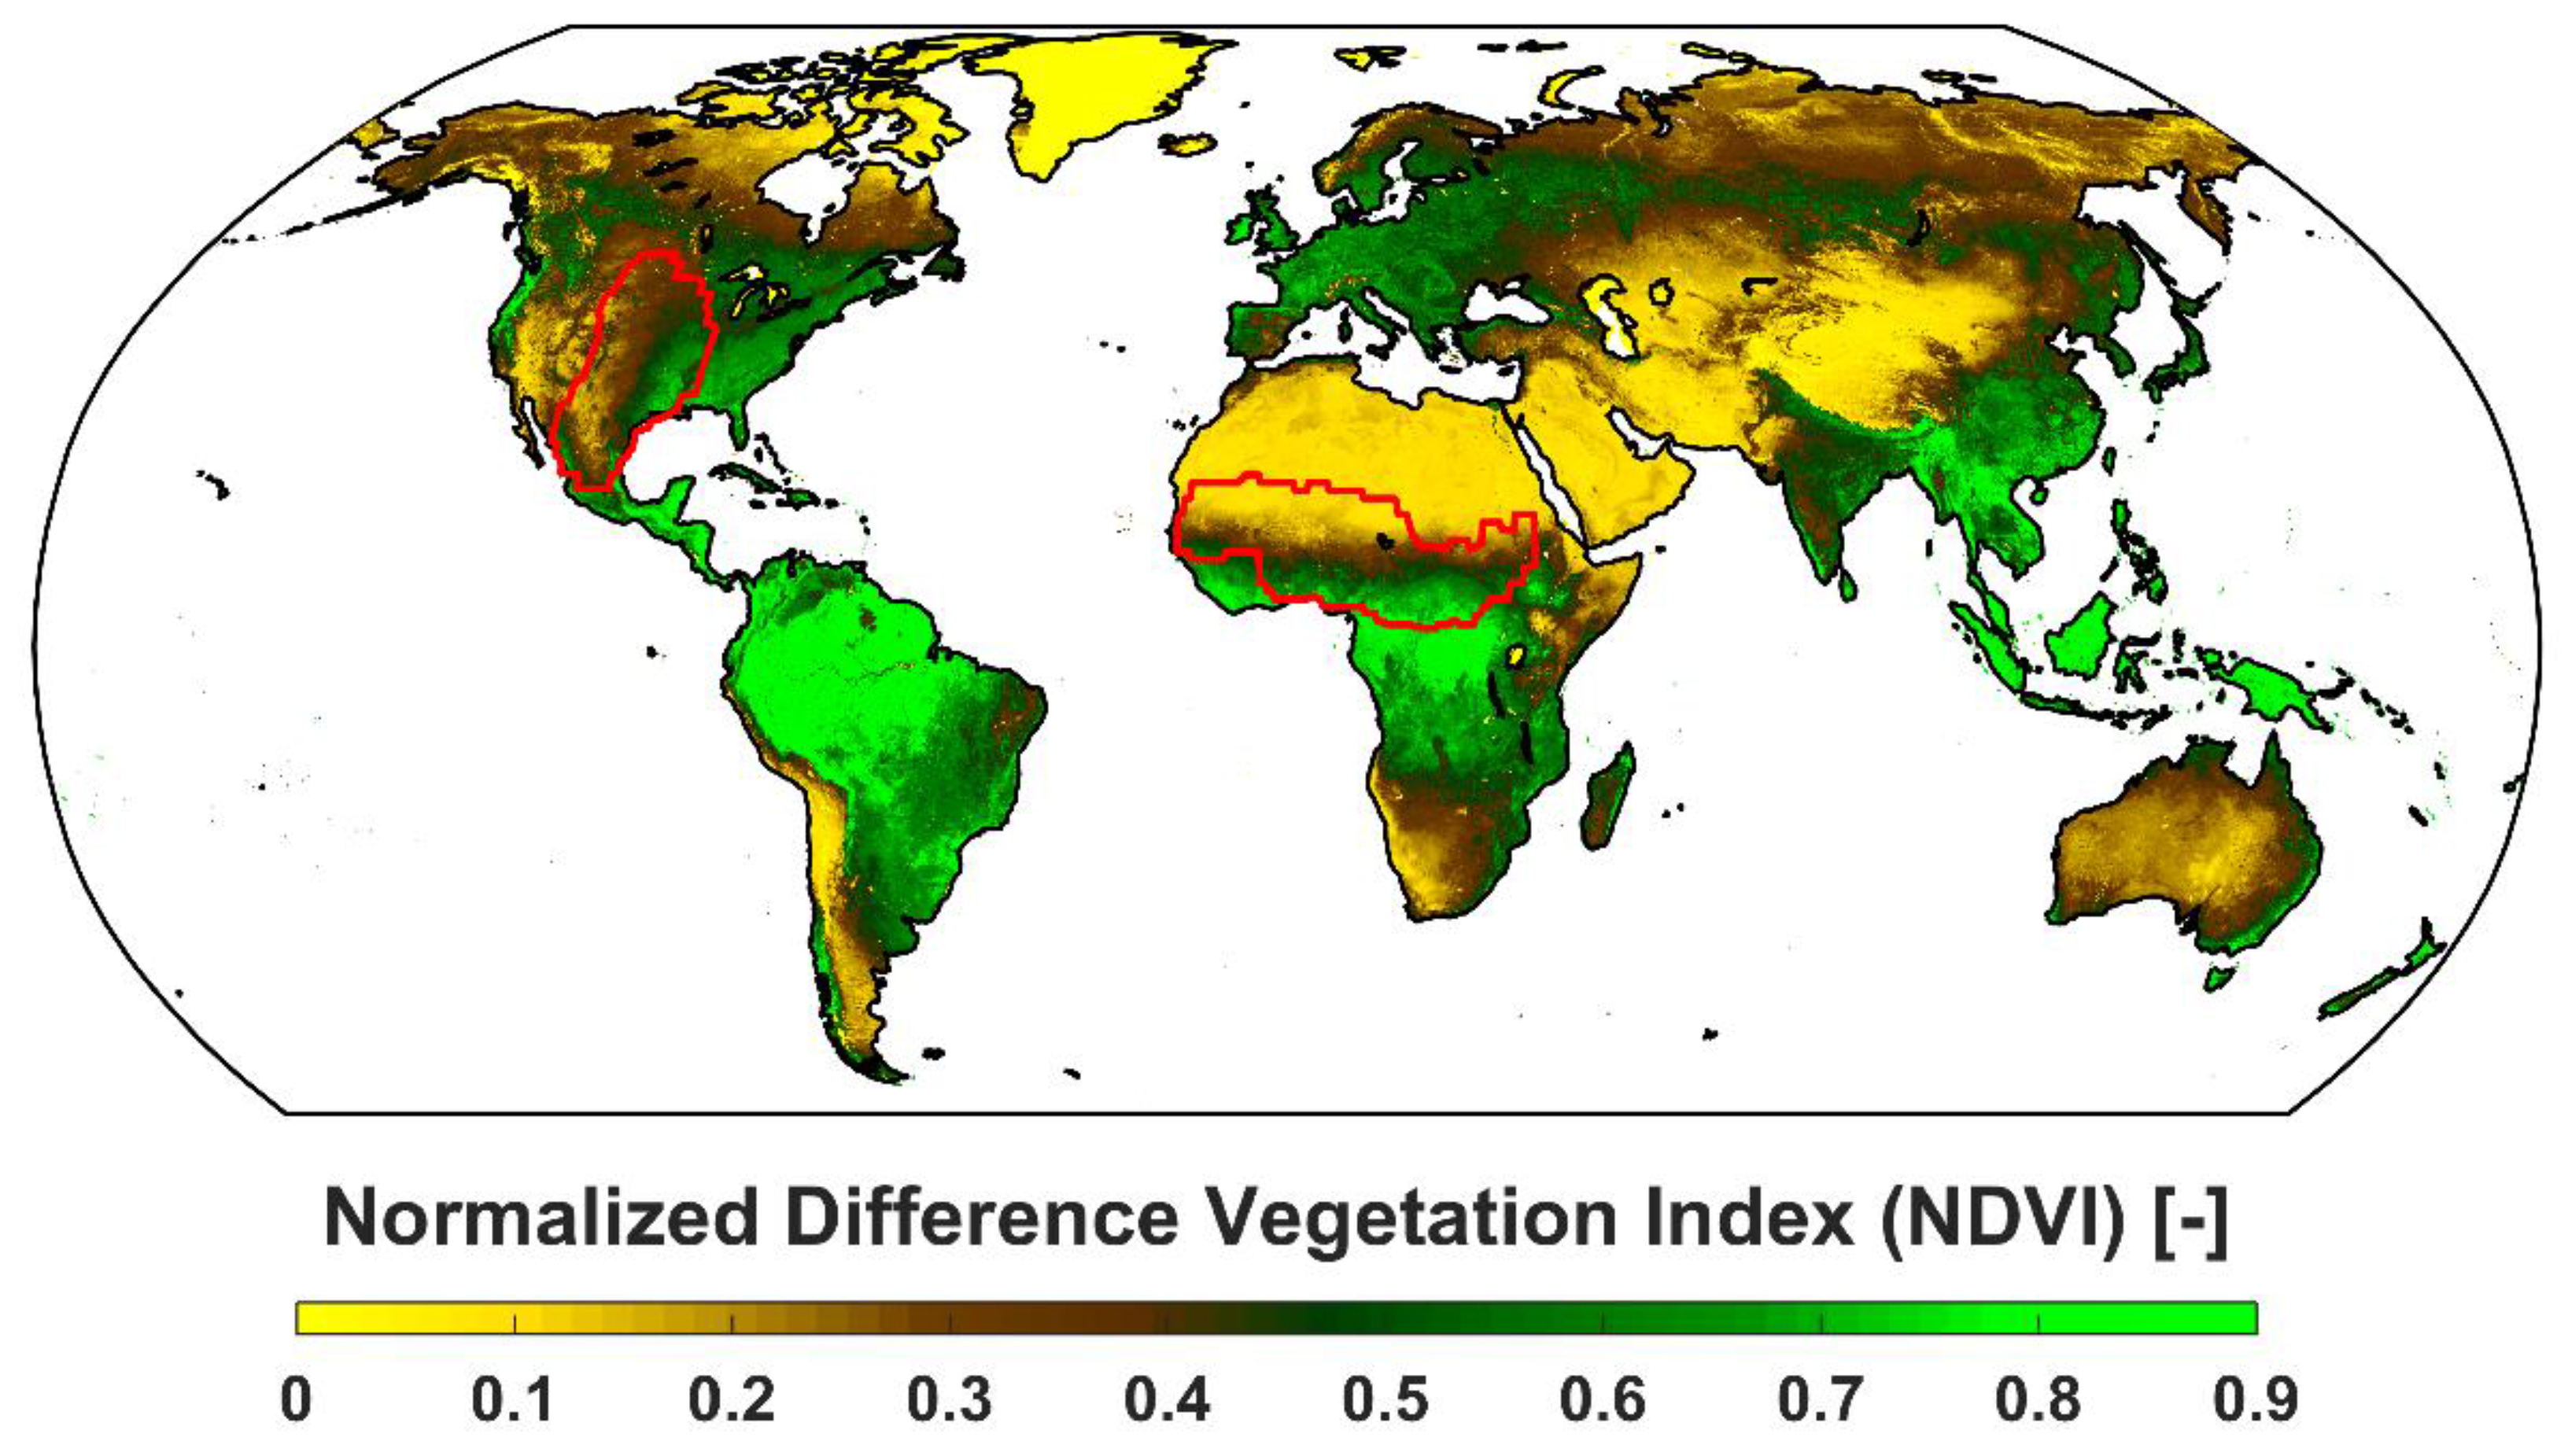
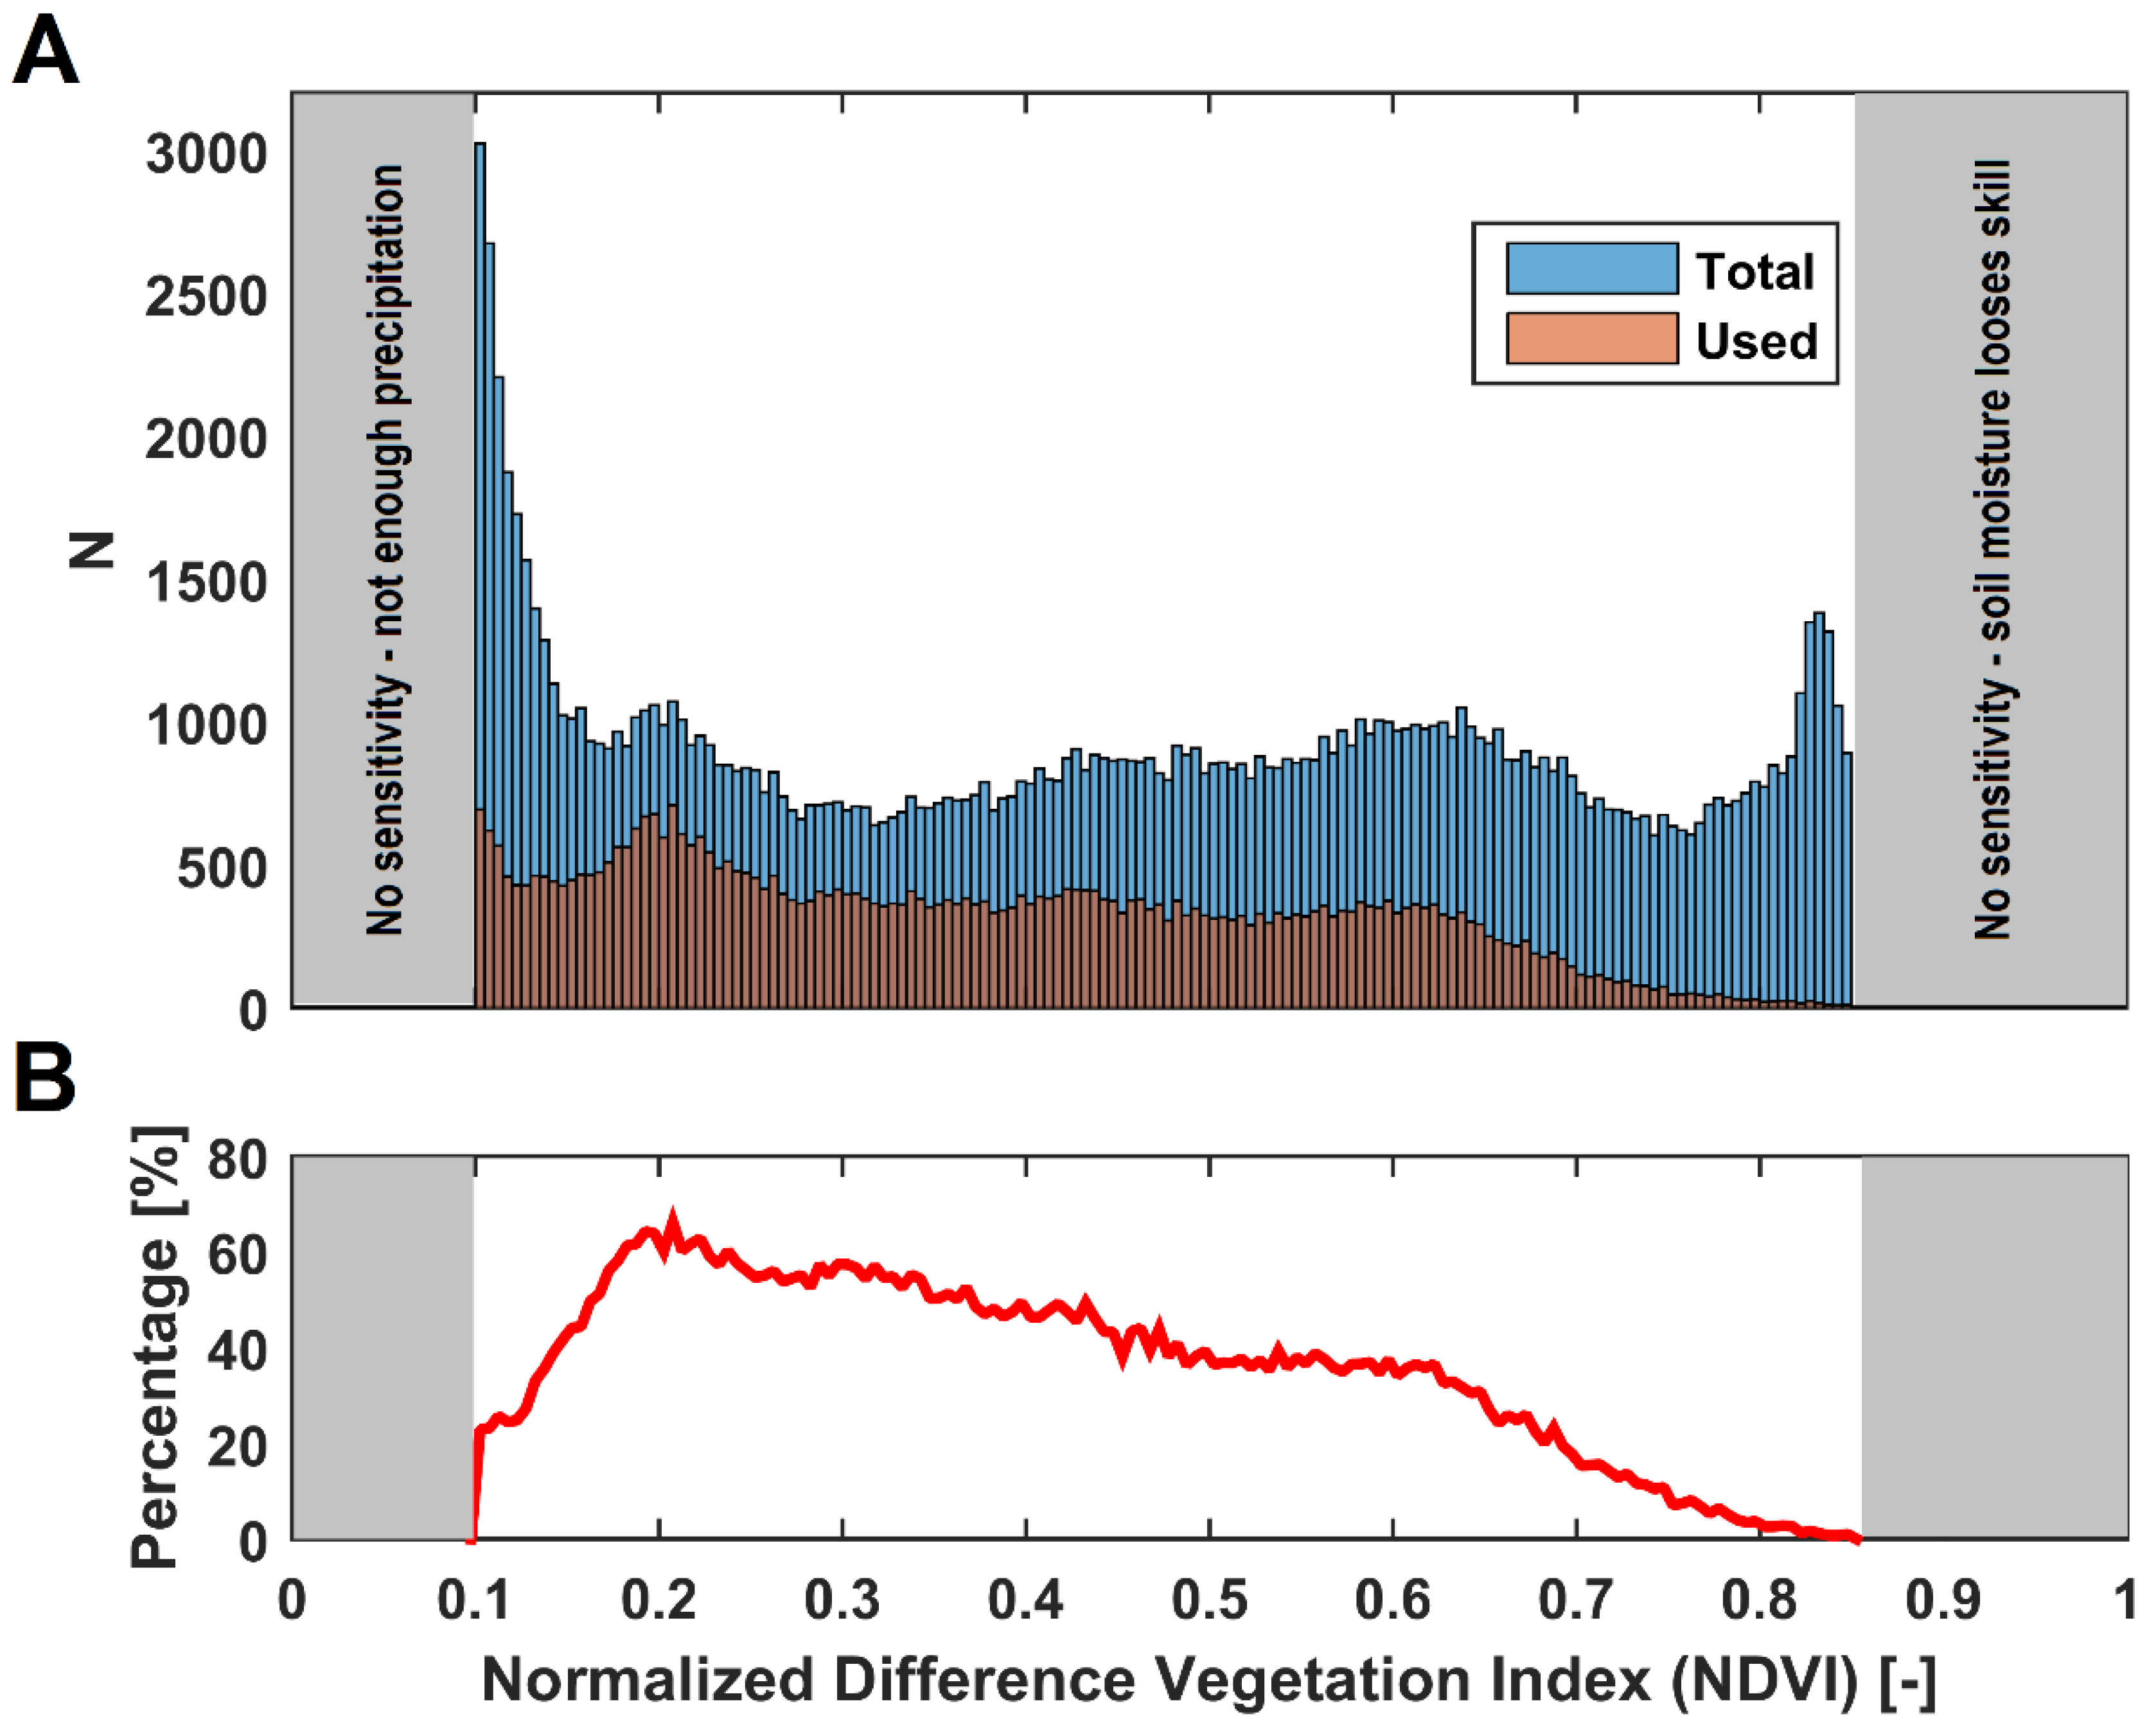
2.6. Normalized Difference Vegetation Index (NDVI)

As an indicator for the vegetation, the Normalized Difference Vegetation Index (NDVI) derived from observations by the Moderate Resolution Imaging Spectroradiometer (MODIS) was used. Figure 1 shows the global map of NDVI, including the two hotspots, as used in step 4 of the evaluation. MODIS is an instrument on board the Terra and Aqua satellites, and acquires data in 36 spectral bands, ranging from 0.4 µm to 14.4 µm. The NDVI uses infrared and visible observations that are linked to vegetation greenness, which is an indirect measurement for living vegetation and plant chlorophyll content. From MODIS, the monthly NDVI product (MODC13C2/Terra) over the period of 2012 to 2015 was downloaded, from which the overall average was taken. The original data was projected on a 0.05° grid, which was further aggregated into a global 0.25° grid to match the remotely sensed soil moisture products.

3. Methods

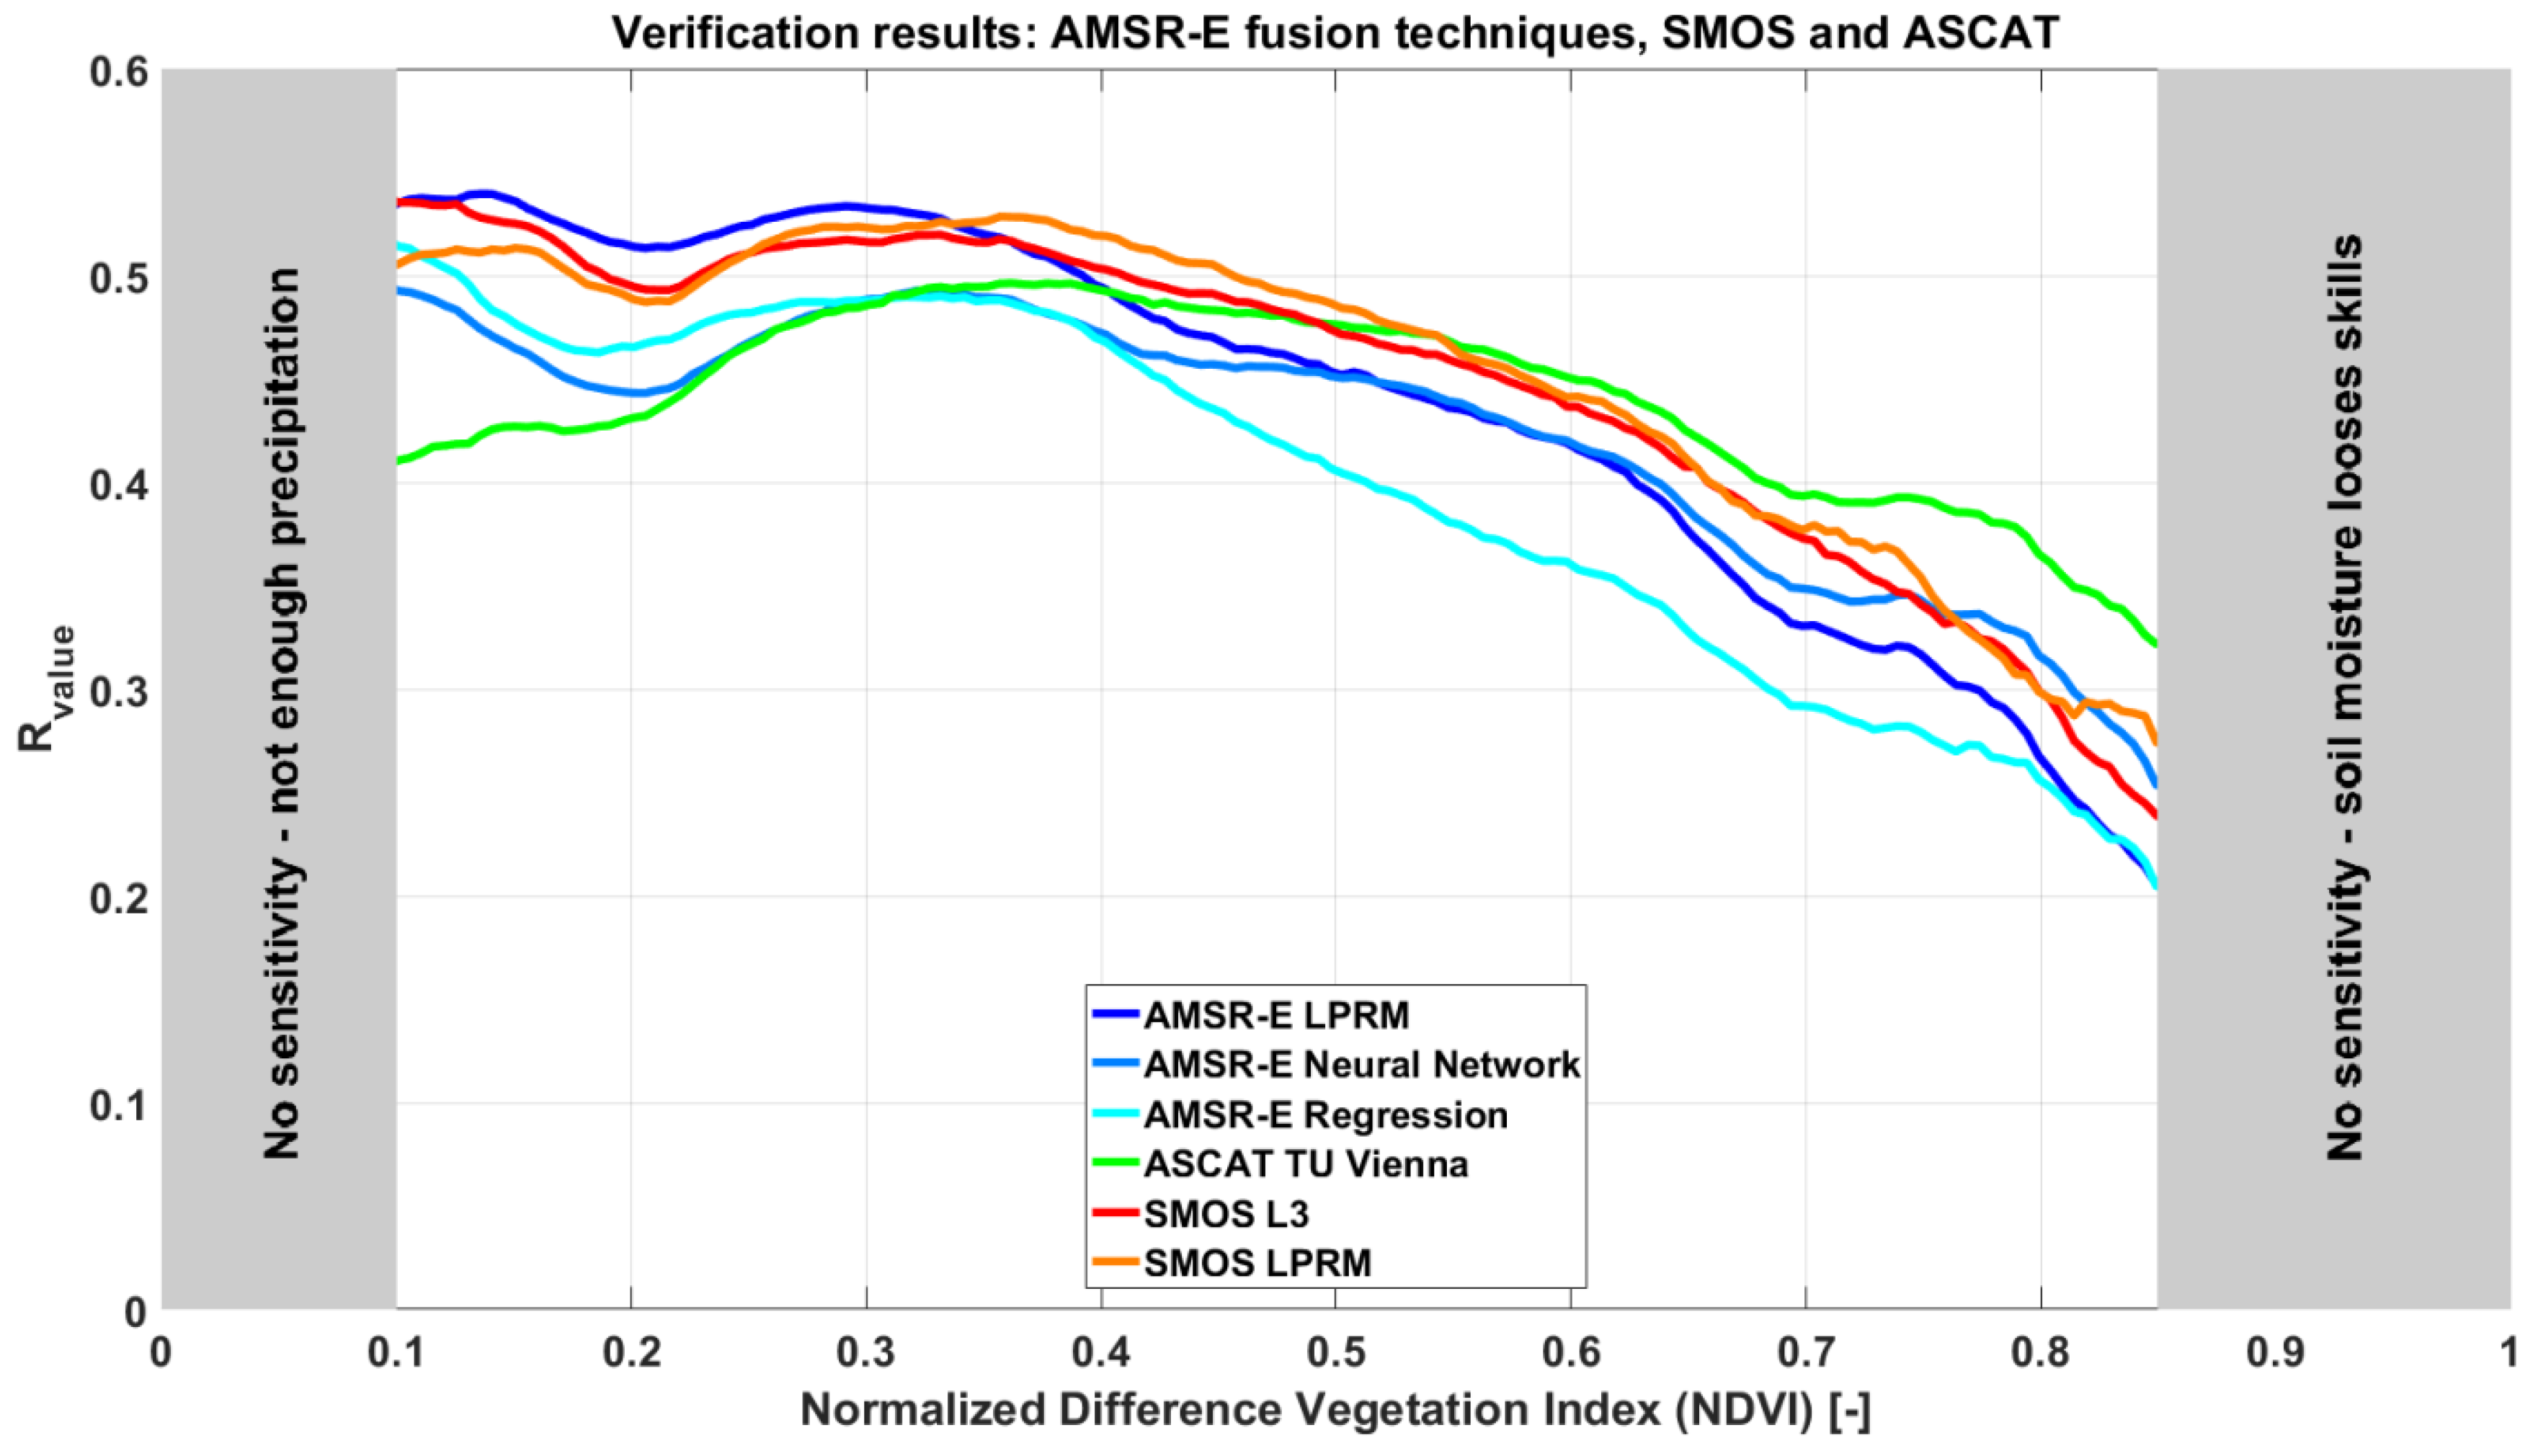
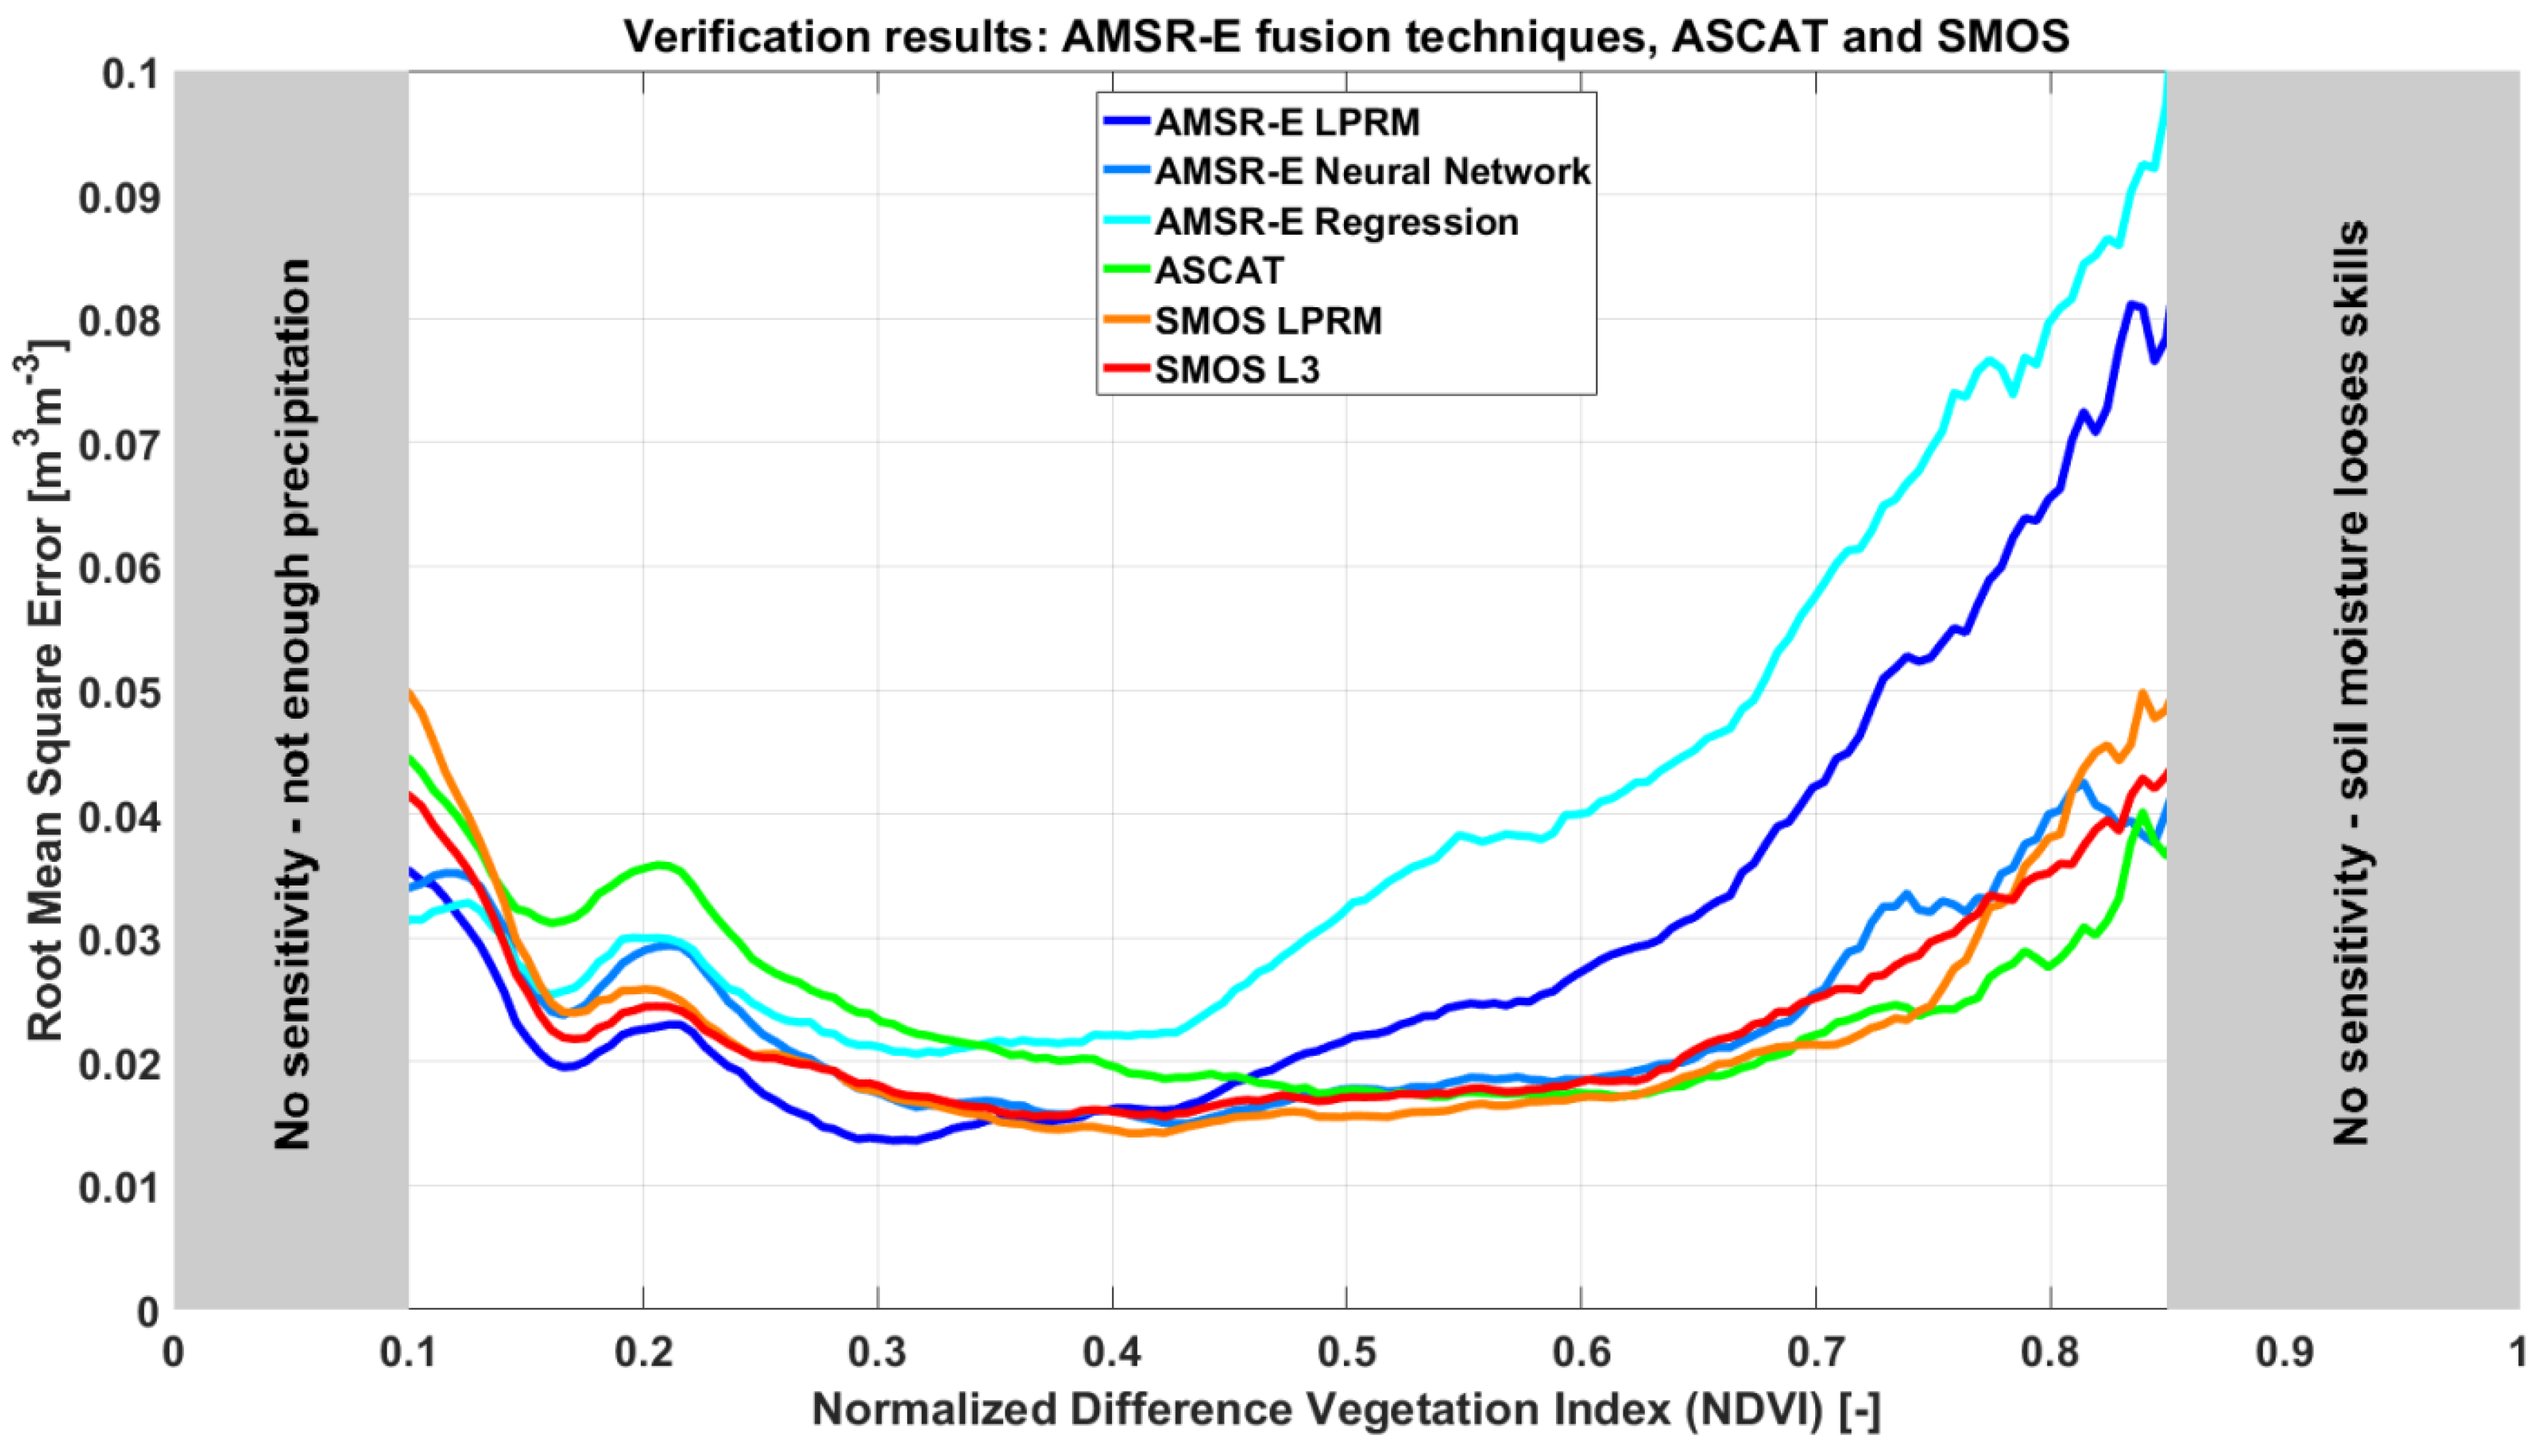
3.1. Comparison of AMSR-E and SMOS Soil Moisture

The SMOS and AMSR-E retrievals from the three data fusion approaches NN, REG and LPRM are cross-compared during the overlapping period between July 2010 and October 2011. This is done to get a better understanding of the ability of the different fusion approaches to match soil moisture retrievals from the different satellites. The Pearson correlation and unbiased root mean square difference (ubrmsd, in m3 m−3) between the AMSR-E and SMOS datasets were determined, together with their standard deviation (σ) for individual pixels and then averaged for the different NDVI bins. When running statistics for the Pearson correlation, the Fisher z-transformation is applied. These analyses were done over the range of 50°N–50°S to keep the same coverage as for the TRMM precipitation dataset as used in the Rvalue evaluation. The ubrmsd was chosen over rmsd, since two of the datasets have either linearly scaled or trained the data on a point to point base (i.e., LPRM and REG), which automatically minimizes the bias. Pixels with less than 30 overlapping points were excluded from the analysis.

3.2. Precipitation-Based Data Assimilation Technique

The Rvalue data assimilation technique is based on the connection between precipitation and the subsequent changes in soil moisture. The technique uses the contrasting quality of two separate precipitation datasets to evaluate the degree to which analysis increments, derived via the sequential assimilation of soil moisture into a simple water balance model, accurately compensate for known rainfall errors [35,36,59]. More specifically, soil moisture anomalies derived from satellite observations are assimilated into an antecedent precipitation index (API), which is based on the low quality precipitation dataset, using a Kalman filter. The anomaly analysis increments produced in this process can then directly be compared to the rainfall anomaly difference between the high and low quality precipitation datasets, which is expressed as the Rvalue and based on the Pearson’s correlation. Values between 0 and 0.7 are typical for the Rvalue technique, however they should be seen as a relative performance metric (e.g., for comparing multiple soil moisture datasets) as the value depends on the quality of the two precipitation datasets.
The Rvalue technique was adapted to run on an anomaly basis and validated as a robust method to determine the temporal performance of satellite soil moisture retrievals by Crow et al. [35], to which we refer for the complete mathematical framework of the technique as used in this study. One modification was introduced following Parinussa et al. [45,60], who applied an artificial deterioration to the gauge-corrected TRMM 3B42 precipitation product in order to create the low quality precipitation dataset, instead of relying on the near-real-time (3B40RT) precipitation product. This is advantageous for the Rvalue technique as it creates a contrast between the two precipitation datasets that is uniform in space. More information on how the artificial noise is applied can be found in Crow et al. [61].
There are well-known limitations [35,36,45,60] to the precipitation-based Rvalue verification technique over extremely arid climate regimes, as this technique requires a sufficient number of precipitation events. This requirement cannot be met under extremely arid conditions, as indicated in Figure 2, Figure 3 and Figure 4 by “No sensitivity—not enough precipitation”. In line with this limitation of the Rvalue technique is the well-known limitation of remotely sensed soil moisture under dense vegetation canopies, as the emission from the soil (moisture) becomes entirely blocked by the overlying vegetation. This limitation in regions with a very dense vegetation cover was indicated in Figure 2, Figure 3 and Figure 4 by “No sensitivity—soil moisture loses skills”.
Although the exact same spatial cover is taken for all different soil moisture datasets, due to the short overlap time the temporal coverage differs for the SMOS and AMSR-E datasets. By taking multiple years (2007–2011 for AMSR-E, 2010–2015 for SMOS and 2007–2015 for ASCAT) over a large spatial cover, the impact of using different time periods is expected to be minimal for the Rvalue results. For datasets that used the same sensor, only the mutual observations in both space and time were used.

3.3. Triple Collocation Analysis (TCA)

The triple collocation analysis (TCA) is a statistical verification technique that has been commonly used for the validation of remotely sensed soil moisture anomalies [24,26,37,39,45]. The TCA estimates the root mean square error (rmse) of the random error component of the actual estimate based on three linearly related (soil moisture) datasets that have independent error structures. Results from the TCA were validated against ground observations [41], while Dorigo et al. [24] demonstrated that rmse estimates are only marginally influenced by the choice of the third product (generally surface soil moisture from a reanalysis model). The conventional product combination in large scale surface soil moisture evaluation studies is soil moisture from an active and passive microwave source, complemented with the top layer of a reanalysis model. In our case, the active microwave source was chosen to be the ASCAT soil moisture (see Section 2.3), the reanalysis model was MERRA-Land (see Section 2.4) while the passive microwave source was swapped to include the various soil moisture products retrieved from SMOS and AMSR-E observations. Within this study, we follow the conventional TCA that is extensively documented in the literature [24,36,37,45,55,60,62]. Of specific relevance for the Triple Collocation analysis is the number of collocated samples that was set to at least 100, which is a relatively standard number that was adopted from Stoffelen [37] and Parinussa et al. [36]. Additionally, since true soil moisture conditions are unknown, MERRA-Land soil moisture was selected as the reference product. This will not affect subsequent manuscript conclusions regarding the relative performance of all passive microwave products and the product combinations, but only affects the value range and units in which the rmse is expressed. Triple Collocation produces an error metrics hence higher numbers indicate a lower quality, this in contrast with Rvalue, which is a performance metric.

3.4. Results over the Regions with Strong Land–Atmosphere Coupling

In the final part, the focus is on two major areas that have been recognized as areas with a strong land–atmosphere coupling in the Global Land–Atmosphere Coupling Experiment (GLACE) [40], which are the Sahel and the central Great Plains of North America. In the GLACE experiment, twelve different atmospheric general circulation models are evaluated over the boreal summer (June to August) to define common areas with strong coupling in the different models. Two other major areas, India and Eastern China, were not further considered in this study due to severe RFI issues in SMOS (e.g., [63]). The areas identified in the GLACE study are mostly characterized by falling in a transition zone between humid and arid climates. In order to affect large atmospheric processes, two requirements need to be met, first the evapotranspiration must be sensitive to soil moisture, and secondly, there must be a high temporal variability in evapotranspiration [40]. For very arid climates, this is not met as in general not enough soil moisture is available to affect large scale atmospheric processes, while for humid areas there is almost always sufficient soil moisture available for evapotranspiration. The transition zones however, do meet these two requirements. This arid to humid pattern is also reflected in the vegetation cover (Figure 1), as arid climates are mostly covered by sparse vegetation, which increases to dense tropical rainforests in the humid regions. In this evaluation, both the TCA and Rvalue results are compared and visualized over these regions.

4. Results and Discussion

4.1. Comparison AMSR-E and SMOS Soil Moisture

Figure 2 shows the results for the comparison of the three fusion approaches, i.e., for AMSR-E LPRM against SMOS LPRM (LPRM), AMSR-E NN against SMOS L3 (NN) and AMSR-E REG against SMOS L3 (REG). Figure 2A presents the correlations versus the average annual NDVI. NN gives the highest correlations between SMOS and AMSR-E soil moisture with temporal correlation coefficients above 0.7 for NDVI values under 0.7. The other two fusion datasets (LPRM and REG) reveal slightly lower correlations, but very similar to each other, having temporal correlation coefficients above 0.7 for NDVI values close to 0.6. REG shows higher correlations than LPRM for very low (<0.15) values, while LPRM has slightly higher correlations between an NDVI of 0.15 and 0.6. The difference between NN and the other two approaches increases with increasing vegetation. When looking at the σ of the correlation, Figure 2B, a clear opposite trend was demonstrated. The σ of the correlation shows a low variability when the mean correlation is high, and when the mean correlation decreased (e.g., with denser vegetation), the variation in correlation increases.
A glance at Figure 2C, which shows the ubrmsd between the AMSR-E and SMOS soil moisture products, reveals a slightly different outcome than the temporal correlation coefficients. Here, the variation of the ubrmsd over different vegetation regimes is quite similar for all three approaches. NN and REG have the lowest ubrmsd up to an NDVI of 0.2. Then all three approaches have similar ubrmsd for the NDVI range between 0.2 and 0.4. Over the more densely vegetation areas (NDVI > 0.4), LPRM and NN give the lowest ubrmsd. Differences however are very small, with an ubrmsd between 0.02 and 0.04 m3 m−3 for NDVI values below 0.6. The σ of the ubrmsd, as seen in Figure 2D, reveals a similar behavior as for the mean ubrmsd, it steadily increases with denser vegetation up to an NDVI of 0.65, with values ranging between 0.005 and 0.020.
These results show that the soil moisture products derived from SMOS and AMSR-E have similar dynamics over the low and moderately vegetated areas (e.g., between the NDVI regime of 0.15 and 0.6) for all three fusion approaches. The low spatial variability as shown with the σ for both r and ubrmse is a good indicator that the fusion approaches are generally applicable in these NDVI regimes. For the sparse (i.e., NDVI < 0.15) and densely vegetated regions (NDVI > 0.6) the soil moisture retrievals from the different satellite sensors show a reduced consistency with more spatial variability. Between the three different approaches, NN is best able to match soil moisture derived from the two satellite sensors when taking into account both the r and the ubrmse, especially during dense vegetation conditions. LPRM and REG follow closely, with REG performing closest to NN during NDVI conditions below 0.15, and LPRM thereafter.
With regard to the general match between AMSR-E and SMOS, these results align with earlier studies by Al-Yaari et al. [64], Holgate et al. [65], and Van der Schalie et al. [27]. From a theoretical point of view, C-band has a stronger vegetation attenuation than L-band, which is expected to lead to a lower consistency over more vegetated regions due to a stronger decrease in C-band performance compared to L-band. For the sparse vegetated areas the lower correlations can be related to both increased differences in sensing depth and a high noise to signal ratio caused by little temporal variation in soil moisture over time, reducing correlations while still reaching low ubrmsd values. These findings are in line with a study by Wigneron et al. [66], where it was discussed that both the sensitivity to soil moisture over bare soils and key parameterization (e.g., roughness) varies much less between the different frequencies than previously thought. This reduced consistency however, should be taken in consideration when analyzing data records covering both satellite periods, for example when performing long term trend analysis (e.g., [67]). For such applications the data should be sufficiently tested on inhomogeneities (e.g., [68]). From the two approaches that directly train the AMSR-E brightness temperatures to best match the SMOS L3 dataset, the global NN is better able to match SMOS L3 than the pixel-based REG approach, benefitting from a more complex training method that seems to be better able to account for frequency dependent differences like the vegetation attenuation. The physically based LPRM approach is able to perform in between the two direct training methods, while only optimizing for the vegetation and soil roughness parameter in the model, making AMSR-E LPRM less dependent on SMOS LPRM. The NN results however, show that there is a possibility that LPRM does not yet optimally account for the vegetation influences during dense vegetation conditions.
Figure 3 shows the distribution of sample sizes (N) that are used within the NDVI binning procedure in this study. Between an NDVI range of 0.15 and 0.65, the used points per bin are between 30% and 60% of the total possible points over our quasi-global study area. For regions with NDVI values under 0.15, still >500 points remain per bin but becomes a smaller fraction of the total, while for an NDVI > 0.65 the total used points decreases quickly. This is caused by an insufficient amount of precipitation events for the Rvalue approach (Section 3.2 and Section 4.2) in the NDVI < 0.15 region. Few retrievals over the dense forest in the SMOS LPRM dataset lead to reduced availability in the NDVI > 0.65 bins, leaving to little overlapping samples for the comparison. Over the evaluated NDVI range, pixels with RFI occurrence in either L-, C-, or X-band are removed, leading to the removal of almost all of Eurasia due to L-band RFI [63] and gaps over regions like the US and India due to C- and X-band RFI [44].

4.2. Rvalue Technique

In Figure 4 the binned results of the precipitation-based Rvalue verification technique are shown. The highest Rvalue in the NDVI domain below 0.35 is found for the AMSR-E LPRM dataset. The SMOS datasets reach the overall highest Rvalue during moderate vegetation conditions, for NDVI values between 0.35 and 0.55. When NDVI goes over 0.55, ASCAT soil moisture reaches the highest Rvalue. The results for the different AMSR-E datasets vary significantly, with AMSR-E LPRM showing the higher values for the low vegetated regions compared to AMSR-E NN and AMSR-E REG, while at high NDVI values of over 0.55 the AMSR-E NN dataset is able to sustain a higher Rvalue. AMSR-E REG has the lowest values compared to the other AMSR-E products (i.e., NN and LPRM) for NDVI > 0.35, while performing reasonable over lower NDVI values. The two SMOS products (i.e., SMOS L3 and SMOS LPRM) demonstrate a similar performance throughout. ASCAT demonstrates a slightly better performance than SMOS datasets beyond NDVI values of 0.55.
These findings demonstrate how different sensors can complement each other based on their skill in detecting soil moisture anomalies, and show the added value of SMOS L-band retrievals over moderate vegetation regimes. Although the L-band observations show better performance over more densely vegetated areas than AMSR-E, there is still a drop in skill towards denser vegetation, as seen in earlier studies on SMOS over forested regions (e.g., [69]). The results concerning the complementary nature of the different sensor are generally in line with previous studies by De Jeu et al. [22], Al-Yaari et al. [23] and Dorigo et al. [24] but provides a better indication where L-band retrievals could add value in multi-sensor soil moisture data records containing both active and higher frequency passive soil moisture retrievals. Secondly, these studies focused more on bulk statistics instead of looking at the anomaly-based skill.
While the two SMOS soil moisture datasets perform very similar, the three AMSR-E datasets based on the different fusion approaches demonstrate large differences. The lower Rvalue of AMSR-E NN and AMSR-E REG over sparsely-vegetated regions (i.e., NDVI < 0.35), compared to AMRS-E LPRM, might be explained by their fusion strategies. The NN and REG approach are bound by the training set of SMOS L3 and its performance over specific regions, where the physically based LPRM might have an advantage. Secondly, this could be caused by overtraining to match the seasonal cycles of the SMOS L3 datasets over anomaly detection. On the opposite site however, NN manages to keep a more stable performance over denser vegetation, which is most likely caused by making optimal use of the multi frequency AMSR-E input and L-band-based training dataset, while LPRM is not optimally correcting for the vegetation influences. However, even though more research is needed to fully understand the differences between the AMSR-E products and how this relates to vegetation density, it also shows the complementary nature of using different fusion approaches.

4.3. Triple Collocation Analysis (TCA)

Figure 5 shows the results of the second evaluation technique, the TCA, identically binned as for the Rvalue. It should again be noted that the Rvalue is a performance metric hence higher numbers indicate a better performance while TCA produces an error metric hence lower numbers indicate a better performance. These TCA results generally confirm the findings obtained by the Rvalue technique (Section 4.2), however, small differences were demonstrated too. AMSR-E LPRM shows the lowest rmse values within the lower NDVI range (NDVI < 0.4), then the SMOS products (i.e., SMOS L3 and SMOS LPRM) takes over and demonstrate the best performance indicated by the lowest rmse values. At more densely vegetated regions, the ASCAT soil moisture anomalies demonstrate the best performance, which is indicated by the lowest rmse. It should also be noted that for the NDVI over 0.4, the AMSR-E NN, SMOS L3, SMOS LPRM and ASCAT generally demonstrate a very similar rmse. Between the AMSR-E datasets, the switch between AMSR-E NN and AMSR-E LPRM is already found at an NDVI of 0.4 instead of 0.55 for Rvalue. While AMSR-E NN remains stable between an NDVI of 0.35 and 0.65, like the two SMOS datasets and ASCAT, both AMSR-E LPRM and AMSR-E REG start to show a clear increase in rmse close to an NDVI of 0.45.
AMSR-E-based soil moisture is again performing better over the more sparsely vegetated areas than SMOS. Al-Yaari et al. [64] also found this difference but the reason for it is still unknown. It might be due to the difference of the radiometric accuracy of AMSR-E (<1 K) versus the radiometric accuracy of SMOS (2–4 K), which could play a role over regions where vegetation attenuation has a smaller impact than the direct signal to noise ratio performance. Another plausible solution might be related to the complexity to estimate the effective temperature, Parinussa et al. [36] showed that in (semi-)arid climate regions effective temperature derived from simultaneous Ka-band observations specifically adds information compared to extracting this effective temperature input from reanalysis models, which is currently being done for both SMOS soil moisture products. Thirdly, the different sampling depth of L-band as compared to C-band, especially in (semi-)arid conditions, could lead to more complex dielectric roughness effects, which are challenging to include in the models. The use of L-band does show a solid performance over the complete NDVI range and could contribute to a multi-sensor approach throughout. From a historical point of view it is also important to note that a combination of AMSR-E and ASCAT are also able to provide such a high-quality dataset (e.g., as is implemented within the ESA-CCI-SM). Concerning the different data fusion approaches, the message is similar to that of the Rvalue evaluation. The two SMOS datasets have a comparable rmse throughout the different vegetation regimes, while for the AMSR-E datasets there is a clear difference between areas with lower NDVI where LPRM has the lowest error, and higher NDVI values where NN has the lowest error. REG shows reasonable rmse over sparsely vegetated areas but is unable to cope with denser vegetation conditions.

4.4. Results over Two Regions with a Strong Land–Atmosphere Coupling

From a climate perspective, soil moisture datasets are of high interest in regions with a strong land–atmosphere coupling. In this chapter, the focus will be put on two of the largest areas that meet the criteria for such a region. The first area covers the central Great Plains of North America, and the second the Sahel region. The results of the Rvalue and TCA for the six individual soil moisture datasets are shown in Figure 6 (the central Great Plains) and Figure 7 (the Sahel).
For the central Great Plains all datasets mainly reach Rvalue values between 0.4 and 0.7. The two SMOS datasets have comparable values and patterns, with the Rvalue hardly dropping below 0.5 and showing the highest overall values. The AMSR-E datasets do show a slight drop in skill over the Eastern areas to values of 0.4, where the vegetation density increases, but reach the highest values in the western part. When comparing the three AMSR-E sets, very similar patterns can be found, with AMSR-E LPRM giving the highest values, followed by AMSR-E REG and AMSR-E NN. ASCAT is showing high values in the central part of the Great Plains but its performance significantly drops in the Chihuahuan Desert, which is characterized by extremely arid conditions. The TCA results over the central Great Plains are shown in Figure 6G–L. Here, both the SMOS datasets show the lowest overall rmse values around 0.01 m3 m−3 for the non-forested regions in the west and around 0.025 m3 m−3 over the forested regions in the east. The influence of the vegetation change on rmse can be seen in both AMSR-E and SMOS datasets, with AMSR-E significantly increasing to values over 0.04 m3 m−3 in the forested areas. Between the AMSR-E datasets, the AMSR-E NN dataset has the lowest overall rmse, followed by AMSR-E LPRM and to a lesser extent AMSR-E REG. ASCAT demonstrates rmse values between 0.02 and 0.03 m3 m−3, slightly lower to the west and higher to the east. For the TCA, results were masked over the Chihuahuan Desert (Figure 6G–L), as the TCA as it does not meet the standard TCA requirements over that area [38].
The second area that was analyzed in more detail is the Sahel region, of which the results of the Rvalue and TCA are shown in Figure 7. In the Rvalue results, a clear split can be seen between the northwestern and southeastern part of the region. The highest values for the northwestern part are found for the AMSR-E LPRM dataset, reaching high Rvalue of >0.5 for the complete area, this is followed by AMSR-E REG, AMSR-E NN, SMOS L3 and SMOS LPRM, which keep values of >0.4 for the whole region, and finally ASCAT, which has the lowest values over this semi-arid region. In the southeastern part, covered with denser vegetation, the highest Rvalue are found for the SMOS L3 dataset, still reaching values beyond 0.4 in many cases. This is followed by SMOS LPRM, ASCAT, AMSR-E NN, AMSR-E LPRM and low values <0.2 are found for AMSR-E REG. The results from TCA over the Sahel are less clear. Here four datasets showing a good performance with mainly rmse < 0.025 m3 m−3, which are the ASCAT, SMOS L3, SMOS LPRM and AMSR-E NN. The AMSR-E LPRM and AMSR-E REG show several areas where the rmse is higher than 0.04 m3 m−3. In the southern part this reflects the area with denser vegetation and is in line with what was seen in the Rvalue patterns; however, in the more northern parts, where AMSR-E LPRM and AMSR-REG show the highest Rvalue, several of those areas also appear as highest rmse in the TCA.
The findings over the Sahel and central Great Plains reflect the results from the earlier sections in this study. The AMSR-E datasets, especially AMSR-E LPRM, are able to provide high-quality soil moisture datasets over the low to moderate vegetated areas and both SMOS datasets are extending the quality more towards moderate to densely vegetated areas, while ASCAT shows a reasonable performance over the whole range, being less affected by vegetation variations, but with the exception of the dry/semi-arid areas. These findings are in line with an earlier study over the Continental United States [55] that also used the TCA, verified through ground-based soil moisture observations. The good performance of remotely sensed soil moisture over the Sahel was also shown by Rodriguez-Fernandez et al. [26], where they outperformed modeled data over this region.
Although globally showing similar results, it is important to note that there are differences between the two verification techniques when looking at the spatial images. Over the northern part of the Sahel this can be seen when comparing the results of the AMSR-E LPRM and AMSR-E REG datasets, the Rvalue technique shows the best performance for these datasets, while the rmse from the TCA goes up unnaturally high. The opposite is seen for ASCAT, which might be an indication that it is an artifact introduced by the TCA. In studies by Pellarin et al. [70,71], AMSR-E observations were used to improve precipitation estimates over the Sahel region, and especially showed to be effective in the northern regions with sparse vegetation. The AMSR-E Rvalue results over the Sahel (Figure 7A–C) show a similar spatial pattern in the results. This is an indication that the verification of soil moisture data should never be based on a single evaluation technique that is used as the truth. However, these results provide an indication of the added value satellite soil moisture has in climate applications over regions with strong land–atmosphere interactions (e.g., [72]).

5. Conclusions

As the availability of consistent long-term soil moisture records is of increased importance to climate researchers, this study evaluates the quality of three different fusion approaches that combine soil moisture retrievals from multiple satellite sensors. The development of these approaches primarily focused on matching soil moisture retrievals based on AMSR-E and SMOS observations, emphasizing the need to improve our understanding of L-band-based soil moisture concerning its integration in long-term data records. The three approaches that were evaluated differ in the way that (1) is based on applying a global neural network to retrieve SMOS L3 like soil moisture from AMSR-E observations (NN); (2) is based on applying local regressions to AMSR-E observations to best match SMOS L3 soil moisture (REG); and (3) applies the physically based Land Parameter Retrieval Model to SMOS observations and updates its parameterization for improved AMSR-E-based retrievals (LPRM).
First, a global comparison exercise was done to quantify the consistency between the SMOS and AMSR-E-based soil moisture retrievals in terms of correlation and ubrmsd, i.e., for AMSR-E LPRM against SMOS LPRM (LPRM), AMSR-E NN against SMOS L3 (NN) and AMSR-E REG against SMOS L3 (REG). When evaluating the correlations, the NN approach reaches the highest values over the complete vegetation range, having average correlations of over 0.7 up to an NDVI of 0.7, which is higher than the REG and LPRM approaches, which drop below that point at an NDVI of 0.6. The ubrmsd shows an increasing trend with denser vegetation, from 0.02 m3 m−3 up to 0.05 m3 m−3, and varies little between the three methods. This shows that AMSR-E and SMOS register similar behavior in soil moisture over the low and moderately vegetated areas.
Secondly the quality of the individual datasets to detect soil moisture was evaluated using two different evaluation techniques, the precipitation-based Rvalue technique and the Triple Collocation Analysis (TCA), including ASCAT to cover the active counterpart of satellite-based soil moisture retrievals. The results from the Rvalue technique show the strength of using the three different data sources. AMSR-E LPRM soil moisture performed best over areas with an NDVI of up to 0.35, the SMOS datasets perform bester over areas with an NDVI between 0.35 and 0.55, and a ASCAT shows the highest performance. This combination of sources manages to keep high Rvalue between 0.55 and 0.4 up to an NDVI of 0.75, slowly decreasing with vegetation density. The TCA shows many similarities to the results as found from applying the Rvalue technique, keeping a low rmse in areas up to an NDVI of 0.80. Again AMSR-E LPRM shows the best performance, i.e., lowest rmse, in sparsely vegetated areas. After that, several datasets show a similar level of performance, primarily AMSR-E NN, SMOS LPRM, SMOS L3 and ASCAT. While the two SMOS datasets, i.e., L3 and LPRM, perform very similar throughout the analysis, the three AMSR-E datasets demonstrate structural differences. AMSR-E LPRM benefits from the physical model over regions with low to moderate vegetation, showing the highest overall performance. AMSR-E NN has the advantage in areas with moderate to dense vegetation, presumably caused by the use of multiple frequencies from AMSR-E and the training to L-band observations, which are less affected by vegetation attenuation. AMSR-E REG performs reasonably well over sparse vegetation, but is unable to properly account for denser vegetation.
In the last section two specific regions with land–atmosphere coupling, the Sahel and the central Great Plains of North America, were evaluated in more detail. The findings here mainly reflect results that are found in earlier sections. When looking at both the Rvalue and TCA results, the soil moisture retrievals derived from AMSR-E observations are able to perform best over more sparsely vegetated areas, SMOS shows a good performance over the whole range of NDVI, and ASCAT showing similar results as SMOS in the regions with denser (e.g., NDVI > 0.5) vegetation. It should be stressed, however, as some unnatural results can be seen in the TCA results over the Sahel, that soil moisture evaluations should preferably be done using multiple verification techniques.
The currently available satellite-based soil moisture datasets, based on both passive (e.g., AMSR-E and SMOS) and active microwave observations (e.g., ASCAT), are able to provide a valuable source of information over a wide range of vegetation regimes when combined in an optimal way. The contribution of L-band-based soil moisture retrievals can mainly be found over moderate vegetated areas, but future studies could focus on increasing the spatial consistency in soil moisture records by using L-band measurements for scaling purposes, as it has a stable performance over a broad range of NDVI values. Secondly, as the NN approach showed the highest skill in the comparison, the possibility of using this approach to improve the consistency in long-term soil moisture records can be further investigated. In order to improve consistency, this should be combined with more advanced merging strategies that use multiple satellites and retrieval methods, as this study shows that no single sensor or retrieval algorithm outperforms all the others.

Acknowledgments

This project was supported by the ESA project “Passive Microwave Soil Moisture Data Fusion Study” (Contract # 4000110112). Further funding was provided under ESA’s Climate Change Initiative Program “Phase 2 of the ESA Climate Change Initiative—Soil Moisture ECV”, contract no. 4000112226/14/I-NB).

Author Contributions

Robin van der Schalie and Richard de Jeu designed this study, performed the main analysis, led the writing of the paper and prepared the LPRM based datasets. Nemesio Rodríguez-Fernández and Yann Kerr prepared the NN and SMOS datasets and contributed to the writing and revising of the manuscript. Amen Al-Yaari and Yann Kerr prepared the REG dataset and contributed to the writing and revising of the manuscript. Robert Parinussa was mainly involved in the statistical analysis concerning the Triple Collocation and Rvalue technique, including the figures and related textual sections. Matthias Drusch provided support in the “Passive Microwave Soil Moisture Data Fusion Study” project and main direction of the study.

Conflicts of Interest

The authors declare no conflict of interest.

References

  1. Dorigo, W.A.; Chung, D.; Gruber, A.; Hahn, S.; Mistelbauer, T.; Parinussa, R.M.; Paulik, C.; Reimer, C.; Van der Schalie, R.; de Jeu, R.A.M.; et al. Soil Moisture in “State of the Climate in 2015”. Bull. Am. Meteorol. Soc. 2016, 97, S31–S32. [Google Scholar] [CrossRef]
  2. Global Climate Observing System. Implementation Plan for the Global Observing System for Climate in Support of the UNFCCC—August 2010. GCOS-138 (GOOS-184, GTOS-76, WMO-TD/No. 1523). Available online: http://jcomm.info/components/com_oe/oe.php?task=download&id=10710&version=1.0&lang=1&format=1 (accessed on 11 January 2018).
  3. Dorigo, W.A.; Wagner, W.; Hohensinn, R.; Hahn, S.; Paulik, C.; Xaver, A.; Gruber, A.; Drusch, M.; Mecklenburg, S.; van Oevelen, P.; et al. The International Soil Moisture Network: A data hosting facility for global in situ soil moisture measurements. Hydrol. Earth Syst. Sci. 2011, 15, 1675–1698. [Google Scholar] [CrossRef]
  4. Dorigo, W.A.; Xaver, A.; Vreugdenhil, M.; Gruber, A.; Hegyiová, A.; Sanchis-Dufau, A.D.; Zamojski, D.; Cordes, C.; Wagner, W.; Drusch, M. Global Automated Quality Control of In situ Soil Moisture data from the International Soil Moisture Network. Vadose Zone J. 2013, 12. [Google Scholar] [CrossRef]
  5. Schmugge, T.J.; Gloersen, P.; Wilheit, T.; Geiger, F. Remote Sensing of Soil Moisture with Microwave Radiometers. J. Geophys. Res. 1974, 79, 317–323. [Google Scholar] [CrossRef]
  6. Owe, M.; de Jeu, R.; Walker, J. A methodology for surface soil moisture and vegetation optical depth retrieval using the microwave polarization difference index. IEEE Trans. Geosci. Remote Sens. 2001, 39, 1643–1654. [Google Scholar] [CrossRef]
  7. Wagner, W.; Lemoine, G.; Rott, H. A Method for Estimating Soil Moisture from ERS Scatterometer and Soil Data. Remote Sens. Environ. 1999, 70, 191–207. [Google Scholar] [CrossRef]
  8. Wigneron, J.P.; Chanzy, A.; Calvet, J.C.; Bruguier, N. A simple algorithm to retrieve soil moisture and vegetation biomass using passive microwave measurements over crop fields. Remote Sens. Environ. 1995, 51, 331–341. [Google Scholar] [CrossRef]
  9. Njoku, E.G.; Jackson, T.J.; Lakshmi, V.; Chan, T.K.; Nghiem, S.V. Soil moisture retrieval from AMSR-E. IEEE Trans. Geosci. Remote Sens. 2003, 41, 215–229. [Google Scholar] [CrossRef]
  10. Jackson, T.J. Measuring surface soil moisture using passive microwave remote sensing. Hydrol. Process. 1993, 7, 139–152. [Google Scholar] [CrossRef]
  11. Mladenova, I.E.; Jackson, T.J.; Njoku, E.; Bindlish, R.; Chan, S.; Cosh, M.H.; Holmes, T.R.H.; De Jeu, R.A.M.; Jones, L.; Kimball, J.; et al. Remote monitoring of soil moisture using passive microwave-based—Theoretical basis and overview of selected algorithms for AMSR-E. Remote Sens. Environ. 2014, 144, 197–213. [Google Scholar] [CrossRef]
  12. Kerr, Y.H.; Waldteufel, P.; Wigneron, J.P.; Delwart, S.; Cabot, F.; Boutin, J.; Escorihuela, M.J.; Font, J.; Reul, N.; Gruhier, C.; et al. The SMOS mission: New tool for monitoring key elements of the global water cycle. Proc. IEEE 2010, 98. [Google Scholar] [CrossRef] [Green Version]
  13. Entekhabi, D.; Njoku, E.G.; O’Neill, P.E.; Kellogg, K.H.; Crow, W.T.; Edelstein, W.N.; Entin, J.K.; Goodman, S.D.; Jackson, T.J.; Johnson, J.; et al. The Soil Moisture Active Passive (SMAP) Mission. Proc. IEEE 2010, 98, 704–716. [Google Scholar] [CrossRef]
  14. Wigneron, J.-P.; Calvet, J.-C.; De Rosnay, P.; Kerr, Y.; Waldteufel, P.; Saleh, K.; Escorihuela, M.J.; Kruszewski, A. Soil Moisture Retrievals from Bi-Angular L-band Passive Microwave Observations. IEEE Geosci. Remote Sens. Lett. 2004, 1, 277–281. [Google Scholar] [CrossRef]
  15. Kerr, Y.H.; Waldteufel, P.; Richaume, P.; Wigneron, J.P.; Ferrazzoli, P.; Mahmoodi, A.; Al Bitar, A.; Cabot, F.; Gruhier, C.; Enache Juglea, S.; et al. The SMOS Soil Moisture Retrieval Model. IEEE Trans. Geosci. Remote Sens. 2012, 50. [Google Scholar] [CrossRef]
  16. Konings, A.G.; Piles, M.; Rötzer, K.; McColl, K.A.; Chan, S.K.; Entekhabi, D. Vegetation optical depth and scattering albedo retrieval using time series of dual-polarized L-band radiometer observations. Remote Sens. Environ. 2016, 172, 178–189. [Google Scholar] [CrossRef]
  17. Van der Schalie, R.; Kerr, Y.H.; Wigneron, J.P.; Rodriguez-Fernandez, N.J.; Al-Yaari, A.; De Jeu, R.A.M. Global SMOS Soil Moisture Retrievals from The Land Parameter Retrieval Model. Int. J. Appl. Earth Obs. Geoinf. 2016. [Google Scholar] [CrossRef]
  18. Dorigo, W.; Wagner, W.; Albergel, C.; Albrecht, F.; Balsamo, G.; Brocca, L.; Chung, D.; Ertl, M.; Forkel, M.; Gruber, A.; et al. ESA CCI Soil Moisture for improved Earth system understanding: State-of-the art and future directions. Remote Sens. Environ. 2017. [Google Scholar] [CrossRef]
  19. Liu, Y.Y.; Dorigo, W.A.; Parinussa, R.M.; De Jeu, R.A.M.; Wagner, W.; McCabe, M.F.; Evans, J.P.; Van Dijk, A.I.J.M. Trend-preserving blending of passive and active microwave soil moisture retrievals. Remote Sens. Environ. 2012, 123, 280–297. [Google Scholar] [CrossRef]
  20. Liu, Y.Y.; Parinussa, R.M.; Dorigo, W.A.; De Jeu, R.A.M.; Wagner, W.; Van Dijk, A.I.J.M.; McCabe, M.F.; Evans, J.P. Developing an improved soil moisture dataset by blending passive and active microwave satellite-based retrievals. Hydrol. Earth Syst. Sci. 2011, 15, 425–436. [Google Scholar] [CrossRef] [Green Version]
  21. Chung, D.; Dorigo, W.; Hahn, S.; Melzer, T.; Paulik, C.; Reimer, C.; Vreugdenhil, M.; Wagner, W.; Kidd, R. Algorithm Theoretical Baseline Document (ATBD). D2.1 Version 03.2. Merging Active and Passive Soil Moisture Retrievals. ESA Climate Change Initiative Phase II. Soil Moisture, Site. 2016. Available online: http://www.esa-soilmoisture-cci.org/ (accessed on 11 January 2018).
  22. De Jeu, R.A.M.; Wagner, W.; Holmes, T.R.H.; Dolman, A.J.; Van De Giesen, N.C.; Friesen, J. Global Soil Moisture Patterns Observed by Space Borne Microwave Radiometers and Scatterometers. Surv. Geophys. 2008, 29. [Google Scholar] [CrossRef] [Green Version]
  23. Al-Yaari, A.; Wigneron, J.P.; Ducharne, A.; Kerr, Y.H.; Wagner, W.; De Lannoy, G.; Reichle, R.; Al Bitar, A.; Dorigo, W.; Richaume, P.; et al. Global-scale comparison of passive (SMOS) and active (ASCAT) satellite based microwave soil moisture retrievals with soil moisture simulations (MERRA-Land). Remote Sens. Environ. 2014, 152, 614–626. [Google Scholar] [CrossRef] [Green Version]
  24. Dorigo, W.A.; Scipal, K.; Parinussa, R.M.; Liu, Y.Y.; Wagner, W.; De Jeu, R.A.M.; Naeimi, V. Error characterisation of global active and passive microwave soil moisture datasets. Hydrol. Earth Syst. Sci. 2010, 14, 2605–2616. [Google Scholar] [CrossRef] [Green Version]
  25. Al-Yaari, A.; Wigneron, J.P.; Kerr, Y.; De Jeu, R.A.M.; Rodriguez-Fernandez, N.; Van der Schalie, R.; Al Bitar, A.; Mialon, A.; Richaume, P.; et al. Testing regression equations to derive long-term global soil moisture datasets from passive microwave observations. Remote Sens. Environ. 2015, 180, 453–464. [Google Scholar] [CrossRef]
  26. Rodriguez-Fernandez, N.J.; Kerr, Y.H.; Van der Schalie, R.; Al-Yaari, A.; De Jeu, R.A.M.; Richaume, P.; Dutra, E.; Mialon, A.; Wigneron, J.-P.; Drusch, M. Long term global surface soil moisture fields using a SMOS trained neural network applied to AMSR-E data. Remote Sens. 2016, 8, 959. [Google Scholar] [CrossRef]
  27. Van der Schalie, R.; De Jeu, R.A.M.; Kerr, Y.H.; Wigneron, J.-P.; Rodriguez-Fernandez, N.J.; Al-Yaari, A.; Parinussa, R.M.; Mecklenburg, S.; Drusch, M. The merging of radiative transfer based surface soil moisture data from SMOS and AMSR-E. Remote Sens. Environ. 2017, 189. [Google Scholar] [CrossRef]
  28. Rodriguez-Fernandez, N.J.; Aires, F.; Richaume, P.; Kerr, Y.H.; Prigent, C.; Kolassa, J.; Cabot, F.; Jiménez, C.; Mahmoodi, A.; Drusch, M. Soil moisture retrieval using neural networks: Application to SMOS. IEEE Trans. Geosci. Remote Sens. 2015, 53, 5991–6007. [Google Scholar] [CrossRef]
  29. Owe, M.; De Jeu, R.A.M.; Holmes, T.R.H. Multi-Sensor Historical Climatology of Satellite-Derived Global Land Surface Moisture. J. Geophys. Res. 2008, 113. [Google Scholar] [CrossRef]
  30. Van der Schalie, R.; Parinussa, R.M.; Renzullo, L.J.; Van Dijk, A.I.J.M.; Su, C.-H.; De Jeu, R.A.M. SMOS Soil Moisture Retrievals using the Land Parameter Retrieval Model: Evaluation over the Murrumbidgee Catchment, southeast Australia. Remote Sens. Environ. 2015, 163, 70–79. [Google Scholar] [CrossRef]
  31. Naeimi, V.; Scipal, K.; Bartalis, Z.; Hasenauer, S.; Wagner, W. An improved soil moisture retrieval algorithm for ERS and METOP scatterometer observations. IEEE Trans. Geosci. Remote Sens. 2009, 47, 1999–2013. [Google Scholar] [CrossRef]
  32. Reichle, R.H.; Koster, R.D.; De Lannoy, G.J.M.; Forman, B.A.; Liu, Q.; Mahanama, S.P.P.; Touré, A. Assessment and Enhancement of the MERRA Land Surface Hydrology Estimates. J. Clim. 2011, 24, 6322–6338. [Google Scholar] [CrossRef]
  33. Balsamo, G.; Albergel, C.; Beljaars, A.; Boussetta, S.; Brun, E.; Cloke, H.; Dee, D.; Dutra, E.; Muñoz-Sabater, J.; Pappenberger, F.; et al. ERA-Interim/Land: A global land surface reanalysis dataset. Hydrol. Earth Syst. Sci. 2015, 19, 389–407. [Google Scholar] [CrossRef]
  34. Crow, W.T.; Koster, R.D.; Reichle, R.H.; Sharif, H. Relevance of time-varying and time-invariant retrieval error sources on the utility of spaceborne soil moisture products. Geophys. Res. Lett. 2005, 32. [Google Scholar] [CrossRef]
  35. Crow, W.T.; Miralles, D.; Cosh, M. A Quasi-Global Evaluation System for Satellite-Based Surface Soil Moisture Retrievals. IEEE Trans. Geosci. Remote Sens. 2010, 48, 2516–2527. [Google Scholar] [CrossRef]
  36. Parinussa, R.M.; Holmes, T.R.H.; Yilmaz, M.T.; Crow, W.T. The impact of land surface temperature on soil moisture anomaly detection from passive microwave observations. Hydrol. Earth Syst. Sci. 2011, 15, 3135–3151. [Google Scholar] [CrossRef]
  37. Stoffelen, A. Toward the true near-surface wind speed: Error modeling and calibration using triple collocation. J. Geophys. Res. 1998, 103, 7755–7766. [Google Scholar] [CrossRef]
  38. Scipal, K.; Holmes, T.; De Jeu, R.; Naeimi, V.; Wagner, W. A possible solution for the problem of estimating the error structure of global soil moisture data sets. Geophys. Res. Lett. 2008, 35. [Google Scholar] [CrossRef] [Green Version]
  39. Draper, C.; Reichle, R.; de Jeu, R.; Naeimi, V.; Parinussa, R.; Wagner, W. Estimating root mean square errors in remotely sensed soil moisture over continental scale domains. Remote Sens. Environ. 2013, 137, 288–298. [Google Scholar] [CrossRef]
  40. Koster, R.D.; Sud, Y.C.; Guo, Z.; Dirmeyer, P.A.; Bonan, G.; Oleson, K.W.; Chan, E.; Verseghy, D.; Cox, P.; Davies, H.; et al. GLACE: The global land-atmosphere coupling experiment. Part I: Overview. J. Hydrometeorol. 2006, 7, 590–610. [Google Scholar] [CrossRef]
  41. Miralles, D.G.; Van den Berg, M.J.; Teuling, A.J.; De Jeu, R.A.M. Soil moisture-temperature coupling: A multiscale observational analysis. Geophys. Res. Lett. 2012, 39. [Google Scholar] [CrossRef] [Green Version]
  42. Seneviratne, S.I.; Corti, T.; Davin, E.L.; Hirschi, M.; Jaeger, E.B.; Lehner, I.; Orlowsky, B.; Teuling, A.J. Investigating soil moisture–climate interactions in a changing climate: A review. Earth-Sci. Rev. 2010, 99, 125–162. [Google Scholar] [CrossRef]
  43. Li, L.; Njoku, E.G.; Im, E.; Chang, P.S.; St. German, K. A preliminary survey of radio-frequency interference over the U.S. in Aqua AMSR-E data. IEEE Trans. Geosci. Remote Sens. 2004, 42, 380–390. [Google Scholar] [CrossRef]
  44. De Nijs, A.H.; Parinussa, R.M.; De Jeu, R.A.M.; Schellekens, J.; Holmes, T.R. A methodology to determine radio-frequency interference in AMSR2 observations. IEEE Trans. Geosci. Remote Sens. 2015, 53, 5148–5159. [Google Scholar] [CrossRef]
  45. Parinussa, R.M.; Wang, G.; Liu, Y.Y.; Hagan, D.F.T.; Lin, F.; van der Schalie, R.; de Jeu, R.A.M. The evaluation of single sensor soil moisture anomalies over the mainland of the People’s Republic of China. Remote Sens. 2017, 9, 149. [Google Scholar] [CrossRef]
  46. Holmes, T.R.H.; De Jeu, R.A.M.; Owe, M.; Dolman, A.J. Land surface temperature from Ka band (37 GHz) passive microwave observations. J. Geophys. Res. 2009, 114. [Google Scholar] [CrossRef] [Green Version]
  47. Saleh, K.; Wigneron, J.-P.; de Rosnay, P.; Calvet, J.-C.; Kerr, Y. Semi-empirical regressions at L-band applied to surface soil moisture retrievals over grass. Remote Sens. Environ. 2006, 101, 415–426. [Google Scholar] [CrossRef]
  48. Mecklenburg, S.; Drusch, M.; Kaleschke, L.; Rodriguez-Fernandez, N.; Reul, N.; Kerr, Y.; Font, J.; Martin-Neira, M.; Oliva, R.; Daganzo-Eusebio, E.; et al. ESA’s Soil Moisture and Ocean Salinity mission: From science to operational applications. Remote Sens. Environ. 2016, 180, 3–18. [Google Scholar] [CrossRef]
  49. Schmugge, T.J. Remote Sensing of Soil Moisture: Recent Advances. IEEE Trans. Geosci. Remote Sens. 1983, GE-21, 336–344. [Google Scholar] [CrossRef]
  50. Wigneron, J.P.; Kerr, Y.; Waldteufel, P.; Saleh, K.; Escorihuela, M.J.; Richaume, P.; Ferrazzoli, P.; de Rosnay, P.; Gurney, R.; Calvet, J.-C.; et al. L-band Microwave Emission of the Biosphere (L-MEB) Model: Description and calibration against experimental datasets over crop fields. Remote Sens. Environ. 2007, 107, 639–655. [Google Scholar] [CrossRef]
  51. Mo, T.; Cloudhury, B.J.; Schmugge, T.J.; Wang, J.R.; Jackson, T.J. A model for microwave emission from vegetation-covered fields. J. Geophys. Res. 1982, 87, 11229–11237. [Google Scholar] [CrossRef]
  52. Centre Aval de Traitement des Données SMOS (CATDS). Catds Level 3 Data Product Description—Soil Moisture and Brightness Temperature, Version 3.a. 2014. Available online: http://www.cesbio.ups-tlse.fr/SMOS_blog/?page_id=815 (accessed on 27 December 2017).
  53. Kerr, Y.H.; Al-Yaari, A.; Rodriguez-Fernandez, N.; Parrens, M.; Molero, B.; Leroux, D.; Bircher, S.; Mahmoodi, A.; Mialon, A.; Richaume, P.; et al. Overview of SMOS performance in terms of global soil moisture monitoring after six years in operation. Remote Sens. Environ. 2016, 180, 40–63. [Google Scholar] [CrossRef]
  54. Meesters, A.G.C.A.; De Jeu, R.A.M.; Owe, M. Analytical derivation of the vegetation optical depth from the microwave polarization difference index. IEEE Trans. Geosci. Remote Sens. 2005, 2, 121–123. [Google Scholar] [CrossRef]
  55. Lei, F.; Crow, W.; Shen, H.; Parinussa, R.; Holmes, T. The impact of local acquisition time on the accuracy of microwave surface soil moisture retrievals over the Contiguous United States. Remote Sens. 2015, 7, 13448–13465. [Google Scholar] [CrossRef]
  56. Molod, A.; Takacs, L.; Suarez, M.; Bacmeister, J.; Song, L.-S.; Eichmann, A. The GEOS-5 Atmospheric General Circulation Model: Mean Climate and Development from MERRA to Fortuna. In Technical Report Series on Global Modeling and Data Assimilation; Report No.: NASA/TM-2012-104606-VOL-28, GSFC.TM.01153.2012; NASA Goddard Space Flight Center: Greenbelt, MD, USA, 2012. [Google Scholar]
  57. Rienecker, M.M.; Suarez, M.J.; Todling, R.; Bacmeister, J.; Takacs, L.; Liu, H.-C.; Gu, W.; Sienkiewicz, M.; Koster, R.D.; Gelaro, R.; et al. The GEOS-5 Data Assimilation System—Documentation of Versions 5.0.1, 5.1.0, and 5.2.0. Technical Report Series on Global Modeling and Data Assimilation 104606, v27; 2008. Available online: http://gmao.gsfc.nasa.gov/pubs/docs/GEOS5_104606-Vol27.pdf (accessed on 11 January 2018).
  58. Huffman, G.J.; Bolvin, D.T.; Nelkin, E.J.; Wolff, D.B.; Adler, R.F.; Gu, G.; Hong, Y.; Bowman, K.P.; Stocker, E.F. The TRMM Multisatellite Precipitation Analysis (TMPA): Quasi-Global, Multiyear, Combined-Sensor Precipitation Estimates at Fine Scales. J. Hydrometeorol. 2007, 8, 38–55. [Google Scholar] [CrossRef]
  59. Crow, W.T.; Zhan, X. Continental-Scale Evaluation of Remotely Sensed Soil Moisture Products. IEEE Geosci. Remote Sens. Lett. 2007, 5, 451–455. [Google Scholar] [CrossRef]
  60. Parinussa, R.M.; De Jeu, R.A.; Van der Schalie, R.; Crow, W.T.; Lei, F.; Holmes, T.R. A Quasi-Global Approach to Improve Day-Time Satellite Surface Soil Moisture Anomalies through the Land Surface Temperature Input. Climate 2016, 4, 50. [Google Scholar] [CrossRef]
  61. Crow, W.T.; Wagner, W.; Vahid, M. The Impact of Radar Incidence Angle on Soil-Moisture-Retrieval Skill. IEEE Geosci. Remote Sens. Lett. 2010, 7. [Google Scholar] [CrossRef]
  62. Gruber, A.; Su, C.H.; Zwieback, S.; Crow, W.; Dorigo, W.; Wagner, W. Recent advances in (soil moisture) triple collocation analysis. Int. J. Appl. Earth Obs. Geoinf. 2016, 45, 200–211. [Google Scholar] [CrossRef]
  63. Oliva, R.; Daganzo, E.; Kerr, Y.; Mecklenburg, S.; Nieto, S.; Richaume, P.; Gruhier, C. SMOS radio frequency interference scenario: Status and actions taken to improve the RFI environment in the 1400-1427-MHz passive band. IEEE Trans. Geosci. Remote Sens. 2012, 50, 1427–1439. [Google Scholar] [CrossRef] [Green Version]
  64. Al-Yaari, A.; Wigneron, J.P.; Ducharne, A.; Kerr, Y.; De Rosnay, P.; De Jeu, R.; Govind, A.; Al Bitar, A.; Albergel, C.; Munoz-Sabater, J.; et al. Global-scale evaluation of two satellite-based passive microwave soil moisture datasets (SMOS and AMSR-E) with respect to Land Data Assimilation System estimates. Remote Sens. Environ. 2014, 149, 181–195. [Google Scholar] [CrossRef] [Green Version]
  65. Holgate, C.M.; De Jeu, R.A.M.; Van Dijk, A.I.J.M.; Liu, Y.Y.; Renzullo, L.J.; Dharssi, I.; Parinussa, R.M.; Van der Schalie, R.; Gevaert, A.; Walker, J.; et al. Comparison of remotely sensed and modelled soil moisture data sets across Australia. Remote Sens. Environ. 2016, 186, 479–500. [Google Scholar] [CrossRef]
  66. Wigneron, J.-P.; Jackson, T.J.; De Lannoy, G.; De Rosnay, P.; Walker, J.P.; Ferrazzoli, P.; Mironov, V.; Bircher, S.; Grant, J.P.; Kurum, M.; et al. Modelling the passive microwave signature from land surfaces: A review of recent results and application to the L-band SMOS & SMAP soil moisture retrieval algorithms. Remote Sens. Environ. 2017, 192, 238–262. [Google Scholar] [CrossRef]
  67. Albergel, C.; Dorigo, W.; Reichle, R.; Balsamo, G.; De Rosnay, P.; Munoz-Sabater, J.; Isaksen, L.; De Jeu, R.; Wagner, W. Skill and global trend analysis of soil moisture from reanalyses and microwave remote sensing. J. Hydrometeor. 2013, 14. [Google Scholar] [CrossRef]
  68. Su, C.-H.; Ryu, D.; Dorigo, W.; Zwieback, S.; Gruber, A.; Albergel, C.; Reichle, R.H.; Wagner, W. Homogeneity of a global multisatellite soil moisture climate data record. Geophys. Res. Lett. 2016, 43, 11245–11252. [Google Scholar] [CrossRef]
  69. Vittucci, C.; Ferrazzoli, P.; Kerr, Y.; Richaume, P.; Guerriero, L.; Rahmoune, R.; Vaglio Laurin, G. SMOS retrieval over forests: Exploitation of optical depth and tests of soil moisture estimates. Remote Sens. Environ. 2016, 180, 115–127. [Google Scholar] [CrossRef]
  70. Pellarin, T.; Ali, A.; Chopin, F.; Jobard, I.; Bergès, J.-C. Using spaceborne surface soil moisture to constrain satellite precipitation estimates over West Africa. Geophys. Res. Lett. 2008, 35. [Google Scholar] [CrossRef] [Green Version]
  71. Pellarin, T.; Louvet, S.; Gruhier, C.; Quantin, G.; Legout, C. A simple and effective method for correcting soil moisture and precipitation estimates using AMSR-E measurements. Remote Sens. Environ. 2013, 136, 28–36. [Google Scholar] [CrossRef]
  72. Taylor, C.M.; De Jeu, R.A.M.; Guichard, F.; Harris, P.P.; Dorigo, W.A. Afternoon rain more likely over dryer soils. Nature 2012, 489. [Google Scholar] [CrossRef] [PubMed] [Green Version]
Figure 1. Mean global NDVI values, including the two hotspots used in the TCA and Rvalue evaluation based on [40], over the Sahel and central Great Plains.
Remotesensing 10 00107 g001
Figure 2. Comparison of the three different fusion methods of AMSR-E against SMOS, in terms of correlation (A), the standard deviation of the correlation (B), ubrmsd (C) and standard deviation of the ubrmsd (D) binned over NDVI. NDVI < 0.1 is masked due to too not enough precipitation events (e.g., in the Rvalue technique), NDVI > 0.85 is masked as satellite-retrieved soil moisture loses skill over too dense vegetation.
Remotesensing 10 00107 g002
Figure 3. The number of data points used in the evaluation compared to the total amount of points available over our quasi-global study area, divided in NDVI bins with steps of 0.005 (A), and the percentage of the used data points within the NDVI binning procedure as compared to the total points (B).
Remotesensing 10 00107 g003
Figure 4. Rvalue binned over the evaluated NDVI range for all 6 satellite soil moisture datasets, based on the three different fusion techniques and ASCAT.
Remotesensing 10 00107 g004
Figure 5. TCA results binned over NDVI for all six satellite soil moisture datasets.
Remotesensing 10 00107 g005
Figure 6. Rvalue (AF) and TCA (GL) results over the central Great Plains of North America. The Chihuahuan Desert is masked out (gray) in the TCA results.
Remotesensing 10 00107 g006
Figure 7. Rvalue (AF) and TCA (GL) results over the Sahel.
Remotesensing 10 00107 g007

