1. Introduction
According to the literature, corporate social responsibility (CSR) has two components that apply to all organizations. The first component is corporate citizenship, which refers to responsible, proactive behavior to ensure stakeholders’ demands are met. Corporate citizenship reflects the organization’s commitment to the people, institutions, society, and environment that relate to and interact with the organization. The second component is sustainability or sustainable development, which, according to the Brundtland report [
1], refers to the coexistence of economic growth and environmental conservation. The Brundtland report establishes the key premises of sustainable development, stating that sustainable development is “development which meets the needs of current generations without compromising the ability of future generations to meet their own needs”.
Accordingly, responsible, sustainable firms should strive for long-term survival and returns rather than seeking short-term gains. By taking the long view, firms can contribute to social and environmental prosperity. In this article, sustainable entrepreneurship refers to such an approach. The sustainable entrepreneurship approach is rooted in advocating a long-term value creation model that combines innovation, open collaboration with stakeholders, and a sense of community. Sustainable entrepreneurship requires organizations to change from a traditional approach to an approach that recognizes the key role of the business in social issues such as job creation, wealth creation, incorporation of new technologies, respect for the environment, and compliance with tax obligations. A growing number of firms are embracing the compatibility of long-term profitability with socially responsible, sustainable management [
2,
3] in domestic and overseas markets. For instance, the social license to operate involves developing social and environmental awareness of the countries where the firm operates.
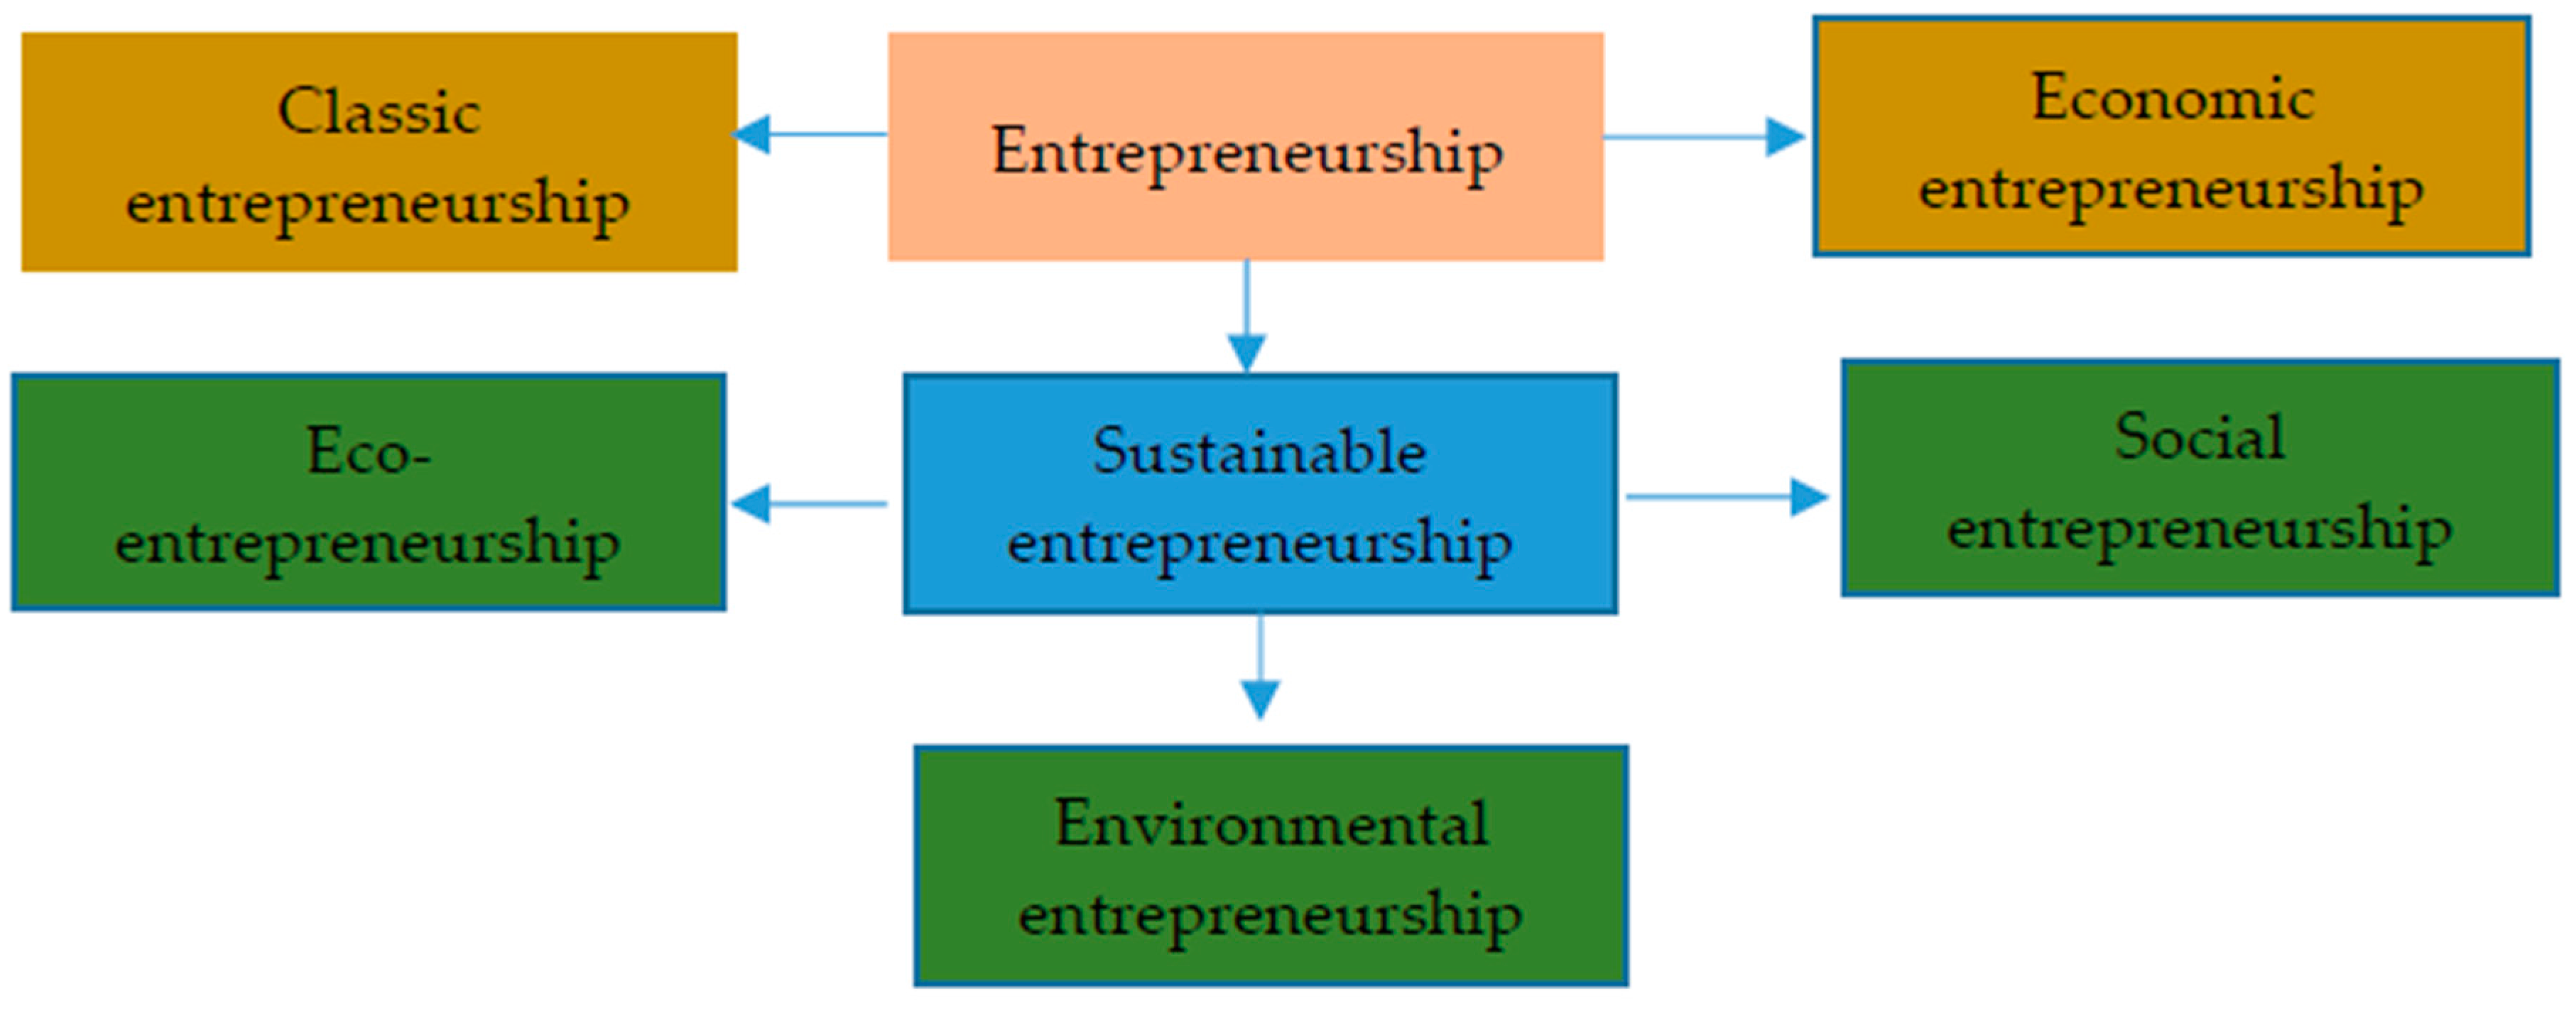
Sustainable entrepreneurship encompasses social entrepreneurship, eco-entrepreneurship, and environmental entrepreneurship (
Figure 1), eschewing the classical approach to entrepreneurship, which is solely concerned with financial performance. For Cohen and Winn [
4], sustainable entrepreneurship exploits opportunities to bring into existence future goods and services while considering their economic, social, and environmental consequences. Sustainable entrepreneurs focus on the community by seeking opportunities to create future products and services for individuals, the economy, and society while preserving nature, life, and the environment [
5,
6]. The entrepreneur’s knowledge can moderate the relationship between knowledge of the social environment (including perceptions of whether the environment is threatened and the entrepreneur’s altruism) and the identification of sustainable opportunities. Thus, entrepreneurs are more likely to identify sustainable opportunities if they know the social environment, if they feel that the social environment is threatened, and if they are more altruistic [
7]. Choongo et al. [
8] highlighted the importance of encouraging entrepreneurs to identify sustainable opportunities. Sustainable entrepreneurs create their own environment, anticipate tomorrow’s laws, and contribute to the transition toward sustainable systems through their own sustainable products [
9].
If this is in fact the case, such an approach to business management should lead to a better corporate reputation. Gaining insight into this relationship is the principal goal of this study. The study also examined whether an explicit orientation toward ethical behavior and good governance enhances the positive effect on reputation. In
Section 2, the theoretical framework is developed and the hypotheses are stated.
Section 3 describes the empirical study.
Section 4 presents and discusses the results. Conclusions and limitations are outlined in
Section 5.
Section 6 presents the business and managerial implications of the study. Finally,
Section 7 offers some recommendations and suggestions for future research.
2. Theoretical Framework: Sustainable Entrepreneurship and Corporate Reputation
We are currently experiencing a shift in the business paradigm, whereby sustainable entrepreneurship represents a genuine challenge for achieving opportunities. Sustainable businesses must contribute to the sustainability of the planet and endure over a long period. If the goal of the business is to last for years, it must be able to create value for itself and its environment. Sustainable value can be described thus because the model is aimed at stable multidimensional development [
11]. Hart and Milstein [
11] identified four types of drivers related to responsibility and sustainability: internal, external, today, and tomorrow (
Figure 2). Internal drivers refer to the negative effects that strictly commercial entrepreneurship can have on the environment: waste, water, ground, and air pollution, consumption of non-renewable energy and resources, and so forth. External drivers refer to the birth of a global approach that involves different stakeholders in the development of the firm’s products or services, thereby improving the firm’s corporate reputation. New ICTs thus contribute to greater transparency and accountability. Drivers that relate to today include clean technologies that enable the development of new competencies to rejuvenate declining industries. Finally, drivers related to tomorrow provide an eminently social vision focused on promoting justice, equality, and growth.
Corporate reputation has been studied using different approaches, including game theory [
12], information theory [
13], the theory of organizational effectiveness [
14], agency theory [
15], transaction cost theory [
16], and the resource-based view [
17,
18]. The resource-based view has contributed most to developing the theory of corporate reputation since the 1990s. Reputation is a multidisciplinary concept. As a resource, it enables firms to gain a sustainable competitive advantage. Hall [
17] identified reputation as the most important intangible asset for managers, and Teece et al. [
19] highlighted the importance of reputation as a valuable information source for the firm’s customers, suppliers, and competitors.
The strategic application of sustainability within firms is considered an intangible asset that creates value and that relates directly to a better corporate reputation and image, higher stakeholder satisfaction, and greater medium- and long-term wealth. The principles of CSR are thus integrated into the firm’s core business [
20,
21]. As noted by Fombrun [
16] and Villafañe [
22], sustainable management enhances prestige and strengthens the firm’s good name. The first research hypothesis captures this idea.
Hypothesis 1. Sustainable entrepreneurship has a significant positive effect on corporate reputation.
Within the firm, the presence of entrepreneurial leaders who are committed to sustainability and who motivate employees through loyalty should lead to a model of good governance based on ethical behavior. Ethics within organizations provides solutions and alternatives for firms that seek to engage in responsible management and governance. Some scholars have even used the terms responsible firm and ethical firm interchangeably. Other scholars, however, have highlighted the differences between ethics based on objective analysis of values and principles within firms and social responsibility, which has a more subjective focus dependent on a certain place and time [
23].
According to Fisher [
24], firms, unlike people, cannot be morally responsible. Fisher [
24] attributes ethics to people and uses social responsibility to refer to the business world. Accordingly, business ethics refers to the behavior of people within organizations, whereas CSR refers to the external behavior of the firm. Fisher [
24] thus distinguishes between ethics and CSR. Carroll [
25], in contrast, describes CSR as a multidimensional concept, where ethics constitutes one of the dimensions of CSR. De George [
26] and Singer [
27] express an opposing view, reporting that CSR is a part of ethics, which encompasses the firm’s obligations to stakeholders. Carroll [
28] subsequently developed the idea that although ethics offers a moral response, CSR responds to social pressures. Windsor [
29] contrasts the obligatory nature of ethics with the voluntary actions that constitute CSR.
Our approach in this study was to consider the direct, necessary relationship between sustainable business management and ethics within the organization. An ethical organization must have a change-friendly attitude [
30]. Thus, the birth and development of codes of ethics within firms constitutes convincing evidence. These codes of ethics are management instruments to which internal stakeholders, principally workers, must adhere. They offer guidelines for individual behavior and protect firms from illegal or unethical behavior by employees. The classical motivation for codes of ethics was originally based on establishing a reputation and building trust with customers [
31], managing risk, protecting organizations from criminal prosecution or damages because of improper behavior [
32,
33], and corporate self-defense [
34]. This classical motivation has yielded to positive motivations based on adherence to policies and procedures that promote the firm’s values, culture, and philosophy [
35,
36]. These motivations (classical and current) have been classified into seven categories [
37]: (1) guaranteeing legal compliance and other legal duties; (2) providing a behavioral guide and formalizing expectations; (3) protecting and improving the organization’s reputation; (4) ensuring employee, management, and supplier compliance and minimizing risk; (5) guaranteeing consistency across global networks; (6) creating and maintaining trust and confidence with stakeholders; and (7) communicating principles and commitments to stakeholders. A reactive stance (compliance with legal obligations and a minimal commitment to CSR) has been superseded by a proactive attitude (communicating the firm’s CSR, philosophy, and values) [
38]. This recent trend implies the key goal of codes of ethics is to promote an organizational environment in which individuals behave ethically [
39].
Ethical controls are crucial because legal systems and markets are not necessarily conducive to organizational behaviors that are concerned with the moral impact of business decisions [
40,
41]. Codes of ethics can also be viewed as attempts to institutionalize the values of the firm’s founders, enshrining these values within the corporate culture and contributing to the initiation of employees into that culture [
42]. For example, the management can apply codes of ethics to bring about change and send messages to workers and managers regarding expectations that go beyond legal requirements. Thus, codes of ethics can be earnest attempts to articulate the moral code that forms part of the organizational culture [
32]. In short, codes of ethics reflect the culture of a firm while also shaping it [
43]. Accordingly, a business culture of sustainable entrepreneurship should lead to an ethical management model based on good governance. The second research hypothesis captures this idea.
Hypothesis 2. Sustainable entrepreneurship has a significant positive relationship with a management system based on ethics and good governance.
One approach to measuring corporate image is through the views of stakeholders [
44]. Under this approach, CSR actions are evaluated in terms of the stakeholders that benefit most from the CSR policy. Groups of stakeholders include customers, shareholders, and employees. Corruption, abuse of power, lack of transparency, and so forth in influential firms has led to a new approach based on values, business, and the economy. This approach relates to voluntary ethical and good governance actions [
45], including the principles that may be applied by people and organizations [
46,
47].
Certain scholars, however, have dubbed CSR a marketing tool that is used to superficially improve the image of the firm without making a truly substantive difference. For these scholars, CSR reflects a fashion among today’s firms that helps these firms to project a good corporate image [
48]. In essence, the organization, which is formed of people, can be affected in two ways by the compliance or breach of social and moral guidelines. The firm is subject to rights and obligations, and it can increase its intangible assets (reputation) if it behaves morally. In contrast, it can harm its intangible assets if it behaves improperly, at least in the eyes of society. In addition, as actors within the firm, employees may feel responsible [
49]. The inevitable consequence is that the valuation of this ethical behavior directly affects the reputation of the firm. The third hypothesis captures this idea.
Hypothesis 3. The adoption of a management system based on ethics and good governance has a significant positive influence on corporate reputation.
Figure 3 graphically illustrates the three hypotheses that were tested in the empirical study.
3. Empirical Study
3.1. Data Sources
To test the hypotheses presented previously, we used data from the Spanish business monitor of corporate reputation (Monitor Empresarial de Reputación Corporativa, MERCO) for 2014 [
50]. We used an indicator of socially engaged firms. The sector, size, location, and degree of internationalization varied across these firms. The categories analyzed in this ranking relate to reputation, leadership, responsibility, and corporate governance. This ranking resembles the Fortune ranking, which has established itself in recent years as a valuable reference, and has been used in numerous studies [
51,
52,
53,
54,
55]. MERCO provides an aggregate mean of stakeholders’ perceptions. The sample comprised more than 100 firms classified as entrepreneurial and sustainable in the 2014 MERCO ranking (
Table 1).
The sampled firms were selected from the list of firms analyzed by MERCO and included in MERCO’s reports. (MERCO has been developing tools to evaluate corporate reputation since 2000. Today, MERCO is a prestigious organization that has become a one of the top international industry monitors. Each year, MERCO produces several rankings. It is the only audited monitor in the world. KPMG has certified its process and results. All weighting criteria and results of the evaluations are publicly available on the official MERCO website.) The information published by a large number of the sampled firms on their corporate websites was crucial. Firms are increasingly likely to publish relevant, current, and well-documented information. This tendency is a show of transparency that is appreciated by stakeholders. Some firms offer direct links to their sustainability reports on their official websites. The Global Reporting Initiative (GRI) database provided accurate, detailed data published in the firms’ sustainability reports (approximately 90% of the sampled firms) under different GRI guidelines, including GRI G3.1 (B), GRI G3.1 (A+), and GRI G4 (A+). (A draft of the first GRI Sustainability Reporting Guidelines was published in 1999. Following a trial period, the initial Guidelines were published in June 2000. Since then, several versions have been released. The latest version is G4.)
3.2. Method
Structural equation modeling SEM was used to analyze the data. Partial least squares SEM (PLS-SEM) is one of the most innovative approaches for the estimation of structural equation models. We used SmartPLS, the most powerful software available, to analyze the data. SEM is well suited to research in the social sciences. It has several advantages. It lets researchers model the error in measures, study abstract concepts using latent variables, and model relationships between several predictor variables (independent and exogenous) and dependent variables (endogenous). Through statistical methods, SEM enables estimation of chains of causal relationships between unobservable latent variables. Latent variables are reflected by manifest variables. These manifest variables yield information to enable estimation of the latent variables. Next, the scores yielded by estimation of the latent variables are used to estimate the causal relationships proposed in the hypotheses. (Several sources were used to gather data on these variables: MERCO ranking (data for the indices corporate reputation, responsible firms, leaders, and internal reputation), the SABI database (offering financial data for Spanish and Portuguese firms), the Spanish National Securities Market Commission (CNMV) (data for publicly traded firms), and the sustainability reports published by a high percentage of the sampled firms.) This process enables quantification of the latent variables and estimation of the direction and size of the effect on other non-observable variables.
3.3. Measures
The exogenous latent variable sustainable entrepreneurship (SOCIAL) represented a construct that attributed a strategic dimension to sustainable entrepreneurial behavior [
56,
57]. We measured this variable using three indicators. Social_1 captured the MERCO ranking of responsible firms. Social_2 measured the publishing of sustainability reports or codes of conduct following GRI guidelines and evaluated the firm based on its inclusion in highly regarded sustainability indices such as the Dow Jones Sustainability Index, FTSE4Good, Dow Global Sustainability Index, United Global Compact, Global Challenges Index, Fortune 500 US, and Fortune 500 Global. Social_3 measured the level of importance the firm attributes to CSR based on its explicit inclusion in the firm’s vision and mission and the values explicitly espoused and advocated in sustainability reports and information published on the firm’s official website. The concept of centrality refers to the central role of responsible management in the firm’s mission and goals.
We also formulated the following endogenous latent variables. Good governance with ethical principles and values (ETHIC: Ethical governance) mediated the relationship between sustainable entrepreneurship and corporate reputation. The variable had four dimensions. The first was codes of conduct, which was measured using information in the sustainability reports published under the GRI guidelines and information published on the official corporate website. The second was the log-transformed reputation index published by MERCO. The third and fourth dimensions were the work environment and the quality of working life. These dimensions were measured using relevant information taken from the firms’ sustainability reports. In summary, the four indicators were development and compliance with internal codes of conduct or codes of ethics, the internal reputation of the firm according to the MERCO ranking, the work environment (work-life balance, flexibility, diversity, etc.), and the quality of working life (training, promotions, contractual stability, investment in human capital, etc.). Corporate reputation (LIKE: Company’s likeability) was measured using the following six indicators: corporate reputation according to the MERCO ranking, the brand value using the Interbrand ranking of the best international and Spanish brands, the quality of the firm’s products or services (satisfaction surveys, online reputation index, positioning on social networks, etc.), the return on sales, sales growth, and the business leadership according to the MERCO ranking.
Table 2 summarizes the variables and dimensions used in the empirical study.
3.4. Applying the Model
Three observable variables that formed part of the corporate reputation construct were related to the economic dimension (
Figure 4). Like_2 (brand value as an indicator of image and reputation) was expressed in Euros and was converted to the natural log value before being included in the model. Like_5 measured the return on sales. Like_6 measured sales growth.
Three observable variables were related to the social dimension. Social_1 reflected the MERCO ranking of responsible firms. (All variables were transformed into their natural logarithms values. Use of logarithms variables leads to interesting interpretations. Strictly positive variables can have conditional distributions that are heteroscedastic or asymmetric. Using logarithms mitigates or eliminates both problems. Furthermore, the use of logarithms considerably reduces the range of the variable [
58].) Social_2 was calculated based on the firm’s inclusion in highly reputed international sustainability indices: FTSE4Good, Dow Jones Sustainability Index, Fortune 500 US, Fortune 500 Global, and Global Compact. A five-point Likert scale was used to denote the number of indices in which the firm was included. Social_3 measured the strategic importance of CSR for the firm, capturing whether CSR was a central pillar (centrality) of the firm’s mission and vision. Social_3 measured whether CSR appeared explicitly in the firm’s mission and vision. Some firms had obtained the ISO 26000 standard, which establishes guidelines and assesses whether the firm includes CSR in all its activities. Social_3 was a dichotomous variable, where 1 indicated that CSR was a pillar of the firm’s mission and strategy, and 0 indicated that it was not.
Ethical governance (ETHIC) reflected the degree to which the firm embraced management transparency, and the encouragement of continual dialogue with different stakeholders through multiple communication channels, meetings in person, and participation in associations and organizations such as Forética, the Club of Excellence and Sustainability (Club de la Excelencia en Sostenibilidad), the Corporate Excellence Club (Club Excelencia en Gestión), and the Spanish Association of Quality (Asociación Española de la Calidad), among others. Ethic_1 represented the importance the firm assigned to ethical behavior by publishing a code of conduct establishing sanctions and accountability for breaching the code. Ethic_3 was a dichotomous variable, where 1 indicated that the firm had a code of conduct, and 0 indicated that it did not. Ethic_2 was evaluated using the MERCO ranking for internal reputation of Spanish firms. The values were transformed into logarithmic form, as for the variable Social_1. We considered that firms with ethical governance should be highly regarded by their employees, so we used this MERCO ranking, among other variables. Ethic_3 was a manifest variable that belonged to the ETHIC construct. Ethic_3 represented the work environment of the firm based on data extracted from the firm’s sustainability reports. The reports divulged whether the firm had been certified by the Másfamilia foundation, which assesses organizations in terms of their efforts to create a culture that supports and facilitates a work-life balance. In addition, certain firms had equality programs that promote and defend equality, mechanisms to detect, prevent, and eliminate all forms of direct and indirect discrimination, and policies that promote women’s access to senior positions. A five-point Likert scale was used to rate each firm’s commitment to fostering a good working environment. The manifest variable Ethic_4 captured the quality of working life. We assessed whether firms considered the professional development of their workers, the hours of training (depending on different professional roles), the percentage of female employees, the net recruitment of new hires, and the rate of absenteeism. In some cases, firms had received awards for good practices in employee care or they were included in prestigious rankings such as Top Employers. A five-point Likert scale was used to rate each firm.
Three observable variables that formed part of the corporate reputation construct were of a social nature. Like_1 was based on the corporate reputation index published by MERCO. Like_4 captured another MERCO indicator, namely leading firms in Spain. Both indicators were transformed into logarithmic form before they were included in the model. The quality of products or services, Like_3, was also part of the social dimension. Some firms adhered to a voluntary code that established a method of self-regulation and monitored their advertising campaigns considering criteria based on responsibility. This study considered the Spanish Advertisers’ Association (Asociación Española de Anunciantes), the Spanish Association of Marketing and Communication Self-Regulation (Asociación de Autorregulación del Marketing y las Comunicaciones), and the Self-Control Advertising Code of Conduct (Código de Conducta Publicitaria de Autocontrol). For firms that adhered to these codes of conduct, we gathered data from sustainability reports. For the variable Like_3, we also considered whether the firm had obtained OHSAS 18001 for occupational health and safety, received quality certification from the Spanish Association for Standardization and Certification (AENOR), and implemented the EFQM quality management models. Some firms compiled their own indices of customer loyalty and satisfaction. For Like_3, firms were rated on a five-point Likert scale.
3.5. Reliability and Validity of the Measurement Instrument
Reliability assesses the absence of error in the model. Specifically, reliability measures the degree of accuracy of the measurement instrument. If the instrument is reliable, the value of the different means repeated for the same object will be the same. Reliability is assessed at the indicator and construct levels.
3.5.1. Indicator Reliability
The individual reliability of each indicator or manifest variable is evaluated by examining the loadings (
λ) yielded by PLS or the simple correlations between each manifest variable and its corresponding construct. The individual reliability measures the degree to which the variance of the indicators is explained by the values of the corresponding latent variable. (A general rule is to accept manifest variables with standardized loadings greater than or equal to 0.708 [
59] because the latent variable is expected to reflect at least 50% of the variance of each of its indicators. Therefore, scholars have advocated eliminating indicators whose standardized loadings are less than 0.4 if eliminating these indicators improves the composite reliability [
60]. Standardized factor loadings between 0.4 and 0.708 must be analyzed to evaluate their effect on the average variance extracted (AVE), which measures the amount of variance of the construct that is explained on average by its indicators.) The first iteration of the algorithm in SmartPLS yielded the data in
Table 3 for the reliability of the measurement instrument.
The total effects between the latent variables were as follows:
After applying a test of power to confirm whether the size of the sample was sufficient, we observed that some of the individual loadings did not attain the minimum value (
Table 3). Therefore, the initial model did not meet the requirements of reliability for all the measurable variables. We therefore redefined the model, maintaining eight of the initial indicators.
For the revised version of the model (
Figure 5), we once again analyzed the individual reliability of each indicator as well as the internal consistency of the latent variables (reliability of the constructs) by applying composite reliability analysis. All values for the composite reliability index exceeded the minimum required value. The construct ETHIC had the highest value for composite reliability (0.856). ETHIC consisted of endogenous latent variables that represented good governance and ethical behavior and corresponded to the following observed variables: adherence to internal codes of conduct, the MERCO internal reputation ranking, the work environment, and the quality of working life (
Table 4).
3.5.2. Construct Reliability
The composite reliability offered an alternative method of verifying internal consistency. It prioritized indicators, which made it a more reliable measure for the method used in this study. The composite reliability evaluated the reliability of a set of indicators, assuming that all indicators measured the same latent construct and assigning each indicator a different weight. (A recommended value for the composite reliability index is 0.70 or greater in the early stages of research. In more advanced stages of research, the minimum accepted value is 0.80 to 0.90. Values less than 0.60 indicate a lack of reliability [
60].) The values for composite reliability appear in
Table 5.
All values were greater than 0.70, thereby exceeding the minimum required value. The latent variable ETHIC had the highest value (0.856).
3.5.3. Convergent Validity
In our model, the ideal scenario would be for all indicators that belong to a construct to measure that construct and only that construct. Like reliability, convergent validity must be assessed at the indicator and construct level. Convergent validity of the measurement model evaluates how well the latent variable explains its indicators. (Convergent validity is the degree to which the indicators of a specific construct converge or share a high proportion of common variance. It is measured using the AVE. The minimum accepted value for the AVE is 0.5 for the latent variables, which represents the capacity of the construct to explain more than half of the variance of its indicators on average [
56].
, where
is the loading for indicador
i and
is the measurement error of indicators
.) The convergent validity of the measurement model, based on the AVE, represents the construct’s ability to explain, on average, more than half of the variance of the construct’s indicators.
Table 5 shows that all latent variables had AVEs greater than 0.5, except SOCIAL, whose AVE was close to the threshold (0.474).
3.5.4. Discriminant Validity
High discriminant validity means that the construct captures phenomena that other constructs fail to capture [
61]. SmartPLS assesses the matrix of factor loadings and cross-loadings. The loading of an indicator on its corresponding latent variable should be greater than the cross-loadings on the other latent variables. This property can be checked by observing the loadings between indicators of all latent variables in the matrix of cross-loadings and confirming that the loading of an indicator on its associated construct is greater than its loading on the other constructs. (In PLS, we do not have a Lagrange multiplier test to assess whether any indicator has a stronger loading on any construct other than on its corresponding construct. An alternative is to evaluate the cross-loadings using exploratory factor analysis to determine whether the loading of each indicator on the corresponding construct is greater than its loading on any other construct.)
Table 6 shows the results of the discriminant validity analysis of the constructs applying Fornell and Larcker’s [
56] criterion. Discriminant validity identified whether each latent variable associated more with its manifest variables (or indicators) than with the rest of the latent variables in the model. We measured the degree to which each construct differed from the others. The results yielded by applying Fornell and Larcker’s [
61] criterion confirmed that the model had discriminant validity and that each construct differed significantly from the other constructs.
Discriminant validity implies that each construct should be significantly different from the other constructs.
Table 7 shows the correlations between latent variables (calculated using SmartPLS). The model had discriminant validity because the capacity of each latent variable to explain its manifest variables was greater than the correlations between that latent variable and the other latent variables (the first value in each column is greater than the other values in the same column).
The second test of discriminant validity was to check the cross-loadings between the manifest and latent variables. The results of this test corroborated the results of the first test. For each manifest variable, the highest correlation was with the corresponding latent variable.
The analysis of reliability and validity confirmed that the measurement instrument had acceptable validity and reliability. We were therefore able to test the research hypotheses by analyzing the structural model. First, we checked for multicollinearity. We used the correlation matrix to check for collinearity for each submodel within the structural model. We checked the values for the variance inflation factor (VIF) were less than 5.
4. Evaluation of the Results and the Predictive Capability of the Model
4.1. Results
The statistical significance of the relationships in the structural model was used to evaluate the relationships between the latent variables. These relationships can be represented graphically as the paths in the model that link the latent variables with arrows representing the hypotheses.
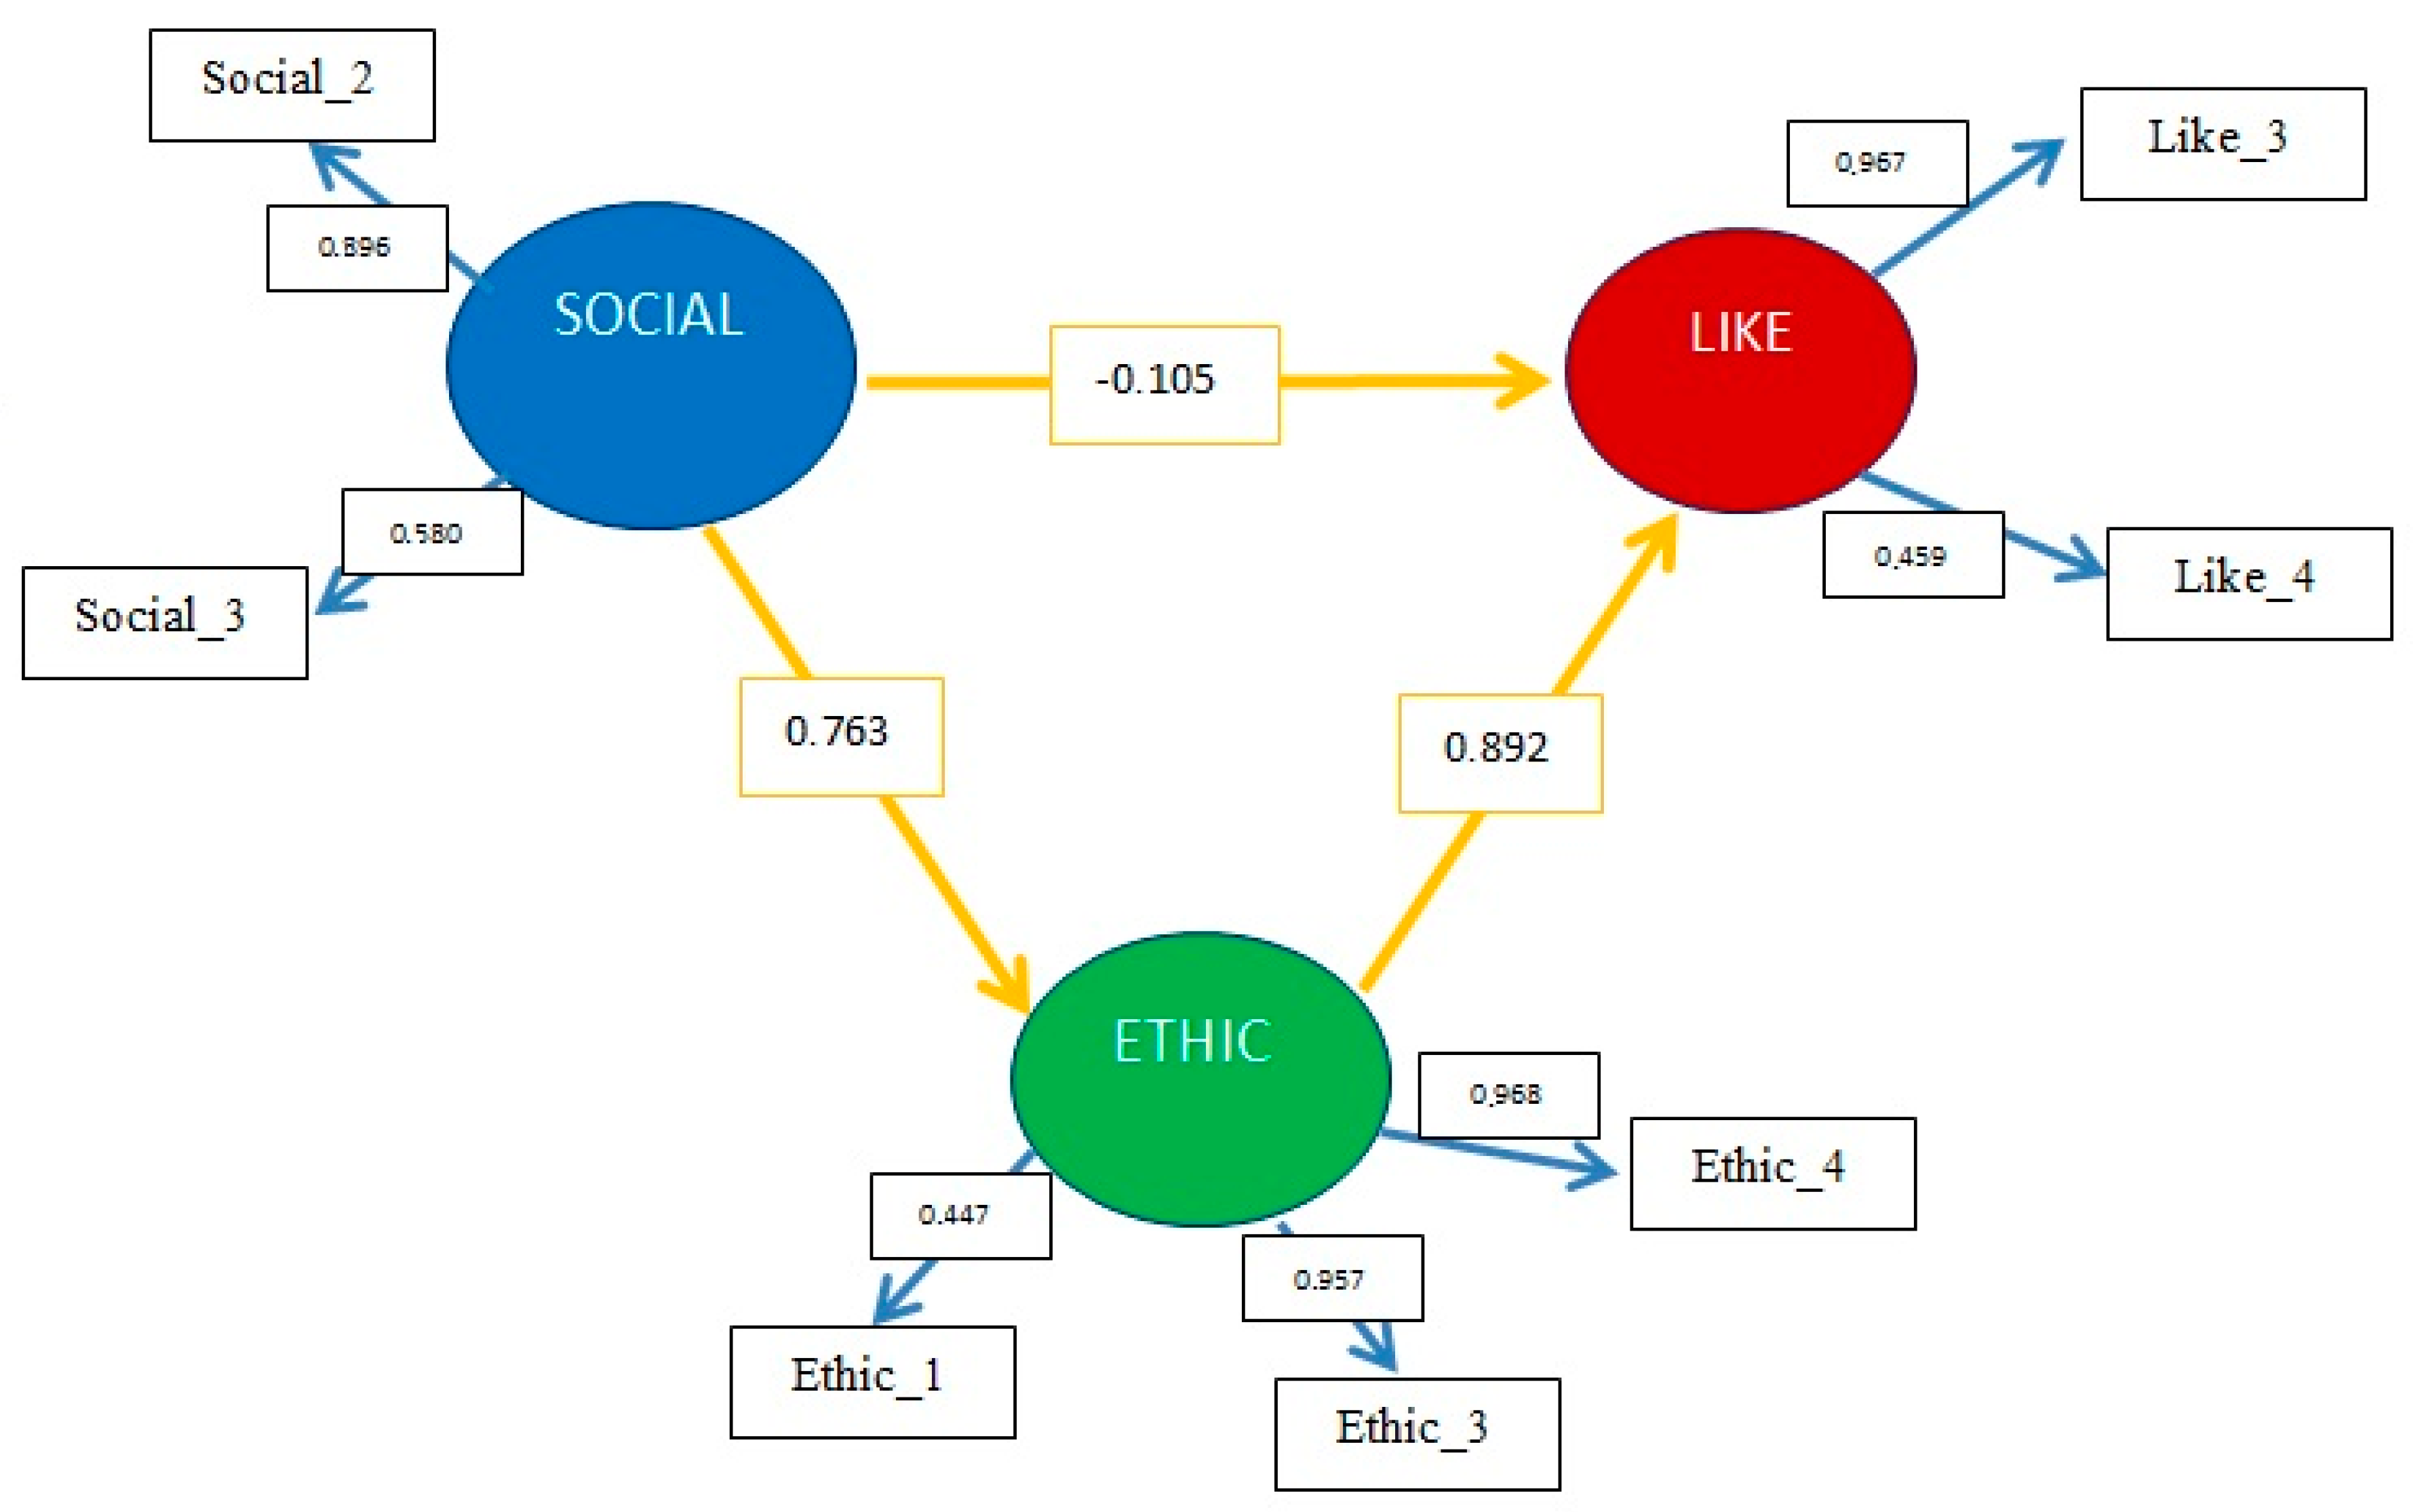
Figure 6 graphically illustrates the revised model.
The relationships were statistically significant if the
p-value was less than 0.05. The
p-value was calculated using the bootstrapping re-sampling method proposed by [
62]. The bootstrapping algorithm yielded the path (β) coefficients between the constructs indicate the strength of the relationships between the latent variables). According to [
63], β coefficients should be greater than 0.2. The relationship between SOCIAL and LIKE failed to meet this condition.
The path between ETHIC and LIKE had the highest β coefficient. These constructs corresponded to good governance (ETHIC) and good corporate reputation (LIKE). The path between SOCIAL and ETHIC also had a high β coefficient. These constructs corresponded to responsible management and good governance. These results implied that there was no direct link between responsible management and corporate image (SOCIAL and LIKE). In contrast, there were strong significant relationships between responsible management and good governance (SOCIAL and ETHIC) and between good governance and good corporate reputation (ETHIC and LIKE). The mediating effect of ETHIC on the relationship between SOCIAL and LIKE was essential for a significant positive relationship on corporate reputation.
4.2. Predictive Capability of the Model
We assessed whether our model had acceptable predictive capability by verifying whether a large amount of the variance of the dependent variables was explained by the coefficient of determination (R
2). In models estimated with PLS, the predictive power of the endogenous latent variable is considered substantial when the coefficient of determination (R
2) is greater than or equal to 0.67, moderate when the value is greater than 0.33, and weak when the value is close to 0.19. According to Falk and Miller [
64], the coefficient of determination should be at least 0.10.
In our model, 58.8% of the behavior of ETHIC was explained by SOCIAL. For LIKE, 66.4% was explained by SOCIAL and ETHIC. Both values can be considered substantial because they were close to the recommended threshold. The values of R2 implied that the predictive capability was notable for both ETHIC and LIKE.
In terms of statistical significance,
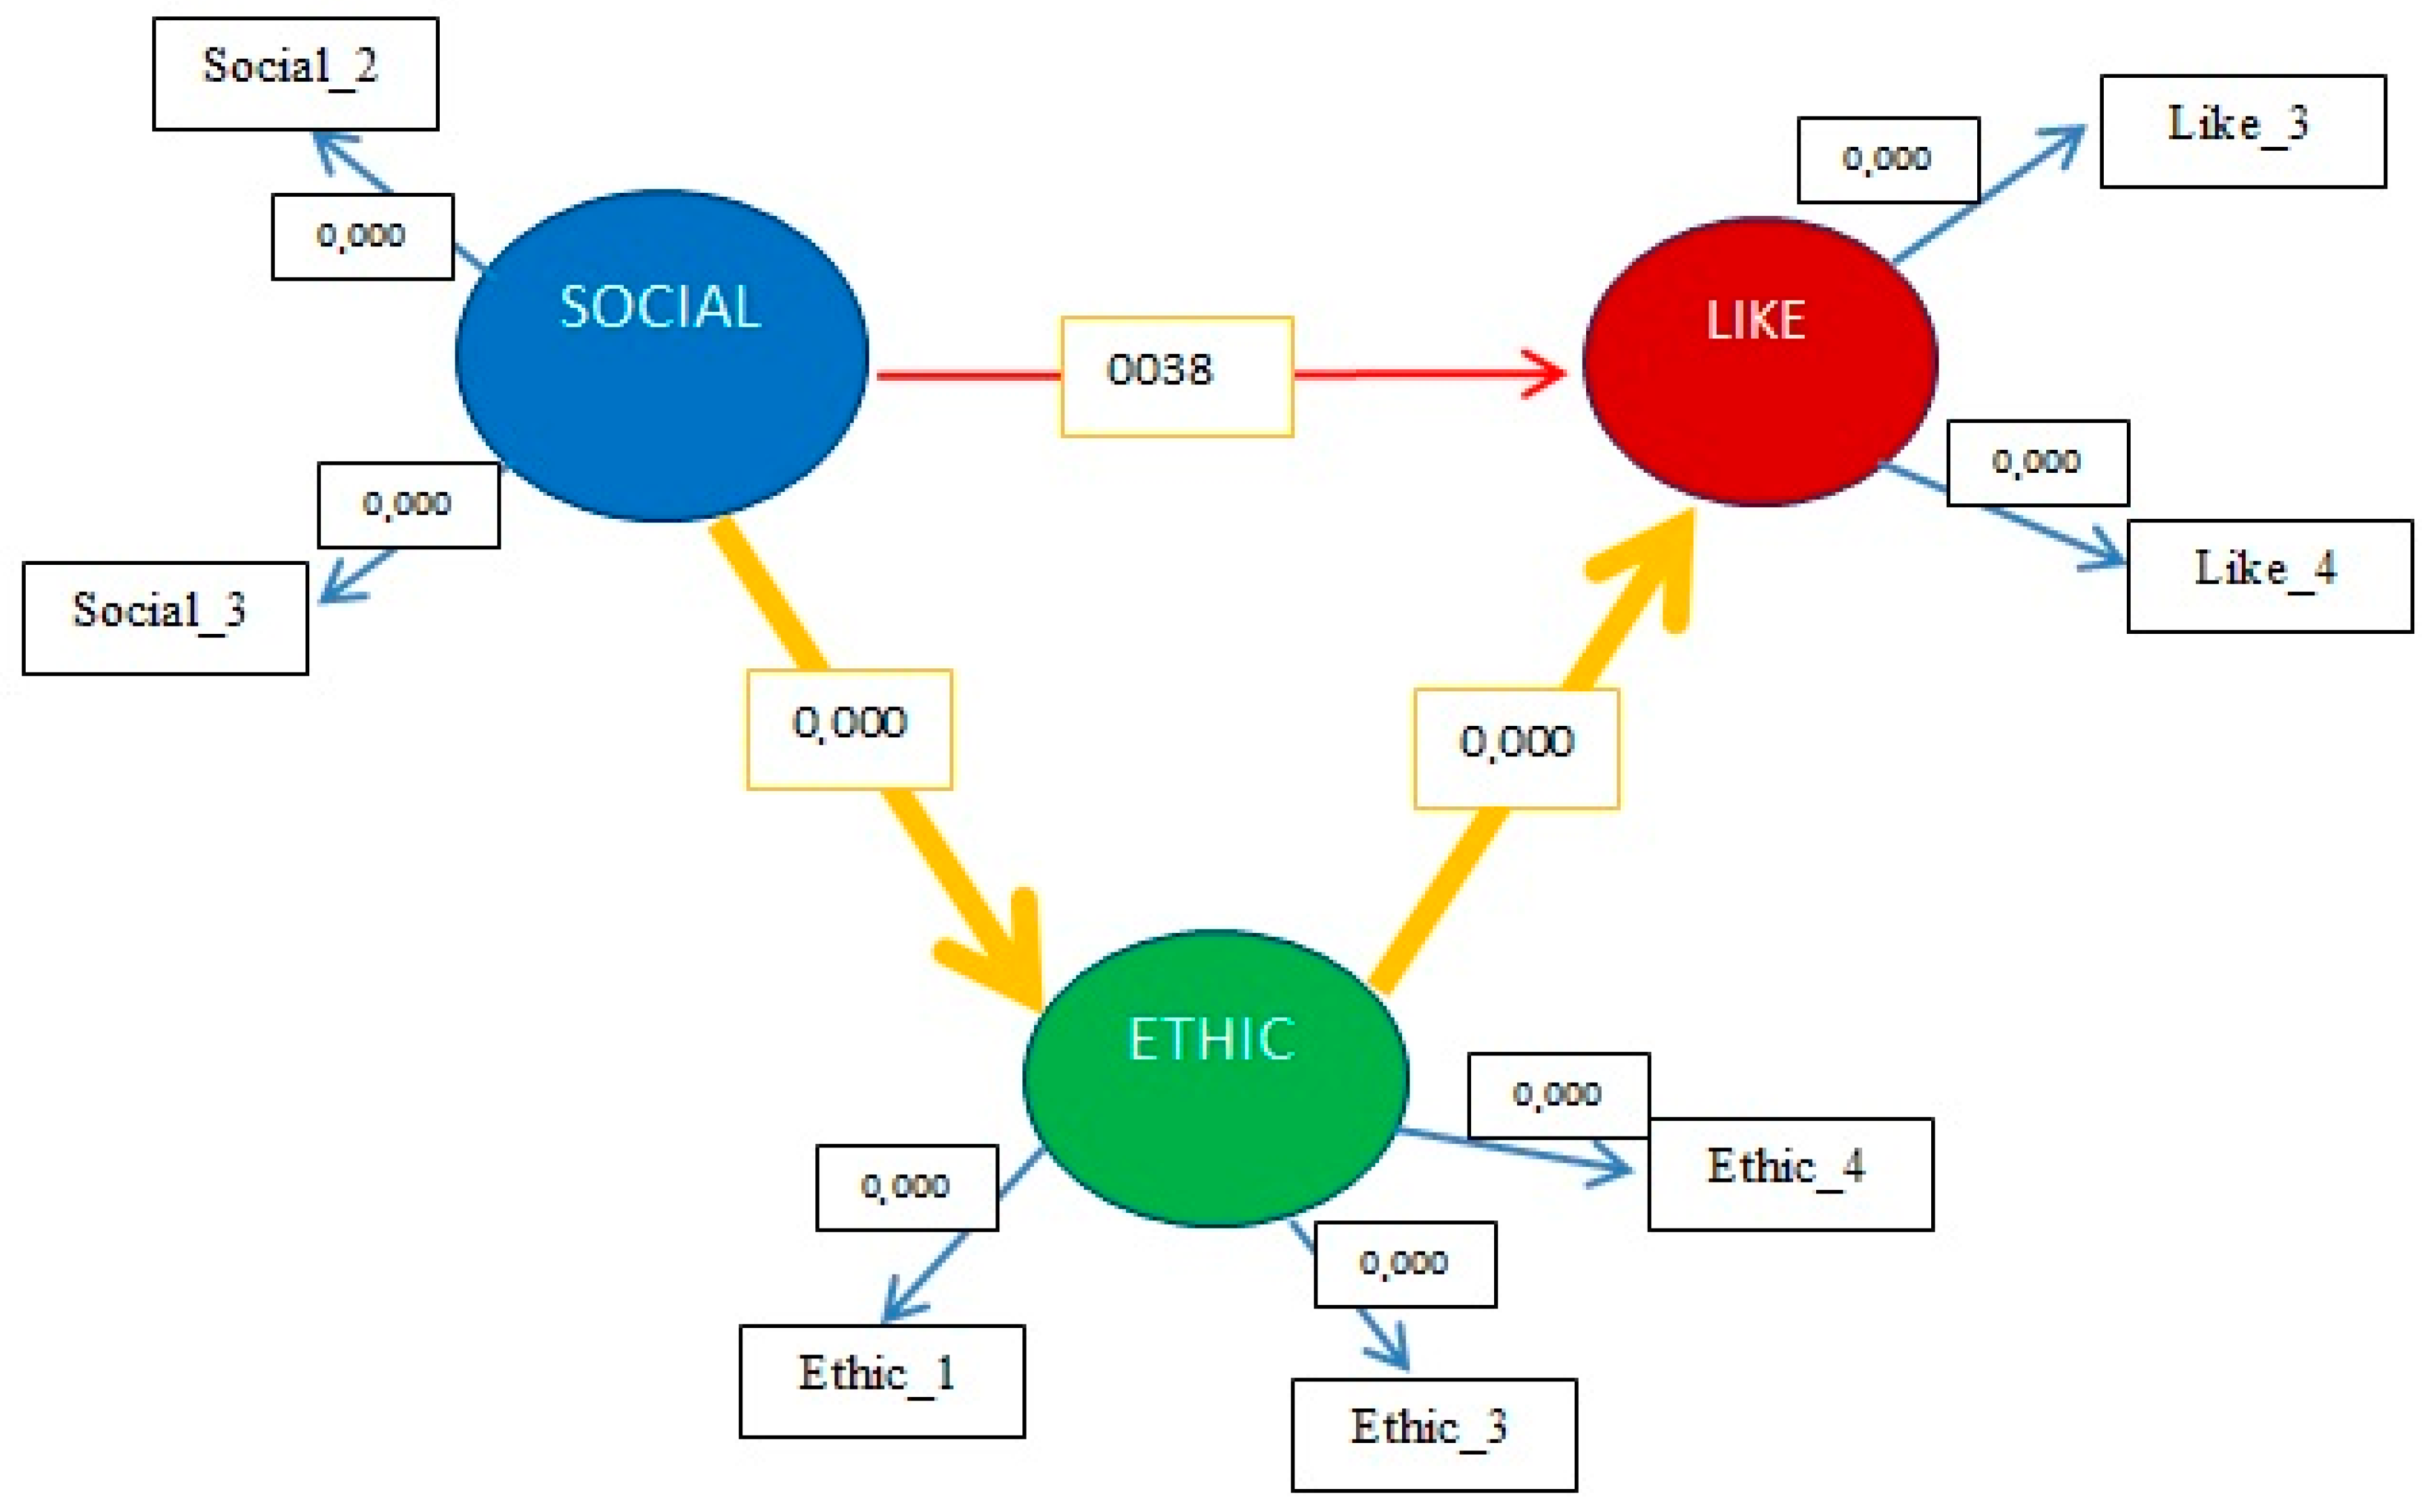
p-values less than 0.05 indicated a confidence level of 95%. Following the bootstrapping procedure conducted in SmartPLS, we calculated the
p-values to assess the bias or variance of the statistical analysis and there by test our hypotheses. Bootstrapping using 500 subsamples equal in size to the original sample confirmed that the
p-values for the relationships between the variables SOCIAL and ETHIC (0.000) and between the variables ETHIC and LIKE (0.000) were highly significant (
Figure 7).
The value of f2 indicates the effect size of an exogenous construct on an endogenous construct through the change in R2 for the endogenous construct when the exogenous construct is removed. According to Cohen (1987), an f2 value of 0.02 implies a small effect, an f2 value of 0.15 implies a medium effect, and an f2 value of 0.35 implies a large effect. For the effect of SOCIAL on ETHIC, f2 was 1.394. For the effect of ETHIC on LIKE f2 was 0.991. Therefore, responsible and sustainable management exerts a large effect on ethical governance. Likewise, the effect of ethical governance on image and reputation was also large.
We also performed the Stone–Geisser test of predictive relevance (Q
2) using the blindfolding algorithm. According to Henseler [
60], there is predictive relevance for the dependent construct when Q
2 is positive. Higher values imply greater predictive relevance. The values of Q
2 for our endogenous latent variables were all positive, thereby implying that our model had predictive relevance. Predictive relevance was particularly high for the variables ETHIC and LIKE, for which the values of Q
2 were 0.393 and 0.340, respectively.
The results confirmed some of our research hypotheses. Others were not corroborated. Relationships were considered significant if the p-value was less than 0.05. The p-values that implied strong significance corresponded to the relationships between the variables SOCIAL and ETHIC (0.000) and between the variables ETHIC and LIKE (0.000) (Hypotheses 2 and 3, respectively). The results of the hypothesis testing can be summarized as follows.
Hypothesis 1, which stated that responsible, sustainable management positively affects image and reputation, was rejected. The relationship between SOCIAL and LIKE had a β coefficient of −0.105. Hypothesis 2, which stated that greater commitment to responsible, sustainable management relates to more ethical governance, was accepted. The relationship between SOCIAL and ETHIC was highly significant (p = 0.000), and the β coefficient (0.763) was high. Hypothesis 3, which stated that good governance positively affects corporate image and reputation, was also accepted. The relationship between ETHIC and LIKE was highly significant (p = 0.000), and the β coefficient (0.892) was high. The t-values for the accepted hypotheses were as follows. For Hypothesis 2, the t-value was 21.120 (>1.96). For Hypothesis 3, the t value was 9.253 (>1.96).
5. Conclusions and Limitations
Globalization and huge advances in new technologies act as external forces that condition business competition. These trends have also heightened the interest in and value of responsible, sustainable management as an intangible resource capable of yielding long-term competitive advantages for the firm.
One of the key elements of responsible management is its voluntary nature. Despite recent advances in the pertinent legislation, which has become more demanding at the national, European, and international levels, firms that behave in a socially responsible manner cannot merely comply with their legal obligations. They must be proactive, show vision, and employ governance mechanisms based on a sense of duty and discipline, the ability to communicate and adapt, a refusal to conform, and a desire to innovate and embrace the importance of creating and preserving a culture of continual learning.
This study focused on a sample of firms that stand out in terms of their sustainability. The sampled firms were included in the MERCO ranking of responsible Spanish firms. These firms had different characteristics in terms of their sector, size, location, and degree of internationalization. The factors analyzed in this ranking relate to reputation, leadership, responsibility, and corporate governance. Analogous to the Fortune ranking, the MERCO ranking has been used in numerous recent studies. We first analyzed the measurement, and then examined the relationships between constructs. The main conclusions of the study are as follows.
First, responsible, sustainable management is crucial; so too is ethical behavior (corporate governance) and valuing people as a fundamental pillar to generate a good reputation, which in turn increases customer loyalty and helps retain talent. Second, using structural equation modeling to study the relationships between responsible management, corporate reputation, and good governance contributes to the literature. This contribution is justified by the relevance of these issues in the literature.
Another important finding is that the positive effect of responsible management on corporate reputation is mediated by good governance (ethical behavior). This finding implies that responsible management constitutes neither a method to improve the image of the firm nor a marketing tool because Hypothesis 1 (responsible management positively and directly affects corporate reputation) was rejected.
The results imply that the good governance construct plays a pivotal role, intervening in the relationship between responsible management and reputation. Hypothesis 2 (responsible management positively and directly affects good governance) and Hypothesis 3 (good governance exerts a direct positive effect on corporate image and reputation) were accepted, with highly significant relationships in both cases.
We must highlight the principal limitations of the study, qualifying the results and conclusions of the study. First, although the sample was sufficiently large (104 firms) and met the necessary criteria to be considered representative, it did not contain any SMEs, which may also be sustainable, socially responsible, and ethically managed according to values that are consistent with a mindset of responsible management. This characteristic of the sample limits the generalizability of the study’s findings. Second, the need to redefine the model forced us to reduce the number of indicators by removing the indicators that failed to meet the conditions of reliability in the measurement model. Thus, the empirical data could have been used more effectively to define a larger number of indicators.
6. Business and Managerial Implications
The concept of sustainable entrepreneurship is attracting considerable attention. Although there is still considerable progress to be made, the success of certain firms is encouraging managers to change their mentality in this regard. These successful firms are demonstrating the valuable benefits of sustainable management in terms of stability, balance, and success.
We therefore recommend that managers and directors acknowledge the importance of discovering new ways of managing their businesses in terms of human resources, the quality of their products and services, and the social and professional impact of acting responsibly. Doing so may offer new opportunities to improve the performance and competitiveness of their firms, while minimizing negative impacts on society and maximizing the value created and shared among different stakeholders. Sustainable firms are capable of applying a balanced form of management that yields benefits for all stakeholders who directly and indirectly influence and are influenced by these firms.
The firms of tomorrow will need to advance technologically, but must never forget that the key to their future lies in overcoming certain obstacles (the importance of a culture based on values and ethics) to seize the opportunities presented by sustainability. Managers must set an example through their behavior. Although it is impossible to apply the same generic values to all firms, universal principles such as integrity and honesty can be extrapolated. These principles must form a fundamental part of every firm’s vision and mission. Management and leadership are not always linked. Leadership refers to values and personal capabilities that relate to an ethical form of good governance and responsible behavior. Without doubt, responsible, sustainable firms must be guided by leaders in sustainability.


