Comparison and Screening of Nuclear Fuel Cycle Options in View of Sustainable Performance and Waste Management


1
Karlsruhe Institute of Technology (KIT), Hermann-von-Helmholtz-Platz 1, 76344 Eggenstein-Leopoldshafen, Germany
2
National Research Nuclear University MEPhI (Moscow Engineering Physics Institute), Kashirskoe Shosse 31, 115409 Moscow, Russia
*
Author to whom correspondence should be addressed.
Sustainability 2017, 9(9), 1623; https://doi.org/10.3390/su9091623
Submission received: 30 August 2017
/
Revised: 7 September 2017
/
Accepted: 10 September 2017
/
Published: 13 September 2017
(This article belongs to the Special Issue Nuclear Waste Management and Sustainability of Nuclear Systems)
Abstract
:Is it true that a nuclear technology approach to generate electric energy offers a clean, safe, reliable and affordable, i.e., sustainable option? In principle yes, however a technology impact on the environment strongly depends on the actual implementation bearing residual risks due to technical failures, human factors, or natural catastrophes. A full response is thus difficult and can be given first when the wicked multi-disciplinary issues get well formulated and “resolved”. These problems are lying at the interface between: the necessary R&D effort, the industrial deployment and the technology impact in view of the environmental sustainability including the management of produced hazardous waste. As such, this problem is clearly of multi-dimensional nature. This enormous complexity indicates that just a description of the problem might cause a dilemma. The paper proposes a novel holistic approach applying Multi-Criteria Decision Analysis to assess the potential of nuclear energy systems with respect to a sustainable performance. It shows how to establish a multi-level criteria structure tree and examines the trading-off techniques for scoring and ranking of options. The presented framework allows multi-criteria and multi-group treatment. The methodology can be applied to support any pre-decisional process launched in a country to find the best nuclear and/or non-nuclear option according to national preferences and priorities. The approach addresses major aspects of the environmental footprint of nuclear energy systems. As a case study, advanced nuclear fuel cycles are analyzed, which were previously investigated by the Nuclear Energy Agency (NEA/OECD) expert group WASTEMAN. Sustainability facets of waste management, resource utilization and economics are in focus.
1. Background
Innovative electrical energy generating technologies should be sustainable, i.e., clean, safe, reliable and affordable and moreover able to preserve resources and minimise liabilities [1]. The nuclear technology option might compete in this sense with other large-scale energy producing technologies as, for instance those consuming coal or oil resources [2]. However, very much like other non-nuclear energy generation options, a nuclear option produces hazardous radioactive waste (radwaste)—called high-level waste (HLW) that contains long-living radionuclides. Therefore HLW should be isolated from the biosphere by a disposal site/system and an enclosure in special facilities, called HLW repositories [3]. This is the reason why nuclear waste management is of public concern in some countries mainly in view of the residual risk of an event leading to radiotoxic fission products’ or minor actinides’ migration from disposed casks/containers into the environment. Although this risk is higher for waste radiotoxic components soluble in water, it is however a matter of R&D studies on repository safety cases. Other events which dramatically shaped political attitudes were: A severe accident of boiling water reactors after an earthquake and a tsunami which lead in Fukushima Daiichi to the release of radionuclides into the ecosystem and impacted the citizens [4] and the catastrophic nuclear accident in Chernobyl where the resulting steam explosion and fires released at least 5% of the radioactive reactor core into the atmosphere and downwind—some 5200 PBq (I-131 equivalent [5]).
Despite these “dragon kings” that fall into the category of residual risk connected with a nuclear power plant operation, a nuclear power production is one of the options offering both strict safety operational provisions significantly enhanced after the above mentioned worst case accidents and the provisions made for including a priori the waste management costs in an effective electricity price in the frame of a business implementation plan. Of note, there are mature proven technologies, which, if implemented at each stage of a nuclear fuel cycle (NFC), are able to ensure a safe high-, or intermediate- or low-level waste management [2,4]. Extensive and costly R&D programs on repository safety cases for HLW disposal are carried out in many countries according to national legislation and local rules in governing nuclear waste (for instance, [6]). The R&D includes an assessment of key safety and performance indicators relevant to protect the human population and the ecosystem even in the long term such as:
- (1)
- Radionuclide transfer times,
- (2)
- Concentration of radionuclides in the near field (to be monitored),
- (3)
- Characteristics of control dilutions in time and space (e.g. waste form dissolution of release rates, canister failure rate, and porosities),
- (4)
- Profile of ground water.
Moreover, in safety oriented repository R&D studies a risk, a dose, possible environmental impacts, radionuclide concentrations and fluxes outside the near field are scrutinised depending on the containment time [7,8].
Nuclear power plants operate in 31 countries around the world generating in total 2474 TWh of electric energy [9]. According to today’s estimates, 48 further countries consider embarking on nuclear power programs in the future. The experience from commercial use of nuclear energy gained over nearly six past decades has stimulated the R&D efforts toward the design of innovative NFCs that should be self-sustainable yet affordable and offer an improved resource utilisation and a reduced impact on the ecosystem [2,4].
Industrially implemented nuclear technologies are currently based on an open, i.e., once through cycle (with UOX ((Uranium Dioxide Fuel)) or a partly closed cycle (with MOX (Mixed Dioxide Fuel)), the latter recycling plutonium once [2]. Severe accidents which happened during the operation of nuclear power plants have drawn the attention and the concern of the public. These events caused a dramatic policy change in some countries with significant financial relocations in favour of renewables. Is this financial challenge a well-justified burden? The answer is ambivalent and depends on the economic development level of a country, the local perspectives, the national criteria and the overall priorities.
All NFC types including the advanced closed NFC multi-recycling fissionable components of spent nuclear fuel (SNF) recovered during a SNF reprocessing have in common that both the front- and the back-end of NFC generate radioactive waste [4]. In this context a decision-making process targeted at a selection of the mid- and long-term strategy followed by a deployment of sustainable energy production technology at the national level might become very complex. In view of non-nuclear options (both mature and maturing) utilising coal, gas or regenerative energy production techniques the decision becomes even more difficult. In the countries having densely populated small geographic territories policy makers have to cope frequently with the public opinion against the nuclear power, whereas at the same time the public perception and governance of controversial technologies might play no or little role in countries with large territorial areas and more opportunities for safe HLW disposal.
Hence, the motivation of this work is to present an approach to screen advanced nuclear energy generating technologies and to perform NFCs comparative evaluation in view of sustainability criteria by admitting perspectives of single stakeholders/experts/policy-making groups. The focus lies on (1) the identification of NFCs having the highest HLW minimisation potential and (2) the enhanced ability to handle HLW management in a responsible way, thus minimising the produced radioactive inventory and the impact on the environment by reducing the environmental footprint including the footprint of repositories.
2. Application Context
The implementation of each particular energy generation option requires an allocation of significant financial R&D resources and a development of effective business models supporting the decision makers in deploying an advanced technology. In general, many methodologies are available for comparing various options in view of their sustainable performance [10,11,12,13,14]. Using these methodologies, nuclear versus non-nuclear options can be compared, or two regenerative energy options, for instance wind turbines against PV panels, or still different NFC options.
On the other hand, there is a lack of a common understanding and a consensus among the experts, public stakeholder groups and policy makers on the impact of option screening studies on a policy-making process and on the decision about financial R&D resource allocation which is indispensable for the realisation of a particular strategic choice [15,16,17]. Such an intrinsically complex decision can be responsibly and consciously taken only when a structured preparatory procedure is applied. This procedure must include many components, for instance, a judgement elicitation and aggregation. The latter can however be done when all facets of the problem are taken into a critical review delivering a comprehensive set of criteria in many areas: Technical, environmental, economic, societal, etc. This complexity is enhanced even more by the wicked nature of the decision-making problem featuring both the conflicting criteria and the conflicting multi-group perspectives. Wicked problems have no explicit solution, therefore they have to be tackled applying trading-off techniques.
The first incentive of this work is the establishment of an approach applicable to a performance comparison of nuclear energy generation options (entire NFCs). A suitable framework using Multi-Criteria Decision Analyses (MCDA) methods [18,19,20] is presented. This framework allows ranking the NFC alternatives according to performance metrics developed w.r.t. sustainability criteria. The selected criteria address important waste management issues. This work demonstrates the framework application to a comparative evaluation of NFCs options. As a term of reference, a current once-through, i.e., open NFC deploying pressurised water reactors (PWR) will be considered.
Well-structured and thereby systematic comparative analysis is possible for both the conventional and the innovative NFC options. NFCs are analysed in a holistic way, i.e., in a context of broad sustainability criteria in spite of a particular attention focused on waste management. Subsequent sections will show how NFC performance can be screened and scored using both conflicting multi-criteria and multi-groups approach incorporated in a decision-making process. As an example, a generic case study will be presented and discussed. The case study investigates NFCs and builds on data elaborated by a NEA/OECD expert group to characterise the performance of advanced NFCs available in the report on Advanced Nuclear Fuel Cycles and Radioactive Waste Management [21].
The performances of any set of alternatives, in this case the NFCs, within the MCDA-based scheme can be compared in a structured manner by applying a multi-layer objective tree. The treetop contains a targeted high-level goal. The selected objectives are to be placed at the second, subordinated level, the criteria which are necessary to fulfil the objectives are to be located beneath and finally, the key performance indicators are to be accommodated at the lowest level. The assessment of key performance indicators is a separate task and should be done by matter experts on each criterion and for each alternative separately.
Such hierarchically ordered structure induces two possibilities of ranking the options: the top-down and the bottom-up approach. The criteria are often conflicting. To handle them properly further information on the preferences of decision makers/experts/stakeholders is needed. Elicited preference data can be embedded in the framework using utility/value functions which are a mathematical representation of preferences and map the natural scale of key performance indicators (determined by all indicator values assigned to a single criterion) onto the stakeholder utility/value measurement scale (usually an interval [0, 1]). Therefore it is essential to incorporate ‘proper’ utility/value functions in the decision-making process. Utility functions might have different shape: linear, exponential, stepwise etc. They are used for the aggregation of judgements on the basis of key performance indicators coupled with a subjective valuation. An intermediate outcome of this evaluation method is the score of a composed indicator which determines the ranking order index for a single option. In this procedure, multiple categories/areas of criteria, value functions and weights (trading-off factors) might be involved. The categories may belong to different problem dimensions like technical dimension criteria, economic criteria, environmental impact criteria, security of resource criteria, safety and proliferation resistance criteria, waste generation and management criteria, social attitude (public opinion) criteria, etc. Different perspectives (points of view) like stakeholders’ valuation, experts’ valuation, policy makers’ valuation, etc. can be taken into account using suitable weighting (trade-off) factors for the relevant criteria [22,23,24].
Advanced nuclear technology offers a possibility to design and implement safe and economic NFCs, efficiently addressing both the reduction of the natural resource consumption and the effective waste management [25,26]. The two latter characteristics determine the degree of NFC sustainability. However, innovative evolutionary and revolutionary nuclear energy systems exhibit different levels of maturity as compared to the conventional NFCs and therefore require more R&D resources to reduce the deployment risks.
Thus, without MCDA support the strategic choices might be very difficult, risky and even impossible. The judgement aggregation step should be principally based on the policy makers’ priorities reflecting important country specifics like, for instance, access to uranium resources, the available storage capacity of facilities for waste management, possibility of interim fuel decay storages, site availability for the final high level radioactive waste repositories, affordable size of the nuclear power R&D program, national social and economic standards to be achieved, etc. Obviously, different countries would tend to have different priorities because the choice of criteria strongly relies on national needs and priorities as well as the valuation of the subjective stakeholder preferences.
A very important group of criteria reflects the engineers’ or scientists’, i.e., experts’ opinions. The corresponding criteria metrics are based on assessments of scientific and technical nature. Such type of criteria can be found in the above mentioned technically oriented NEA/OECD study, which was launched in 2004 to assess the impact of different NFC options on the uranium consumption rate and the radwaste management within a NFC [21]. The affordability aspect (economic burden) associated with investment, NFC operation and maintenance costs was preliminarily tackled using the economic data referring to the year 2004, which was biased by large uncertainties.
Generally, the NFCs should fulfil many requirements to be judged as sustainable: Preserve the resources, reduce Greenhouse Gasses (GHG) and other gaseous emissions generated by various NFC facilities in the entire life cycle (especially by a reactor deployed to irradiate fresh fuel and reprocessing facility), minimise the inventory of generated hazardous waste and ensure the effective and safe waste management, hence reducing side impact on the ecosystem, etc.. The NFCs, if properly configured, have the potential to be sustainable. Representative NFC families can be found in the WASTEMAN final report [21]. The NEA/OECD study analyses:
- (1)
- Once-through NFCs and their extensions recycling once a fissionable nuclear material in the thermal reactors,
- (2)
- Sustained recycle of fissionable nuclear material in a mix of thermal and fast reactors, and
- (3)
- Sustained recycle of recovered fissionable nuclides in the advanced fast reactors fleet deploying both the maturing and the emerging NFCs.
Item (3) might still require extensive R&D efforts and is flawed with higher deployment risk but exhibits a good prospect for the future due to steady technological advances in enrichment and recycling (new separation processes) methods, as well as a possibility of radioactive material remote handling during reprocessing and fabrication, advanced fuel rod designs including accident tolerant fuels, an enhanced safety level of both reactors and fuels and improved waste management and treatment.
The second incentive of this investigation is a survey of the literature on the environmental sustainability criteria applied to comparing nuclear versus non-nuclear (oil/gas, hydropower, wind and regenerative resources) technologies and to analysing the respective performances of the options based on these criteria. The authors, however, have not yet included new environmental criteria like the greenhouse effect and other gaseous emissions, the land exploitation, and the water pollution in the MCDA-based methodology. Consequently, in order to get an idea of the environmental footprint of the nuclear option, the nuclear and non-nuclear energy system performances matching the sustainability criteria, i.e., key indicator values, will be directly inter-compared. The key indicators that will be used represent a subset of general environmental indicator categories depicted in Figure 1. Here, the environmental footprint of NFC infrastructure will be mainly addressed.
3. Short Description of NEA/OECD Study on Performance Comparison of Nuclear Energy Systems and NFC Options
In the NEA/OECD WASTEMAN study, twelve representative NFCs were examined [21]. The high-level objective was to identify those NFCs which have the highest potential to provide benefits to a repository program, diminish the consumption of uranium resources and improve prospects for sustainable deployment of nuclear power. In order to be able to compare the performance of nuclear system options possessing different maturity levels, the expert group developed a set of suitable technical NFC evaluation metrics. Evaluating metric data for each NFC on each metric allowed judging how the nuclear energy system performs in a particular evaluation area. The NEA/OECD expert group compiled the metric data into a spider diagram for final inter-comparison; the MCDA method was not applied. These metrics were adopted by the authors in this study and will be used in the established framework as the criteria key indicators. The NEA/OECD performance indicators (metrics) for each nuclear energy system refer to a reactor in a “steady state” operation. This simplified approach is sufficient for generic assessments because the conditions of intergenerational transient phases for nuclear energy systems might widely vary from country to country and are still biased by large uncertainties. Nonetheless, in the view of the authors, “steady state” evaluations of advanced NFC options open a certain prospect to different countries by exposing both the opportunities and the challenges of particular strategic choices and thereby methodologically supporting the policy decisions concerning future national R&D programs on the advanced technologies. The examined case study, although a generic one, can be easily adapted to national conditions and permits the national assessments of the country specific scenarios even if a large diversity of NFC types is envisaged for deployment. NEA/OECD metric data can be easily introduced into the MCDA framework, provided a well-structured problem-dependent set of criteria has been established. This paper considers a MCDA problem with a two-level objective tree and three high-level objectives (areas):
- (1)
- Reduction of the resource utilisation,
- (2)
- Minimisation of the produced nuclear high level waste (benefit to a repository program) and
- (3)
- Economic competitiveness.
In the NEA/OECD study the nuclear energy systems are subdivided into the three groups characterised by the nuclear energy system (NES) technical maturity level
- (1)
- Mature: current industrial practice and extensions,
- (2)
- Maturing and feasible: partially closed NFCs and
- (3)
- Maturing or emerging: fully closed NFCs.
These NFC groups will be investigated here in detail. It has to be indicated that while making own assessments attention should be drawn to the overall characteristics of all nuclear energy systems contained in Table 1, i.e., the characteristics of each particular reactor type as, the fresh fuel compositions loaded to the reactor core and the in-core management schedule (burn up, no. of irradiation cycles, inventory of fuel loaded or reloaded, last factor, reshuffling scheme, etc.), and the characteristics of the fuel cycle (SNF cooling time, reprocessing time, fabrication time, reprocessing losses, etc.). These details can be looked at Ref. [21]. Moreover it is important to underpin that the development of advanced fuels like MOX, i.e., modelling process, their transient behaviour due to power excursion, and the proliferation resistance (for both thermal and fast reactors) require dedicated R&D. The molecular dynamics calculations used to simulate the elastic properties and thermal expansivity for a range of mixed oxide compositions of UO2 blended with other actinide oxides (for example: ThO2, PuO2 or Pu-AmO2) can be found in [27,28,29]. For many innovative nuclear fuel applications, the understanding of oxygen self-diffusion in a fuel over a range of temperatures is still an important issue [30].
Table 1 does not contain all possible NFC options; Thorium based NFCs are, for instance, not included since they were not considered in the WASTEMAN study due to current low maturity level of this technology. At the present state of development the fuels containing thorium might pose proliferation thread and a protactinium production pathway would make pyro-chemistry much more complex [31].
The last column of Table 1 contains a colour code assigned to each individual NFC option examined in this paper. The colour technique will facilitate a graphical presentation of the results analysed in the next paper sections. In summary, twelve NFCs represent here a full set of alternatives and will be compared on the performance evaluation criteria shown in Table 2. The problem formulation proposed here takes a form of a triplet consisting of:
4. Performance Comparison of OECD/NEA Advanced NFC Options with MCDA
4.1. Problem Statement
In order to support a national decision-making process targeted at the choice of the best NFC option for an industrial deployment (i.e. to generate the electrical power), a hierarchical objective structure should be established which reflects the national specifics in the best way. Here generic exemplary case study will be performed thus a two-level objective tree depicted in Figure 2 fits best the problem. The high-level goal of the study can be formulated as follows: Compare the performance of NFCs options using established judgement aggregation structure with eight criteria assigned to the three high-level objectives (resource utilization, waste management, and economics, respectively) on the basis of eight key indicators per each NFC option each evaluated for a single criterion. The expected analysis outcome is the ranking of NFC options according to the NFCs’ overall performance which has been judged on the base of obtained scores.
The performance indicator values Cr.-1, Cr.-2–Cr.-6 and Cr.-7–Cr.-8 shown in Table 2 should be minimized. As mentioned, the priorities of various stakeholders groups can be taken into account assigning proper weightings to the high-level objectives. For the same purpose the lower criteria-level weights have to be selected and the weighting value/utility functions have to be adequately chosen. This procedure allows to grade NFCs using MCDA.
4.1.1. Performance Table
As above-mentioned, the NEA/OECD report [21] delivers indicator values for twelve NFC options grouped in three families. These indicators are evaluated on the basis of extensive physics-based studies, carrying out calculations with well-established codes (such as ERANOS [32], APOLLO [33], DARWIN [34], CESAR [35], etc.) used to determine the material flows and the characteristics of the radioactive waste inventory generated in each stage of NFC. Key-indicator values for each option were retrieved from [21] and compiled into the options performance matrix shown in Table 3. The indicator values are “point values” valid only for a particular reactor design and a particular fuel composition. Uncertainties in assessment of the Cr.1–6 indicator values were not considered in [21] and will be neither analyzed here. This paper assumes that Table 3 contains the “best scientifically achievable estimate” of data.
The performance of alternatives can be preliminary compared by drawing a value path diagram (Figure 3). This diagram helps to identify the non-dominating options visually (those that do not provide improvement on one criterion at a sacrifice of another one). In particular, Figure 3 indicates that the alternative 1c might be dominated by 1b, and the alternative 3bV might be dominated by 3b, respectively.
4.1.2. Preliminary Judgement Aggregation
A preliminary aggregation carried out here to perform the comparative evaluation between advanced and conventional NFCs adapts Multi-Attribute Value Theory (MAVT) method with the linear single-attribute value functions. The MAVT method was chosen because it has already found a wide application in many MCDA-based frameworks supporting strategic choices in various disciplines including nuclear engineering [36,37,38]. Figure 4 demonstrates NFCs’ performance scores obtained applying MAVT while feeding in the indicator values from the performance Table 3 and the objectives tree illustrated in Figure 1. The single-attribute value functions were defined over the local domain of each indicator type. A set of equal weights (locally normalized, i.e., at each tree-level separately) was applied. The results: NFCs’ scores obtained for each high-level objective are shown in Figure 4.
Note that for the high-level objective “resource utilization” only one criterion was selected therefore in this area there is no need to aggregate on different criteria. In the area of waste management and economics the aggregation of scores on relevant lower-level criteria must be performed at first to be able to deliver the overall scores for natural uranium resource utilization and economics. Figure 4 shows the scores plotted over each NFC option. It can be easily recognized that the waste management score is high for the majority of evolutionary and all revolutionary nuclear energy systems. The “open” NFC as well as NFC employing a “single recycling” of plutonium in MOX fuel and the evolutionary NFC option-2a: “Plutonium recycling in LWR once” using enriched 235U (as a component of MOX-EU fuel) perform worse. As concerns the economical uranium resource utilization (objective 1) option-1a and option-2b have got the worst scores, the latter due to the MOX-EU loaded to reactor cores, i.e., a fuel type which consumes more uranium. The most economical resource utilization is provided by option-3cV1 and option-3cV2, i.e., NFCs based on fast sodium- or a gas-cooled critical reactor, respectively. NFCs’ performance on high-level objective “economics” exhibits a higher diversity, but is also biased with large uncertainty. Current technology and its extension are obviously more economic than advanced NFCs of group 2 and 3. NFCs of group 2 seem to be more economic than NFCs of group 3 but with one exception: Option-2b which includes an Am-Cm separation process and requires a fabrication of two MOX-EU fresh fuel types.
Of note, the framework using MAVT requires a selection of appropriate criteria weights (representing the decision/policy makers’ preferences). These weights “measure” the relative importance of low-level criteria contributing to a fulfilment of a particular high-level objective and the relative importance among the latter. Here, a preliminary assessment was done using equal weights within each criteria group and for each area. An uncertainty present in the weighting factors obviously leads to a statistical spread of scores. Spread of scores obtained here for two high-level objectives (waste management and economics) while considering the impact of probable weights’ uncertainty are depicted in form of the scatter bars in Figure 5a,b, respectively.
In general, NFC options- 2b, 2c, 2cV, 3a, 3b, 3bV demonstrate very similar performance on waste management criteria even for differently balanced sets of weights. Waste management scores of options 3V1 and 3cV2 are the highest; therefore these options seem to be the most attractive from the waste management perspective.
Option-3bV requires evidently the highest financial investments (worst score) whereas the best economic performance, i.e., the lowest costs, can be assigned to the option-1a which has the highest maturity level and does neither rely on the separation processes nor on the fuel recycling.
4.2. Preliminary Screening of the Options’ Performance with Different Preferences-Weighting
Screening for dominance: A very useful preliminary stage in any performance comparison of options is an identification of non-dominated options which has been till now only visually done while studying the value paths in Figure 3. NFC option is “dominated” if its performance indicators on an entire set of criteria are worse than those of an option that dominates it. Therefore, dominated options should be excluded from comparative procedure. This facilitates the comparison and makes the ranking more stable. More detailed analysis done here (see Table 4) confirms the preliminary observation that 1c is dominated by 1b, and 3bV is dominated by 3b. Recall, Figure 3 reflects this domination relation in a visual way showing that the value path of the dominated NFC options lies below that of the dominating one. NFC 1b domination over 1c means that 1b will always have the higher rank when compared to 1c. The same holds for the 3b and 3bV options.
The advantage of these preliminary analyses is that at this stage there is no need to determine the weighting factors yet. The disadvantage is that the identification of the set of non-dominated NFC options does not allow determining the ranking order. Therefore, it is necessary to define a decision rule and to integrate this rule in the proposed framework using elicited weights (representing the relative importance of criteria for singular experts, decision-makers and other stakeholder groups).
Preference-weighting: Other weight sets different from “equal weight option” discussed already in Section 4.1.1, can be for instance selected (as proposed in Table 5) with the enhanced emphasis on the economics, the resource utilization or the waste management objective, respectively. Such an approach is suitable to examine the impact of different perspectives on options’ ranking order and it is widely applied in many studies. For instance a similar approach was followed within the US DOE supported study on evaluation and screening of NFCs [39].
The “equal weights” method is thereby only a first approximation within the MCDA-based problem. It depicts a situation when nothing is known regarding experts’/stakeholders’ and decision-makers’ preferences. However, even if the detailed information regarding expert weightings is missing, the “equal weights” ranking combined with a detailed weight sensitivity analysis provides a chance to make a general conclusions about the attractiveness of the options from many different perspectives [6].
A key feature of decision modelling is the iterative way of proceeding that allows local perspectives incorporation in the framework by means of diverse sets of weights. It is worth to notice that in order to simulate the perspectives of different interest groups and to assess their impact on the overall ranking scores just the base-case weights should be changed.
For the sake of demonstration a ratio 20:80 has been applied here for three weights’ variants, assigning a weight of 0.8 to an emphasized objective and weights equal a halve of 0.2 to the two remaining high-level objectives. Note that, the weight set chosen at each lower hierarchy level represents, due to the normalization condition, equal partial weight values.
The criteria weights can be changed as well. For instance, a country which considers fuel leasing option and does not intend to implement national HLW repository might assign zero weight to Cr.-3, whereas the county which intends to multi-recycle fissionable material will care of minimizing loss of Transuranic (TRU) element inventory transferred to waste, etc.
4.3. Judgement Aggregation and Discussion on Ranking Results Stability
The ranking results, which are shown in Figure 6, were obtained using MAVT-based model with the additive multi-attribute value function:
where u and ui are multi- and single-attribute value functions, respectively, and ki are the normalization constants equal to a product of all relevant level weights for attribute i.
MAVT is used here to assess the sustainability of a policy option by simultaneous treatment of indicators that refer to the three dimensions of sustainability: economic, social and environmental. Equation.1 shows that MAVT is able to combine information necessary for clarification of sustainable (weak) NFC development aspects. Moreover, MAVT is able to address de/coupling, adaptability and ir/reversibility (since separate criteria can be used to compare alternative policies). The MAVT aggregation can include the impacts on different groups/sectors/regions on the ranking order and give a clear overview of the differences between preferences in these categories.
The ranking results obtained using MAVT-driven judgement aggregations are shown in Figure 6. Included are: the overall score of each policy option (NFC) and three partial scores representing the contributions of each high-level objective to the total score value plotted over NFC options.
Options: 3cV2 (NFC based on sodium-cooled European Fast Reactor) and 3cV1 (NFC based on Gen-IV gas-cooled reactor) perform best, followed by the options: 2c with heterogeneous americium recycling (in dedicated targets) in LWR and a variant 2cV representing NFC in which Am and Cm are transferred into a decay storage facility and their subsequent decay product are either disposed of or recycled in the MOX fuel. The last (worst) ranking positions are occupied by NFC 1b, 1c and 1a mainly due to low waste management score (amount and characteristics of generated radioactive HLW inventory). Moreover, Figure 7 demonstrates very similar overall scores for several options suggesting another combination of NFCs than that done by the NEA/OECD experts namely into families providing similar trends. These “proxy” families are: 1b and 1c; 2c and 2cV; 2b and 3bV; 3a and 3b; 3cV1 and 3cV2. Options 1a and 2a have no corresponding partners.
4.4. Sensitivity and Uncertainty Analysis
An uncertainty analysis discussed here refers to the weights and value functions. The uncertainty in indicator values Cr.1–Cr.8. is not addressed here because of the assumption that the indicator values represent best estimate for a given NFC deploying a particular reactor design with the particular fuel composition as described in [21].
4.4.1. Sensitivity and Uncertainty Analysis with Regard to Weights
The changes in a ranking order of NFC options belonging to one family may occur as a result of the modification of criteria weights (within the same high-level objective) or of changes in the shape form for the single-attribute value function. The results of sensitivity studies in view of weights variation are illustrated in Figure 7 for each of the three high-level weights assigned to the high-level objectives separately, i.e., for resource utilization, waste management and economics, respectively.
Sensitivity analyses demonstrate that the first rank can be taken only by options 1a, 2c, 3cV1 or 3cV2, respectively (Figure 8a). The ranking position of these options is very stable as compared to the options belonging to the second and the third family (Figure 8b,c). Note that according to a weight values combination only 4 NFC options can take the first position in ranking; while the second rank position can be taken by 6 options (1a, 1b, 2c, 2cV, 3cV1, 3cV2), see Figure 8b. The third rank position can be occupied by 8 options (1a, 1b, 1c, 2c, 2cV, 3a, 3cV1, 3cV2) as illustrated in Figure 8c.
The spread of the overall scores due to uncertainty in waiting factors is presented here as a box-and-whisker plot in Figure 9. Figure 9 was created on the base of evaluations performed using a stochastic multi-criteria acceptability analysis [40,41,42]). Box- and whisker-plots are a handy way to display numerical data breaking the entire data set down into four quartiles, each one with an equal number of data values. In order to generate the plot, the median of the lower half of the data set (quartile 1), the median of the entire data set (quartile 2), the median of the upper half of the dataset (quartile 3), and so on, i.e., 25th, 50th and 75th and 5th as well as 95th percentile are used to represent the statistical distribution of obtained option scores. The stochastic sensitivity analysis shows that the rank one for option 3cV2 can be occasionally taken by the option 3cV1, the ranking position of options 2c and 2cV are rather stable and so on. Figure 9 confirms that options 3cV1 and 3cV2 persistently remain the most attractive one. This figure allows a dynamic interpretation of ranking and shows the inter-option competitions in dependence on the weight variation.
It is interesting to observe that the performances of options 2c and 2cV are close to each other (2cV is a variant of 2c). In particular 2cV seems to be better than 2c on 3 criteria (Cr.-2,-7,-8), at the same time 2c is better than 2cV (Cr.-3,-4,-5) on 3 criteria whereas 2c and 2cV perform equally well on 2 criteria (Cr.-1,-6), see Table 6 for details.
4.4.2. Sensitivity and Uncertainty Analysis in Regard to Single-Attribute Value Function Shape
The ranking order sensitivity to a change of the single-attribute value function shape is depicted in Figure 10 for the equal weighting option. Figure 10 shows each option’s rank position probability multiplied by 100%. The statistical approach was implemented here to examine the sensitivity of ranks to single-attribute value function shapes e.g. a random generation of a set of single-attribute value functions from a certain set of functions (in this case, from the set of exponential functions with different power being a parameter) was performed. An assessment of option ranks for each set of randomly generated single-attribute value functions constitutes the outcome of this analysis. Based on this data, a probability of achieving certain rank may be evaluated for each option and its distribution determined and plotted.
This analysis technique allows to assess the probability rank distributions for each NFC option and to determine the most probable ranks as well as the mean values, variance, etc. This data characterizes the degree of the option rank sensitivity to single-attribute value function shapes. Based on this information, it is possible to provide conclusions regarding the attractiveness of options while taking into account uncertainties in single-attribute value function shapes.
Figure 10 demonstrates that the most probable options occupying each rank position are the same as those which have been already identified while using “base case” linear single-attribute value functions. The closest to the most probable options are the ones from relevant NFC “proxy” families that were indicated in Section 4.3. In general, this figure indicates that the ranking order is not very sensitive to the shapes of the single-attribute value functions. The same is true for other weighting options.
4.5. Robustness Analysis
The robustness of the ranking order obtained by the MCDA-based analyses can be examined in the framework replacing MAVT by another MCDA method to perform the aggregation of judgements (Simple Scoring Model (SSM), AHP, TOPSIS, and PROMETHEE) [43,44,45,46,47,48,49,50,51,52]:
- ■
- Simple Scoring Model (SSM) [49] uses a linear additive model assuming that the overall score for a given alternative is evaluated as the total sum of the performance score on each criterion multiplied by the weight of that criterion.
- ■
- Technique for Order Preference by Similarity to the Ideal Solution (TOPSIS) [50] calculates the geometric distance between each alternative and the ideal and anti-ideal alternatives and assumes that the more preferable option should have the shortest distance from the most desirable (ideal) alternative and the longest distance from the less desirable (anti-ideal) alternative.
- ■
- Preference Ranking Organization Method for Enrichment Evaluations (PROMETHEE) [51] is an outranking method which implies forming a partially ordered relation between each pair of alternatives.
- ■
- Analytic Hierarchy Process (AHP) [52] is based on pairwise comparisons of alternatives against each criterion using specialized AHP scale, determination of weights based on pairwise comparisons of criteria through hierarchy, determination of scores through eigenvectors for the maximum eigenvalue and evaluation of the overall score using a linear additive model.
These methods are based on different methodological foundations and implement different decision rules. An overview of an application of these methods to evaluation and aggregation judgment measures for performance comparison of nuclear energy systems can be found in [16]. The parameters for comparisons were selected in accordance with recommendations discussed in [12].
Table 7 demonstrates the comparison of ranking results (ranks of options) obtained using different MCDA methods for the ‘equal weighting’ case. It is evident that the use of different methods leads to well-coordinated and identical ranking results: minor differences in ranks order occur only for NFCs families indicated in Section 4.3 and can be explained by an impact of the specifics of the implemented decision rules. Of note, the same tendency is observed for other considered weighting options. As these methods are based on different methodological approaches, their application here significantly contributes to paper conclusions on the stability of ranking results with respect to the selection of a decision rule.
5. Survey of Radwaste Characteristics and NFC Environmental Footprint in LCA Assessments
In this section the waste inventories and the important characteristics of the NEA/OECD NFC options 1a-3cV2 are addressed. To discuss the interfaces of nuclear energy systems with the ecosystem the literature survey was performed and, on this basis, the sustainability indicators were selected which allow comparing the environmental footprint of the nuclear to the non-nuclear alternative energy generating technologies. The global approach to sustainability requires the treatment of each technology option in at least four dimensions: technological, economic, environmental and social. The multiple interfaces of the NESs with the environment are important and have been studied in the IAEA/INPRO document [53] (see Figure 11), the US DOE study [27] and Refs. [54,55,56,57,58,59,60].
Here, only the main results will be summarized.
(1) Waste characteristics: In principle, the volume of nuclear waste produced by nuclear installations is relatively small compared to wastes from other large-scale energy-generating technologies. Annually, ca. 200,000 m3 of low- and intermediate-level radioactive wastes (LLW or ILW, respectively) and ca. 10,000 m3 or 12,000 tonnes of HLW (including SNF declared as waste) are produced worldwide [6]. The SNF inventories (in tonnes of heavy metal (tHM)) amounted in the reference year 2016 to 1833 (arising) and the cumulative inventory stored to 52,359 in storage for all but three NEA/OECD member countries.
The operations in the front-end of NFC associated with the production of nuclear energy and the back-end (associated with production, decommissioning and disposal) generate waste which has to be adequately managed. Wastes’ arising at different NFC facilities and due to different NFC technical processes are usually subdivided in different classes and categories according to their characteristics. These classes determine further treatment of waste and ensure the safe management of radionuclides. This classification is based on the volumes, activity and radiotoxicity of waste arising at each stage of NFC including the reactor operation and decommissioning. The representative characteristics of wastes generated in a fuel cycle can be found in [21] (see Table 8).
(2) Waste categories: The radioactive wastes can be categorized according to various criteria. Nuclear power plant operator would, for instance, apply a categorization based on the waste originating stream. A classification system which takes into account qualitative considerations affecting a disposal, adopts usually the IAEA classification groups: HLW, LILW-LL (Low and Intermediate Level Waste–Long Lived) and LILW-SL (Short-Lived), respectively. This classification system distinguishes radioactive waste on the base of the thermal hazard and a disposal type that is required. HLW requires geological disposal because it comprises the strongly radioactive inventory of fission products and actinides, separated during the reprocessing of used fuel. SNF if declared as waste belongs to HLW as well. Apart from this radwaste any waste which generates decay heat-load higher than ca. 2 kW/m3 is classified as HLW. Wastes requiring shielding, but dissipating small amount of heat during their handling and transportation build the LILW category. This category of waste generates low heat (<2 kW/m3) and is usually broken down into two subcategories due to different type of containment required for long-lived radionuclides and alpha-emitters: both, the LL with half-life times greater than 30 years and the SL which requires geological disposal and the SL being disposed in surface facilities, respectively. Some countries limit the LL alpha-emitters to 400 Bq/g in near surface disposal facilities considering also the LL beta emitters I-129 and Tc-99 for geological disposal.
(3) Waste volumes: The total amount of LLIW-SL, LLIW-LL and HLW assessed by NEA/OECD expert group for each fuel cycle option is shown in Figure 12, Figure 13 and Figure 14 respectively. Option-1d (DUPIC based NFC) was not considered previously in sections dedicated to the MCDA framework because of lack of indicator values for 1d needed to include DUPIC in the comparative performance study.
The lack of data on the amount of LILW-SL caused that the NEA/OECD experts had to make similar assumptions for the waste streams of many NFCs. A small variability of waste volumes shown in Figure 12 reflects these assumptions, however this figure clearly demonstrates that the plant operation waste dominates the other waste generated by NFC facilities.
The amount of LILW-LL depends on the SNF reprocessing technology and a number of steps needed to separate fissionable materials. The waste volume depends on the conditioning technology; therefore, the data presented in Figure 13 only have a preliminary character.
The volume of HLW is mainly defined by the waste loading factor at conditioning which is, in many cases, limited by the amount of fission products. The inventory of minor actinides contained in the waste does not dramatically impact the HLW volume. The volume of waste in option 1a corresponds to the volume of the fuel sub assembly.
The amount of decommissioning waste shown in Figure 15 and Figure 16 is dependent on the number of decommissioning steps; thus reactors are the largest contributors for all NFCs.
Of note, the current technologies are not yet optimized for the composition of waste streams produced by the advanced separation technologies, especially pyrochemical technologies and this fact has an impact on HLW volume. The majority of LILW-LL is attributed to reprocessing activities. The differences between the options are small but the data are biased with large uncertainties because of lack of available experimental data on secondary waste flows.
(4) Environmental footprint of NFC options: Results of extensive studies performed to assess the environmental footprint of nuclear energy systems can be found in Refs. [53,54,55,56,57,58,59,60]. To perform Life Cycle Assessment (LCA), different methodologies can be applied. The methodology in [53] uses the classical PCA (Process Chain Analysis) approach. It considers
- (1)
- the annual emissions;
- (2)
- the environmental impact assessment penalty (EIAP) originating from the plant construction averaged on its whole lifetime;
- (3)
- the EIAP due to cleaning and decommissioning (cradle to grave); and
- (4)
- the EIAP from the transports between all fuel facilities.
For the French reactor fleet only the “first order, i.e., parent contributions” were assessed what means that the technological chain was cut-off at the level of the first sub-system. Both historical and published data were used. Indicators were normalized to the nuclear energy production in France in 2010 which amounted to 408 TWhe. Selected indicators which were evaluated are: GHG and atmospheric pollutions (SOx and NOx emissions), water pollution, land-use water consumption, water withdrawal and the technological waste generated.
The relative share (in %) of each stage of the fuel cycle to the overall environmental and technological indicators calculated for French Twice Through Cycle (TTC, corresponding to the option 1b) are illustrated in Figure 17.
During the operation of facilities involved in each NFC option, different radionuclides might be released into the atmosphere and into the aqueous media with the main contributors: radon and other noble gases, then tritium, C-14 and other radionuclides. These radioactive releases are well below the permissible threshold values (both authorization and regulation thresholds) and have a negligible heath impact (below 10 µSV/year). Figure 18 shows the radwaste indicators for NFC option 1a.
(5) Environmental footprint of nuclear and non-nuclear energy-producing technologies: Data published in Ref. [60] allow comparing environmental footprint of nuclear technology with the footprint of other energy-producing sources as coal, oil/gas, hydro, wind, PV (photovoltaics), and biomass. Comparison of selected indicators’ values for each technology is shown in Figure 19.
In general, it can be demonstrated that the indicator values associated with the nuclear energy production reach in most cases the lower range limit of the indicator local scales. Moreover, these values lay often very close to the values of the corresponding indicator for renewables. This underpins the significant potential of nuclear technology to minimize the impact of GHG emission (by two orders of magnitude) in comparison to fossil energy and by factor of 8 with respect to the PV energy. As concerns SOx and NOx emissions nuclear performs worse than hydro and wind options (see, for example [54,56]), but better than PV and fossil options. In view of the potential impact indicators: Acidification and eutrophication, nuclear option occupies a second best position ([54,55,56,57,58,59,60]) after hydroelectricity, but well before any remaining options inclusive wind power and PV. The nuclear energy land-use is the lowest one in spite the high impact of mining. Indicators levels connected to water pollution are well below the performance of coal, gas, PV, biomass and wind but worse than hydro. Technological waste indicator value is ca. four orders of magnitude lower than the coal option indicator, lower by a factor 3 × 10⁻² than oil/gas indicator and ca. three orders of magnitude (7 × 10⁻²) lower as compared to biomass indicator and very close to PV, only hydro and wind options perform better.
6. General Discussion
The INPRO/IAEA holistic approach to sustainability of nuclear fuel cycles recommends that the nuclear technology should be feasible, viable, affordable, and safe, reduce resource consumption and liabilities, have small environmental footprint, minimal invasive impacts on both human beings and the ecosystem and offer an acceptable solution for the structural problems of our societies, economically, socially and ethically [12]. As concerns the environmental impacts advanced NFCs strive for the waste reduction, i.e., offer a reduced footprint of HLW repository due to a reduced waste volume to be disposed of. A remote handling of HLW and, if necessary the LILW, can be implemented in the majority of NFC facilities e.g. for fuel fabrication and reprocessing of used fuel in SNF recycling. A complete flow chart of the environmental stressor analyses is shown in Figure 20 [53]. Some effects of stressors on the environment have been already discussed here in Section 5.
Table 9 summarizes the main findings regarding the overall performance of the considered NFC options for different stakeholders’ preferences and other relevant circumstances. In particular, this table demonstrates that, in the mid-term, partly closed NFCs (2c, 2cV) represent the best trade-off among the other NFC options providing benefits to the SNF/HLW repository programs, improved use of the nuclear resource and affordable investment and NFC costs. However, in the long-term fast reactor based nuclear energy systems have, as soon as a deployment maturity is reached, a higher potential to offer even better performances.
These results demonstrate that, from the technological perspective, nuclear technology itself is a very flexible one and if deployed properly may allow subject-matter experts, decision makers and stakeholders reaching different objectives. The challenge of the decision making process is to organize appropriate expertise for comparisons of NFC options in such a way that it would be possible to articulate (and incorporate by trading-off ) the contradicting judgments, intentions, and capabilities of all concerned parties.
Due to the limited scope of the study, the results of the analyses obviously cannot form the basis for substantiation of management decisions; however, this paper is, in authors’ opinion, quite sufficient to demonstrate the basic methodological aspects related to the application of MCDA methods for ranking of NFC options. The main benefit of aggregation of expert judgments based on formal mathematical methods is that it gives a possibility of structuring the discourse and better organize an efficient expertise. This procedure helps finding the most prospective among the NFC options and demonstrates, on a quantitative basis, the merits and demerits of the compared alternatives. Thereby, well-reasoned judgments on options’ attractiveness are possible in spite of problem complexity.
Such type of analysis can form the basis for management decisions and can contribute to the elaboration of a concerted (trade-off) position on the most prospective NFC options, if an expertise involving both proponents and opponents is elicited. Particular attention should be given to the discussion of issues related to subjective and objective uncertainties and risks which should be incorporated into the analyses. This is an important aspect since today both the new technologies and the scenario assumptions are still characterized by significant uncertainties.
7. Conclusions
Electrical energy generation based on nuclear technologies can compete with the other energy generating technologies because of its constant capacity factor, low GHG emissions and the provisions taken on the management of hazardous waste generated as a by-product. In each country, management of radioactive waste (as of any other industrial waste) is subject to the general legal framework. Practice shows that the majority of nuclear power-holding countries, first accumulates the inventory of high-level wastes that cannot be accepted directly in near-surface or subsurface disposal facilities to dispose them later, in the mid- or long-term, in a deep geological repository for the final safe enclosure. This strategy is technically feasible and permits a complete waste isolation from the biosphere in the future. However, it might impose considerable economic burden if the surface interim storage duration had to be several times prolonged.
In practice, the range of R&D efforts towards the safe waste disposal is dependent on national conditions like, for instance, available geological formations, and amount and specific characteristics of nuclear waste legacy which is mainly determined by its isotopic composition. The latter must be assessed in order to develop a detailed HLW repository design (both with retrievable or non-retrievable options) and size. Therefore, already long time ago the technology-holding countries have established the expert organizations and authorities responsible for a design and licensing of the final HLW disposal. These organizations conduct and coordinate the R&D activities on safety assessment studies, on minimization of the impact on the environment, and on site robustness tests for predictable response performance to uncertainties.
The vulnerability of nuclear technology cannot be attributed to its intrinsic features but is rather caused by its implementation and joint to NFC exploitation specifics in combination with a human factor and natural catastrophes. However, the risk of nuclear power accidents is negligibly small and amounts 0.003 events per plant per year while estimated over time since 1952 [61].
All NFC types, including the advanced closed NFCs with multiple recycling of fissionable materials, have in common that both the front- and the back-end- fuel production stages generate radioactive waste. Nevertheless, nuclear power production is among others the only large-scale energy-generating technology which assumes full responsibility for all its waste forms with the provision made for including a priori the waste management costs into the total final electricity price. Moreover, there are mature proven technologies, which, if implemented at each stage of NFC, are able to safeguard the safe high-, intermediate- and low-level waste disposal. Advanced nuclear energy systems have a potential to minimalize the impact of nuclear technology on the environment and human beings hence innovative nuclear energy systems would be able to fulfil the goals of sustainable development.
The comparative evaluation of nuclear energy system options can be performed even by non-experts applying the MCDA-based frameworks provided the experts give a support to this process. The expert groups should make the technical assessment of the performance indicators on the selected criteria for each considered option. The MCDA framework includes screening, prioritizing, selecting and ranking of the alternatives on the basis of human judgement, i.e., multi-criteria approach with often conflicting criteria. Thereby, this framework has to encompass the construction of the objectives hierarchy structure, selection of the performance indicators, choice of the preference/value functions, the weights and a judgement aggregation rule. The evaluation procedure delivers scores for each option implying an overall ranking order of NFC options. NFC ranking may iteratively support a decision-making process on the base of a trading-off between both alternatives and weights (swing weight technique).
The generic case study carried out here by means of the MCDA methodology and the discussion of the results evidences, the benefits of application of the MCDA-based framework to the policy/strategy selection process. In practical situations, however, the laborious stage of preference elicitation must precede the evaluation stage because the preferences and priorities are significant country specific elements of analyses. Moreover these parameters determine the single attribute preference/value function shape and the high-level objective weights. In the situation where a multi-group, “democratized” decision–making process is strived for, opinions of different stakeholders, experts, or decision-makers groups can be easily incorporated into the framework using various sets of elicited weights. However, before attaching the “true” weights to the criteria, a consensus within each group has to be obtained. In this way the stakeholders/experts valuations can be combined with the technical performance indicators of options and both of them constitute the most significant part of input for the MCDA-driven method.
In the paper a finite set of explicitly defined NFC options with key indicators assessed by NEA/OECD expert group “WASTEMAN” was used and a judgement aggregation was done applying the MAVT-based method. The MAVT approach includes mapping of each local attribute/indicator scoring/value scale into a common scale and the employment of multi-attribute judgement aggregation rule combining the indicators, the value functions and the low- and high-level-objective weights to the overall NFC score. Linear single-attribute value functions were chosen here because the constant slope (first order derivative value) implies an indifferent attitude of a decision maker towards the changes of the rate of function values versus the incremental change of an indicator value.
The ranking results show, that options belonging to the group-3 offer the most attractive waste management strategy, and have the highest potential to fulfil the sustainability goals. This ranking result is rather stable. The NFCs of group-2 are a good trade-off. NFCs belonging to group-1 exhibit the worst performance in view of sustainability criteria.
Extensive sensitivity analysis was additionally performed to examine the robustness of ranking results with respect to the value function shape’s and the weight assignment’s variations. It was proved that embedding other MCDA methods in the proposed framework instead of MAVT had no dramatic impact on the ranking order. Additionally, extensive stochastic analyses based on the Monte Carlo method have been performed in order to treat the uncertainties in weight values and investigate their impact on the ranking order. The generated box- and whisker-chart demonstrates the dynamic variation of NFC ranking order established w.r.t. the “base-case”, i.e., the equal high- and low-level-objective weights, respectively. Moreover, this box provides additional information on ranking robustness by estimating the preference value probabilities.
The framework applied in this paper offers a high degree of flexibility. The base case weights and the indicator scale ranges can be adapted to the particular needs. A key feature of decision modeling is, however, the iterative way of proceeding. Feedback from participants contributing to a decision-making process at each iteration step is an essential issue refining the model.
In summary, the presented study confirms that nuclear technology might be clean, safe, reliable and affordable provided the proven technologies available to safeguard the operation of both the power plants and the NFC facilities reprocessing/storing the generated wastes are respected rigorously. The weak point seems to be not a technology but a human factor, i.e., a technology implementation due to its specifics and risk, and a way of realization and operation which sometimes might violate the experts’ recommendations.
Acknowledgments
The authors would like to acknowledge the international organizations’ NEA/OECD expert groups and IAEA projects whose results were cited in the paper, especially the INPRO/IAEA section coordinating the KIND/INPRO project on “MCDA application to comparative evaluation of nuclear energy systems”. A.S.-F. is the NEA German expert and contributed to the NEA Expert Groups: WASTEMAN and Transition Fuel Cycle Scenario Studies launched by the Working Party on Nuclear Fuel Cycle. Both authors (A.S.-F. and A.A.) contributed to the KIND/INPRO project.
Conflicts of Interest
The authors declare no conflict of interest.
Abbreviations
| ADS | Accelerator Driven System |
| AHP | Analytic Hierarchy Process |
| EIAP | Environmental Impact Assessment Penalty |
| EU | Enriched Uranium |
| EFR | European Fast Reactor |
| FR | Fast Reactor |
| IAEA | International Atomic Energy Agency |
| ILW | Intermediate Level Waste |
| INPRO | International Project on Innovative Nuclear Reactors and Fuel Cycles |
| GHG | Greenhouse Gasses |
| HLW | High-level Wastes |
| OECD | Organization for Economic Cooperation and Development |
| KIND | Key Indicators for Innovative Nuclear Energy Systems |
| LCA | Life Cycle Analysis |
| LL | Long Lived |
| LLW | Low-level Waste |
| LILW-LL | Low Intermediate Level Waste-Long Lived |
| LILW-SL | Low Intermediate Level Waste-Short-Lived |
| LWR | Light Water Reactor |
| MAVT | Multi-attribute Value Theory |
| MCDA | Multi-criteria Decision Analysis |
| MOX | Mixed Oxide fuel |
| NEA | Nuclear Energy Agency |
| NFC | Nuclear Fuel Cycle |
| PCA | Process Chain Analysis |
| PROMETHEE | Preference Ranking Organization Method for Enrichment Evaluations |
| PWR | Pressurized Water Reactor |
| Radwaste | Radioactive Waste |
| R&D | Research and Development |
| SL | Short-Lived |
| SNF | Spent Nuclear Fuel |
| SSM | Simple Scoring Model |
| TOPSIS | Technique for Order Preference by Similarity to the Ideal Solution. |
| tHM | tonnes of Heavy Metal |
| TRU | Transuranium elements |
| TTC | Twice Through Cycle |
| UOX | Uranium Dioxide Fuel |
| VLLW | Very Low Level Wastes |
| WASTEMAN | WASte MANagement acronym of the NEA/OECD study |
References
- International Energy Agency. Energy Technology Perspectives; IEA: Paris, France, 2017. [Google Scholar]
- International Atomic Energy Agency (IAEA). Nuclear Technology Review 2016; GC(60)/INF/2; IAEA: Vienna, Austria, 2017. [Google Scholar]
- Crossland, I. (Ed.) Nuclear Fuel Cycle Science and Engineering; Woodhead Pub.: Cambridge, UK; Philadelphia, PA, USA, 2012. [Google Scholar] [CrossRef]
- International Atomic Energy Agency (IAEA). The Fukushima Daiichi Accident. Report by the Director General; GC(59)/14; IAEA: Vienna, Austria, 2015. [Google Scholar]
- World Nuclear Association (WNA). Chernobyl Accident 1986. Available online: http://www.world-nuclear.org/information-library/safety-and-security/safety-of-plants/chernobyl-accident.aspx (accessed on 14 August 2017).
- International Atomic Energy Agency (IAEA). Policies and Strategies for Radioactive Waste Management; IAEA Nuclear Energy Series No. NW-G-1.1; IAEA: Vienna, Austria, 2009. [Google Scholar]
- Schwenk-Ferrero, A.; Andrianov, A. Nuclear Waste Management Decision-Making Support with MCDA. Sci. Technol. Nucl. Install. 2017, 2017, 20. [Google Scholar] [CrossRef]
- Schwenk-Ferrero, A. German spent nuclear fuel legacy: Characteristics and high-level waste management issues. Sci. Technol. Nucl. Install. 2013, 2013, 11. [Google Scholar] [CrossRef]
- International Atomic Energy Agency (IAEA). International Status and Prospects for Nuclear Power 2017; Report GOV/INF/2017/12-GC(61)/INP/8; IAEA: Vienna, Austria, 2017. [Google Scholar]
- Nuclear Energy Agency (NEA). Trends in the Nuclear Fuel Cycle: Economic, Environmental and Social Aspects; OECD: Paris, France, 2001. [Google Scholar]
- National Environment Agency (NEA). Generation IV Cost Estimating Guidelines Revision 4; GIF EMWG, OECD: Paris, France, 2007.
- International Atomic Energy Agency (IAEA). Guidance for the Application of an Assessment Methodology for Innovative Nuclear Energy Systems; Final Report of Phase 1 of the International Project on Innovative Nuclear Reactors and Fuel Cycles (INPRO), IAEA-TECDOC-1575; IAEA: Vienna, Austria, 2007. [Google Scholar]
- Andrianov, A.; Kuznetsov, V.; Kuptsov, I.; Fesenko, G. INPRO activities on development of advanced tools to support judgement aggregation for comparative evaluation of nuclear energy systems. Sci. Technol. Nucl. Install. 2014, 2014, 15. [Google Scholar] [CrossRef]
- Yoon, S.; Choi, S.; Ko, W. An Integrated Multicriteria Decision-Making Approach for Evaluating Nuclear Fuel Cycle Systems for Long-term Sustainability on the Basis of an Equilibrium Model: Technique for Order of Preference by Similarity to Ideal Solution, Preference Ranking Organization Method for Enrichment Evaluation, and Multiattribute Utility Theory Combined with Analytic Hierarchy Process. Nucl. Eng. Technol. 2016, 49, 148–164. [Google Scholar] [CrossRef]
- Andrianov, A.A.; Murogov, V.M.; Kuptsov, I.S. Towards sustainable nuclear power development. Int. J. Nucl. Power 2014, 59, 287–293. [Google Scholar]
- Andrianov, A.; Kanke, V.; Kuptsov, I.; Murogov, V. Reexamining the ethics of nuclear technology. Sci. Eng. Ethics 2015, 21, 999–1018. [Google Scholar] [CrossRef] [PubMed]
- Kuznetsov, V.; Fesenko, G.; Schwenk-Ferrero, A.; Andrianov, A.; Kuptsov, I. Innovative Nuclear Energy Systems: State-of-the Art Survey on Evaluation and Aggregation Judgment Measures Applied to Performance Comparison. Energies 2015, 8, 3679–3719. [Google Scholar] [CrossRef]
- Bouyssou, D.; Marchant, T.; Pirlot, M.; Tsoukiàs, A.; Vincke, P. Evaluation and Decision Models with Multiple Criteria; International Series in Operations Research & Management Science; Springer: New York, NY, USA, 2006. [Google Scholar]
- Zopounidis, C.; Pardalos, P.M. Handbook of Multicriteria Analysis, Applied Optimization; Springer: New York, NY, USA, 2010. [Google Scholar]
- Greco, S.; Ehrgott, M.; Figueira, J.R. (Eds.) Multiple Criteria Decision Analysis, State of the Art Surveys; Springer: New York, NY, USA, 2016. [Google Scholar]
- Nuclear Energy Agency. Advanced Nuclear Fuel Cycles and Radioactive Waste Management; Report NEA No. 5990; OECD: Paris, France, 2006; Available online: https://www.oecd-nea.org/ndd/pubs/2006/5990-advanced-nfc-rwm.pdf (accessed on 14 August 2017).
- Andrianov, A.; Kuptsov, I. Solution of resource allocation problem for identification of cost-effective measures to reduce nuclear proliferation risks. Nucl. Energy Cross. 2013, 1, 594–597. [Google Scholar]
- Andrianov, A.; Kuptsov, I.; Utyanskaya, T. Application of Multi-Objective and Robust Optimization Methods for a Comparative Evaluation of Nuclear Energy System Deployment Scenarios. Available online: http://dx.doi.org/10.1016/j.nucet.2016.05.006 (accessed on 7 September 2017).
- Andrianov, A.; Korovin, Y.; Kuptsov, I.; Murogov, V.; Andrianova, O. Consideration of Economic Risks in a Comparative Analysis of Nuclear Technologies with Different Maturity Levels, Nuclear Energy and Technology. Available online: http://dx.doi.org/10.1016/j.nucet.2017.05.012 (accessed on 7 September 2017).
- Wigeland, R.; Taiwo, T.; Todosow, M. Advanced Nuclear Fuel Cycle Options. In Proceedings of the ICAPP ’10, San Diego, CA, USA, 13–17 June 2010. [Google Scholar]
- International Atomic Energy Agency (IAEA). Framework for Assessing Dynamic Nuclear Energy Systems for Sustainability, Final Report of the INPRO Collaborative Project on Global Architectures of Innovative Nuclear Energy Systems with Thermal and Fast Reactors and a Closed Nuclear Fuel Cycle. Available online: http://www-pub.iaea.org/MTCD/Publications/PDF/Pub1598_web.pdf (accessed on 7 September 2017).
- Cooper, M.W.D.; Grimes, R.W.; Fitzpatrick, M.E.; Chroneos, A. Modeling Oxygen Self-Diffusion in UO under Pressure. Available online: http://dx.doi.org/10.1016/j.ssi.2015.09.006 (accessed on 7 September 2017).
- Chroneos, A.; Rushton, M.J.D.; Jiang, C.; Tsoukalas, L.H. Nuclear Wasteform Materials: Atomistic Simulation Case Studies. Available online: http://dx.doi.org/10.1016/j.jnucmat.2013.05.012 (accessed on 7 September 2017).
- Crawford, D.C.; Porter, D.L.; Hayes, S.L. Fuels for Sodium-Cooled Fast Reactors: US Perspective. Available online: http://dx.doi.org/10.1016/j.jnucmat.2007.05.010 (accessed on 7 September 2017).
- Parfitt, D.C.; Cooper, M.W.D.; Rushton, M.J.D. Thermodynamic calculations of oxygen self-diffusion in mixed-oxide nuclear fuels. RSC Adv. [CrossRef]
- Ashley, S.F.; Parks, G.T.; Nuttall, W.J. Nuclear energy: Thorium fuel has risks. Nature 2012, 492, 31–33. [Google Scholar] [PubMed]
- Ruggieri, J.M.; Tommasi, J. International Code System for GEN IV Fast Reactor Analysis. In Proceedings of the ICAPP ’06, Reno, NV, USA, 4–8 June 2006. [Google Scholar]
- Sanchez, R.; Zmijarevic, I. APOLLO2 YEAR 2010. Nucl. Eng. Tech. 2010, 42, 5. [Google Scholar] [CrossRef]
- Commissariat à L’énergie atomique. Les Codes de Calcul de la Neutronique et le Calcul Haute Performance. Available online: http://www.cea.fr/Documents/monographies/La%20neutronique%20-%20Les%20codes.pdf (accessed on 14 August 2017).
- Vidal, J.M.; Eschbach, R.; Launay, A.; Binet, C.; Thro, J.F. CESAR5.3: An Industrial Tool for Nuclear Fuel and Waste Characterization with Associated Qualification. In Proceedings of the WM2012 Conference, Phoenix, AZ, USA, 26 February–1 March 2012. [Google Scholar]
- Keeney, R.; Raiffa, H. Decision with Multiple Objectives; John Wiley & Sons: New York, NY, USA, 1976. [Google Scholar]
- Belton, V.; Stewart, T. Multiple Criteria Decision Analysis: An Integrated Approach; Kluwer Academic: Dordrecht, The Netherlands, 2002. [Google Scholar]
- Von Winterfeldt, D.; Edwards, W. Decision Analysis and Behavioral Research; Cambridge University Press: Cambridge, UK, 1986. [Google Scholar]
- Wigeland, R.; Taiwo, T.; Ludewig, H.; Halsey, W.; Gehin, J.; Buelt, J.; Stockinger, S.; Kenni, K.; Todosow, M.; Jubin, R. Nuclear Fuel Cycle Evaluation and Screening. Final Report “Fuel Cycle Research Development”; FCRD-FCO-2014-000106; US Department of Energy: Washington, WA, USA, 2014.
- Lahdelma, R.; Hokkanen, J.; Salminen, P. SMAA—Stochastic multiobjective acceptability analysis. Eur. J. Oper. Res. 1998, 106, 137–143. [Google Scholar] [CrossRef]
- Lahdelma, R.; Salminen, P. SMAA-2: Stochastic multicriteria acceptability analysis for group decision making. Oper. Res. 2001, 3, 444–454. [Google Scholar] [CrossRef]
- Wang, H.; Jiao, W.; Lahdelma, R.; Zhu, C.; Zou, P. Stochastic multicriteria acceptability analysis for evaluation of combined heat and power units. Energies 2015, 8, 59–78. [Google Scholar] [CrossRef]
- Løken, E. Use of multicriteria decision analysis methods for energy planning problems. Renew. Sustain. Energy Rev. 2007, 11, 1584–1595. [Google Scholar] [CrossRef]
- Huang, I.B.; Keisler, J.; Linkov, I. Multi-criteria decision analysis in environmental sciences: Ten years of applications and trends. Sci. Total Environ. 2011, 409, 3578–3594. [Google Scholar] [CrossRef] [PubMed]
- Zavadskas, E.K.; Turskis, Z.; Kildienė, S. State of art surveys of overviews on MCDM/MADM methods. Technol. Econ. Dev. Econ. 2014, 20, 165–179. [Google Scholar] [CrossRef]
- Kabir, G.; Sadiq, R.; Tesfamariam, S. A review of multi-criteria decision-making methods for infrastructure management. Struct. Infrastruct. Eng. 2014, 10, 1176–1210. [Google Scholar] [CrossRef]
- Tscheikner-Gratl, F.; Egger, P.; Rauch, W.; Kleidorfer, M. Comparison of Multi-Criteria Decision Support Methods for Integrated Rehabilitation Prioritization. Water 2017, 9, 68. [Google Scholar] [CrossRef]
- Celik, E.; Gul, M.; Aydin, N.; Gumus, A.T.; Guneri, A.F. A comprehensive review of multi criteria decision making approaches based on interval type-2 fuzzy sets. Knowl Based Syst 2015, 85, 329–341. [Google Scholar] [CrossRef]
- US Department of Energy (DOE). Guidebook to Decision Making Methods; WSRC-IM-2002-00002; US DOE: Washington, DC, USA, 2001.
- Hwang, C.-L.; Yoon, K. Multiple Attribute Decision Making: Methods and Applications; Springer: Berlin, Germany, 1981. [Google Scholar]
- Brans, J.P.; Vincke, P. Note—A Preference Ranking Organisation Method: (The PROMETHEE Method for Multiple Criteria Decision-Making). Manag. Sci. 1985, 31, 647–656. [Google Scholar] [CrossRef]
- Saaty, T.L. The Analytic Hierarchy Process; McGraw-Hill: New York, NY, USA, 1980. [Google Scholar]
- IAEA. INPRO Methodology for sustainability Assessment of Nuclear Energy Systems: Environmental Impact of Stressors; In INPRO Manual; Nuclear Energy Series No. NG-T-3.15; IAEA: Vienna, Austria, 2016. [Google Scholar]
- Poinssot, C.; Bourg, S.; Ouvrier, N.; Combernoux, N.; Rostaing, C.; Vargas-Gonzalez, M.; Bruno, J. Assessment of the environmental footprint of nuclear energy systems. Comparison between closed and open cycles. Energy 2014, 69, 199–211. [Google Scholar] [CrossRef]
- IAEA Publisher. Assessment of Nuclear Energy Systems Based on a Closed Nuclear Cycle with Fast Reactors; IAEA INPRO Project Report IAEA-TECDOC-1639; IAEA: Vienna, Austria, 2010. [Google Scholar]
- Poinssot, C. Why Recycling the Actinides? A Sustainable Approach of Nuclear Fuel Cycles. Available online: http://www.sacsess.eu/Docs/IWSProgrammes/02-SACSESSIWS-Poinssot.pdf (accessed on 7 September 2017).
- Poinssot, C.; Rostaing, C.; Greandjean, S.; Boullis, B. Recycling the actinides, the cornerstone of any sustainable nuclear fuel cycles. Procedia Chem. 2012, 7, 349–357. [Google Scholar] [CrossRef]
- Poinssot, C.; Bourg, S.; Grandjean, S.; Boullis, B. The Sustainability, a relevant Approach for defining the Roadmap for future Nuclear Fuel Cycles. Procedia Chem. 2016, 21, 536–544. [Google Scholar] [CrossRef]
- Poinssot, C.; Bourg, S.; Boullis, B. Improving the nuclear energy sustainability by decreasing its environmental footprint. Guidelines from life cycle assessment simulations. Prog. Nucl. Energy 2016, 92, 234–341. [Google Scholar] [CrossRef]
- Turconi, R.; Boldrin, A.; Astrup, T. Life cycle assessment (LCA) of electricity generation technologies: Overview, comparability and limitations. Renew. Sustain. Energy Rev. 2013, 28, 555–565. [Google Scholar] [CrossRef] [Green Version]
- Wheatley, S.; Sovacool, B.K.; Sornette, D. Reassessing the safety of nuclear power. Energy Res. Soc. Sci. 2016, 15, 96–100. [Google Scholar] [CrossRef]
Figure 1.
The International Project on Innovative Nuclear Reactors and Fuel Cycles (INPRO/IAEA) holistic approach to NFC sustainability [11].
Figure 1.
The International Project on Innovative Nuclear Reactors and Fuel Cycles (INPRO/IAEA) holistic approach to NFC sustainability [11].
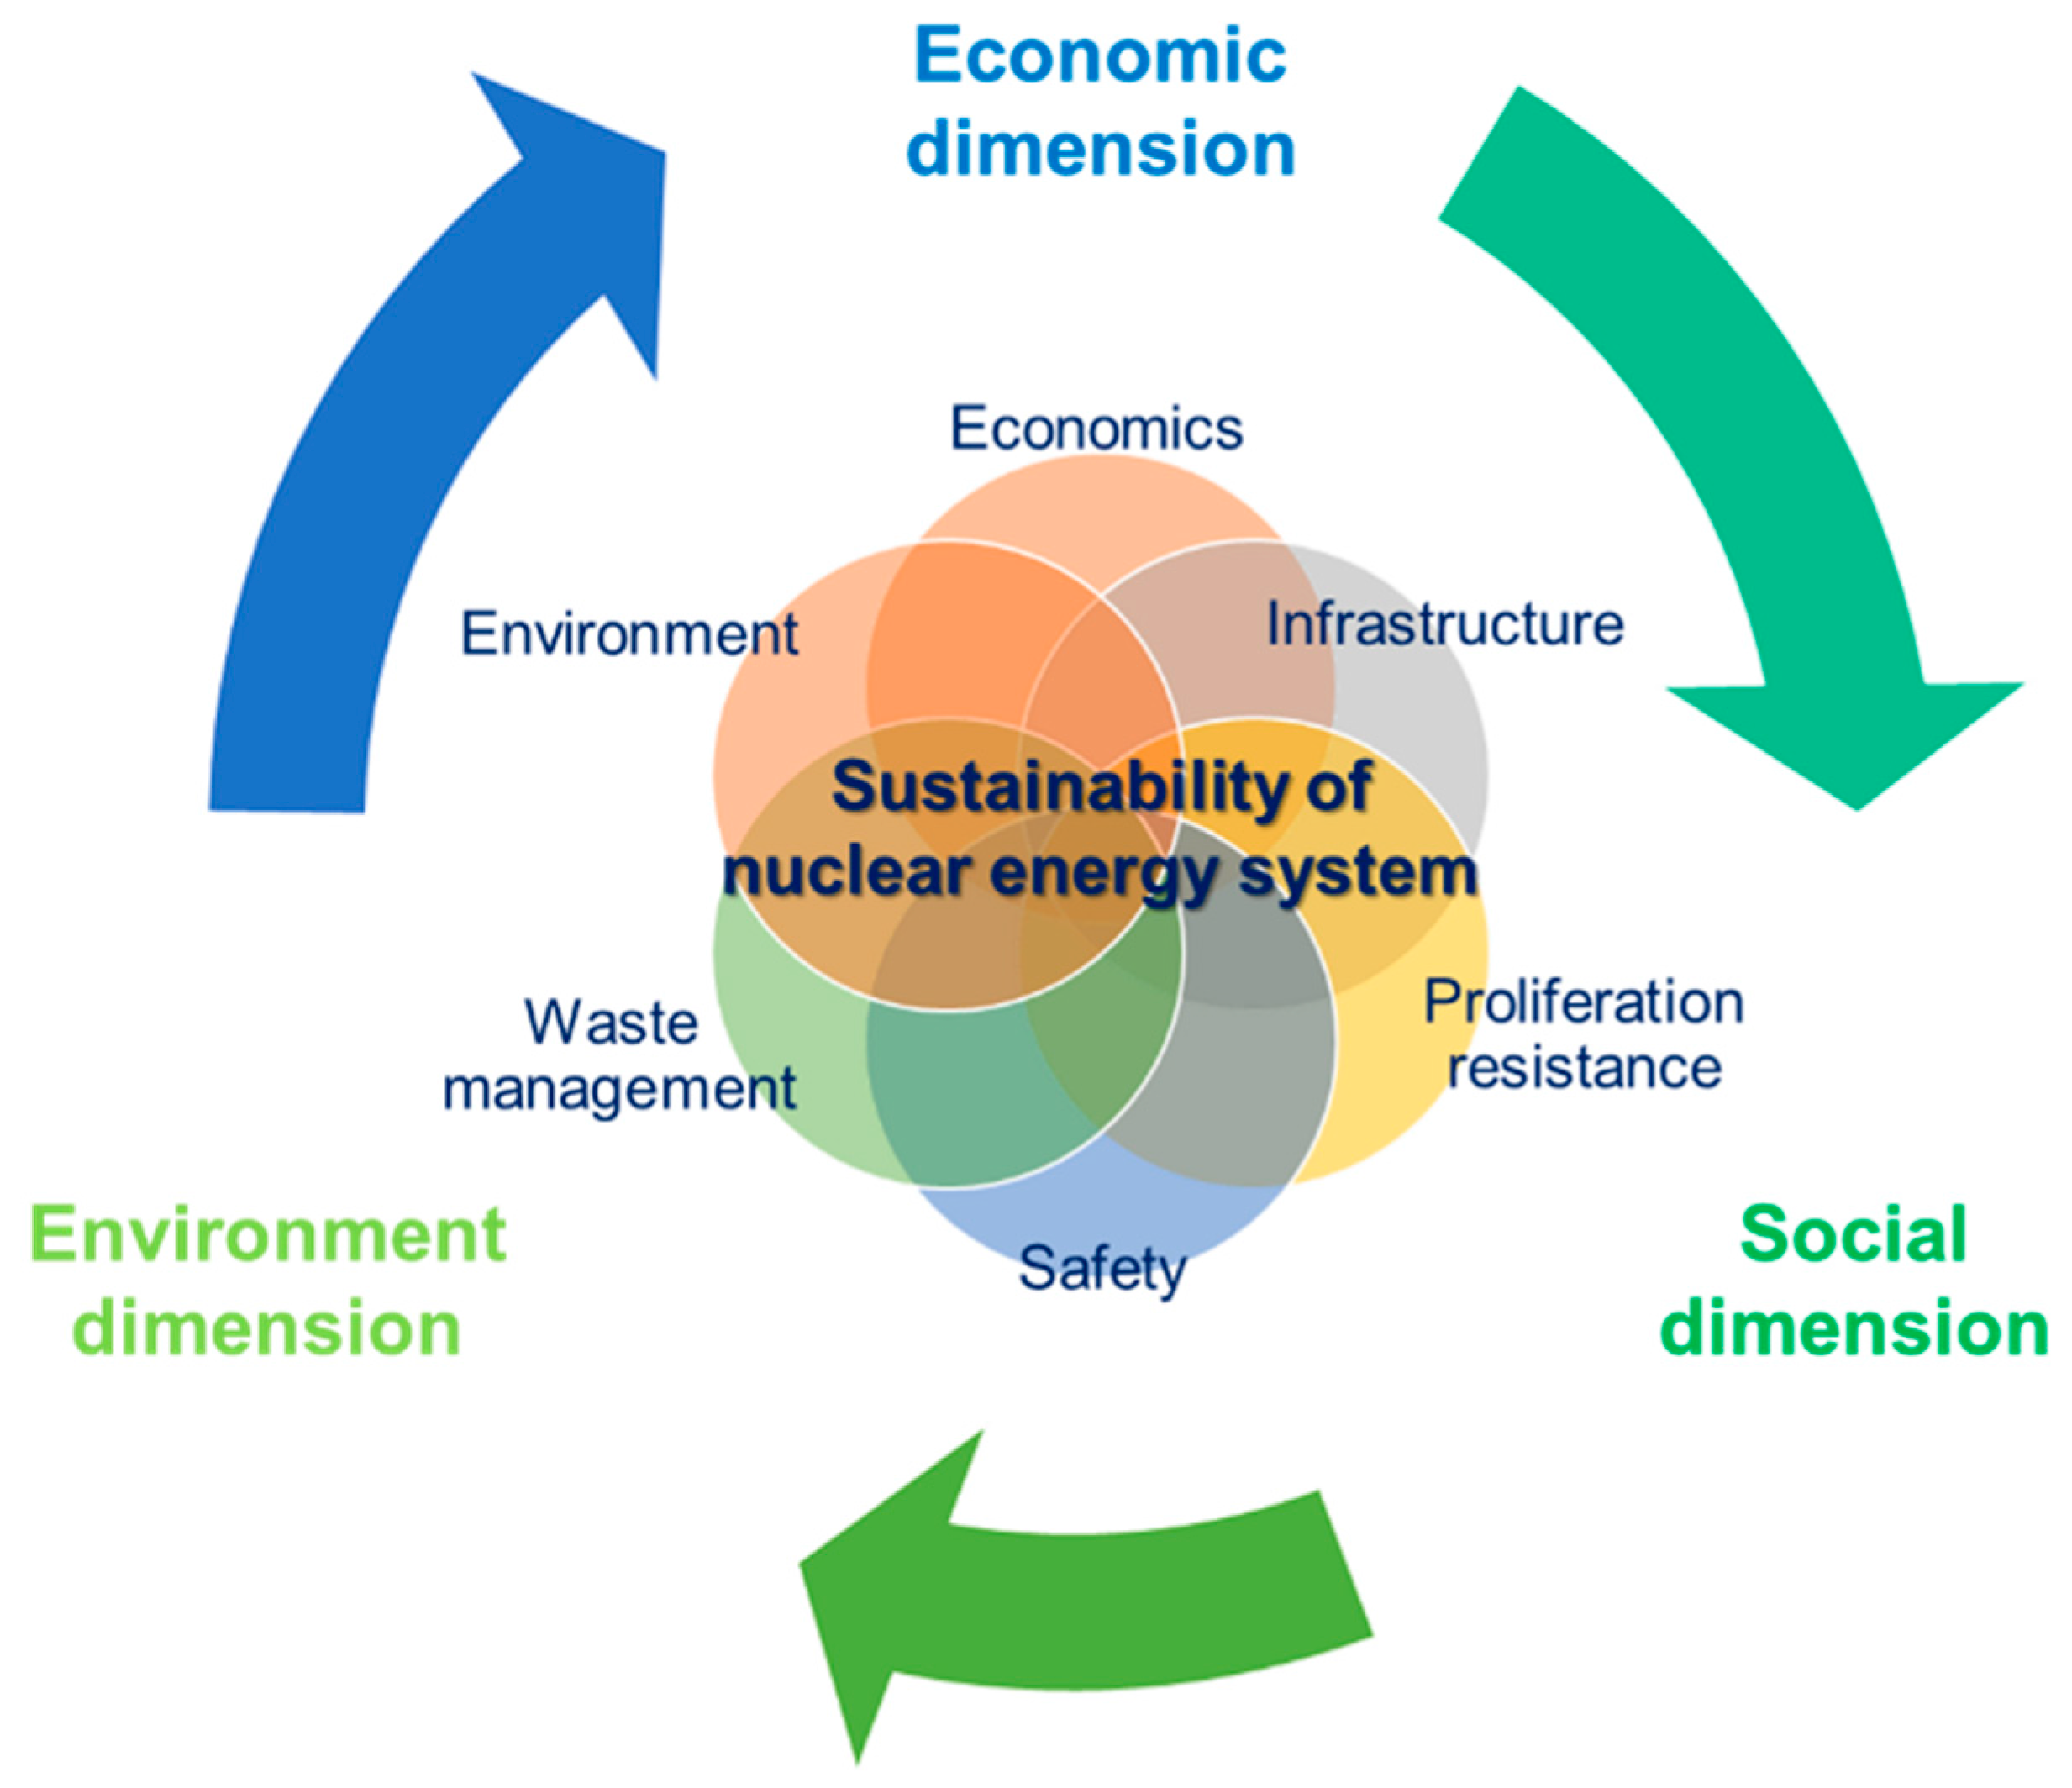
Figure 2.
Hierarchical structure of the objective tree.

Figure 3.
Value path.

Figure 4.
High-level objectives scores for NFC options (with a local equal weighting of criteria).
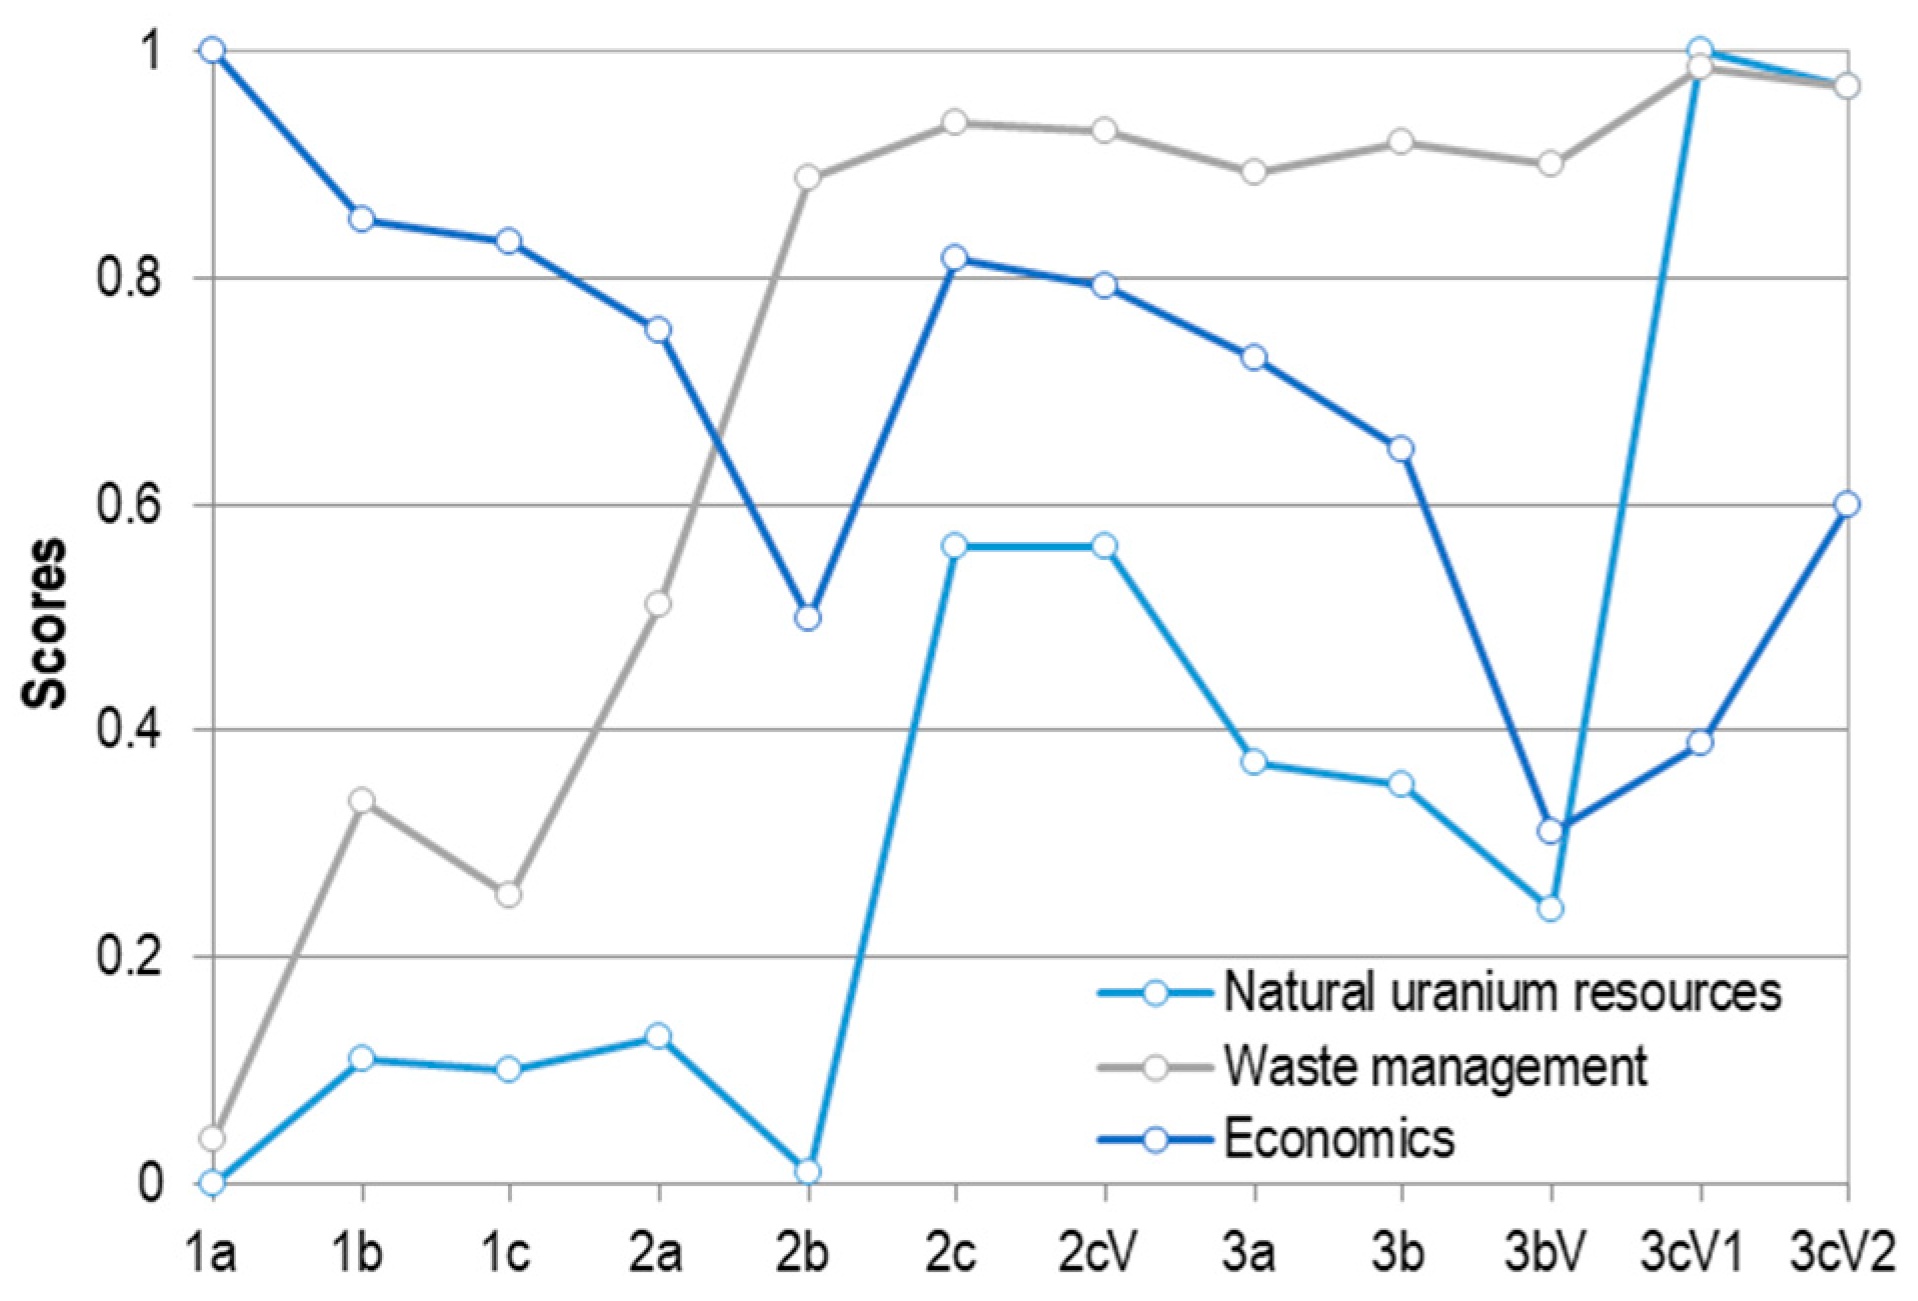
Figure 5.
Spread in calculated high-level objective scores due to uncertainty in weighting factors for: waste management (a); and economics (b).
Figure 5.
Spread in calculated high-level objective scores due to uncertainty in weighting factors for: waste management (a); and economics (b).
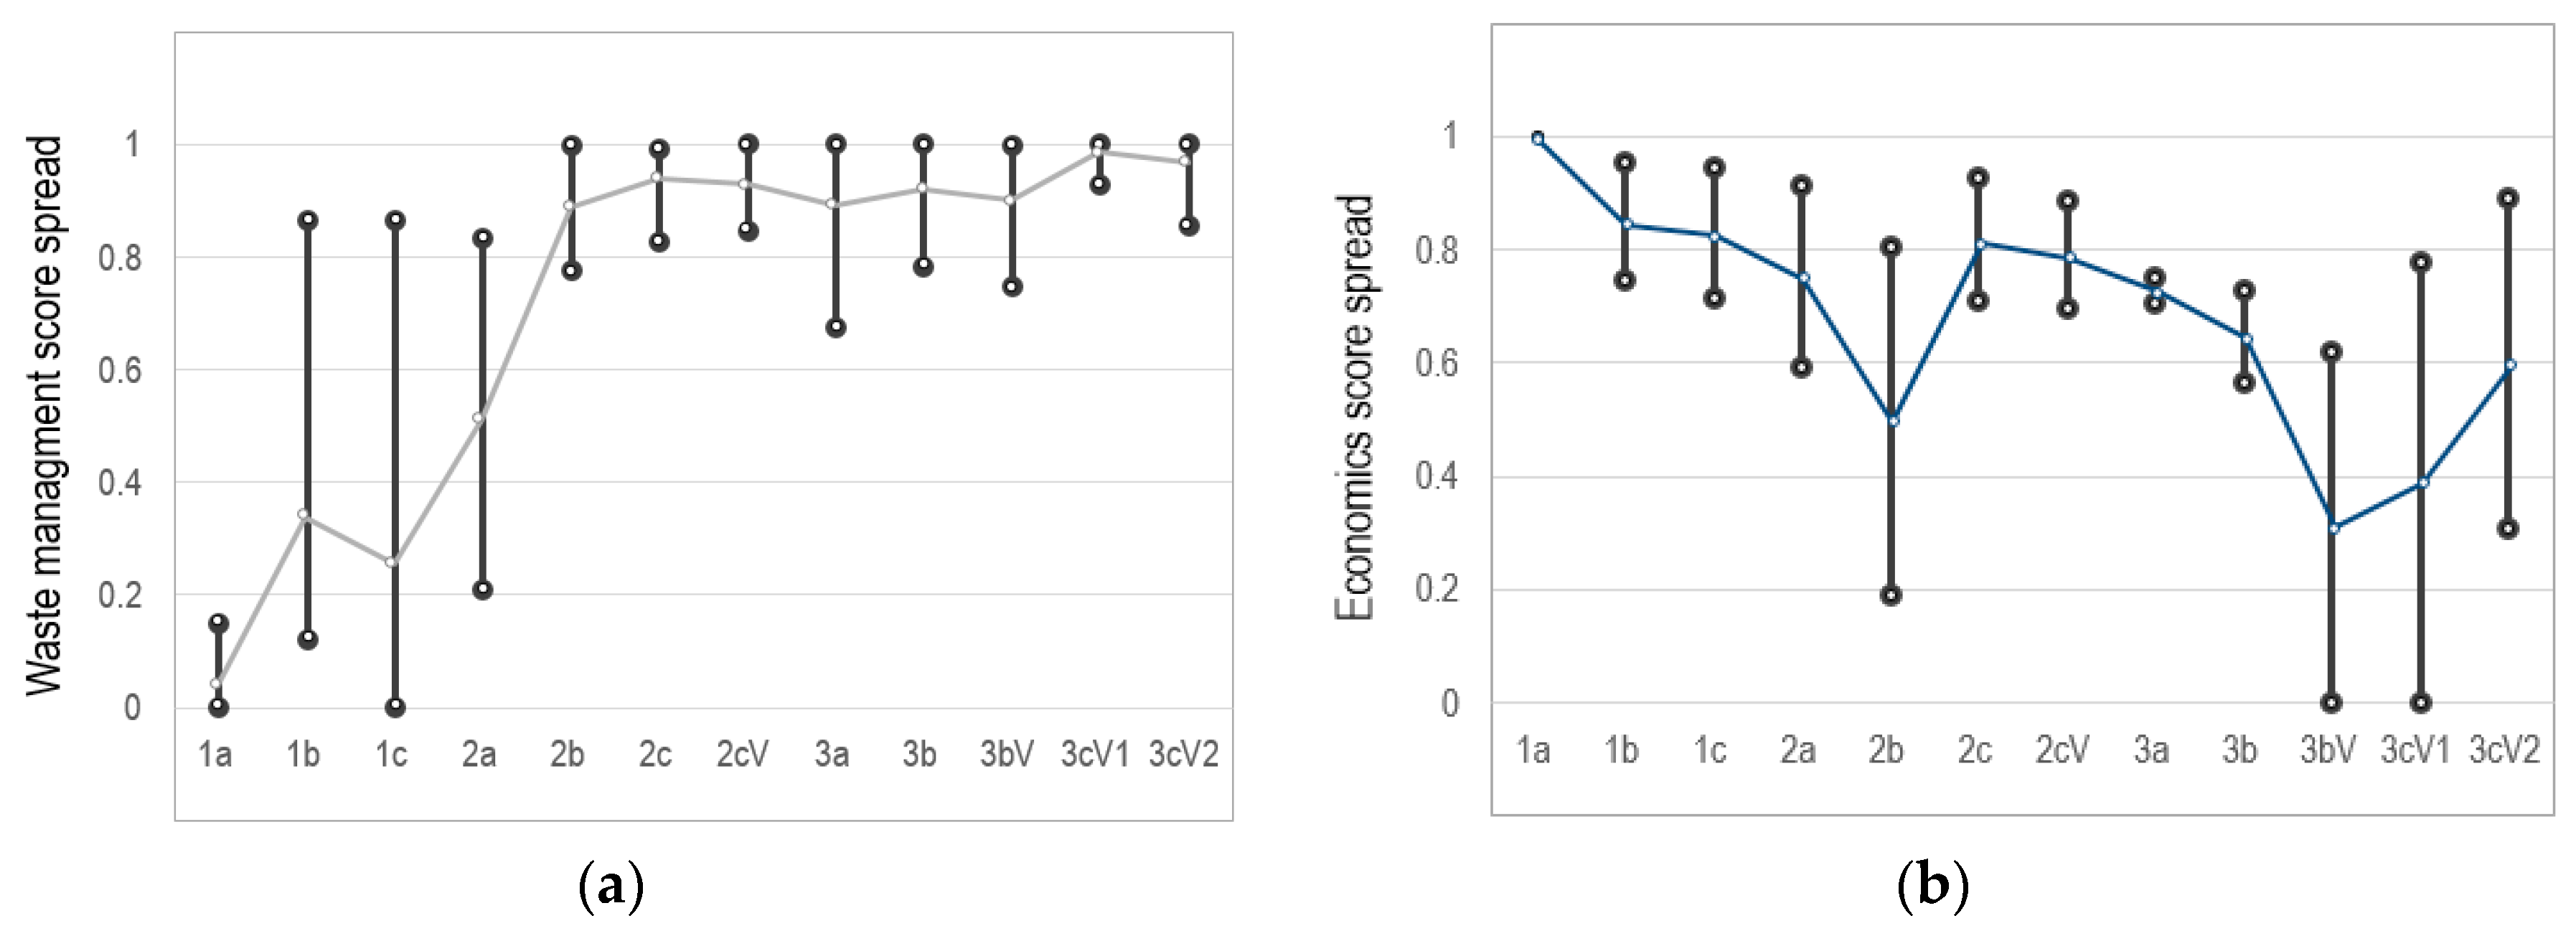
Figure 6.
MAVT ranking results with breakdown of the overall scores into high-level objectives scores for different weights options.
Figure 6.
MAVT ranking results with breakdown of the overall scores into high-level objectives scores for different weights options.
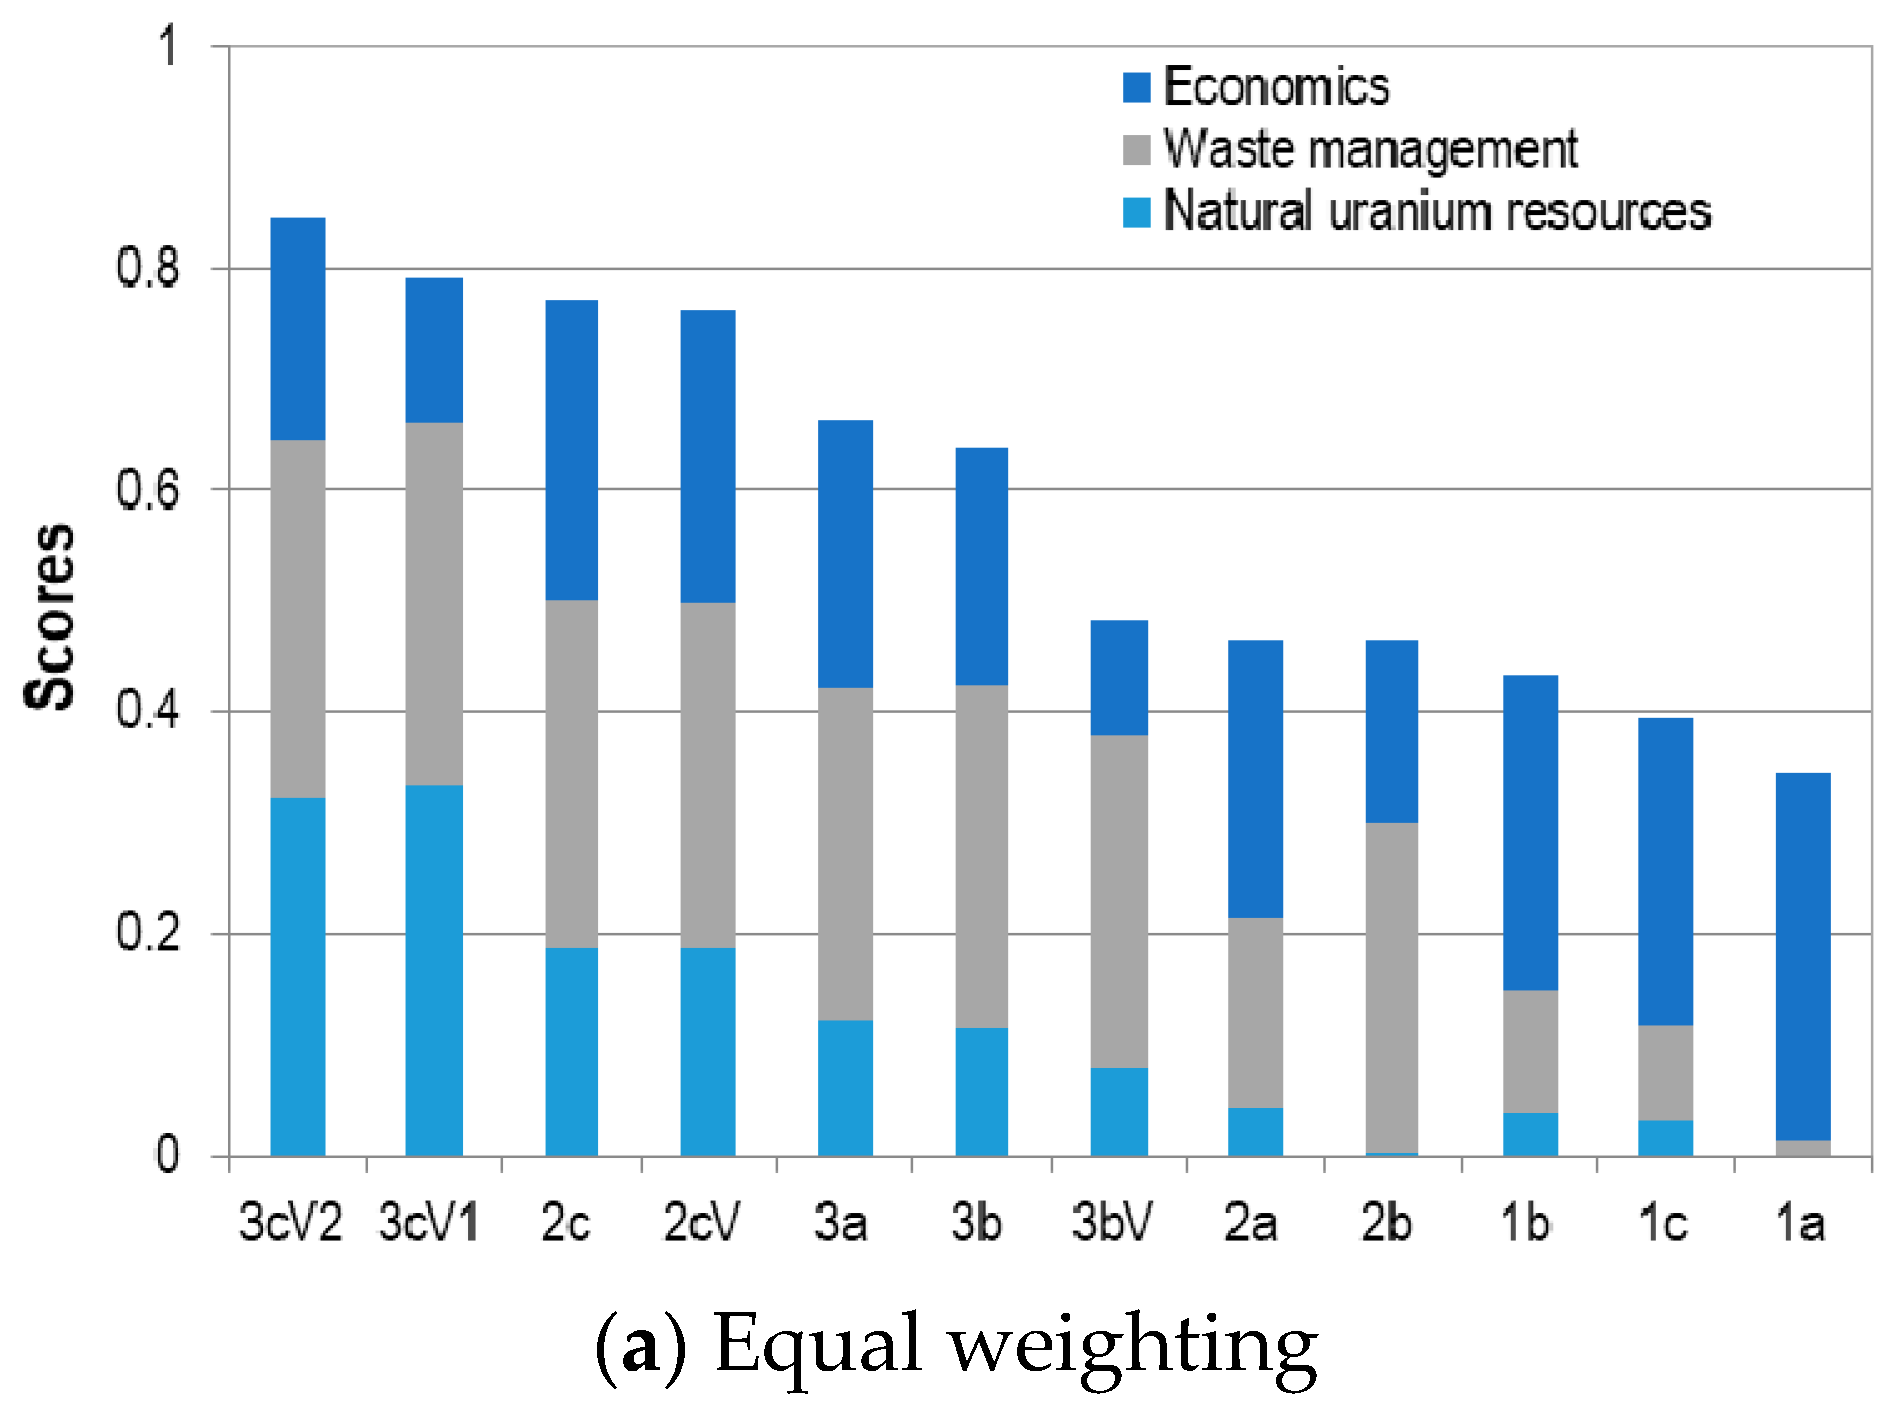
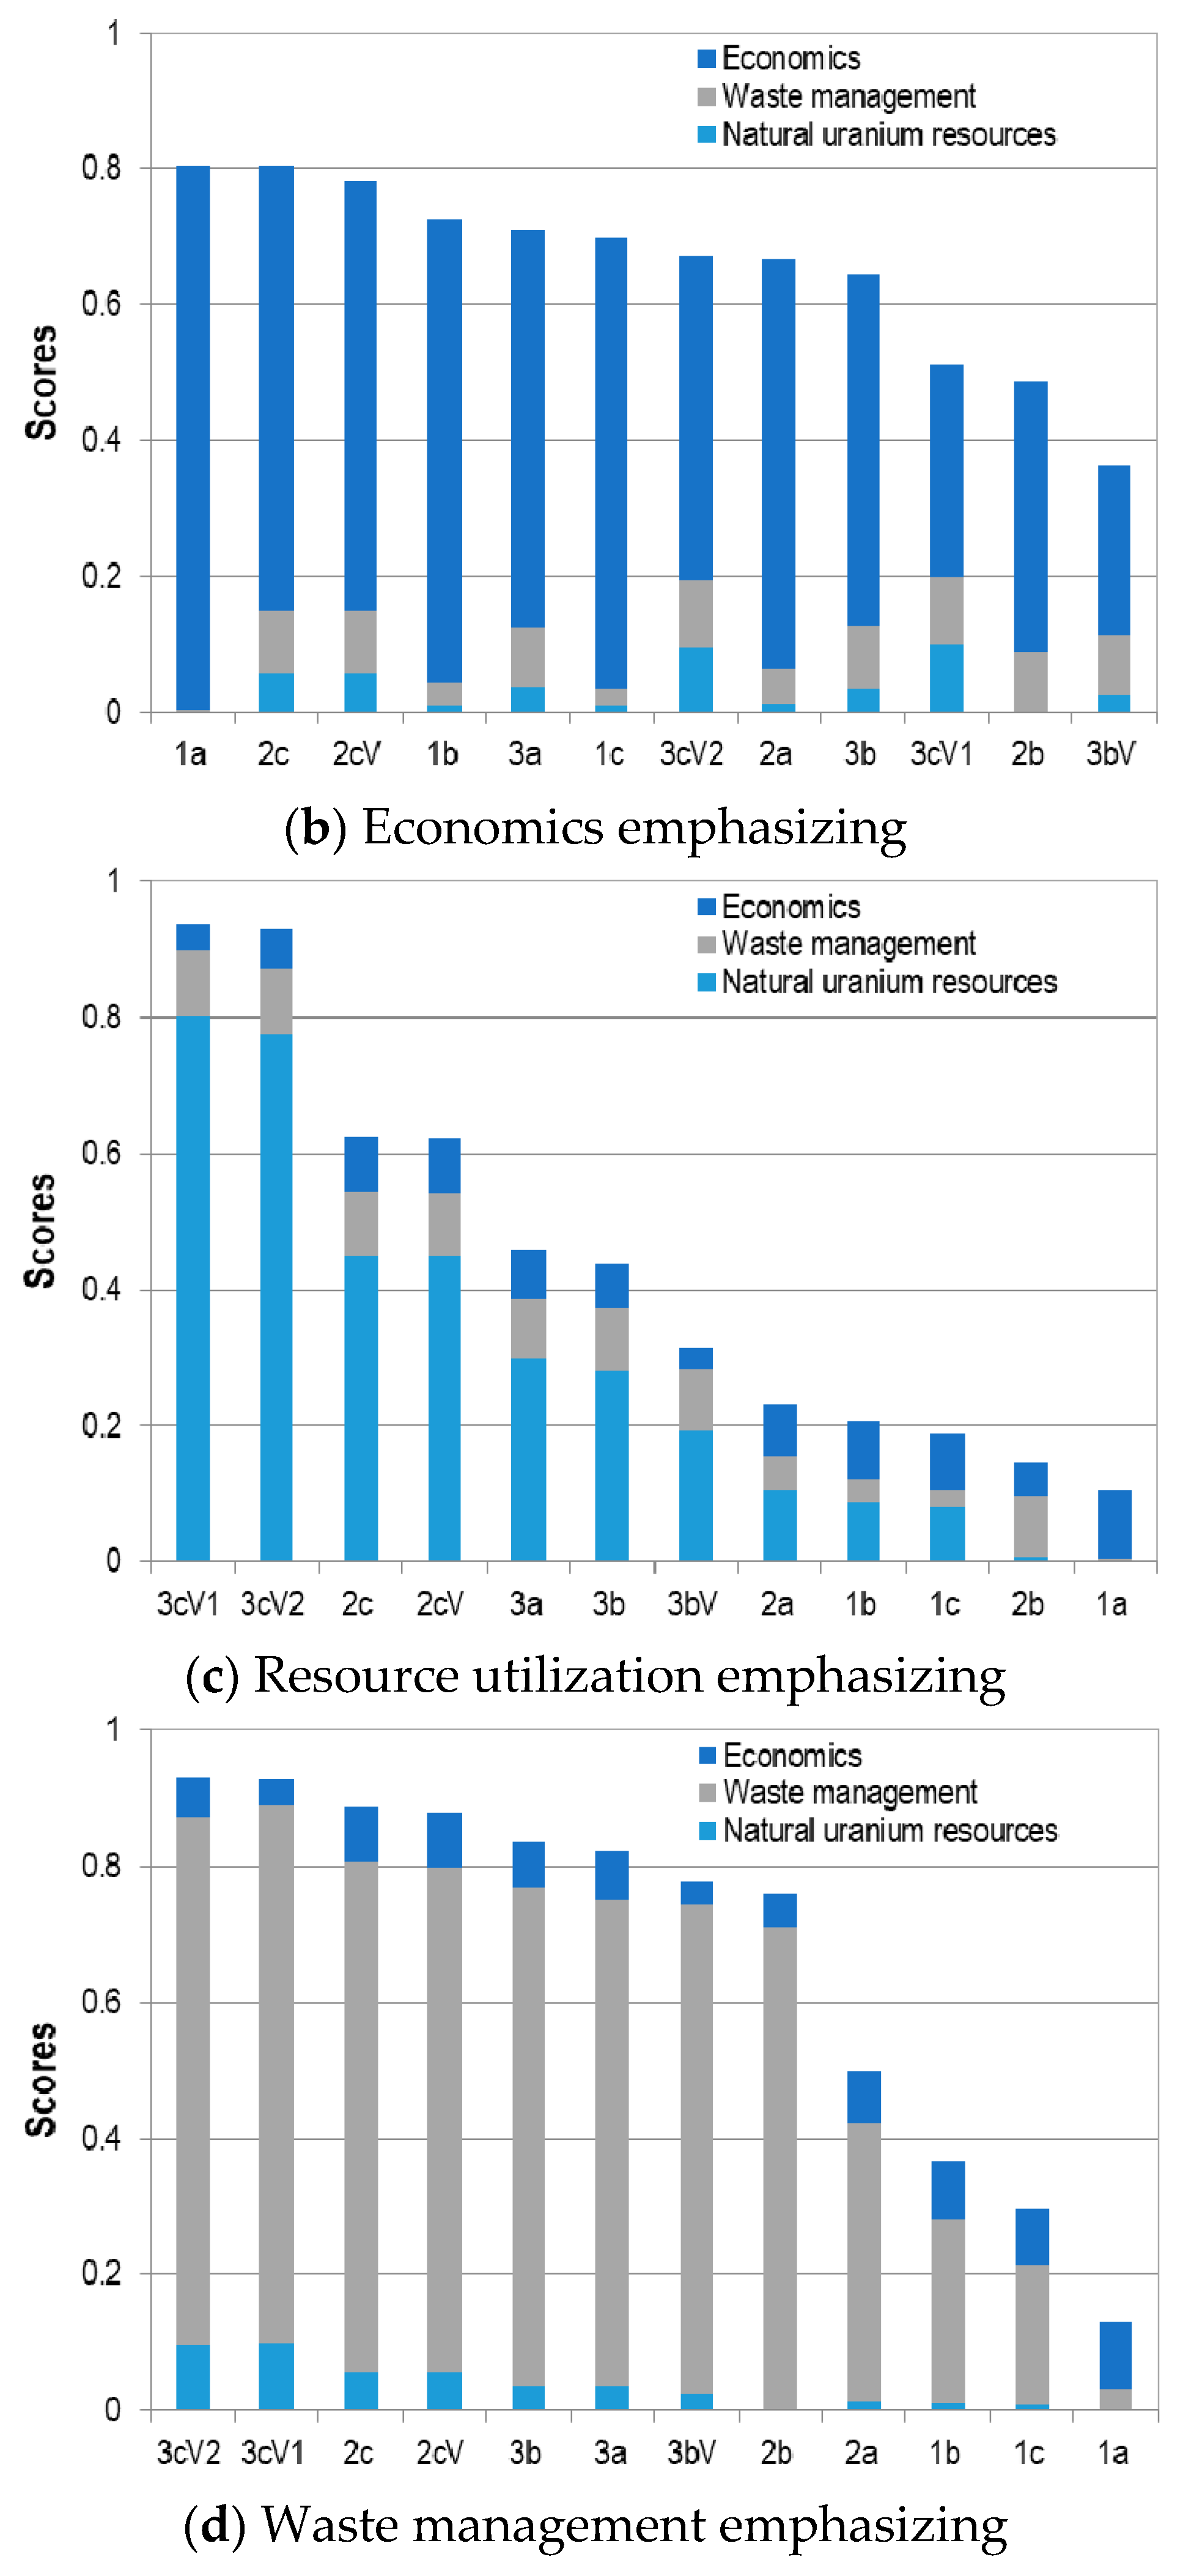
Figure 7.
Score variation over value change of relevant high-level weight.

Figure 8.
NFC options taking the following ranks due to different high-level-objective-weight combinations: first (a); second (b); and third (c).
Figure 8.
NFC options taking the following ranks due to different high-level-objective-weight combinations: first (a); second (b); and third (c).

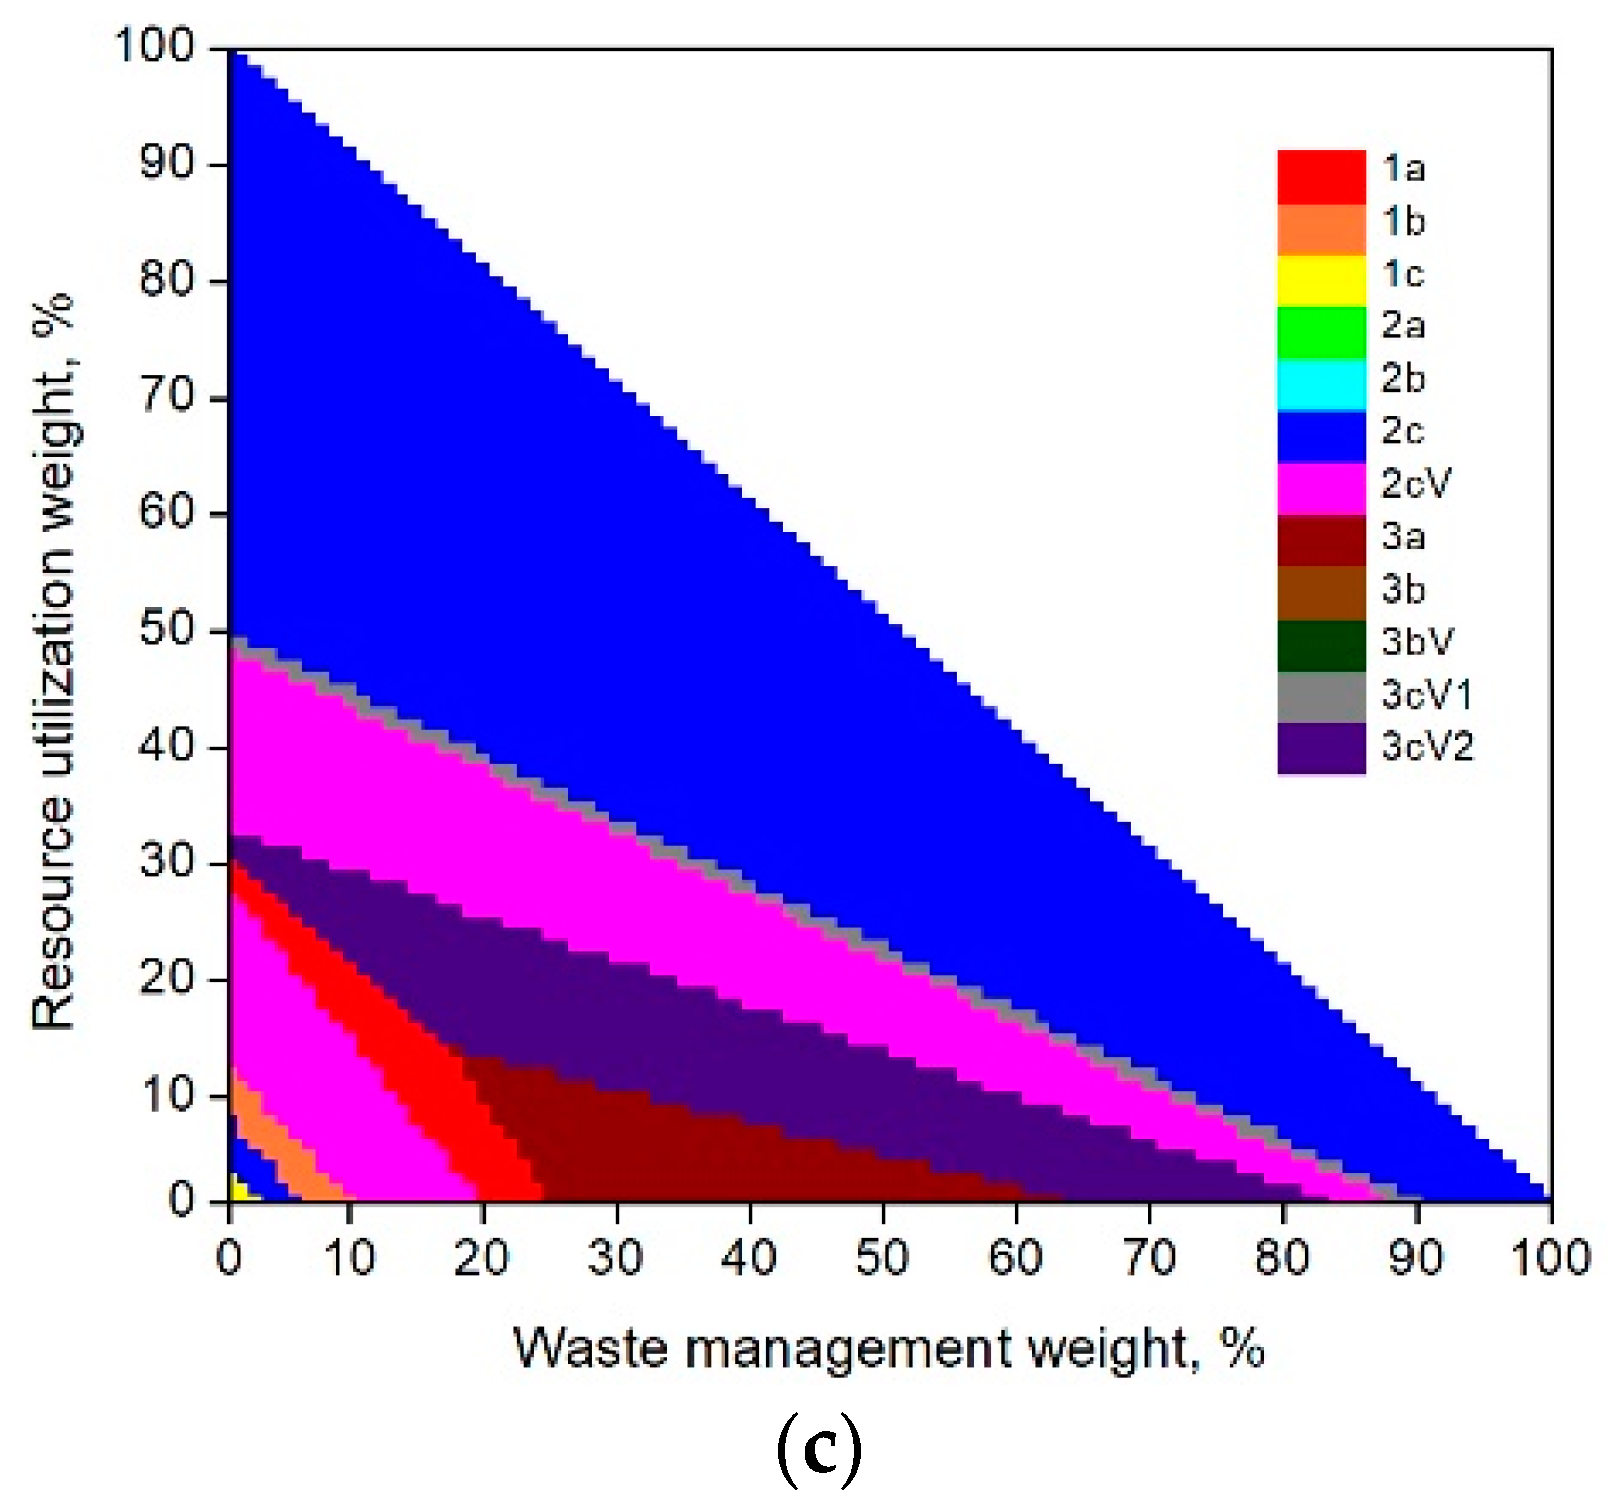
Figure 9.
Spread of overall scores due to uncertainty in weighting factors.

Figure 10.
The rank distribution among NFC options due to uncertainty in single-attribute value function shape (equal weighting).
Figure 10.
The rank distribution among NFC options due to uncertainty in single-attribute value function shape (equal weighting).
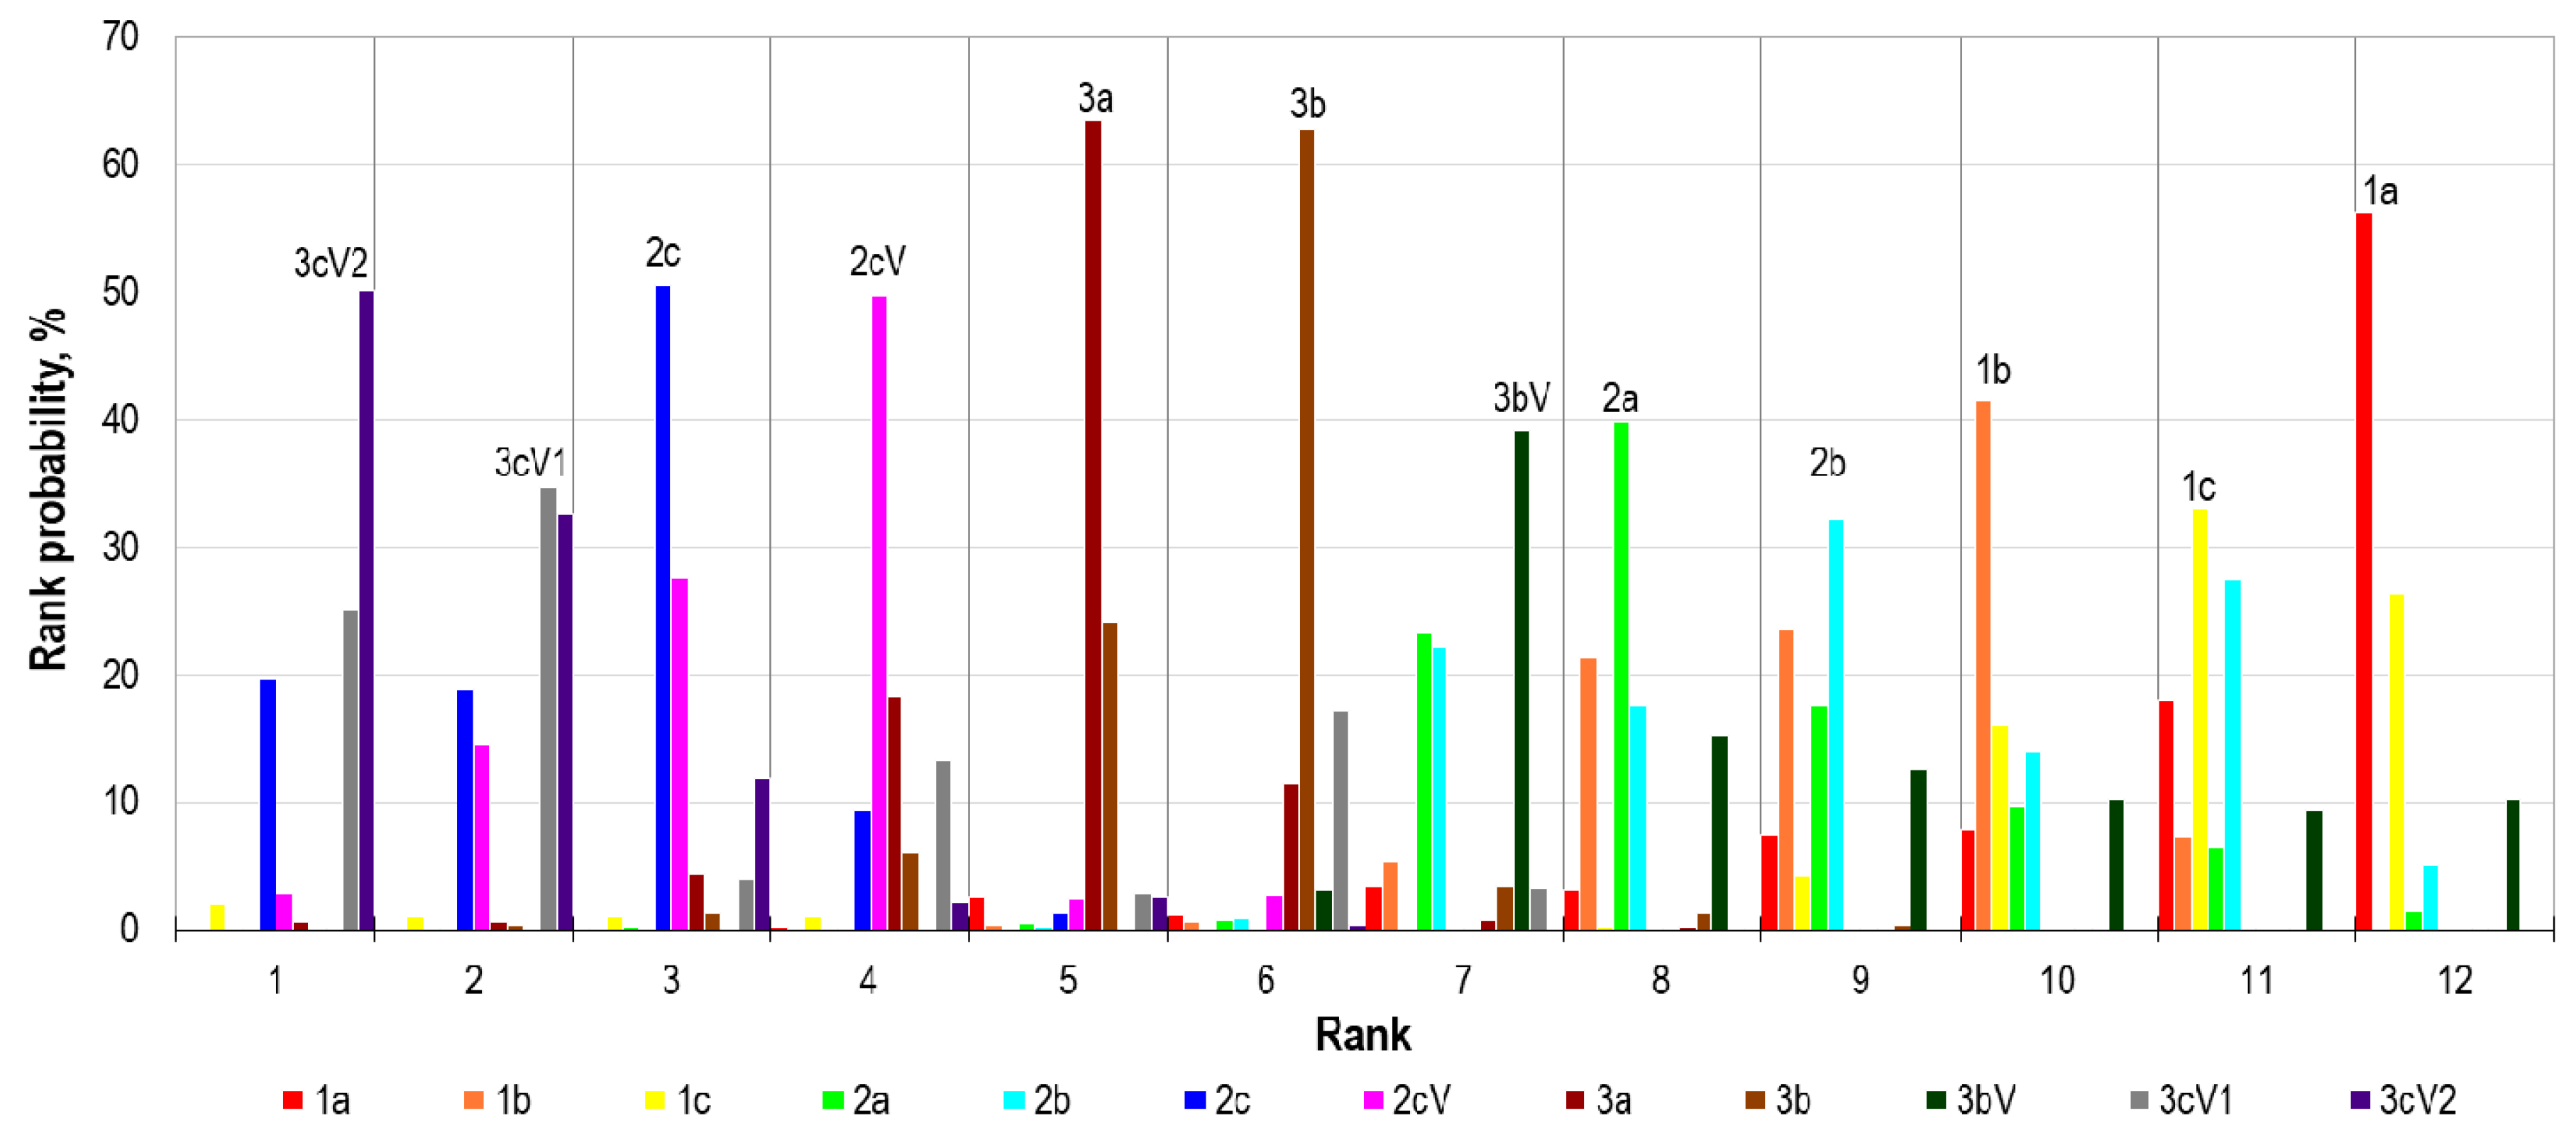
Figure 11.
Interfaces of a nuclear energy system with the environment, taken from Ref. [53].
Figure 11.
Interfaces of a nuclear energy system with the environment, taken from Ref. [53].
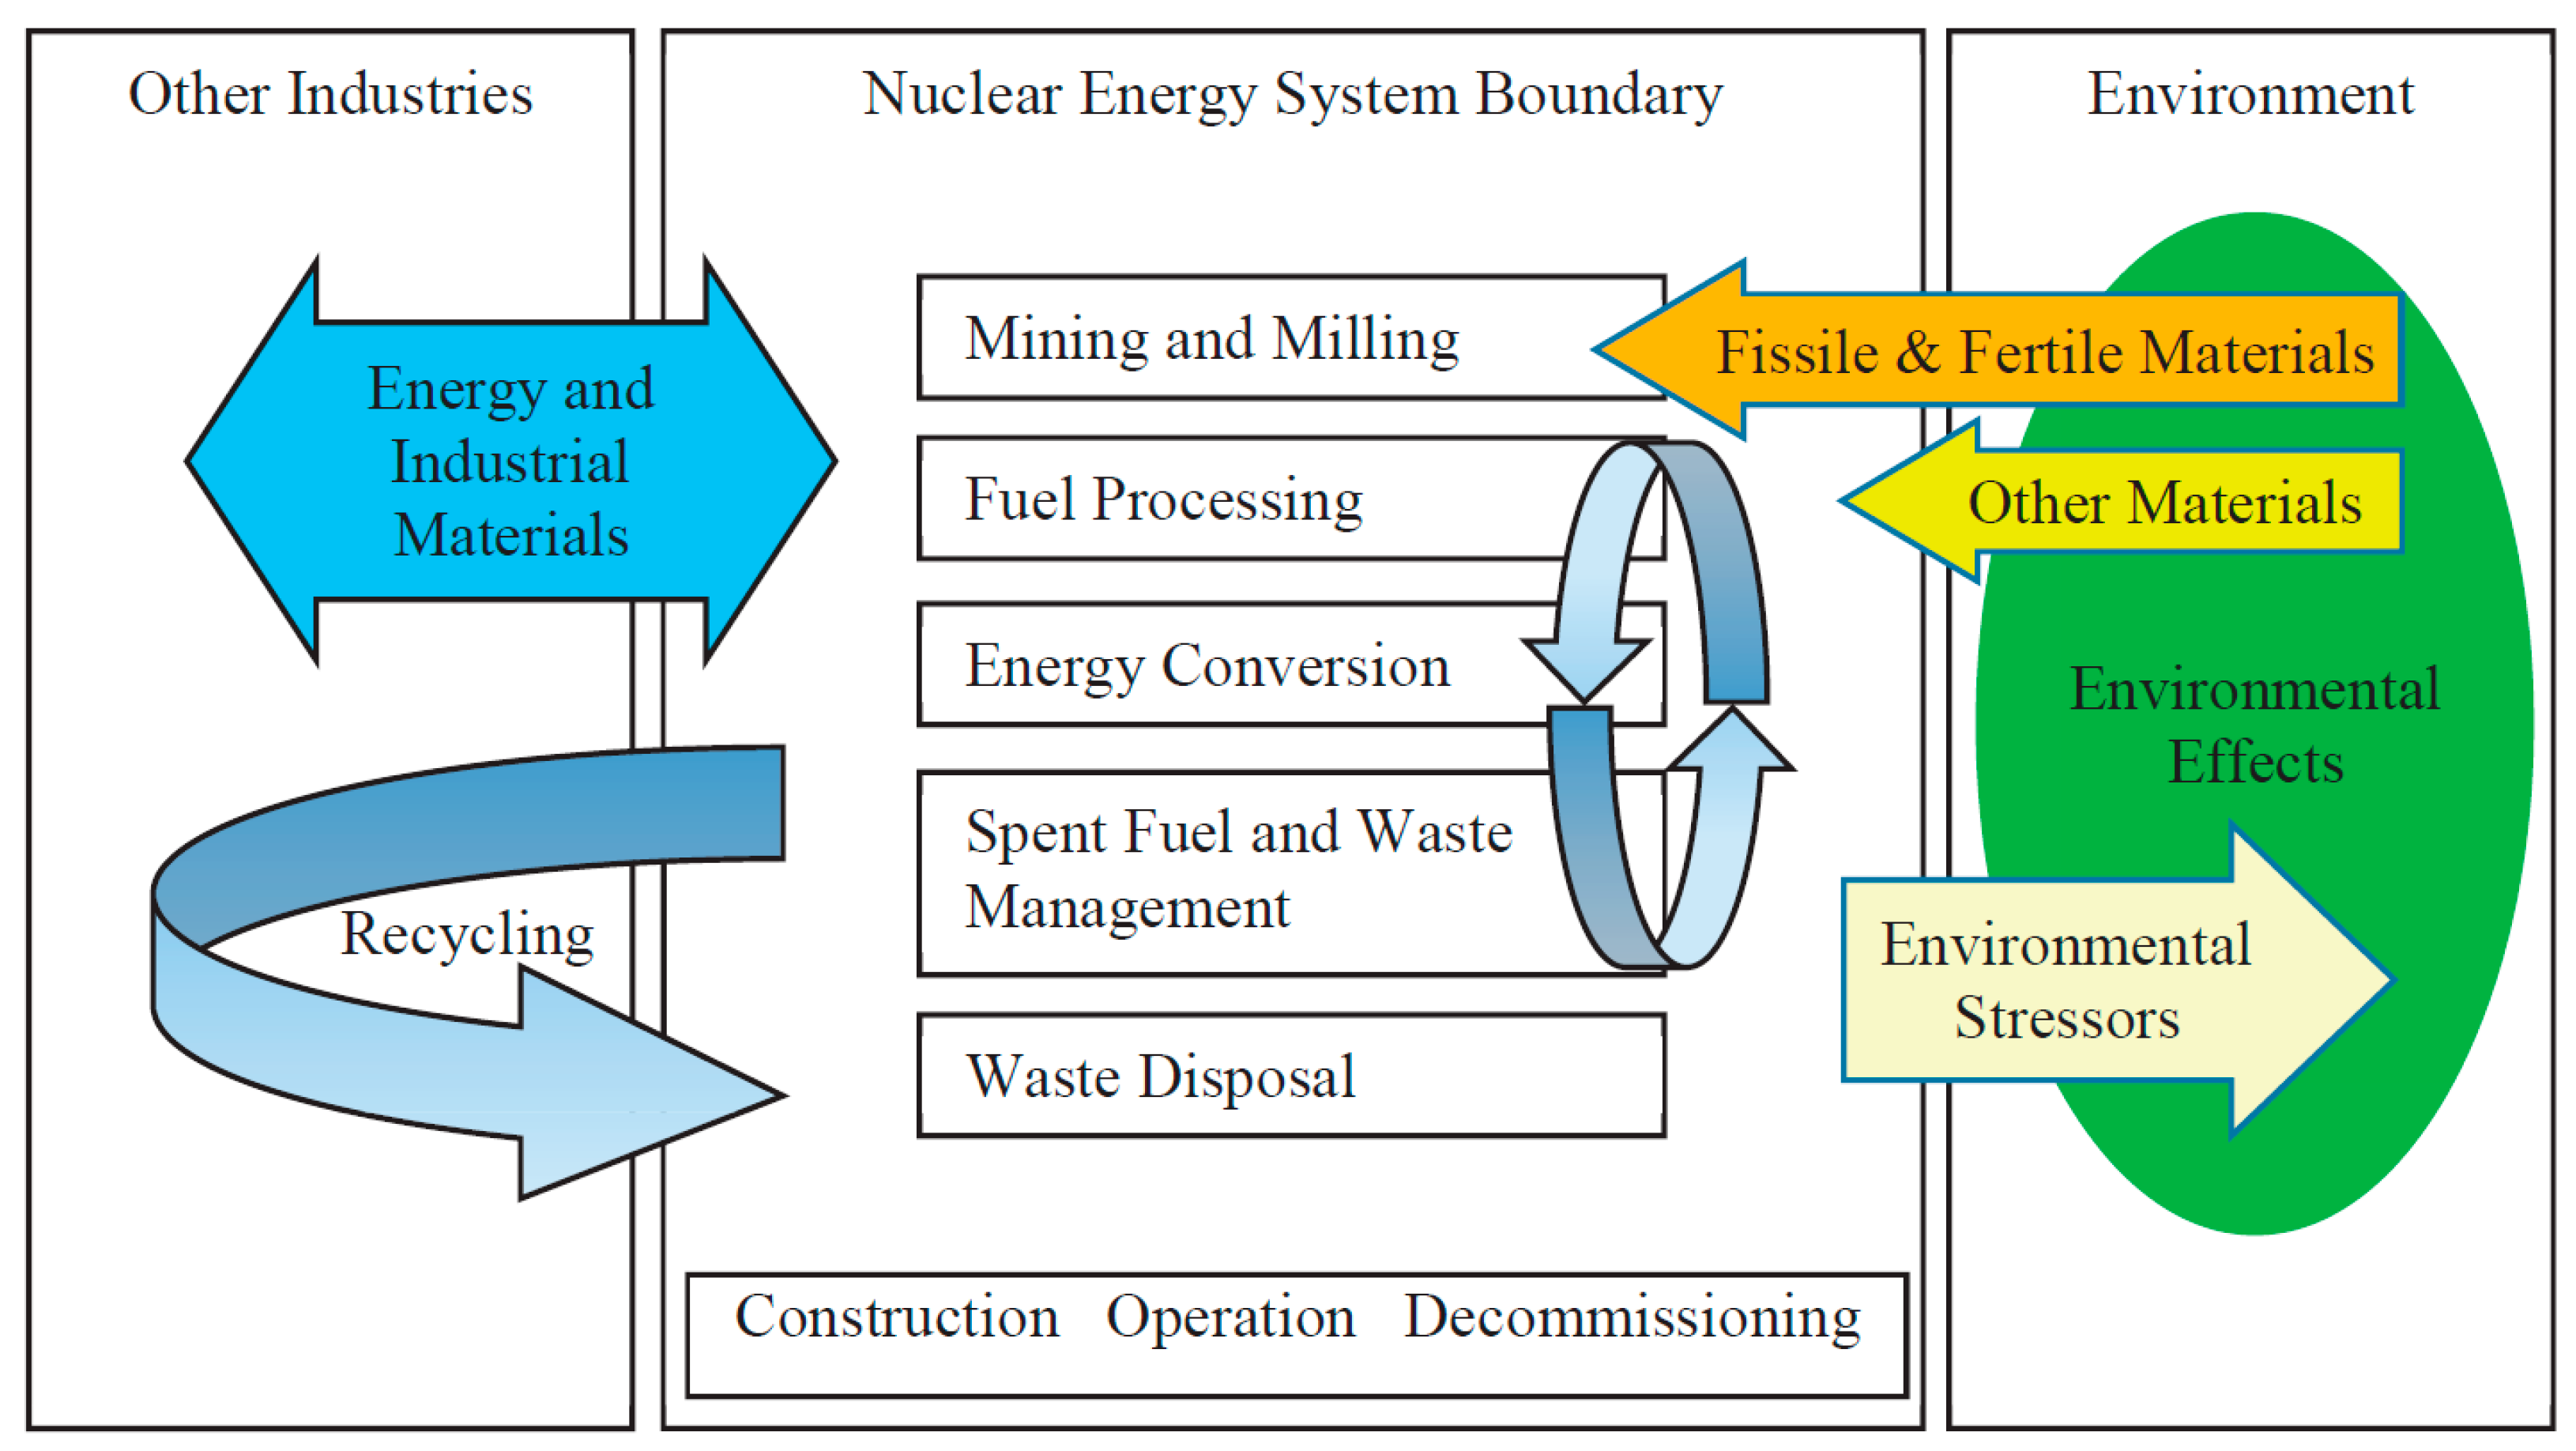
Figure 12.
Total amount of short lived low- and intermediate-waste types; own elaboration of data from [21].
Figure 12.
Total amount of short lived low- and intermediate-waste types; own elaboration of data from [21].

Figure 13.
Volume of long lived low- and intermediate-waste types; own elaboration of data from [21].
Figure 13.
Volume of long lived low- and intermediate-waste types; own elaboration of data from [21].
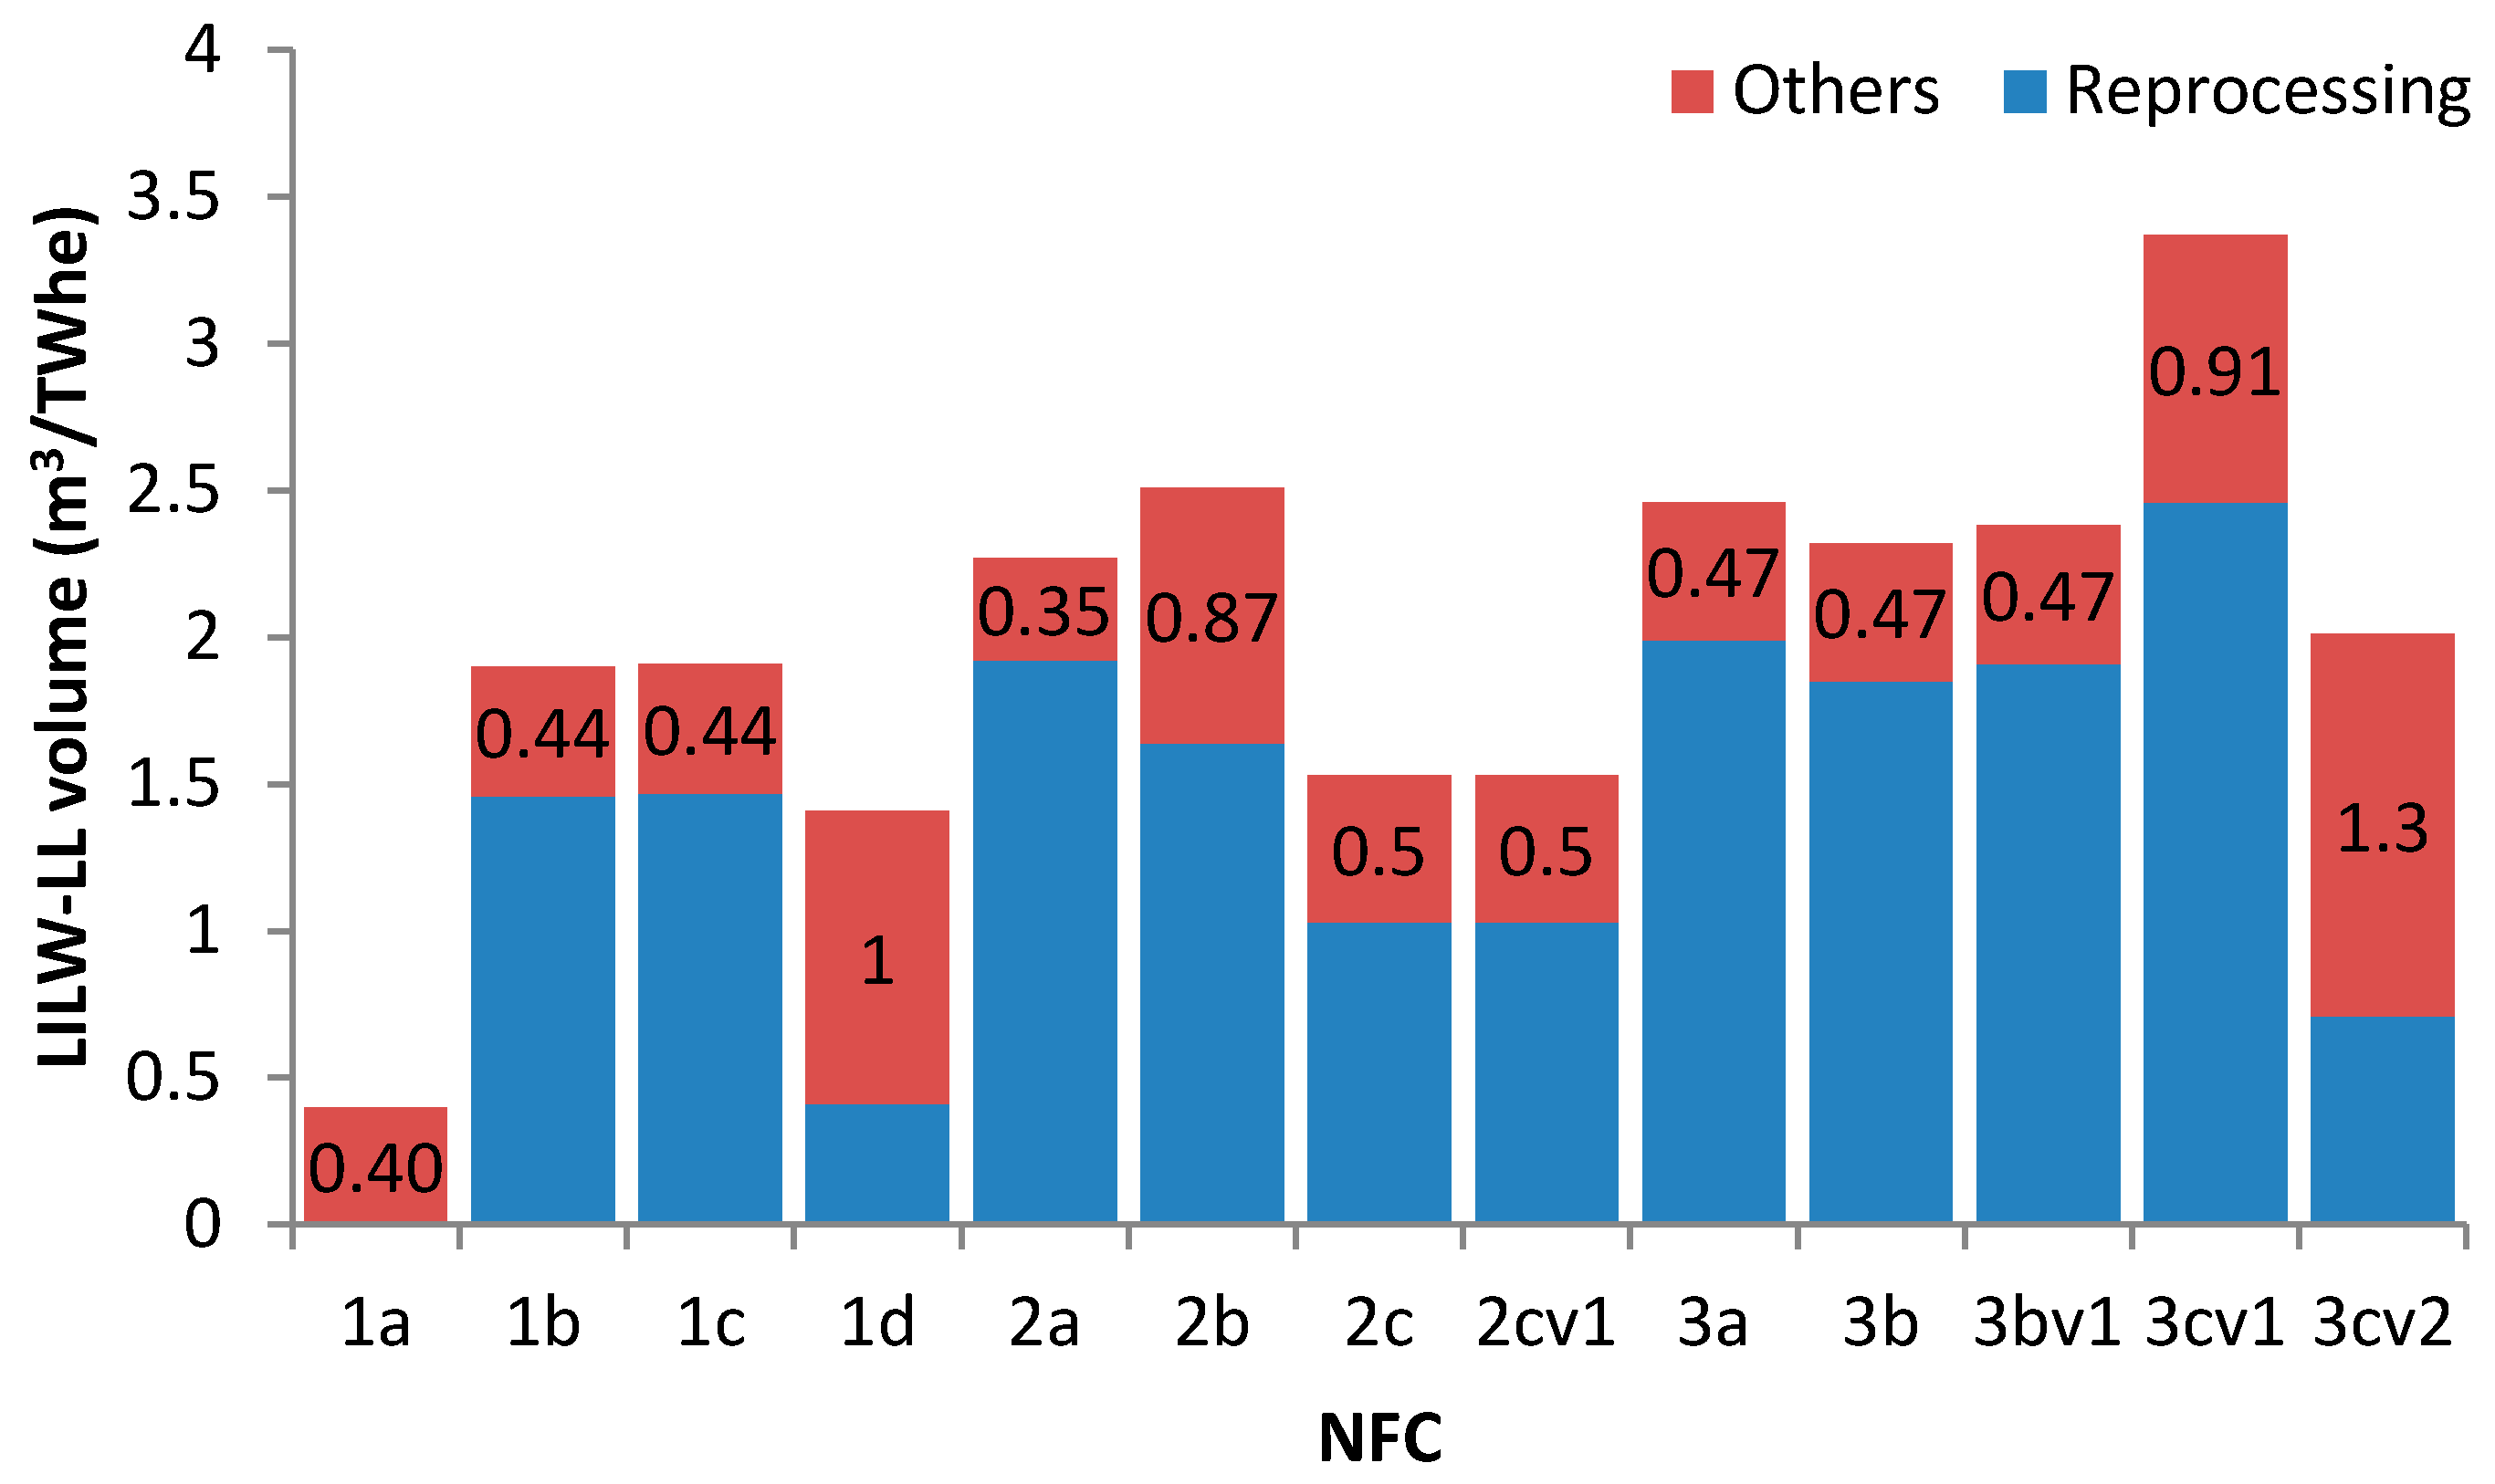
Figure 14.
Volume of conditioned HLW (relative to NFC 1a option); own elaboration of data from [21].
Figure 14.
Volume of conditioned HLW (relative to NFC 1a option); own elaboration of data from [21].
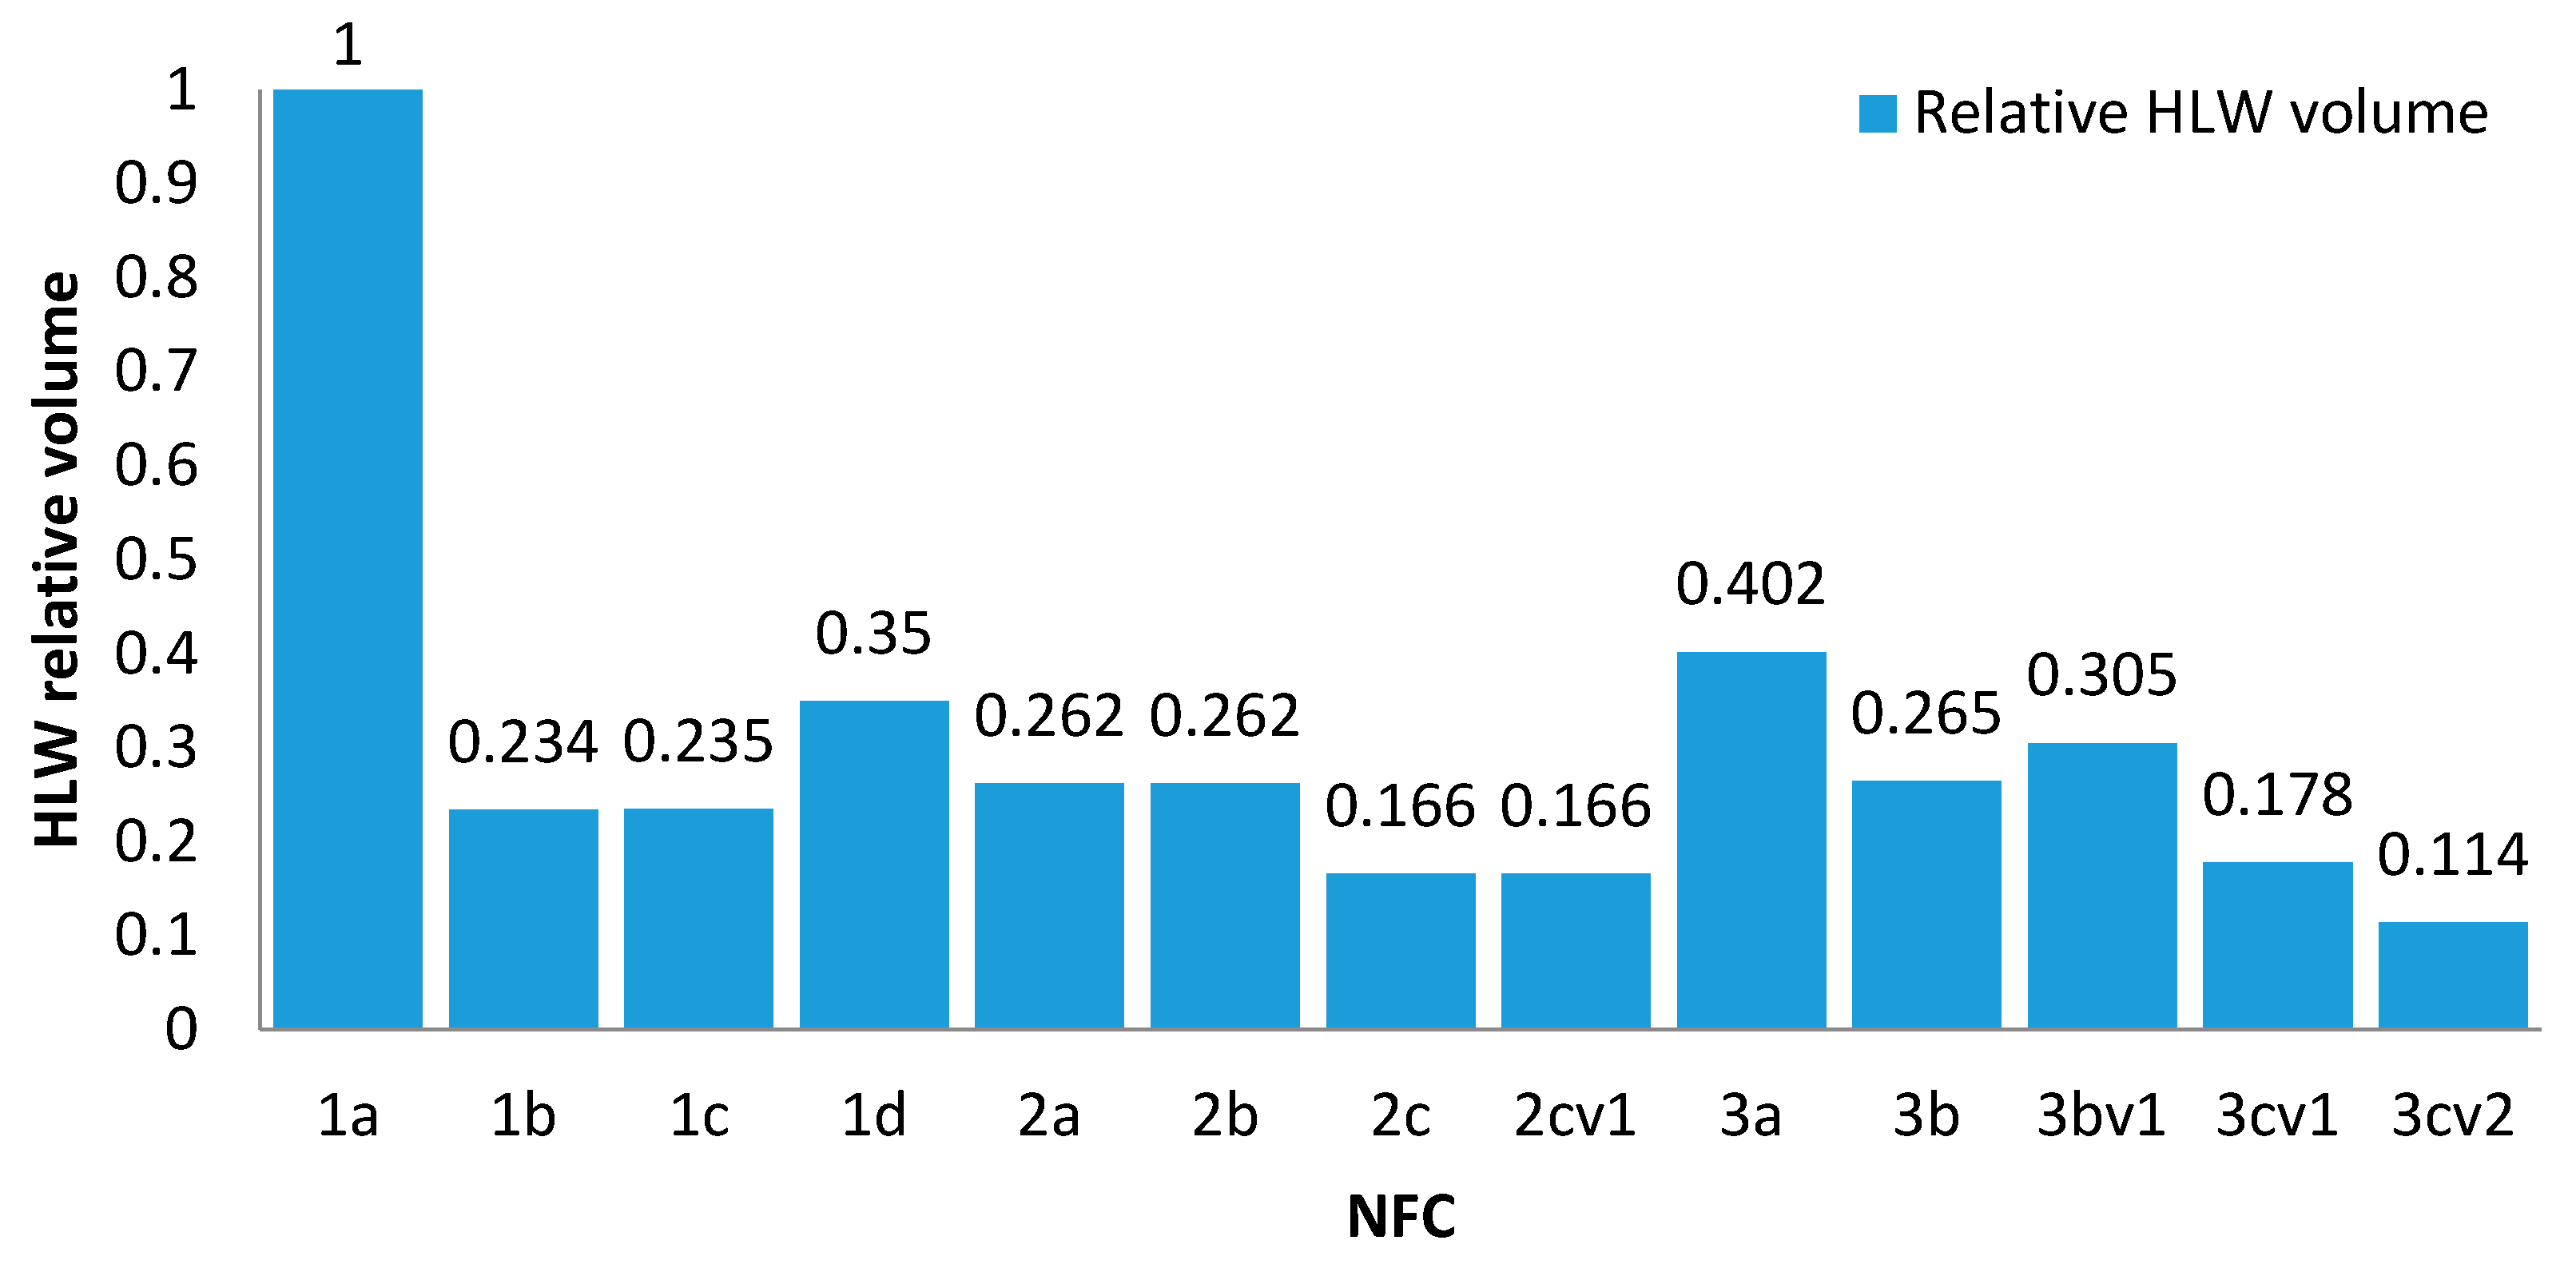
Figure 15.
Volume of LILW-SL generated at decommissioning stage (uranium mining not included); own elaboration of data from [21].
Figure 15.
Volume of LILW-SL generated at decommissioning stage (uranium mining not included); own elaboration of data from [21].

Figure 16.
Volume of LILW-LL generated at decommissioning stage (uranium mining not included); own elaboration of data from [21].
Figure 16.
Volume of LILW-LL generated at decommissioning stage (uranium mining not included); own elaboration of data from [21].

Figure 17.
Relative share (%) of each NFC stage to the overall environmental and technological impact indicators for the option 1b (own elaboration on the base of the corrected data found in [54]).
Figure 17.
Relative share (%) of each NFC stage to the overall environmental and technological impact indicators for the option 1b (own elaboration on the base of the corrected data found in [54]).
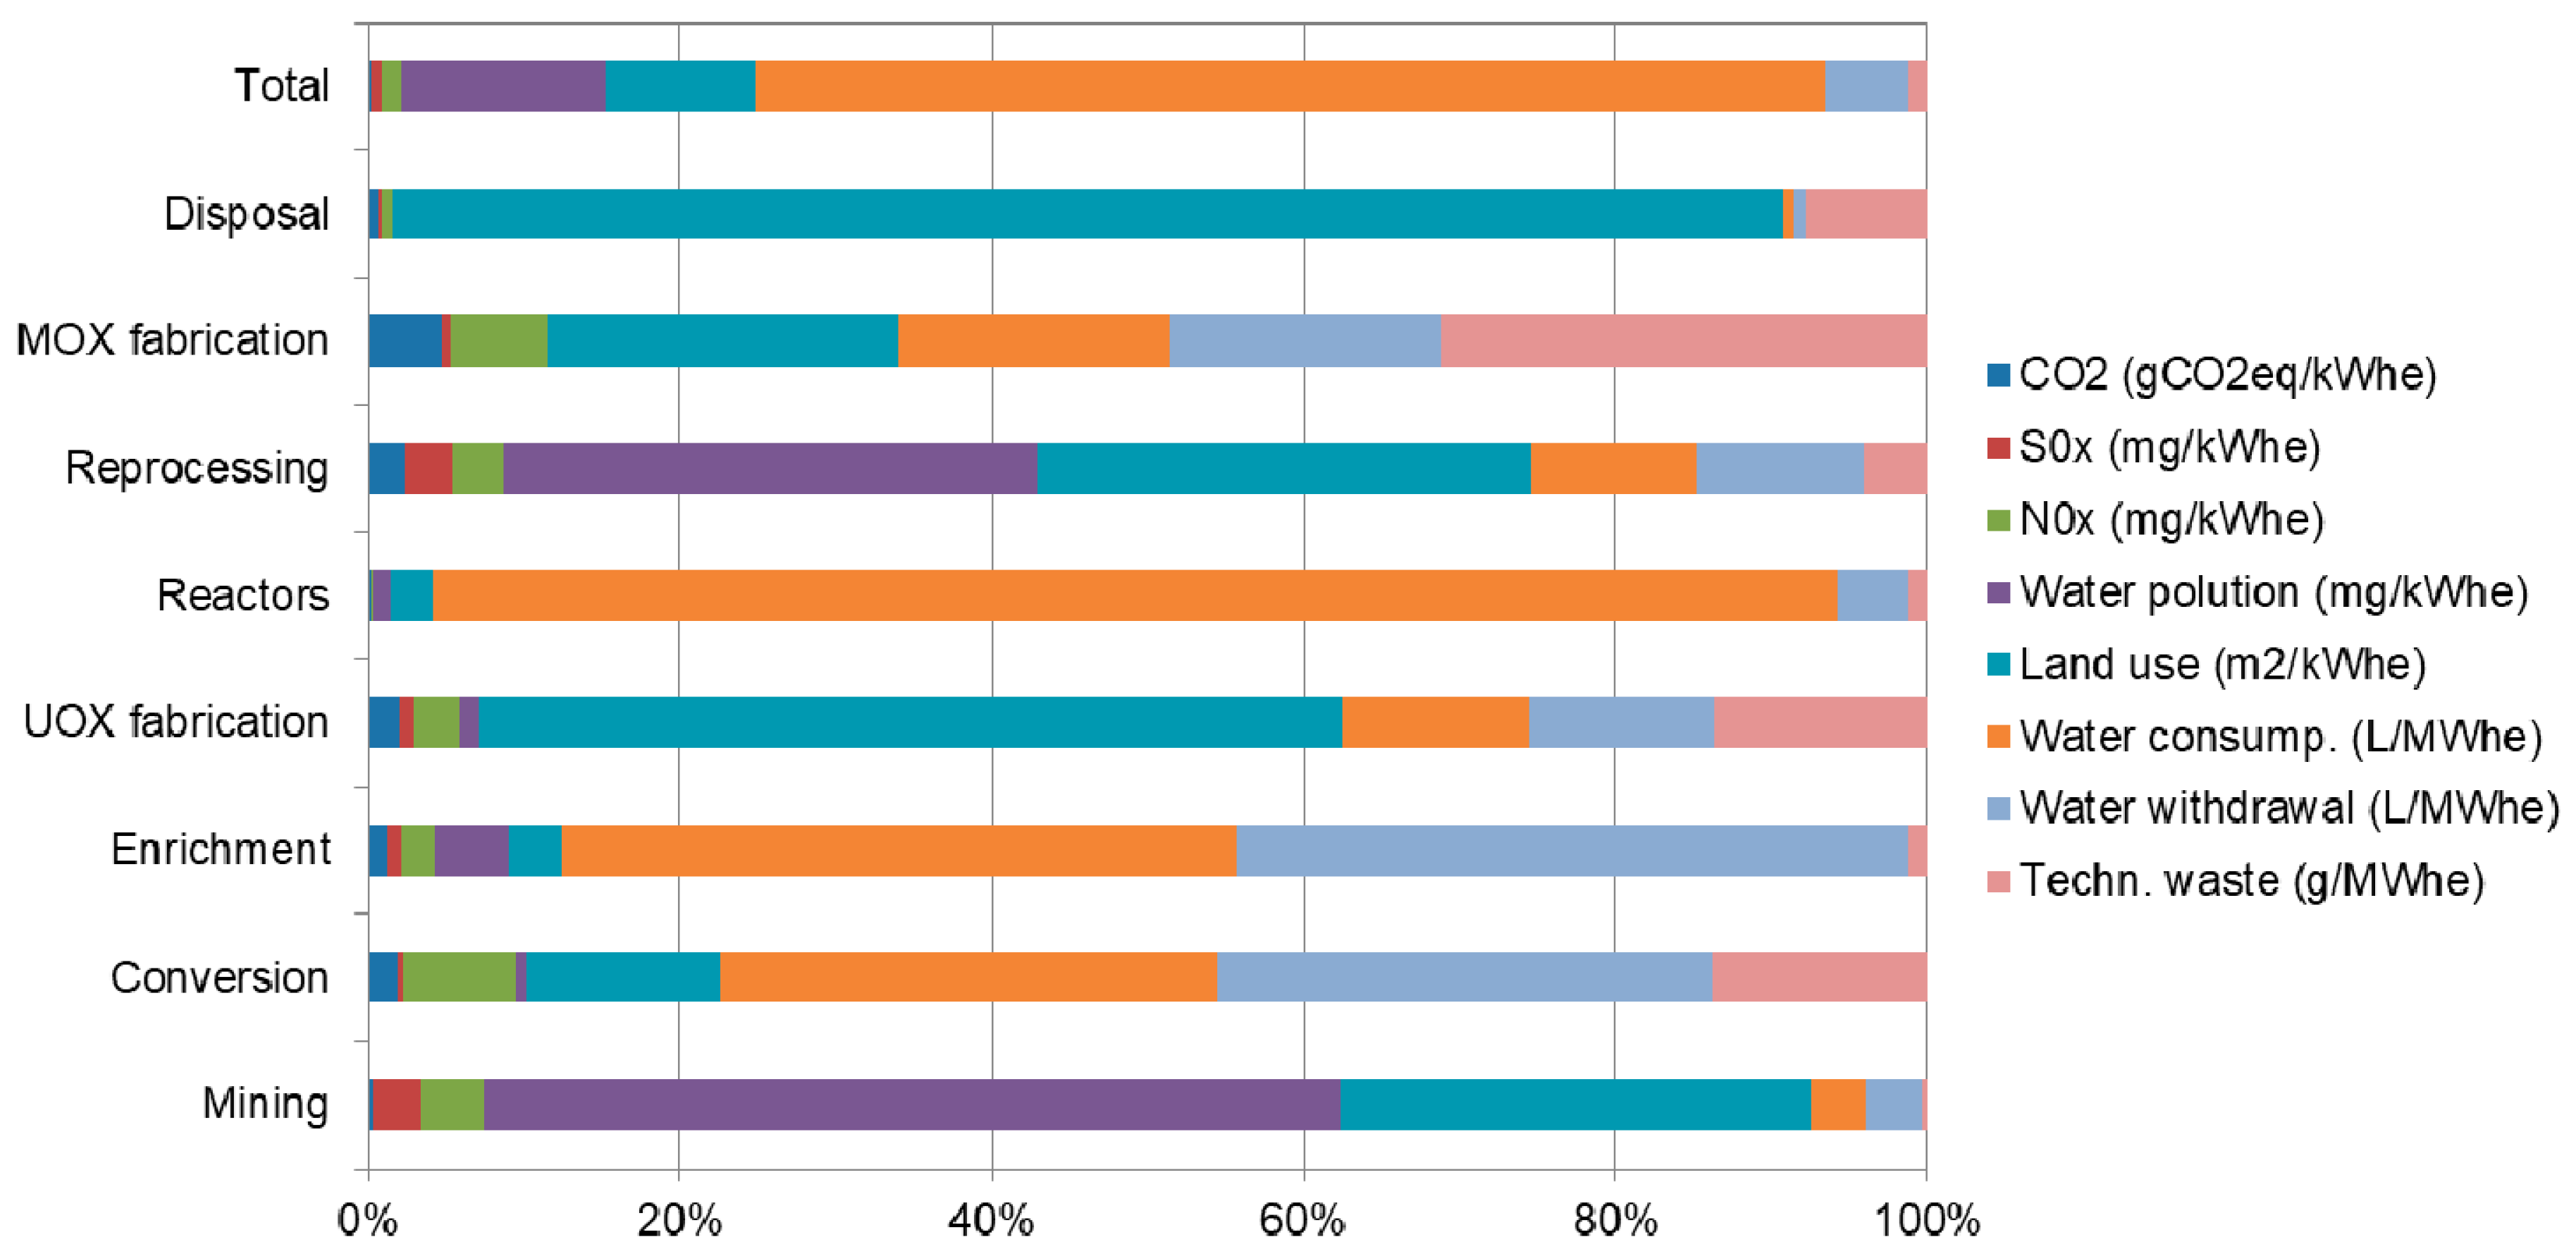
Figure 18.
Share to the radioactive solid waste indicators for selected stages of NFC option 1b—own elaboration on the base of the corrected data found in [54] (VLLW indicates Very Low Level Wastes).
Figure 18.
Share to the radioactive solid waste indicators for selected stages of NFC option 1b—own elaboration on the base of the corrected data found in [54] (VLLW indicates Very Low Level Wastes).
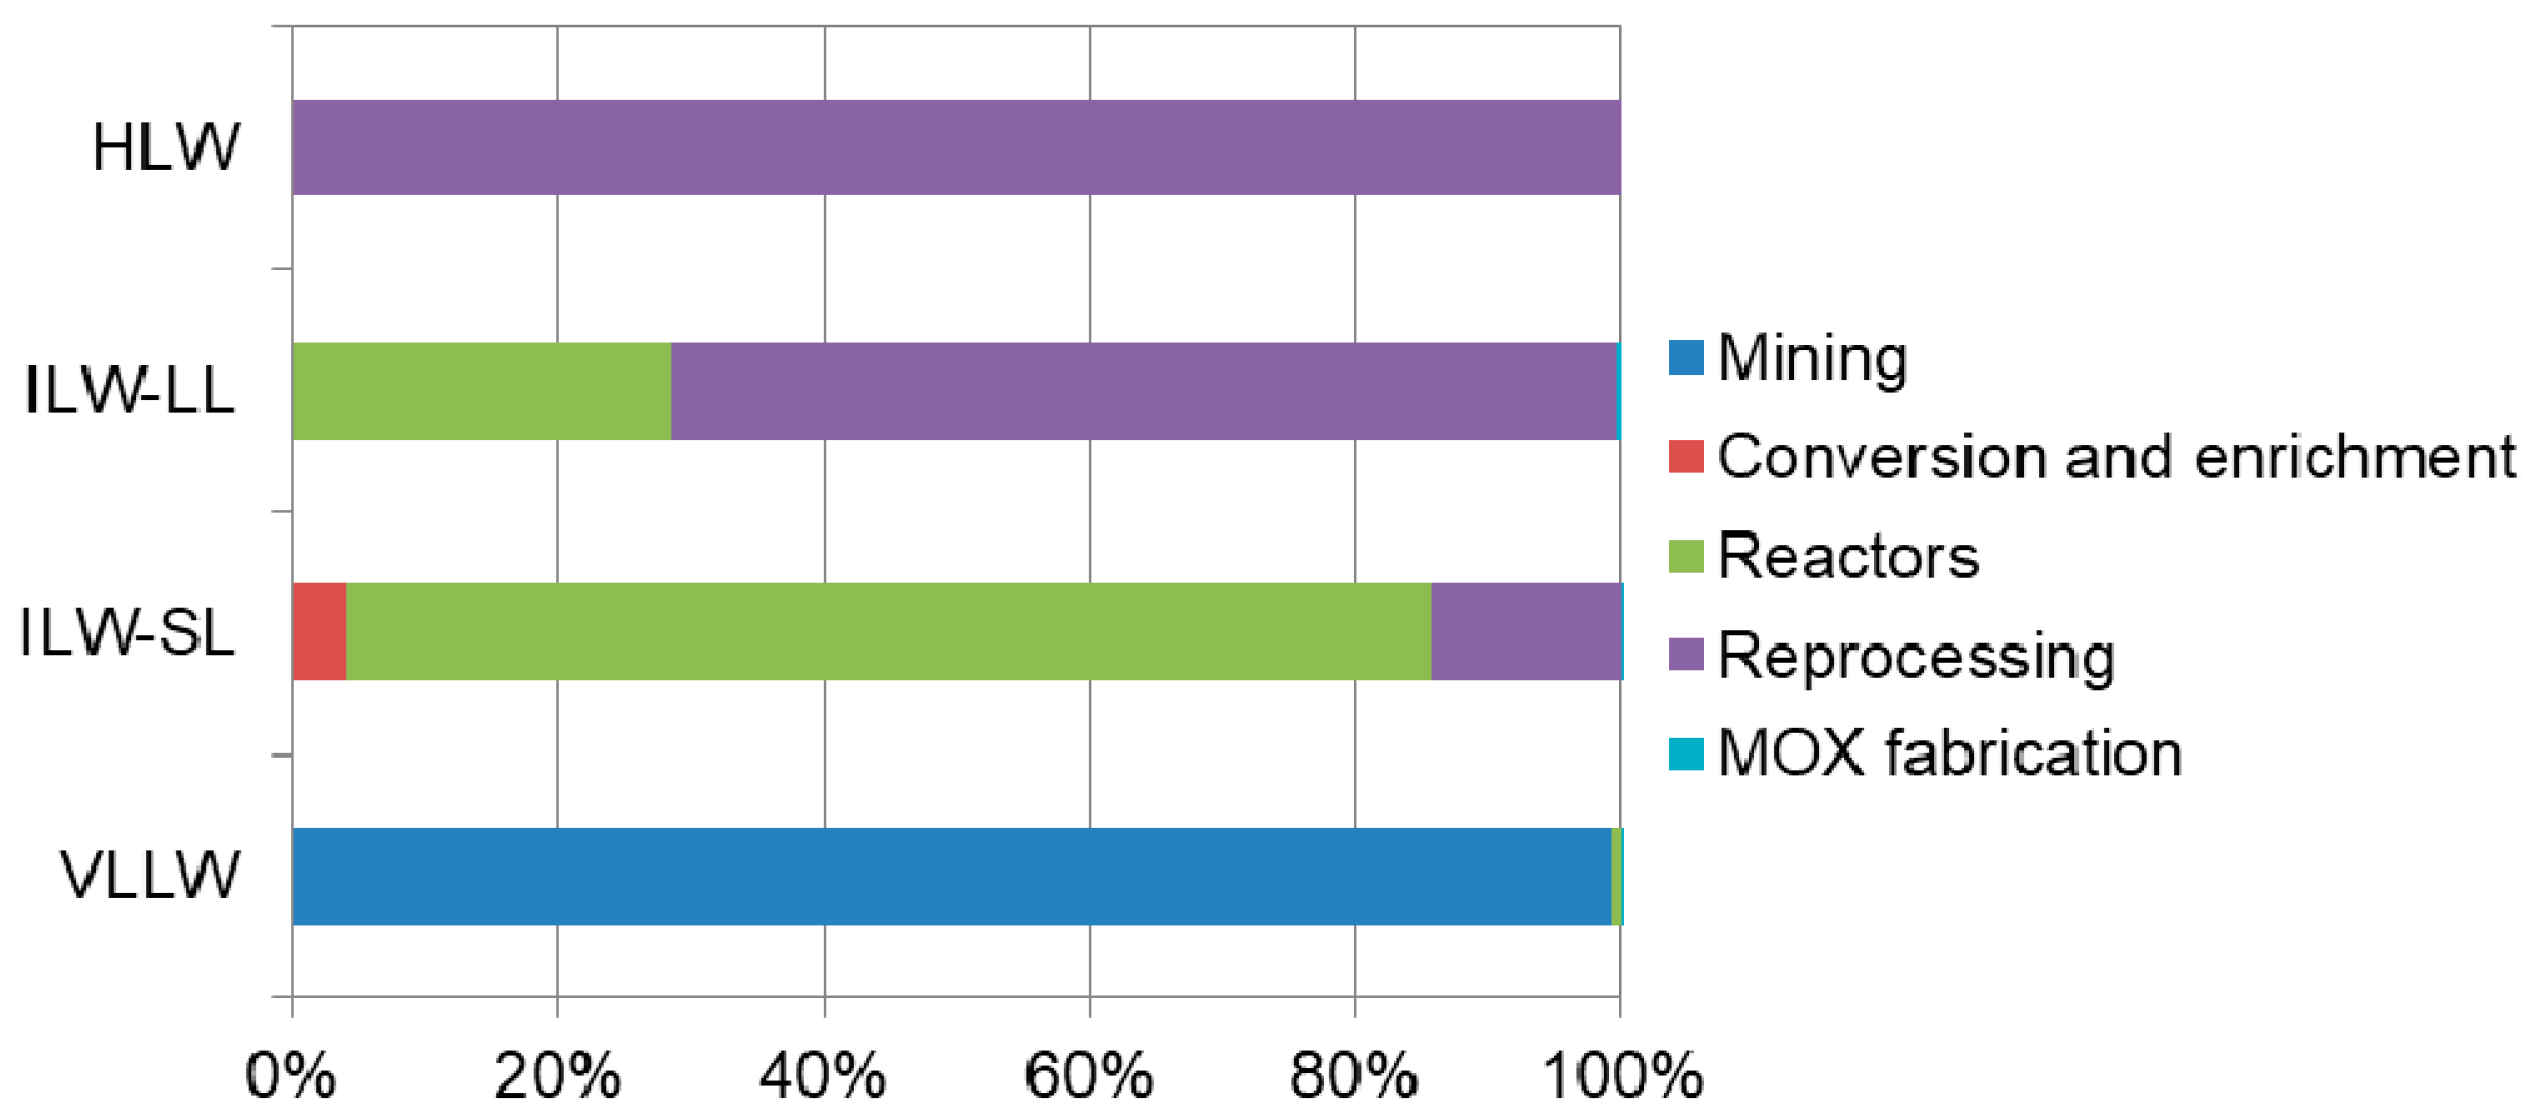
Figure 19.
Comparison of selected environmental indicators’ values assessed for different energy-generating technologies adopted from [56].
Figure 19.
Comparison of selected environmental indicators’ values assessed for different energy-generating technologies adopted from [56].
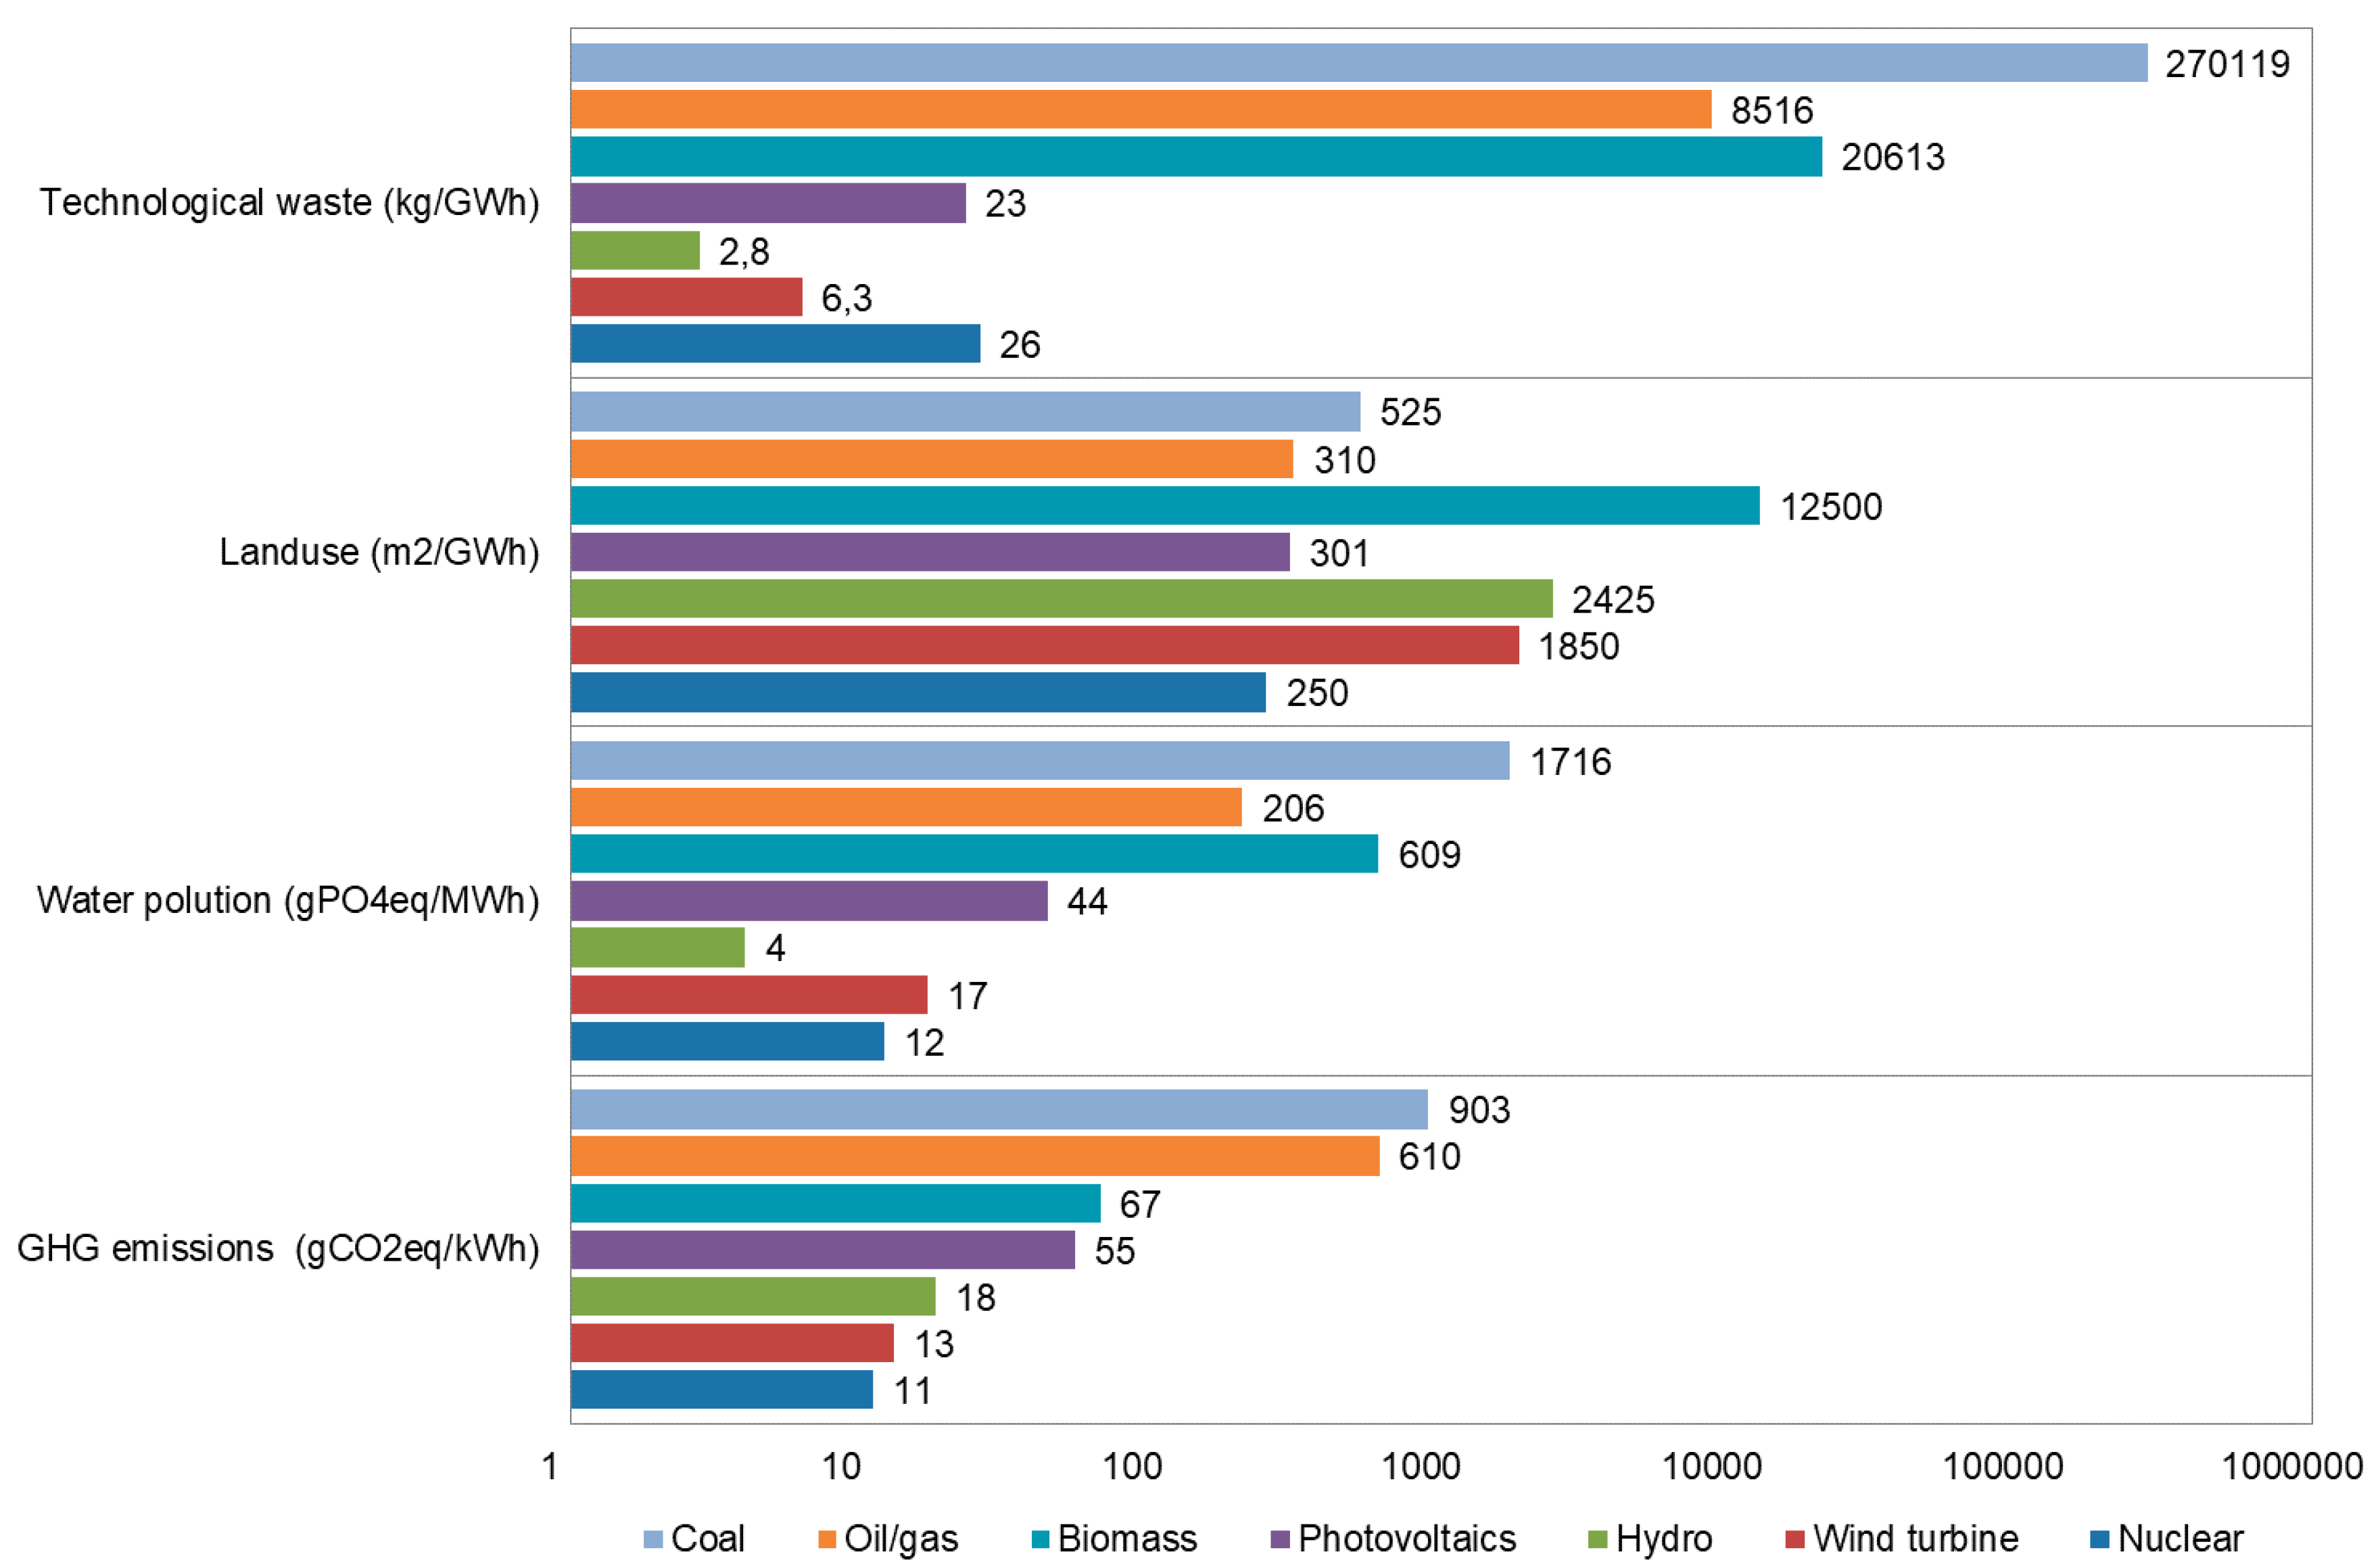
Figure 20.
An environmental stressor analysis: Flow chart [53].
Figure 20.
An environmental stressor analysis: Flow chart [53].


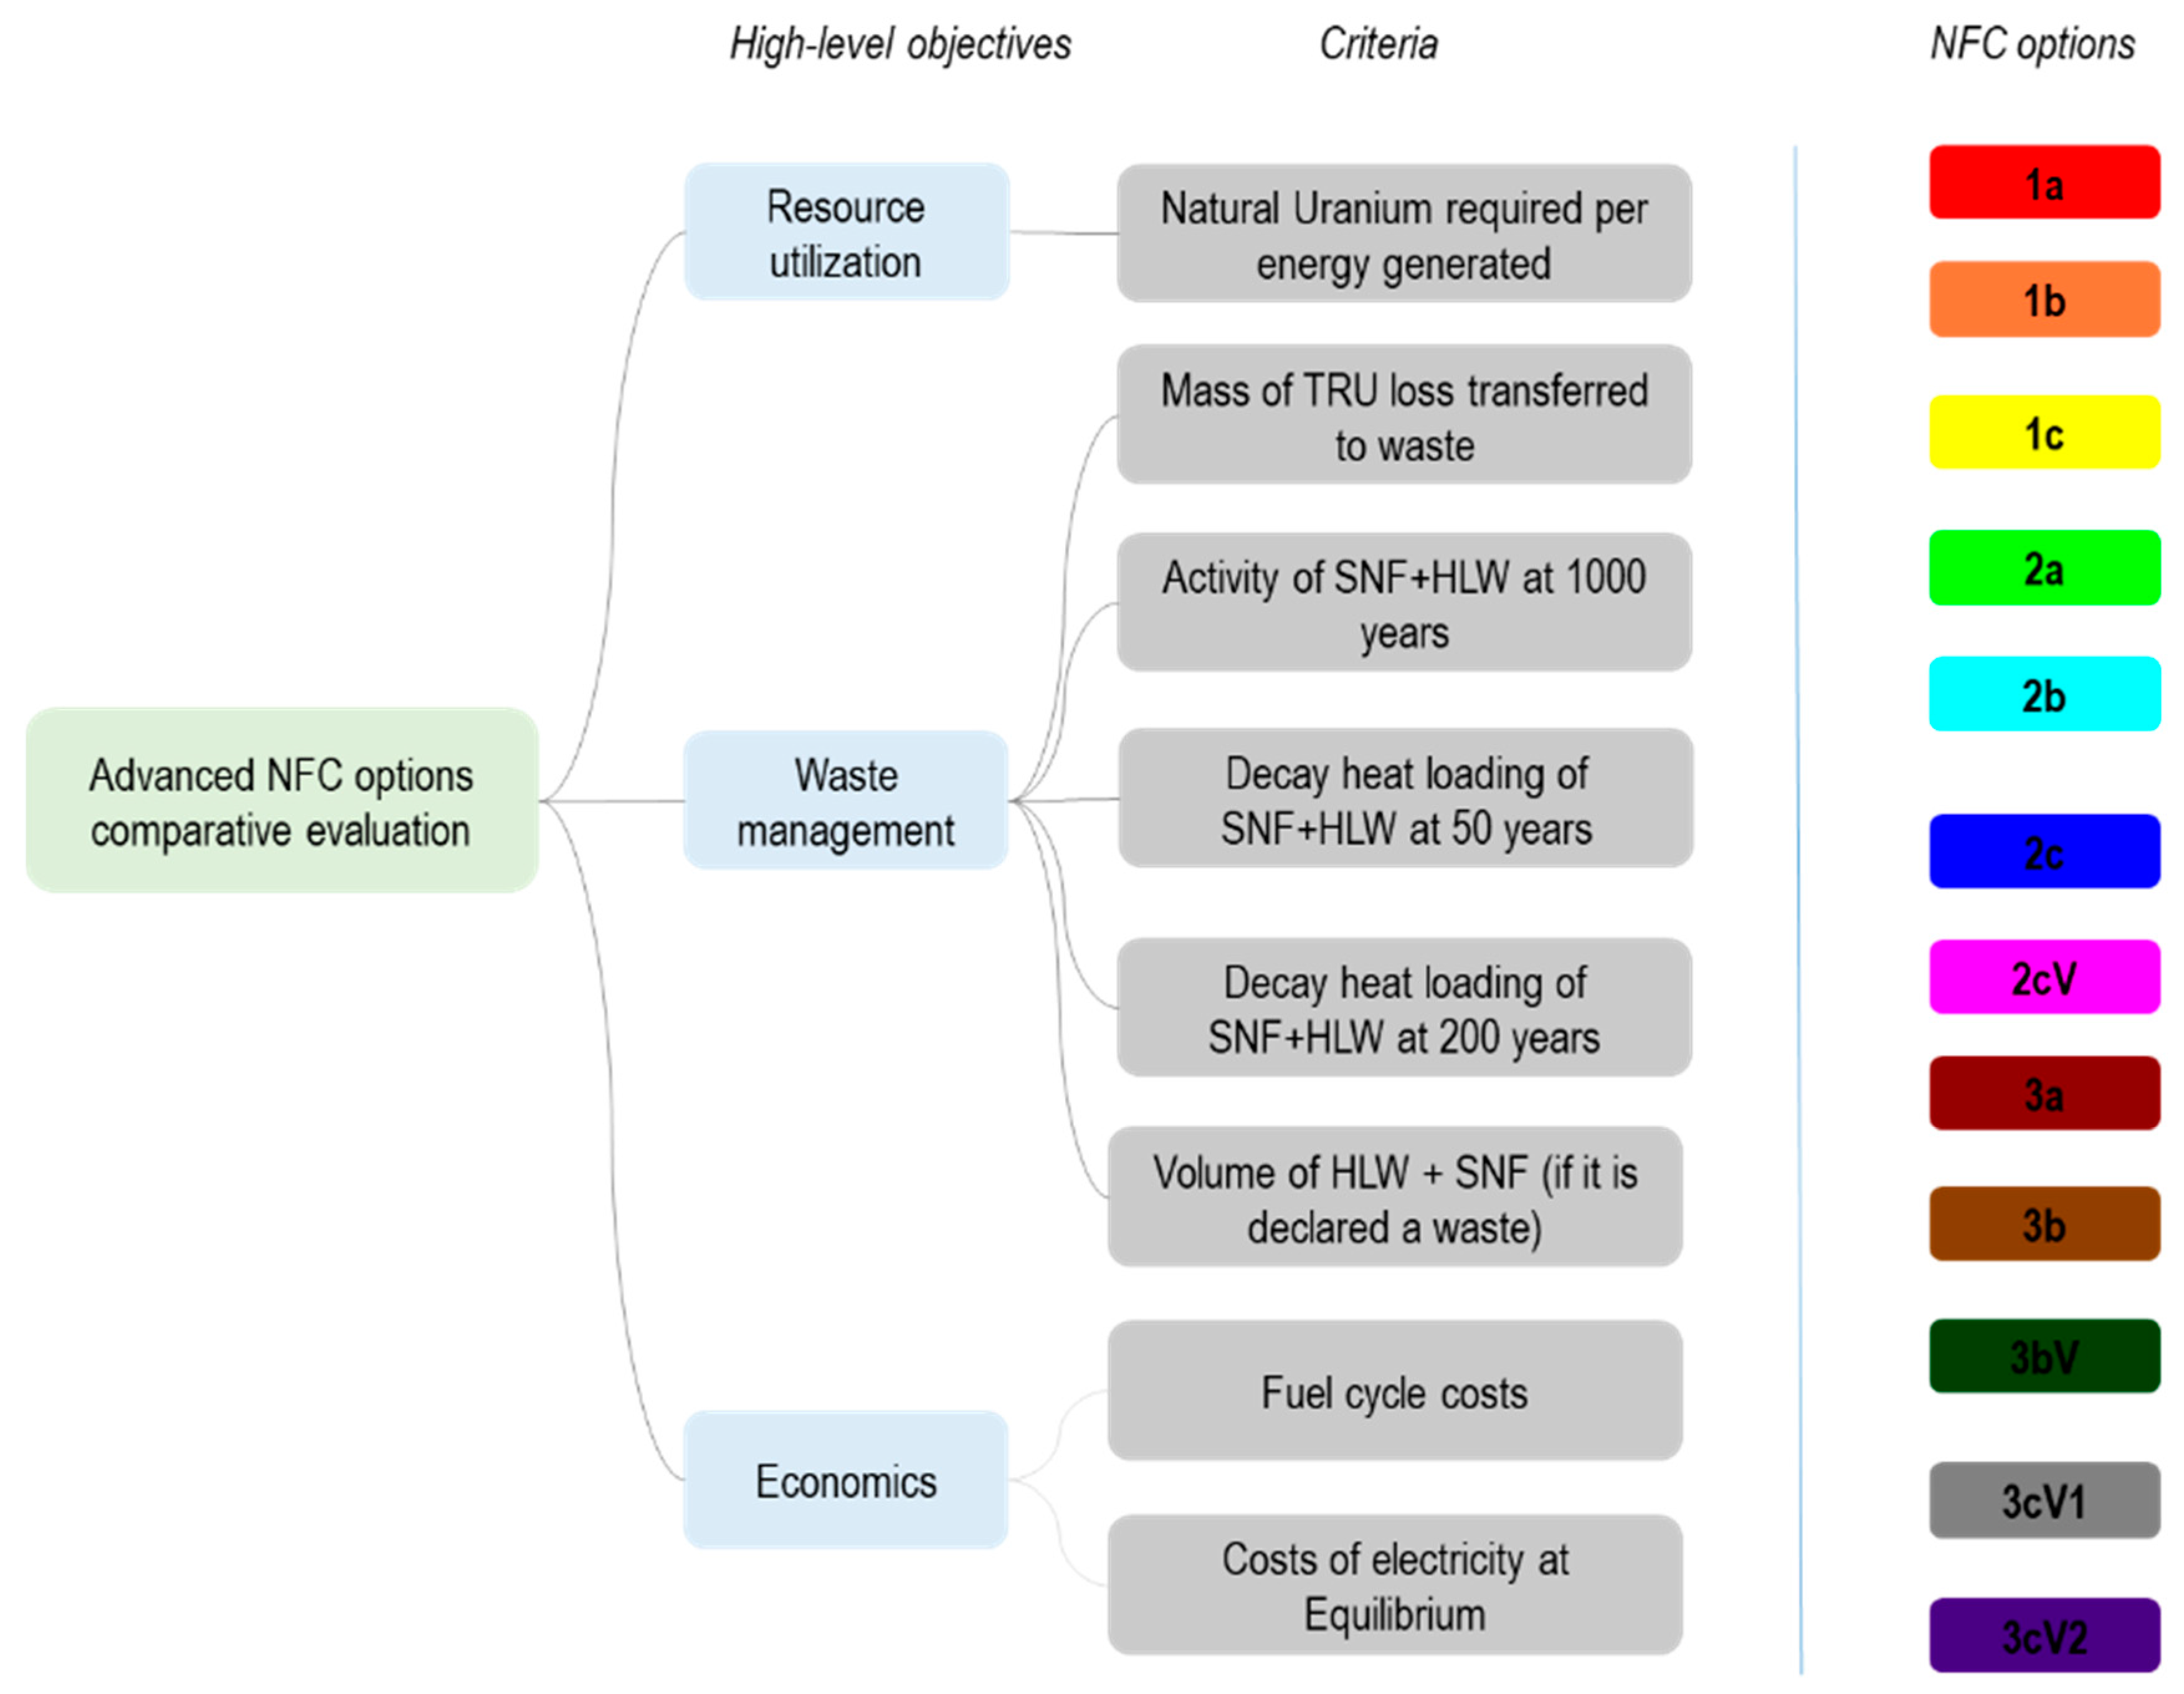
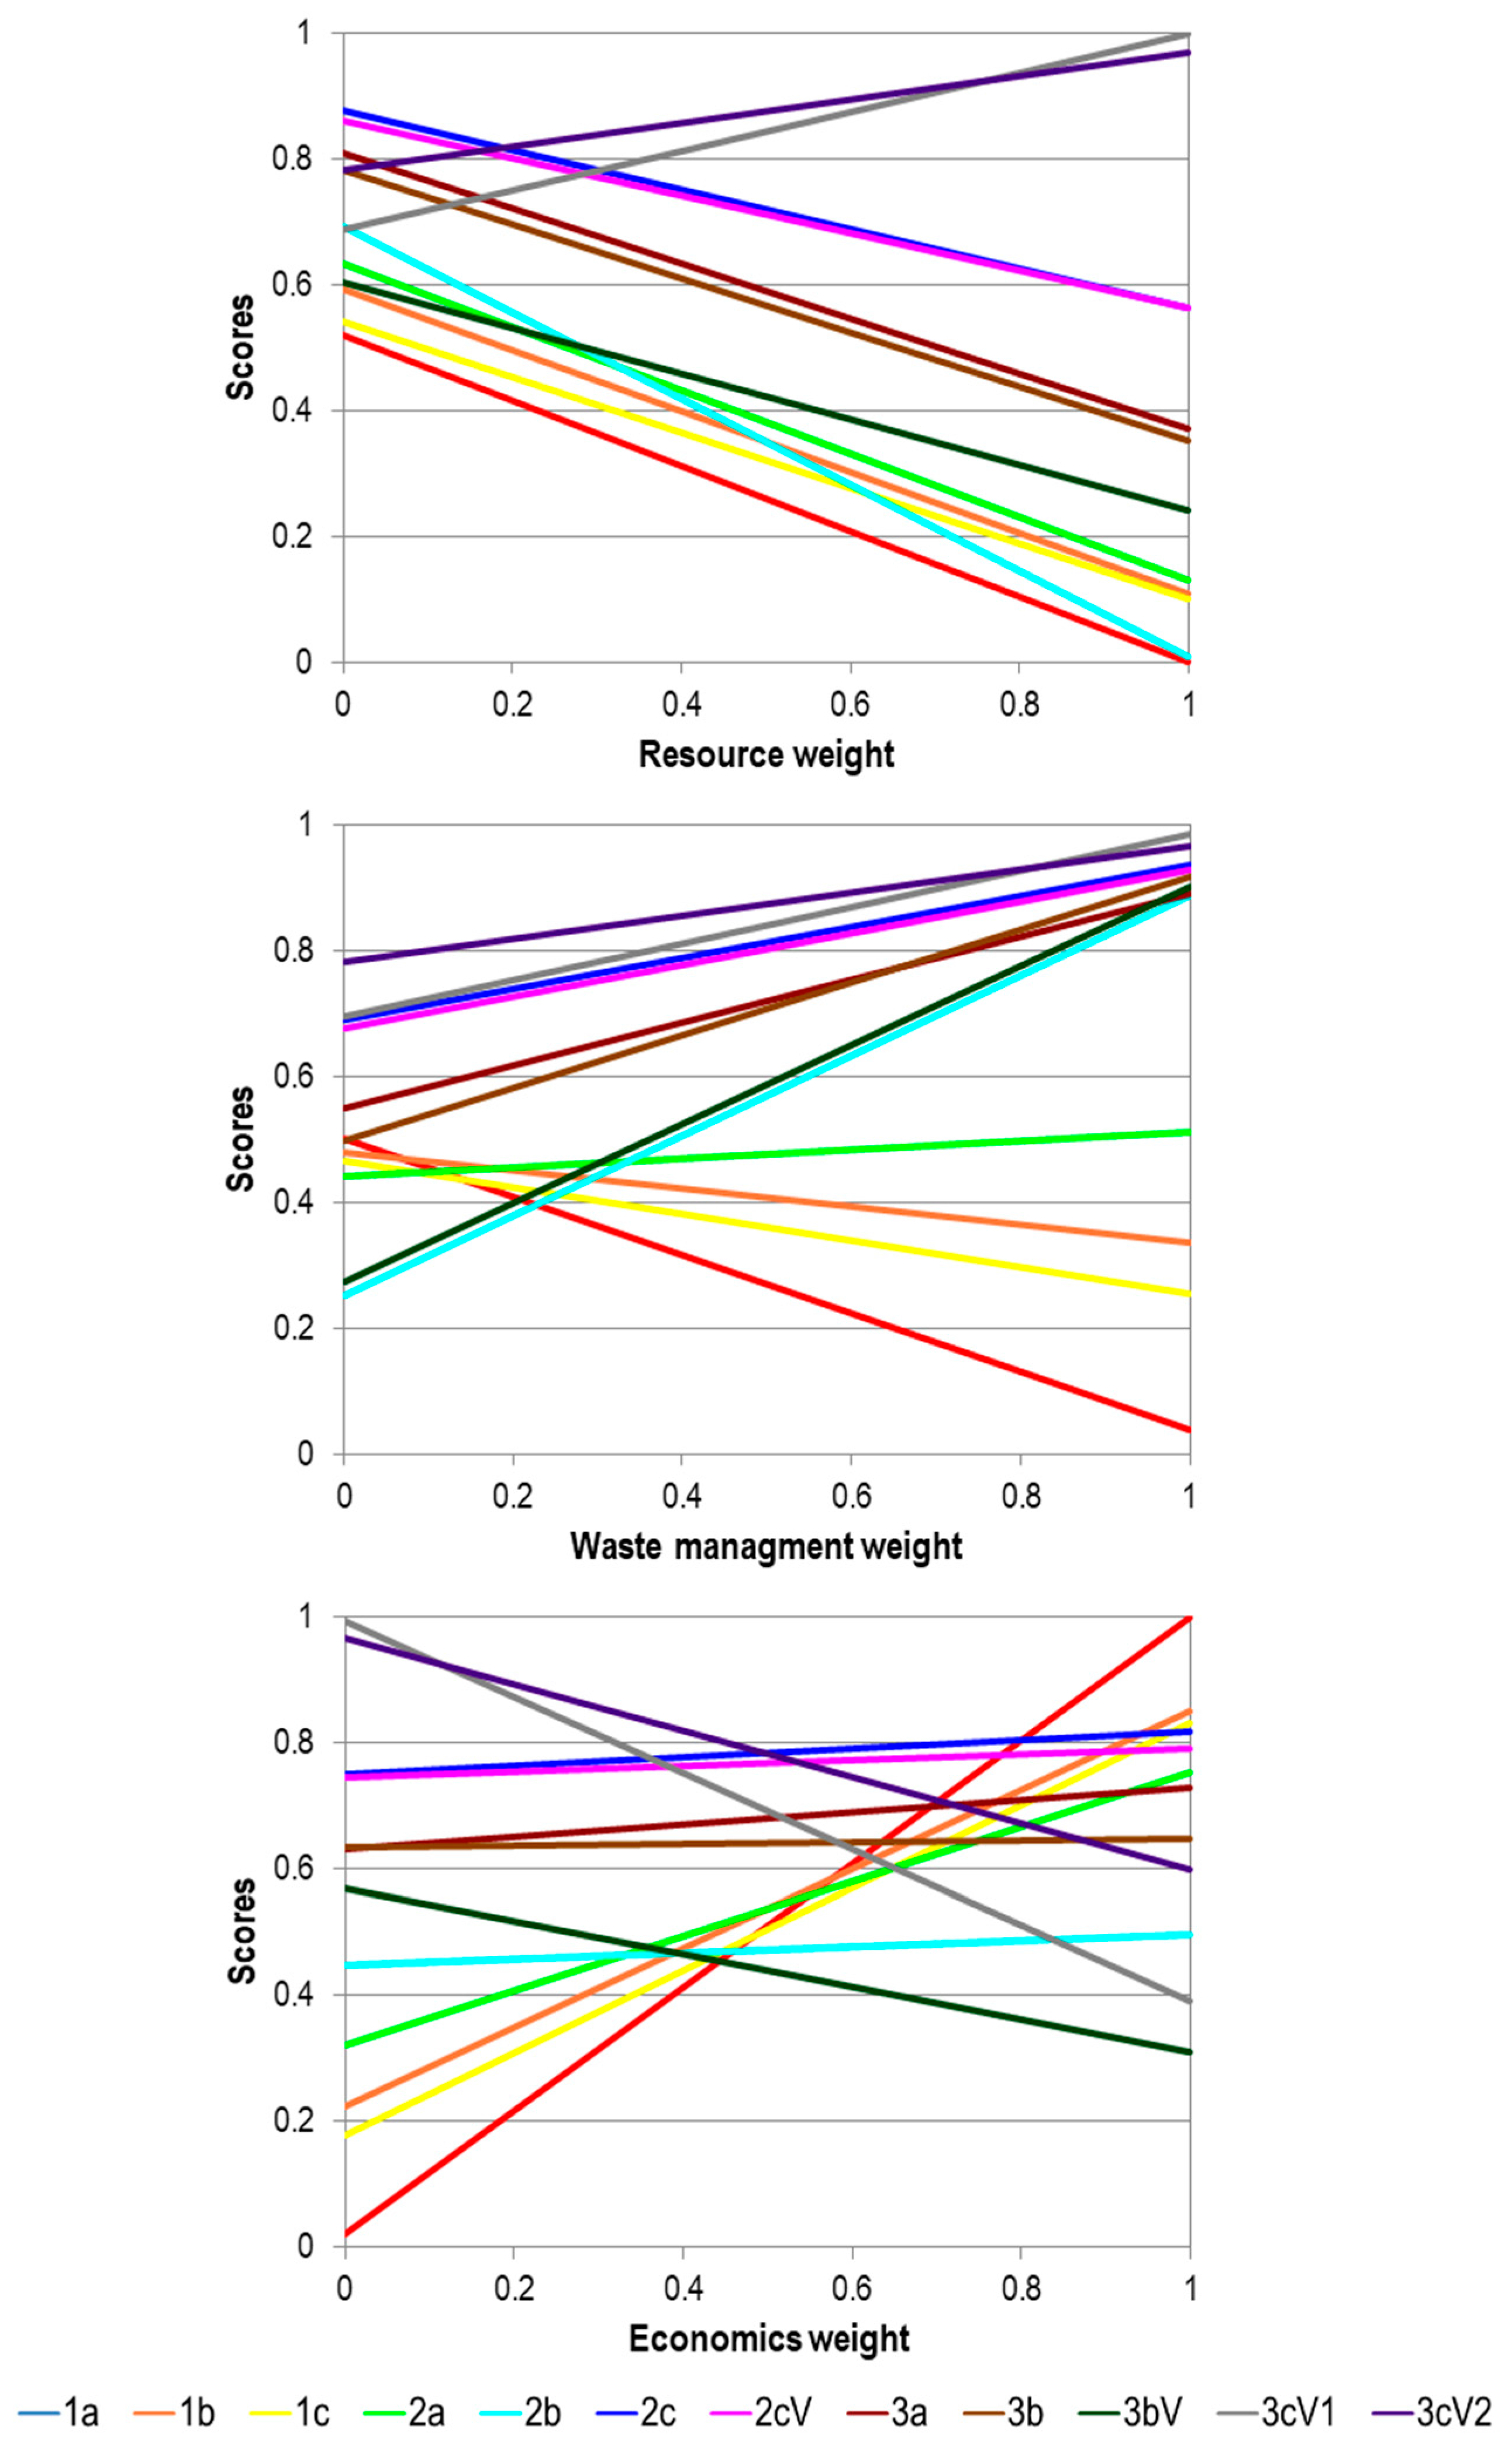
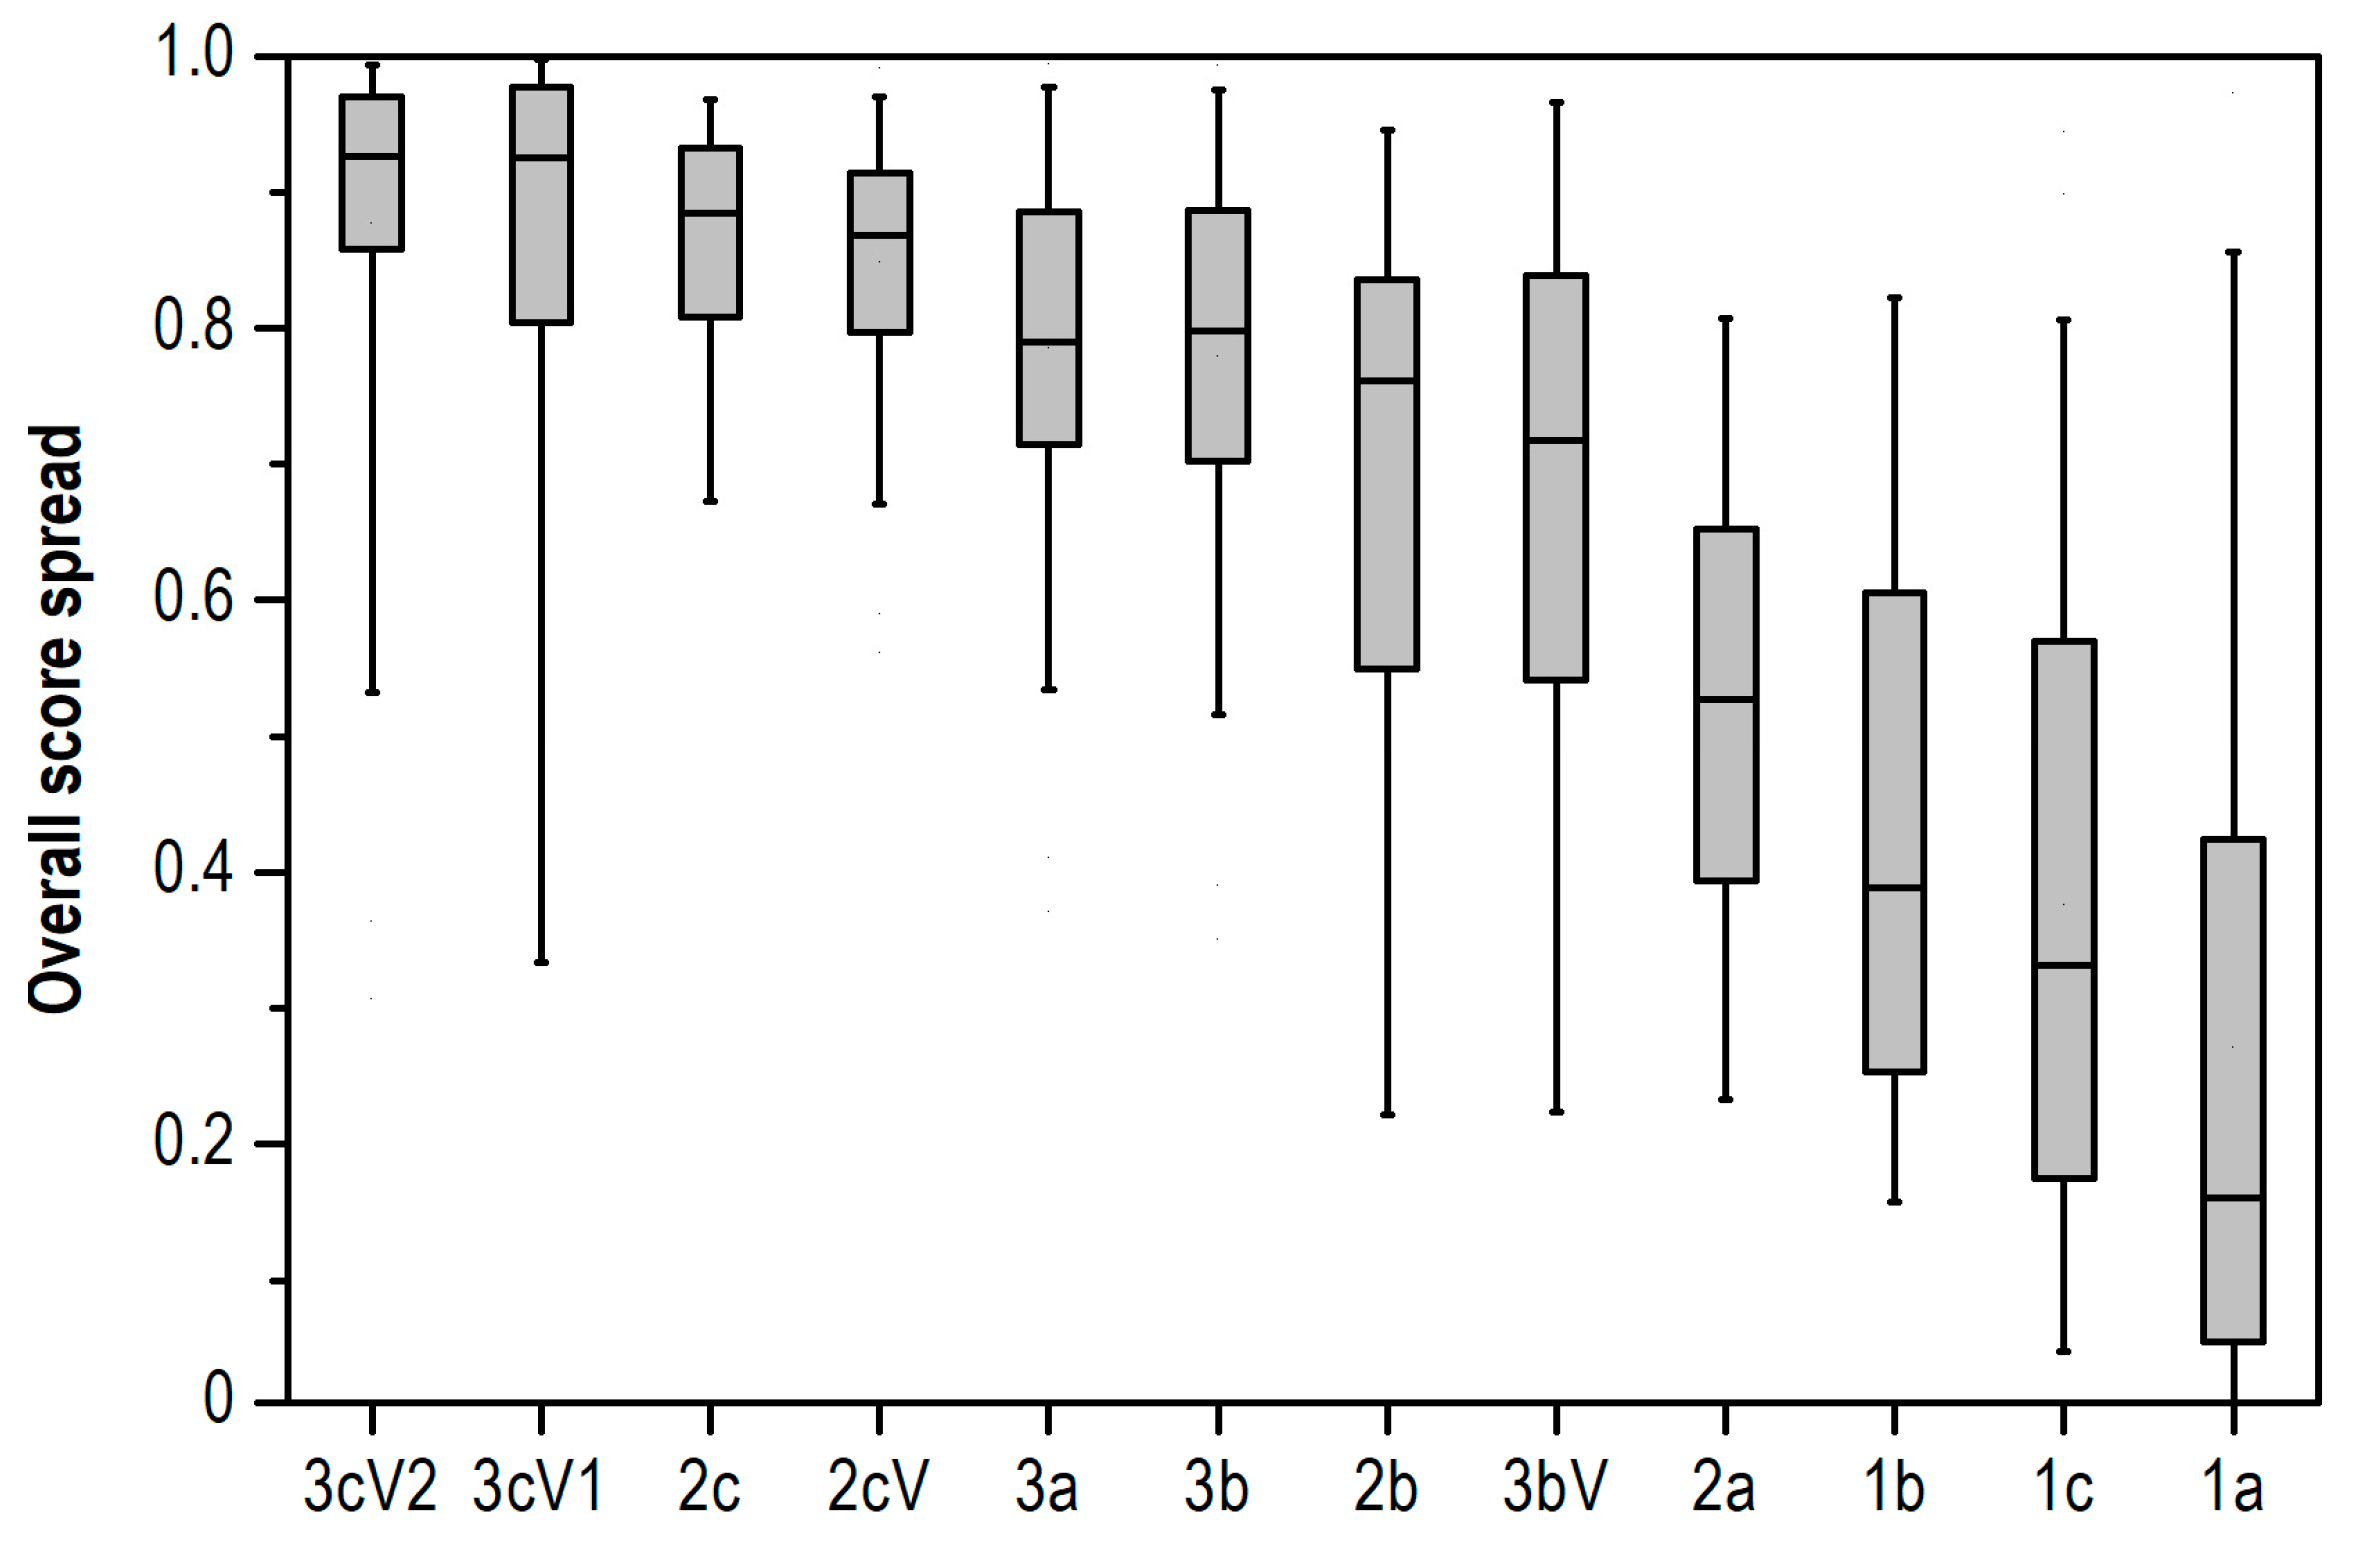
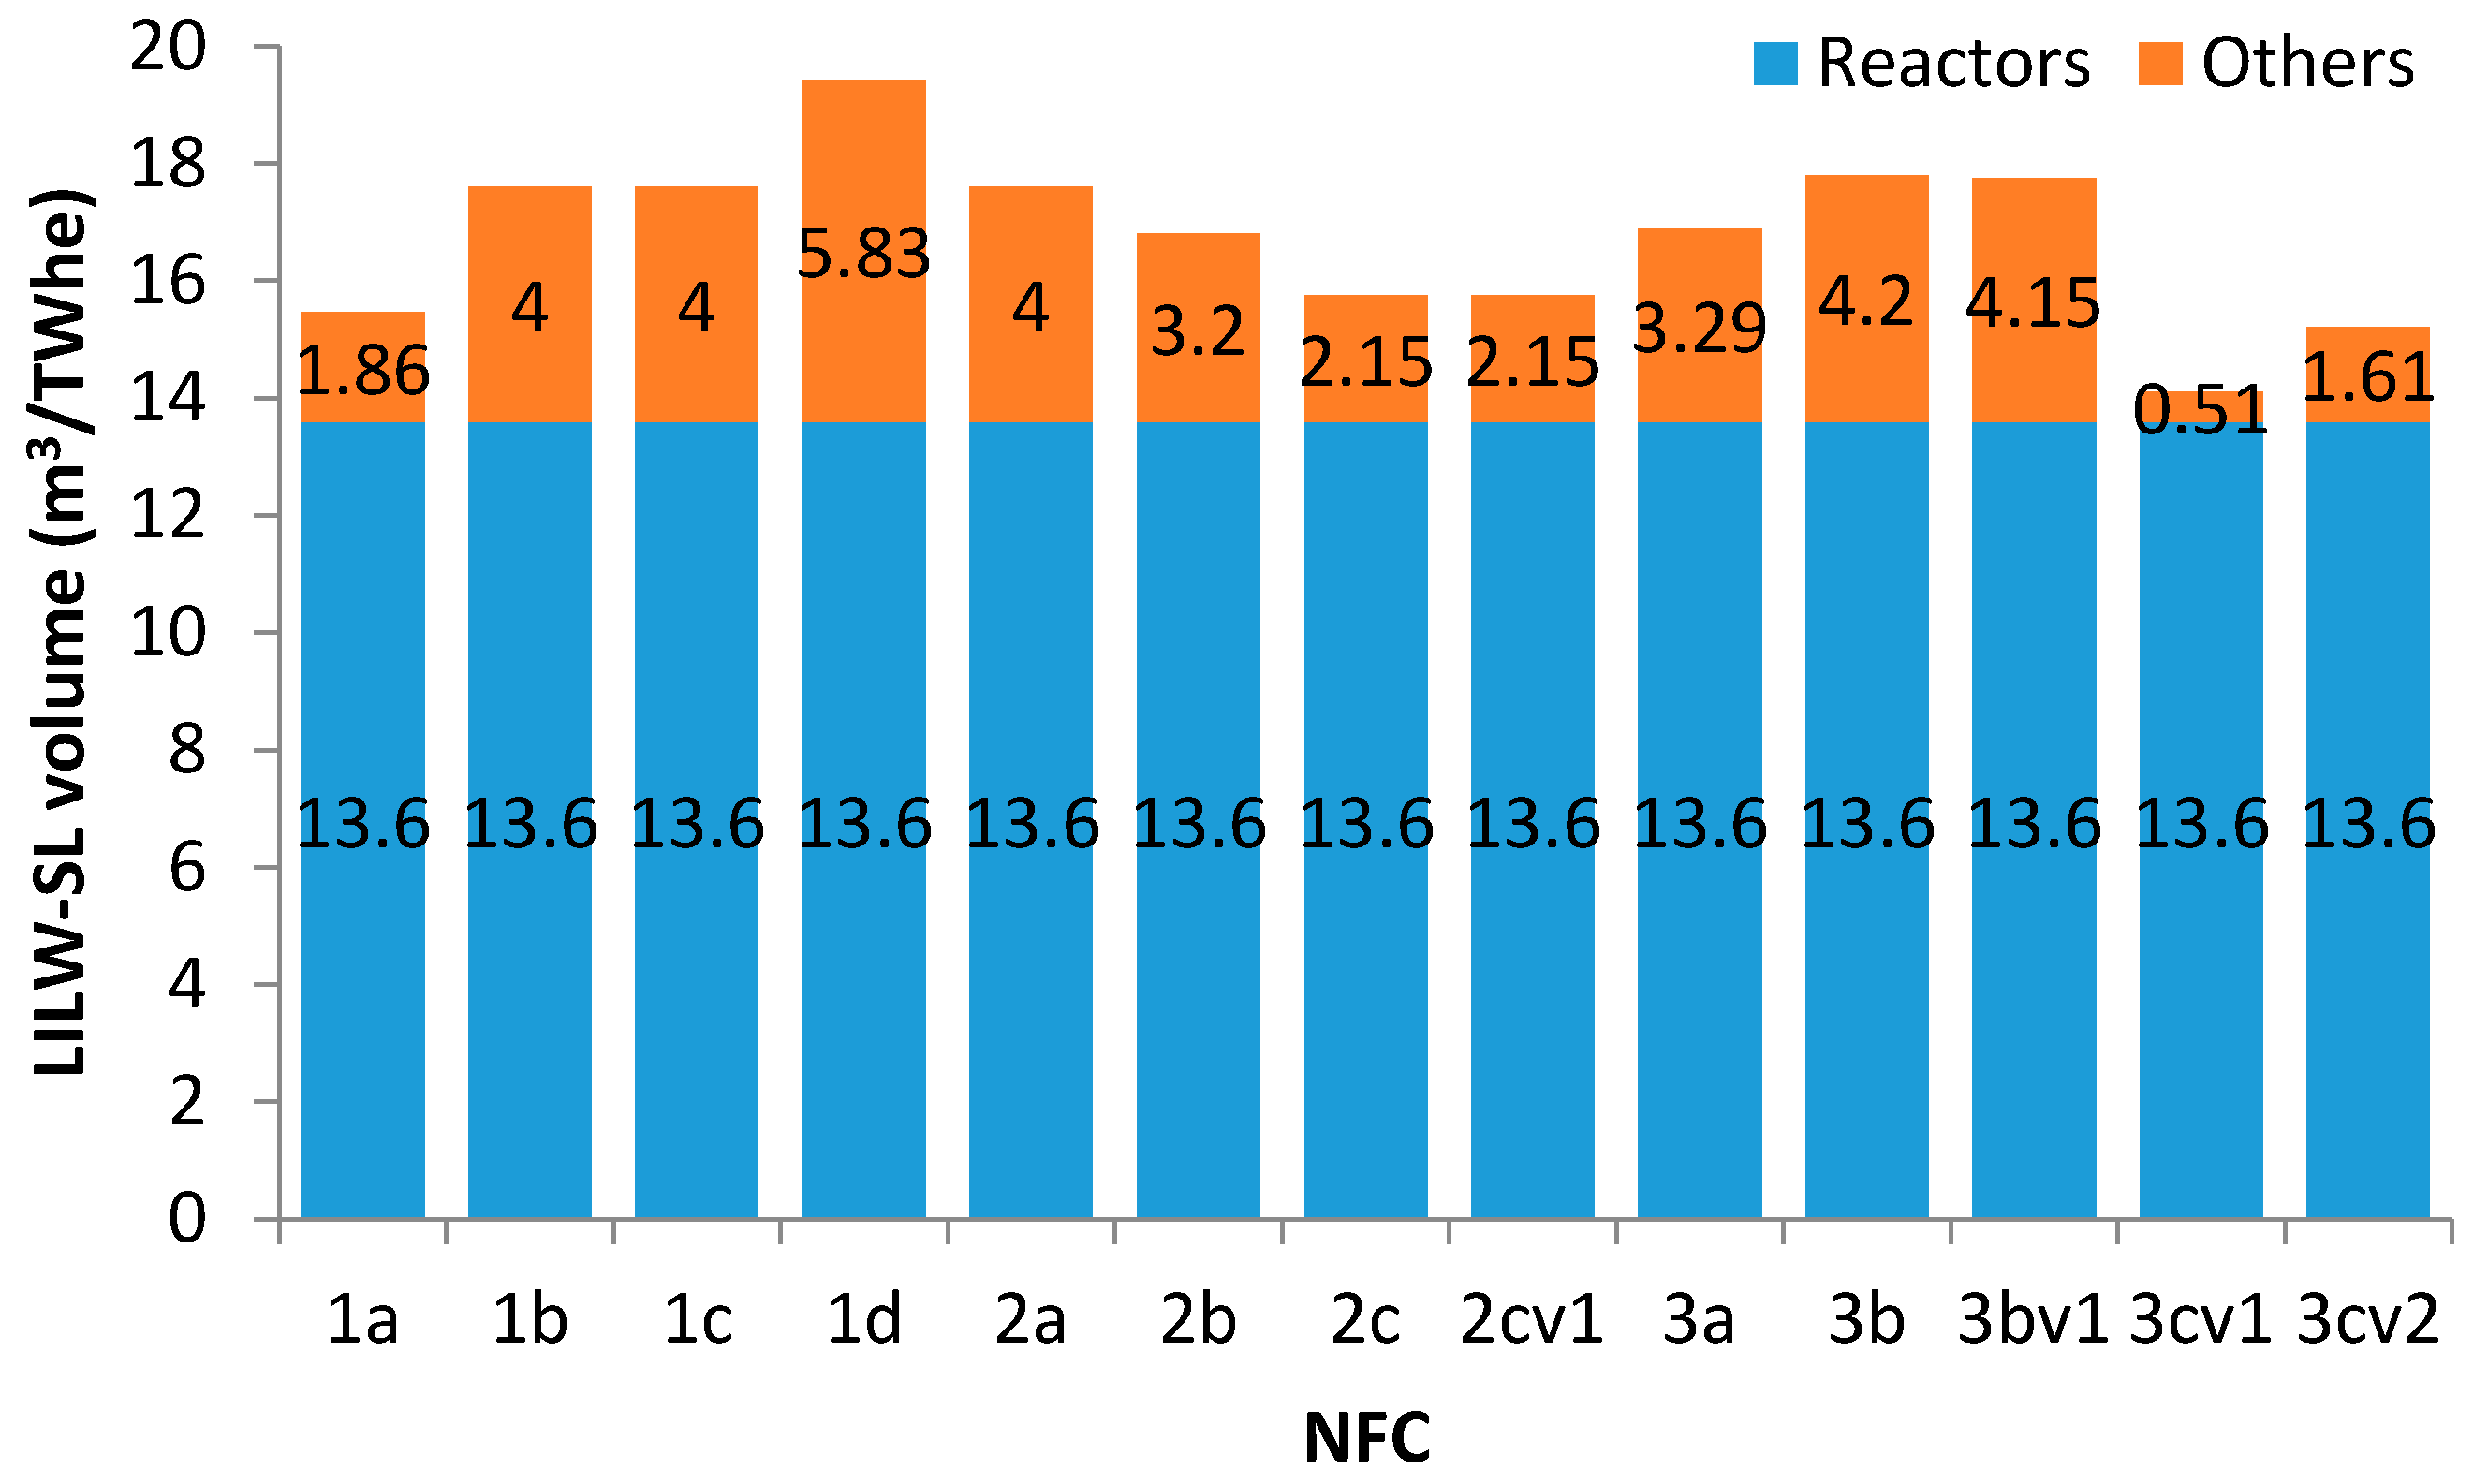
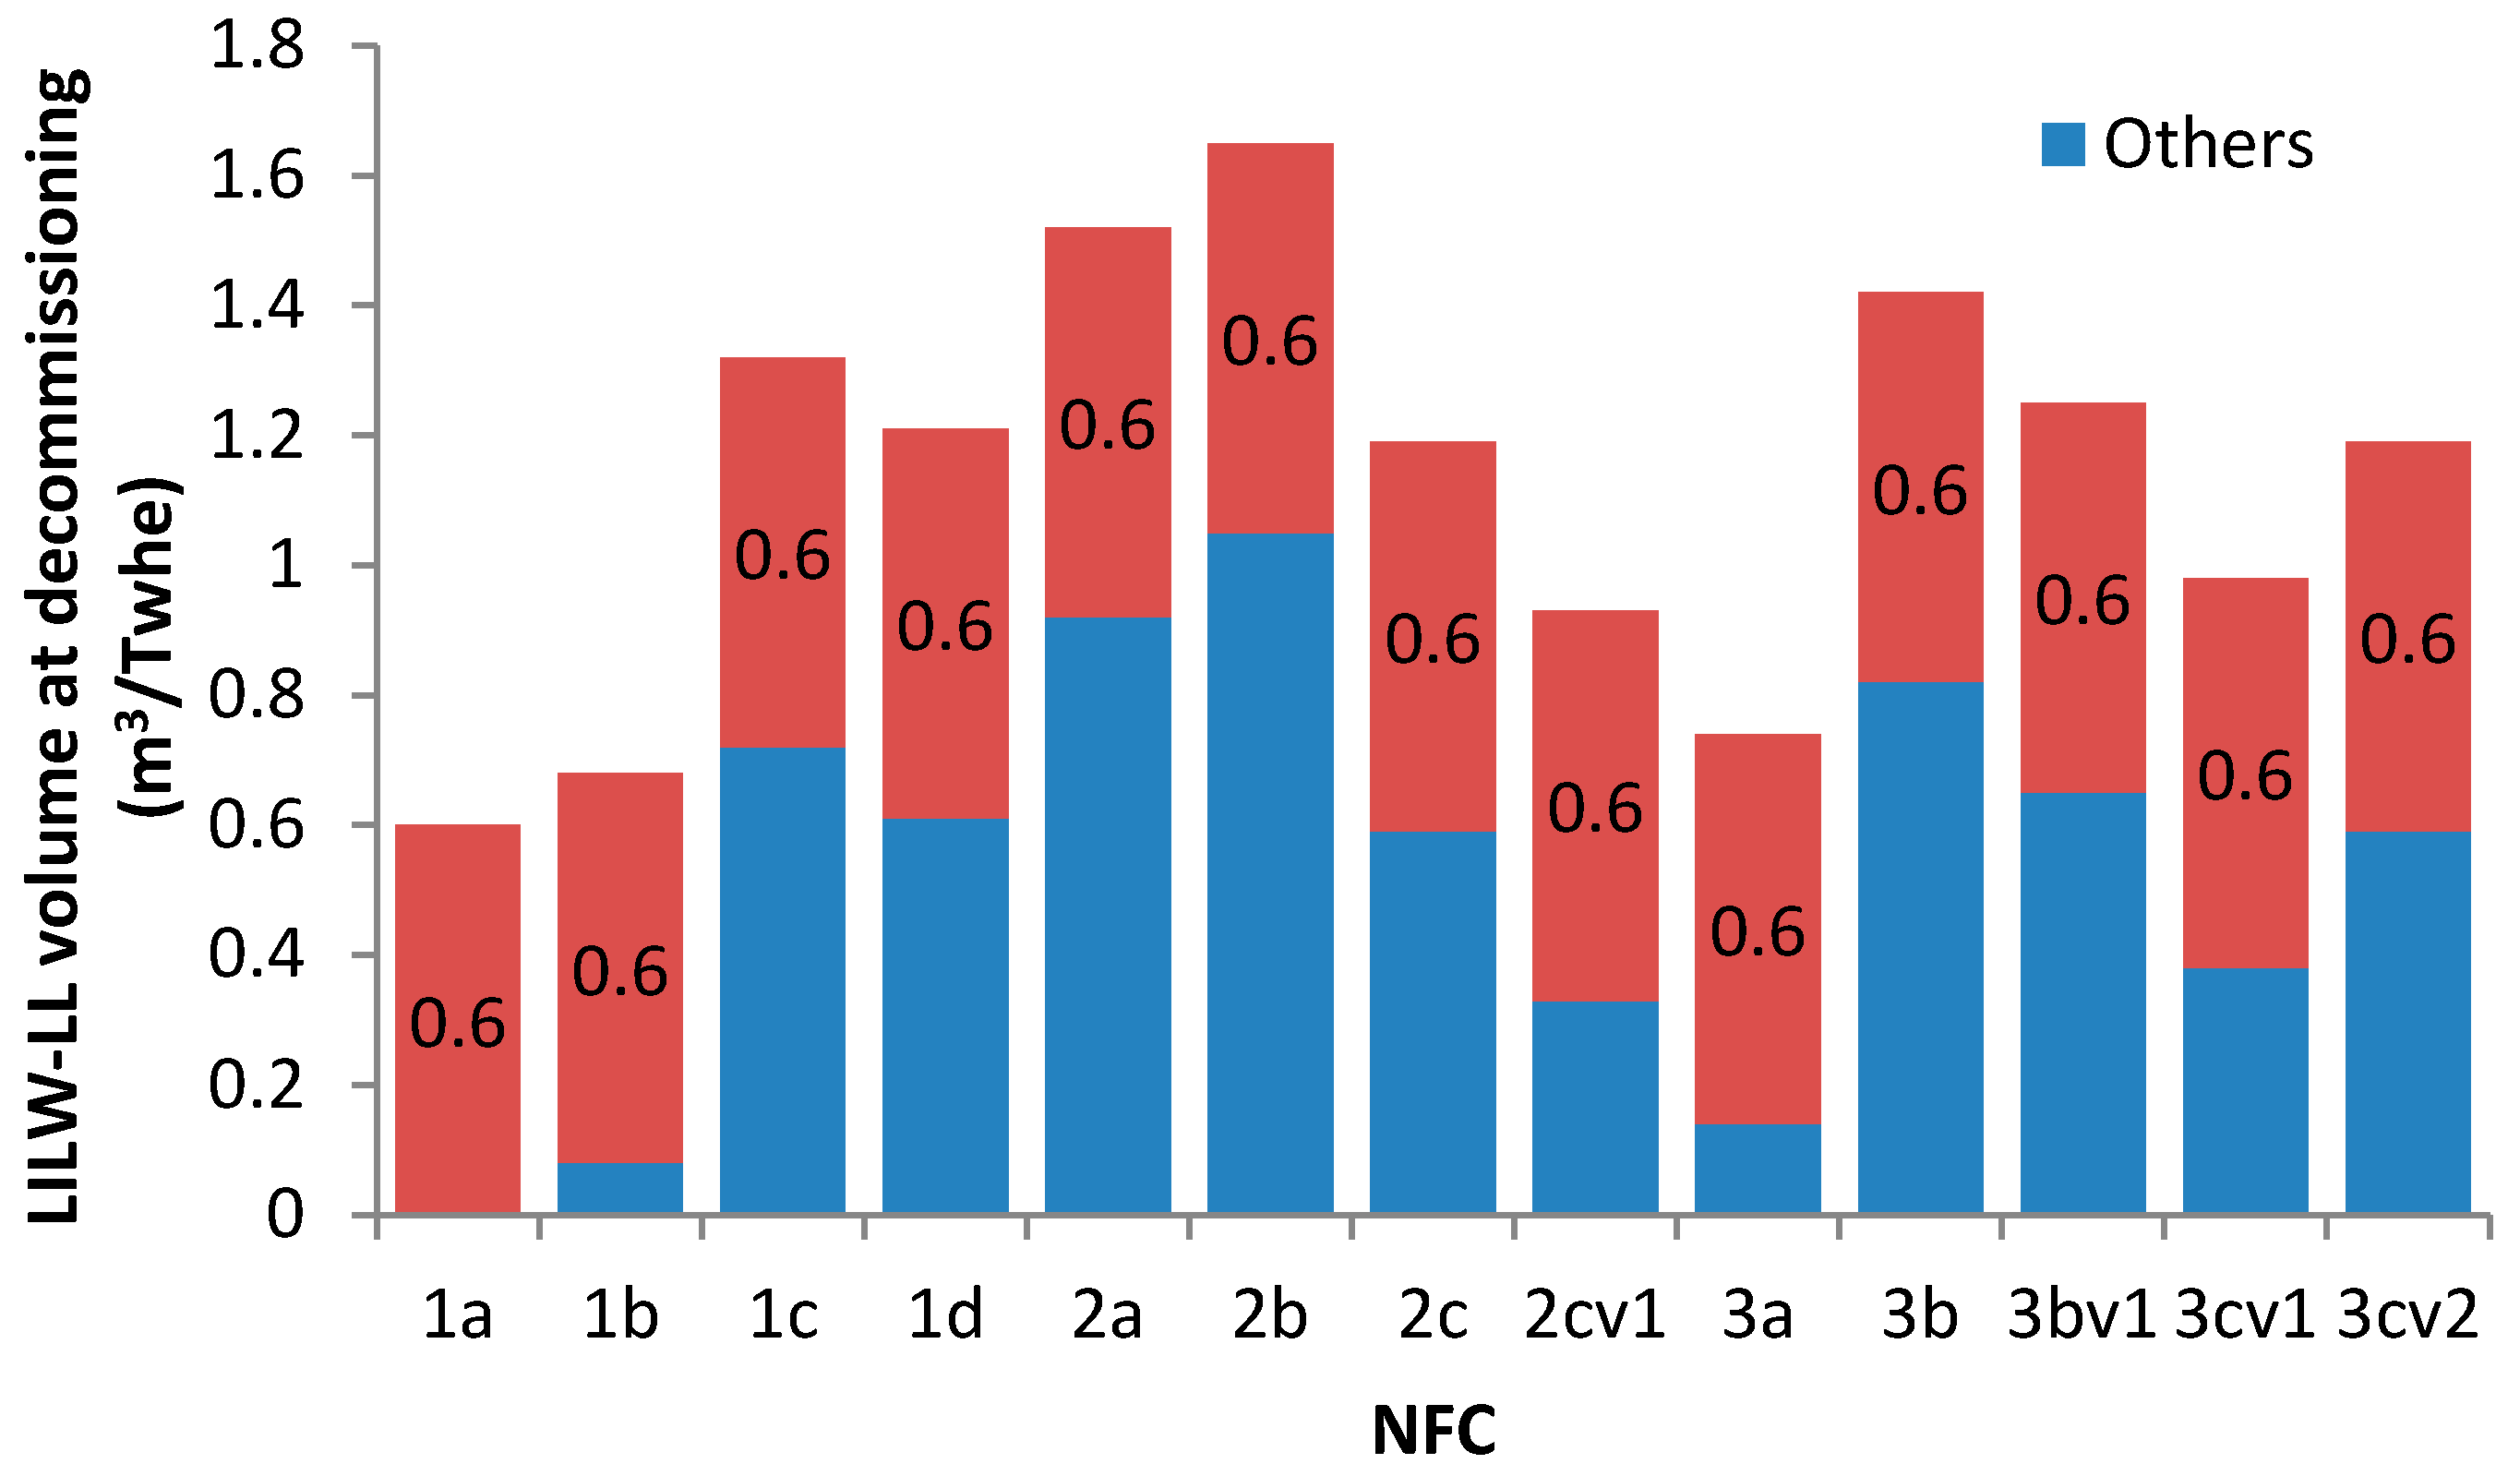
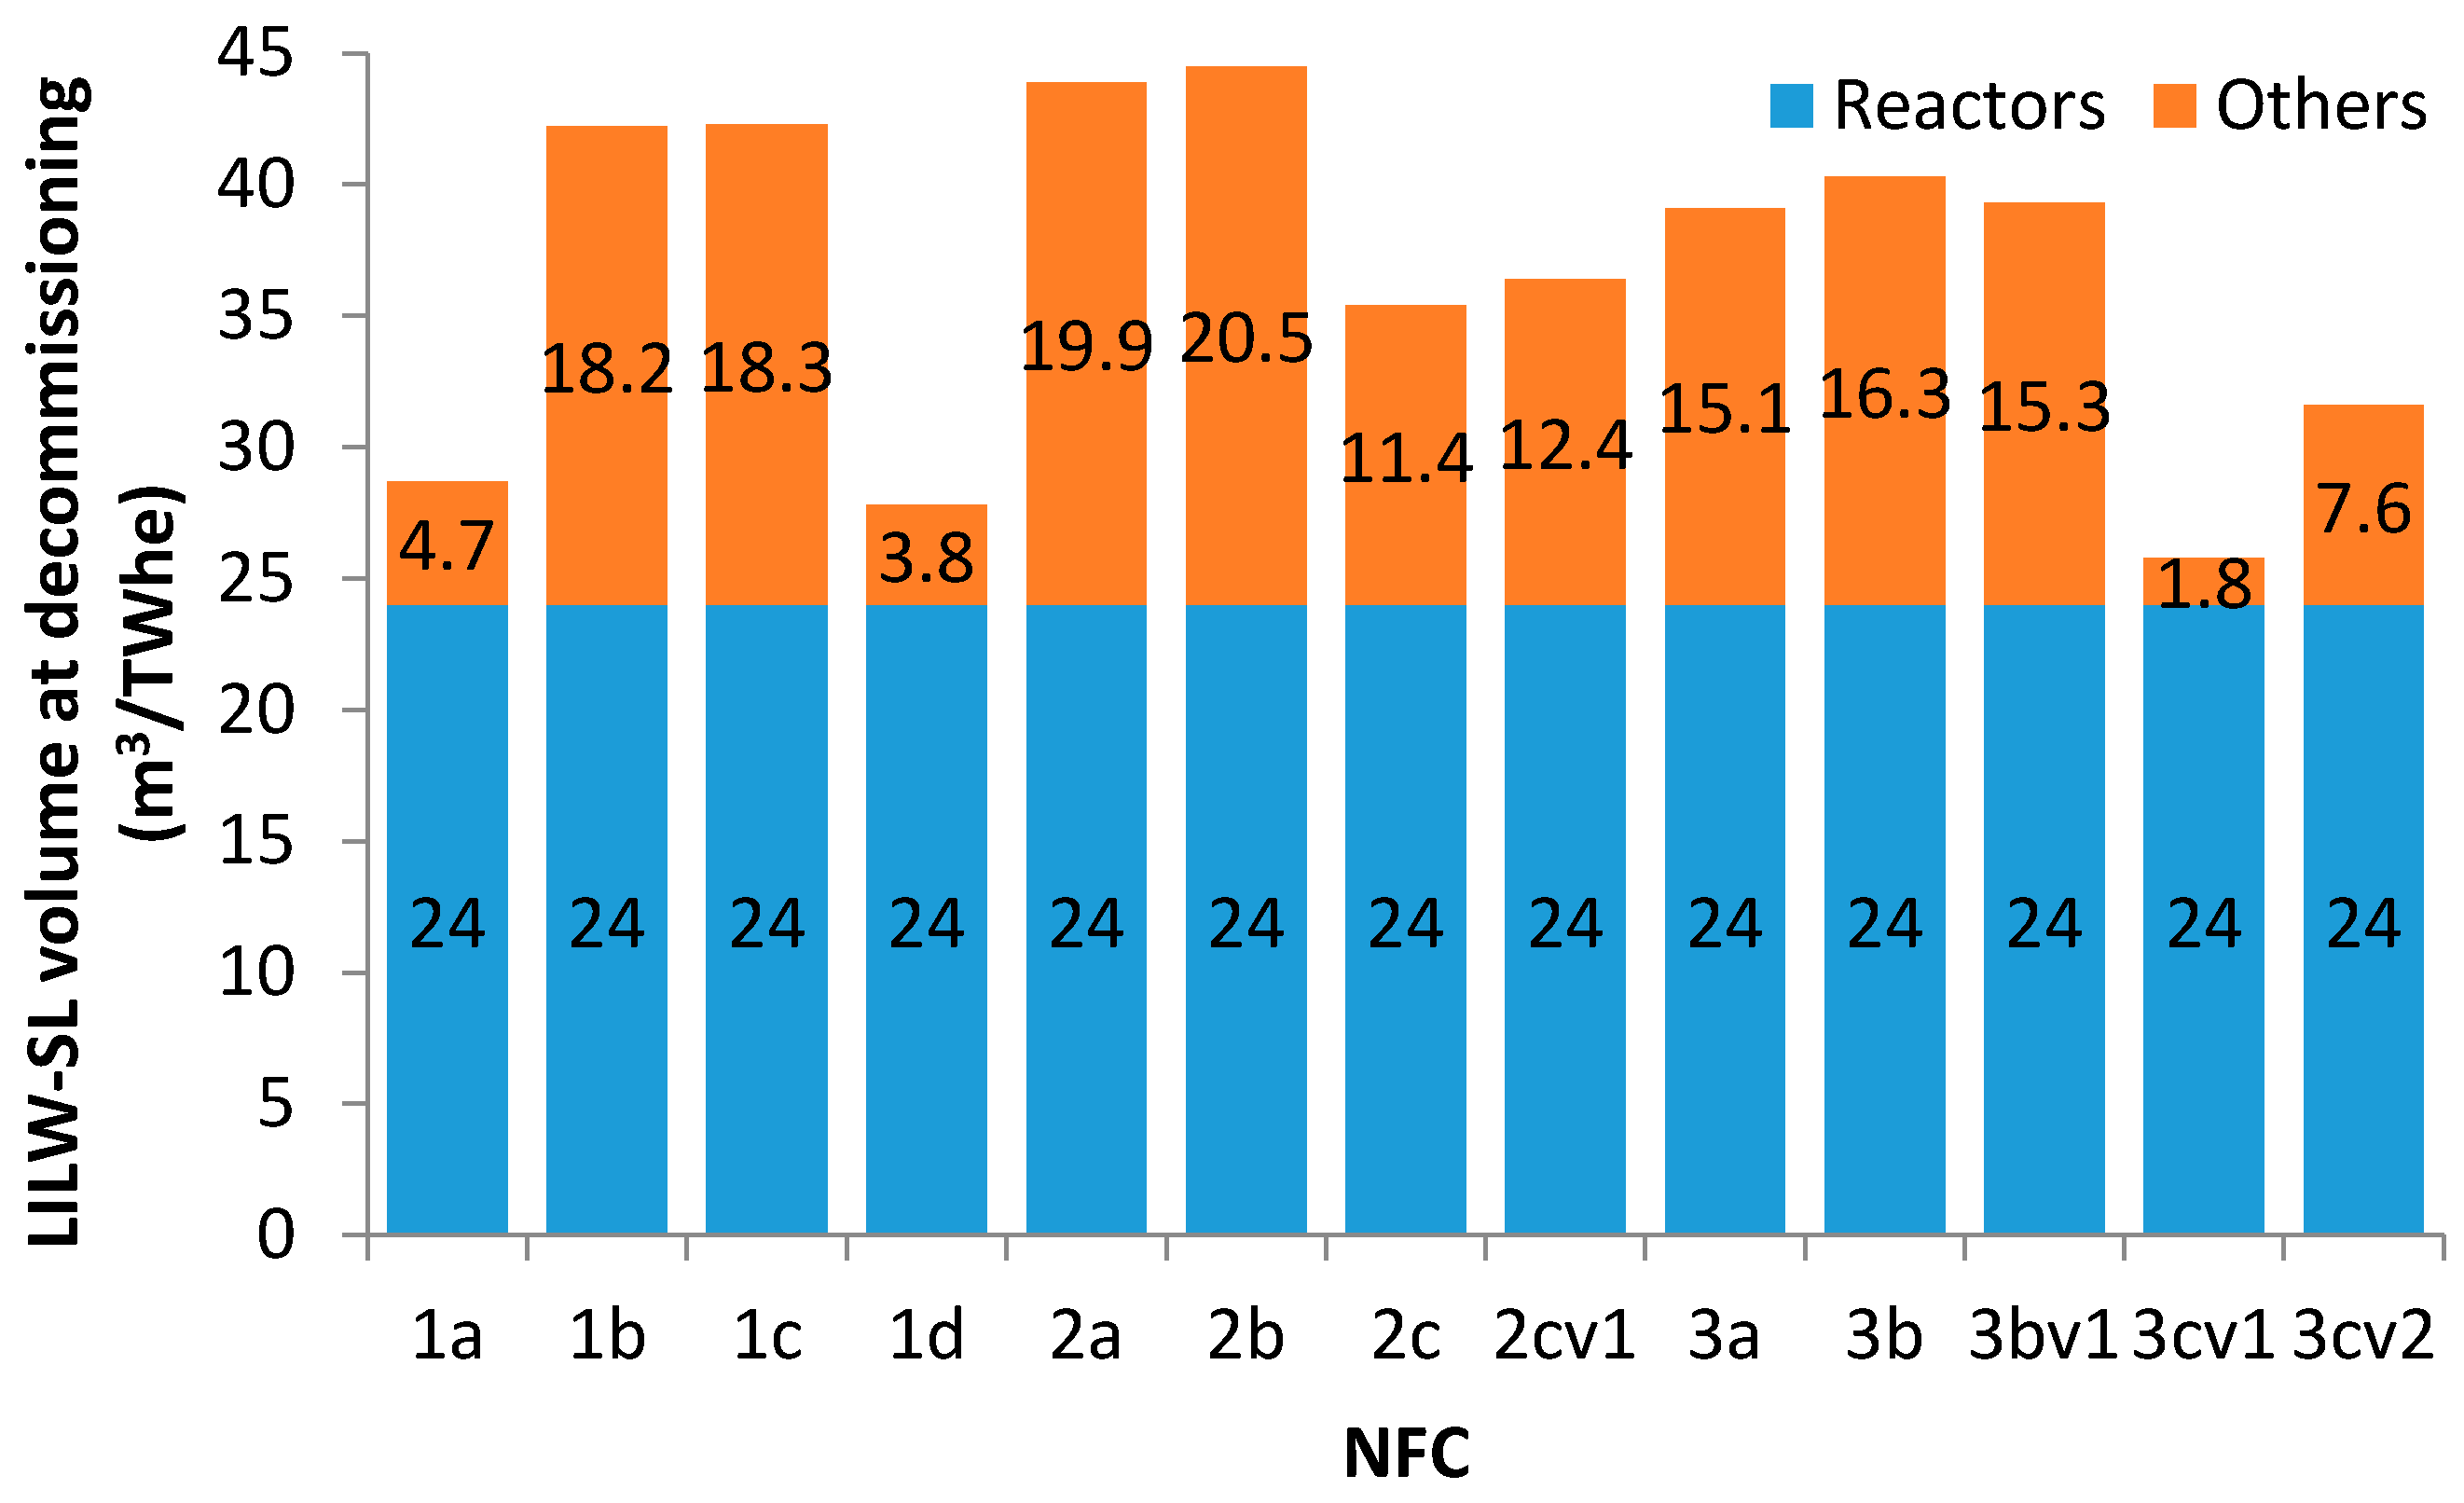
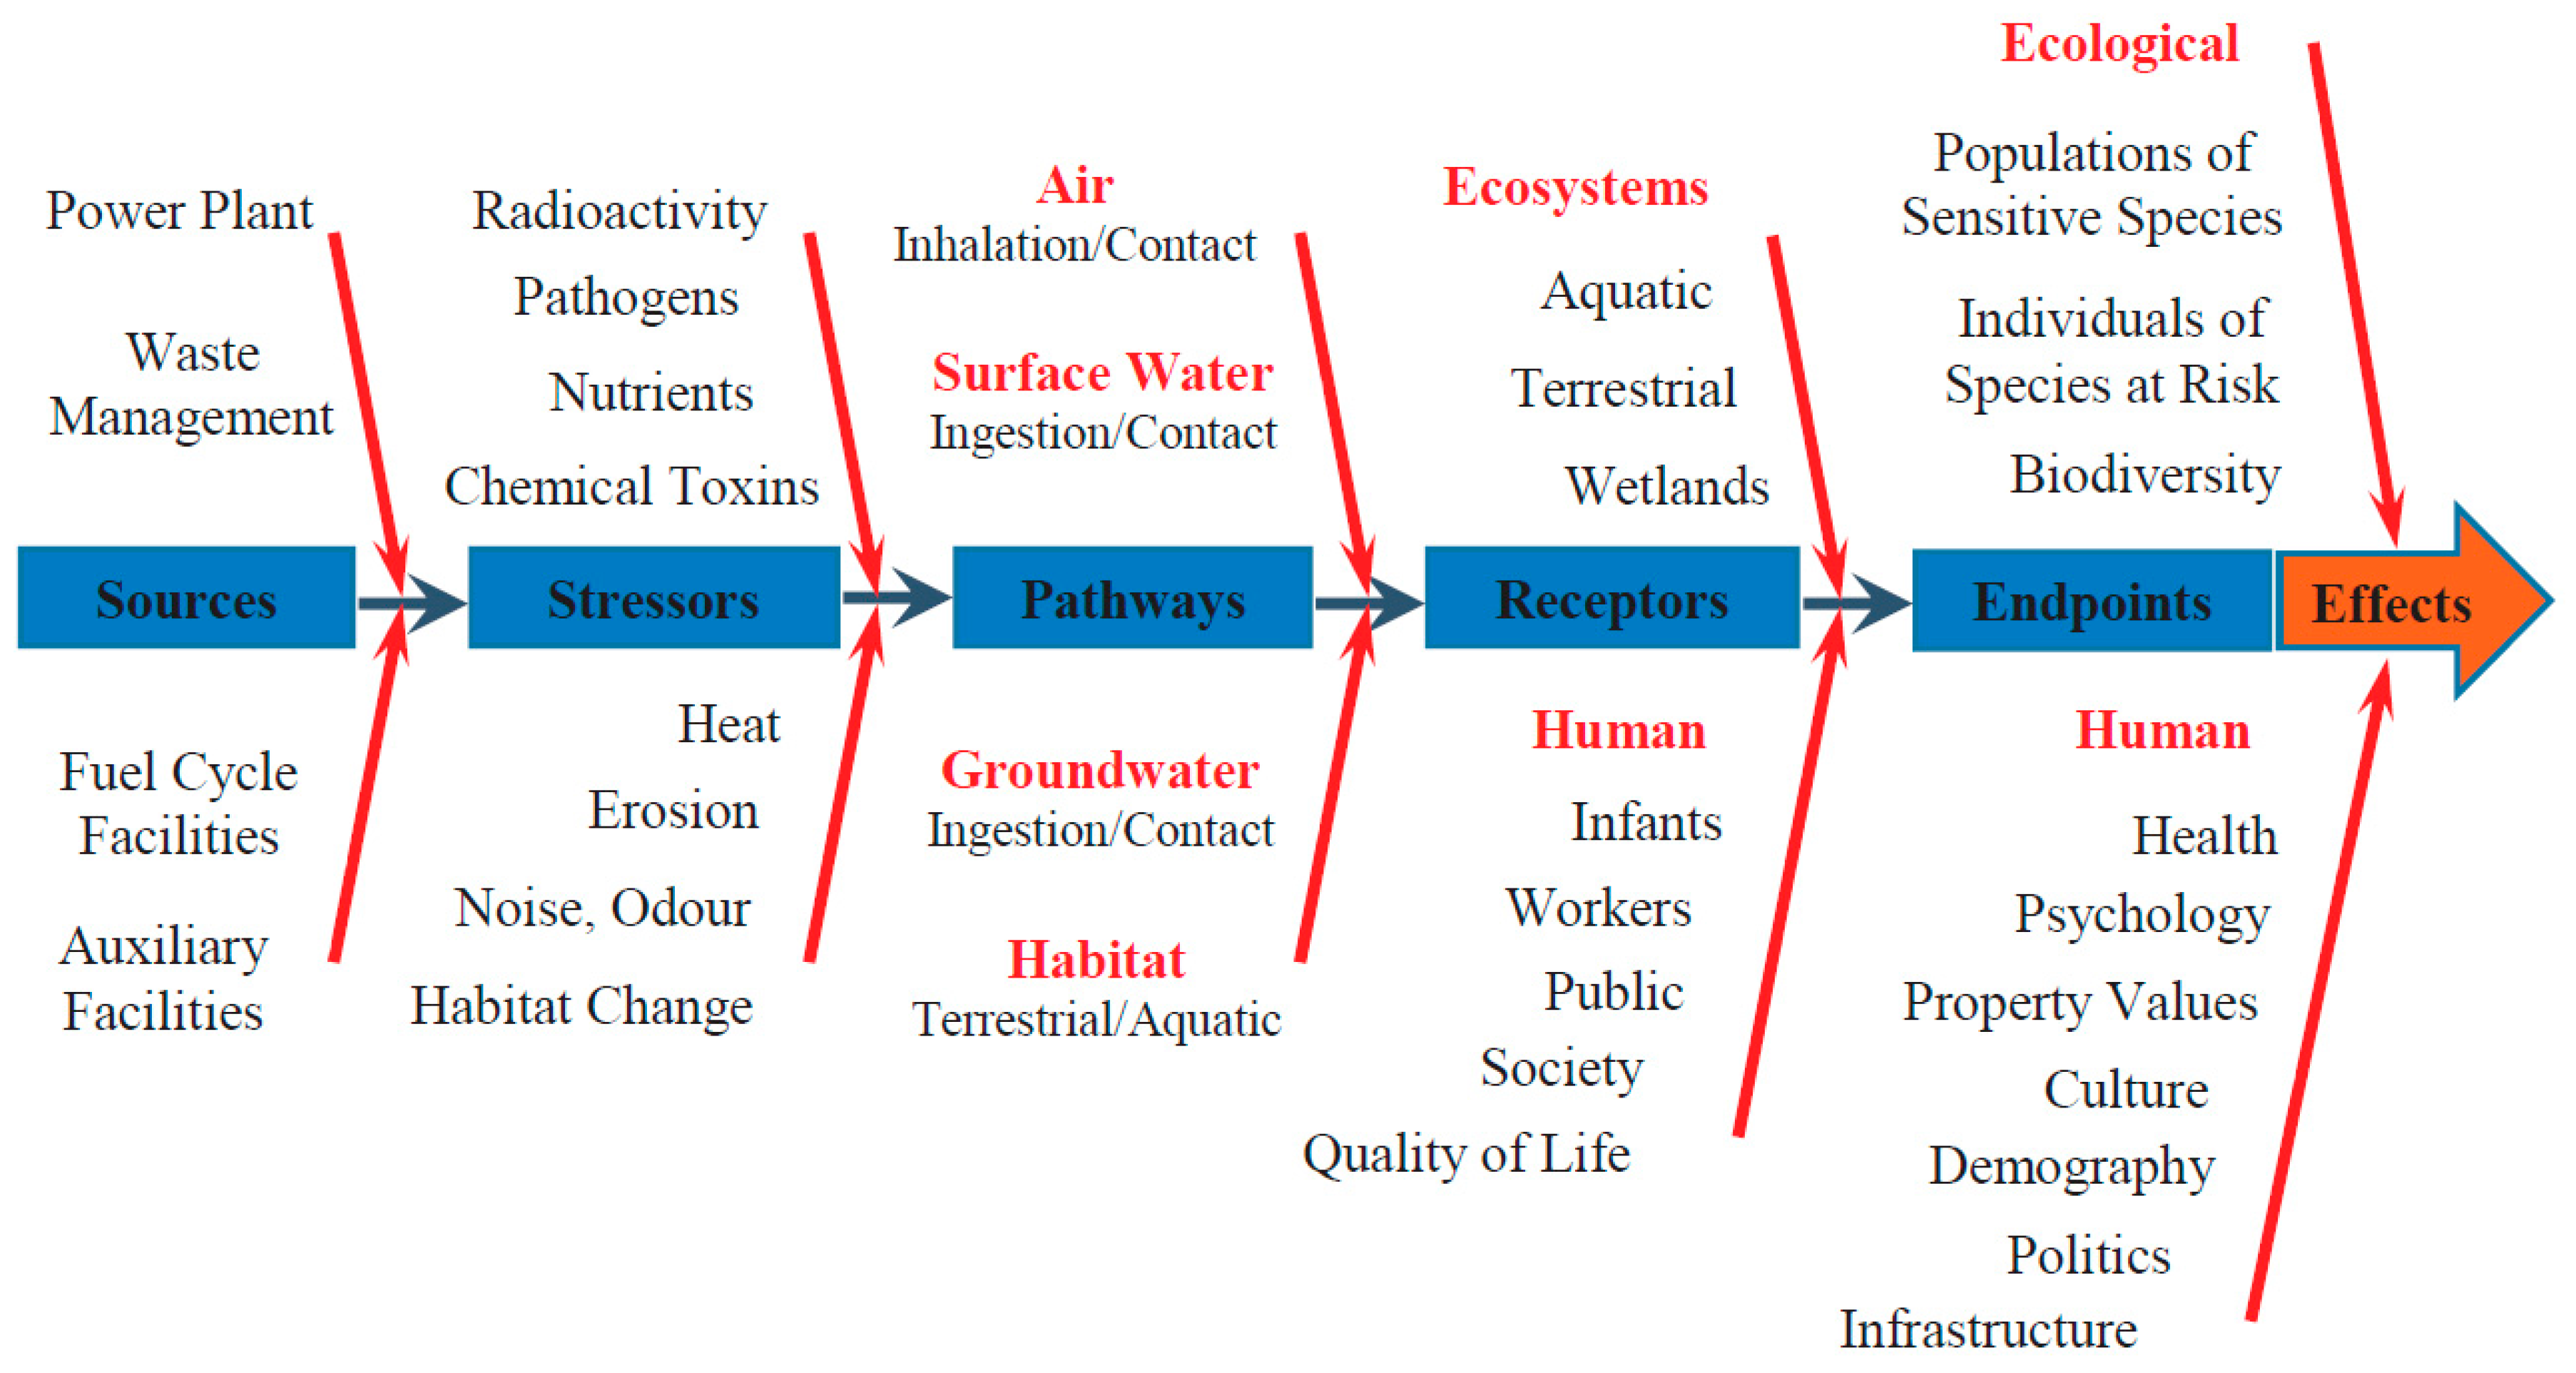
Table 1.
NEA/OECD advanced NFC options.
| NFC Options | Comments | Colour Code |
|---|---|---|
| Current industrial practice and extensions | ||
| NFC 1a “Once-through NFC” | reference fuel cycle | |
| NFC 1b “Conventional reprocessing NFC” | Pu is recycled once in the form of MOX | |
| NFC 1c (Variant of Scheme 1b) | avoids the separation of pure Pu by recycling Np together with Pu | |
| Partially closed NFC | ||
| NFC 2a “Plutonium burning in LWR” | uses LWRs only, requires MOX fuel with enriched uranium (MOX-EU) | |
| NFC 2b “Pu and Am burning in LWR” | requires two types of MOX-EU fuel, Am-Cm separation (Cm decay products (mostly Pu) are either disposed or recycled as MOX) | |
| NFC 2c “Heterogeneous Am recycling” | Am is recycled in targets which are disposed after irradiation | |
| NFC 2cV (Variant of Scheme 2c) | Am and Cm goes to storage (decay products are disposed or recycled as MOX fuel) | |
| Closed NFC | ||
| NFC 3a “TRU burning in FR” | based on Integral Fast Reactor concept and avoids any separation of pure Pu | |
| NFC 3b “Double strata fuel cycle” | burns all Pu in conventional LWRs and fast reactors | |
| NFC 3bV (Variant of Scheme 3b) | circumvents the FR stage by transferring the Pu from the PWR-MOX stage directly to the ADS | |
| NFC 3cV1 “All-FR strategy” | based on Gen-IV gas-cooled fast reactor | |
| NFC 3cV2 (Variant of Scheme 3c) | based on European Fast Reactor (EFR) using MOX fuel reprocessed by UREX+, uranium is not recycled | |
Table 2.
Criteria set.
| Area | Criteria | Abbr. |
|---|---|---|
| Resource utilization | Natural uranium required per energy generated, kg/TWhe | Cr.-1 |
| Nuclear waste management | Mass of TRU loss transferred to waste, kg/TWhe | Cr.-2 |
| Activity of SNF+HLW at 1000 years, TBq/TWhe | Cr.-3 | |
| Decay heat loading of SNF + HLW at 50 years, Watt/TWhe | Cr.-4 | |
| Decay heat loading of SNF + HLW at 200 years, Watt/TWhe | Cr.-5 | |
| Volume of HLW + SNF (if it is declared a waste), m3/TWhe | Cr.-6 | |
| Economics | Fuel cycle costs, mills/kWh | Cr.-7 |
| Costs of electricity at Equilibrium, mills/kWh | Cr.-8 |
Table 3.
Performance table.
| Criteria | NFC Options | |||||||||||
|---|---|---|---|---|---|---|---|---|---|---|---|---|
| 1a | 1b | 1c | 2a | 2b | 2c | 2cV | 3a | 3b | 3bV | 3cV1 | 3cV2 | |
| Cr.-1 | 1 | 0.89 | 0.9 | 0.87 | 0.99 | 0.44 | 0.44 | 0.63 | 0.65 | 0.76 | 0.004 | 0.036 |
| Cr.-2 | 29.78 | 20.34 | 21.04 | 8.87 | 4.6 | 1.63 | 3.93 | 0.1 | 0.11 | 0.14 | 0.17 | 0.15 |
| Cr.-3 | 201 | 177 | 178 | 134 | 2.61 | 3.91 | 2.24 | 2.43 | 2.8 | 2.98 | 2.28 | 2.88 |
| Cr.-4 | 2110 | 2030 | 2380 | 2000 | 979 | 888 | 852 | 934 | 963 | 1030 | 572 | 834 |
| Cr.-5 | 591 | 506 | 619 | 337 | 31.7 | 32.1 | 26.7 | 29.6 | 31.9 | 34.1 | 19.3 | 27.5 |
| Cr.-6 | 1 | 0.234 | 0.235 | 0.262 | 0.262 | 0.166 | 0.166 | 0.402 | 0.26 | 0.305 | 0.178 | 0.114 |
| Cr.-7 | 3.55 | 4.53 | 4.66 | 5.13 | 6.71 | 3.84 | 4 | 4.69 | 5.25 | 7.45 | 4.41 | 3.98 |
| Cr.-8 | 36.42 | 37.1 | 37.22 | 37.69 | 39.27 | 40.69 | 40.85 | 40.07 | 40.37 | 41.98 | 51.06 | 46.57 |
Table 4.
Domination among NFC options.
| Criteria | 1b Dominates * 1c | 3b Dominates * 3bV | ||
|---|---|---|---|---|
| 1b | 1c | 3b | 3bV | |
| Cr.-1 | 0.89 | 0.9 | 0.65 | 0.76 |
| Cr.-2 | 20.34 | 21.04 | 0.11 | 0.14 |
| Cr.-3 | 177 | 178 | 2.8 | 2.98 |
| Cr.-4 | 2030 | 2380 | 963 | 1030 |
| Cr.-5 | 506 | 619 | 31.9 | 34.1 |
| Cr.-6 | 0.234 | 0.235 | 0.26 | 0.305 |
| Cr.-7 | 4.53 | 4.66 | 5.25 | 7.45 |
| Cr.-8 | 37.1 | 37.22 | 40.37 | 41.98 |
* Option i dominates option j if all indicator values on criteria for option i are more preferable then corresponding values for option j.
Table 5.
Weights options.
| Criteria | Equal Weighting | Economics Emphasizing | Resource Utilization Emphasizing | Waste Management Emphasizing | ||||
|---|---|---|---|---|---|---|---|---|
| High-Level Objectives Weights | Criteria Weights | High-Level Objectives Weights | Criteria Weights | High-Level Objectives Weights | Criteria Weights | High-Level Objectives Weights | Criteria Weights | |
| Cr.-1 | 33.3% | 100% | 10% | 100% | 80% | 100% | 10% | 100% |
| Cr.-2 | 33.3% | 20% | 10% | 20% | 10% | 20% | 80% | 20% |
| Cr.-3 | 20% | 20% | 20% | 20% | ||||
| Cr.-4 | 20% | 20% | 20% | 20% | ||||
| Cr.-5 | 20% | 20% | 20% | 20% | ||||
| Cr.-6 | 20% | 20% | 20% | 20% | ||||
| Cr.-7 | 33.3% | 50% | 80% | 50% | 10% | 50% | 10% | 50% |
| Cr.-8 | 50% | 50% | 50% | 50% | ||||
Table 6.
Comparison between 2c and 2cV options.
| Criteria | Values | Performance | |
|---|---|---|---|
| 2c | 2cV | ||
| Cr.-1 | 0.44 | 0.44 | Equal |
| Cr.-2 | 1.63 | 3.93 | 2c better than 2cV |
| Cr.-3 | 3.91 | 2.24 | 2cV better than 2c |
| Cr.-4 | 888 | 852 | 2cV better than 2c |
| Cr.-5 | 32.1 | 26.7 | 2cV better than 2c |
| Cr.-6 | 0.166 | 0.166 | Equal |
| Cr.-7 | 3.84 | 4 | 2c better than 2cV |
| Cr.-8 | 40.69 | 40.85 | 2c better than 2cV |
Table 7.
NFC options ranking results using different MCDA methods (equal weighting).
| Rank | NFC Options | ||||
|---|---|---|---|---|---|
| MAVT | SSM | AHP | TOPSIS | PROMETHEE | |
| 1 | 3cV2 | 3cV2 | 3cV1 | 3cV2 | 3cV2 |
| 2 | 3cV1 | 3cV1 | 3cV2 | 3cV1 | 3cV1 |
| 3 | 2c | 2cV | 2c | 2cV | 2c |
| 4 | 2cV | 2c | 2cV | 2c | 2cV |
| 5 | 3a | 3b | 3b | 3a | 3a |
| 6 | 3b | 3a | 3a | 3b | 3b |
| 7 | 3bV | 3bV | 3bV | 3bV | 3bV |
| 8 | 2a | 2a | 2a | 2b | 2a |
| 9 | 2b | 2b | 2b | 2a | 2b |
| 10 | 1b | 1b | 1b | 1b | 1b |
| 11 | 1c | 1c | 1c | 1c | 1c |
| 12 | 1a | 1a | 1a | 1a | 1a |
Table 8.
Relative characteristics of waste generated in NFC (taken from [21]).
Table 8.
Relative characteristics of waste generated in NFC (taken from [21]).
| Generating Process | Relative Volume | Relative Radioactivity | Relative Radiotoxicity |
|---|---|---|---|
| Mining & milling | very large | low | low |
| Refining | small | low | low |
| Conversion and enrichment | small | low | low |
| Fresh fuel fabrication | small | low | low |
| Recycled fuel fabrication | small | low/medium | medium |
| NPP operation | large | medium | low |
| SNF management | small/medium | high/very high | high |
| - reprocessing | |||
| SNF management | medium | high | high |
| - direct disposal | |||
| Decommissioning | very large | low | very low |
Table 9.
Summary: challenges and opportunities of NFC implementation.
| Options | Challenges and Opportunities |
|---|---|
| Most Preferable NFC Options | |
| 3cV1 and 3cV2 | These options provide in general fairly good overall performance and become the most preferable when the resource utilization and waste management criteria are of the highest priority (3cV1 is a little bit better than 3cV2 on the resource utilization criterion (but slightly more costly), while 3cV2 is a little bit better than 3cV1 on the waste management criteria). |
| 2c and 2cV | These options provide similar overall performance and take the highest ranking if a cost-effective reduction of resource consumption and burden decrease of nuclear waste are desired. |
| 1a | This option performs the best when the requirement to provide good economics is of the highest priority. This option stays the best in ranking even when the importance of the resource utilization and waste management criteria (corresponding weighting factors) is changed up to 20%. |
| Potentially Preferable NFC Options | |
| 3a and 3b | These options may be considered as appropriate choice in view of waste management and resource utilization perspectives instead of 2c, 2cV, 3cV1 and 3cV2 when the latter options cannot be selected because there are some reasons not to deploy them. Options 3a and 3b have similar waste management but the worst resource utilization performance score in comparison with 2c, 2cV, 3cV1 and 3cV2; 3a is a little bit better than 3b on the resource utilization criterion and slightly cheaper, while 3b is a little bit better than 3a on the waste management criteria. In addition, 3b dominates over 3bV, which excludes 3bV from consideration when options 3a and 3b are available. |
| 3a and 3b may be competing with 2c, 2cV, 3cV1 and 3cV2 if 3a and 3b economics performance will be improved up to the level of “current industrial practice and extensions”-options and there are no requirements to provide a good resource utilization performance. | |
| LWR-Based NFC Options | |
| 1b, 2a and 2b | The comparison among 1b, 2a and 2b performances is worthwhile if options deploying FR are not considered at all: 1b can be preferable in the case of emphasizing economics (1b dominates over 1c, which excludes 1c from consideration if 1b option is available), 2b can be preferable in case of waste management emphasizing, 2a will be preferable in case of resource utilization emphasizing, respectively. Of note, the overall sustainability performance of these options is significantly worse than that of NFC options with FR and ADS. |
© 2017 by the authors. Licensee MDPI, Basel, Switzerland. This article is an open access article distributed under the terms and conditions of the Creative Commons Attribution (CC BY) license (http://creativecommons.org/licenses/by/4.0/).
Share and Cite
MDPI and ACS Style
Schwenk-Ferrero, A.; Andrianov, A. Comparison and Screening of Nuclear Fuel Cycle Options in View of Sustainable Performance and Waste Management. Sustainability 2017, 9, 1623. https://doi.org/10.3390/su9091623
AMA Style
Schwenk-Ferrero A, Andrianov A. Comparison and Screening of Nuclear Fuel Cycle Options in View of Sustainable Performance and Waste Management. Sustainability. 2017; 9(9):1623. https://doi.org/10.3390/su9091623
Chicago/Turabian StyleSchwenk-Ferrero, Aleksandra, and Andrei Andrianov. 2017. "Comparison and Screening of Nuclear Fuel Cycle Options in View of Sustainable Performance and Waste Management" Sustainability 9, no. 9: 1623. https://doi.org/10.3390/su9091623
Note that from the first issue of 2016, this journal uses article numbers instead of page numbers. See further details here.