Article

Overview of Wind Power in China: Status and Future

1
Institute of Mineral Resources, Chinese Academy Geological Sciences, Beijing 100037, China
2
Research Center for Strategy of Global Mineral Resources, Chinese Academy Geological Sciences, Beijing 100037, China
3
College of Management Science, Chengdu University of Technology, Chengdu 610051, China
*
Author to whom correspondence should be addressed.
Sustainability 2017, 9(8), 1454; https://doi.org/10.3390/su9081454
Submission received: 7 July 2017 / Revised: 14 August 2017 / Accepted: 15 August 2017 / Published: 17 August 2017
(This article belongs to the Section Energy Sustainability)

Abstract

:
Due to the rapid economic development in China, the conflict between the increasing traditional energy consumption and the severe environmental threats is more and more serious. To ease the situation, greater use of wind energy in China could be the solution for energy conservation and sustainable environment in the long run. This paper describes the presentation of wind power in China, which covers distribution, bases, installed capacity, power generation from the spatial perspective and the environmental benefit. In addition, grey model (GM(1,1) ) and scenario analysis are employed to forecast the installed capacity in China from 2017 to 2025, then the evaluation of two methods is presented. By this research, the results are shown as the following: (1) the North region has great wind energy with 2500–3000 giga watt (GW) and the offshore wind energy in the Southeast is abundant; (2) the Inner Mongolia base located in North China makes a great contribution to wind power as well as having great potential for wind power development with the potential of 1300 GW; (3) the growth rate of installed capacity and wind power generation in China is declining with 100% in 2006 to 30% in 2015, 107% in 2009 to 17% in 2015, respectively; (4) the “three North” region has made a great contribution to current installed capacity and wind power generation with 74% and 71%, respectively; (5) wind power has significant environmental benefits with coal reduction of 23,887 × 104 tce, CO2 reduction of 66,854 × 104 tons and SO2 reduction of 173 × 104 tons in total from 2008 to 2015; (6) the installed capacity in China from 2017 to 2025 is predicted utilizing a GM(1,1) model with 38,311.1810 × 103 GW in 2025, while, with a scenario analysis, the installed capacity will reach up to 40,000 × 103 GW in 2025 under the high GDP growth rate and 29,000 × 103 GW in 2025 under the low GDP growth rate, respectively. Finally, it can be concluded that China has a solid foundation for the wind power development due to its abundant wind resources and great potential for wind power. Furthermore, the sustainable development can be guaranteed, and reduction in energy usage as well as emissions can be achieved by promoting wind power widely and effectively.

1. Introduction

According to the “5th Assessment Report of the Intergovernmental Panel on Climate Change (IPCC)”, the atmospheric concentration of CO2 increased 40% from the concentration before industrialization, which reached 391 mg/L by 2011 [1]. In addition, China created 12.3% of the world’s total GDP, consumed approximately 22.4% of the world’s primary energy and contributed 27.1% of the world’s carbon emissions in 2013 [2,3]. Under this situation, China has become the largest emitter and energy consumer all over the world, which forces China to face more and more pressure to control its CO2 emissions and adjust its energy structure [3,4,5,6,7,8]. Therefore, China is making great efforts to achieve sustainable development. For example, China and the United States unveiled a negotiated deal to reduce their greenhouse gas emissions in 2014. In the meantime, China promised a peak in CO2 emissions by around 2030, intending to increase its share of non-fossil fuels in primary energy consumption to around 20% [9,10].
With regard to the environmental problems and fossil-based material’s depletion, alternative non-fossil energies are in urgent need of sustainable development [11,12,13,14,15]. Nuclear energy, wind energy, solar energy, hydro-energy, bio-energy, hydrogen energy are considered promising energies in the future that contribute greatly to realizing sustainable development on energy and environment [16]. Among these renewable energies, wind energy used for power generation is popular in China because of its mature technology, low cost and environmentally friendly characteristic [17].
It is advantageous for China to develop wind energy for many reasons [8]. Firstly, due to the abundant onshore and offshore wind energy resources in China, there is a solid foundation for the wind power development. The total wind power energy technically exploitable (with the wind power density over 150 W/m2) is estimated to be 1400 GW onshore (at 50 m height) and 600 GW offshore by the United Nations Environment Programme (UNEP) [18]. Now, China has ranked first in cumulative installed capacity with the total capacity of 75.32 GW, taking up 27% of the global sum [19]. Secondly, China is able to develop wind energy on a large-scale. The Chinese wind power industry has experienced a period of rapid development for the past 10 years [20] and makes China the major wind energy market in the world now and tomorrow. Wind power has played an important role in power sources with 2.6%, which is only less than the share of thermal and hydro powers until 2012 [17,21]. Finally, deployment of wind energy can bring great benefits for environmental protection and energy conservation [8]. The Chinese government has identified wind energy as a promising and sustainable energy to alter the traditional fuel. There is research that points out the GHG emissions per KWh caused by wind power are as low as 8–20 g, which is just 2.2% of the emissions generated by coal [22,23,24].
Since wind power generation is a sustainable and clean source of energy with environmentally friendly production using green and renewable power [25,26,27,28,29,30,31,32,33,34], it is essential and necessary to promote the development of wind energy in China to solve the conflict between the energy depletion and environmental pollution. Furthermore, it requires comprehensive insight into the status and the future of wind energy in order to realize the sustainable development of energy, environment and economy in China as well as provide a reference for Chinese policy makers. In addition, there are many methods to predict wind power from different perspectives [35,36,37,38], such as SWOT analysis (including the analysis of strength, weakness, opportunity and threaten) [39] and logistic model [40]. In addition, the advanced hybrid evolutionary of computational intelligence is also applied for wind power prediction [41]. In this paper, the present situation in China of wind energy distribution, wind power generation and the environmental benefits are studied from the spatial perspective. Furthermore, the installed capacity in the future are predicted by the GM(1,1) model and scenario analysis. In addition, the related problems and recommendations on wind energy are proposed for sustainable development.
The rest of this paper is structured as follows: the status of wind power development in China is presented in Section 2; Section 3 focuses on the installed capacity in the future using the GM(1,1) model and scenario analysis; the conclusions and suggestions are shown in Section 4.

2. Overview of the Wind Power Status in China

2.1. China’s Available Wind Energy Distribution

China has great onshore and offshore wind resources due to its vast land and long coastline. From the late 1980s, the national wind energy resource assessments have been carried out four times by China Meteorological Administration (CMA) and offer a reliable reference for the wind power development [17].
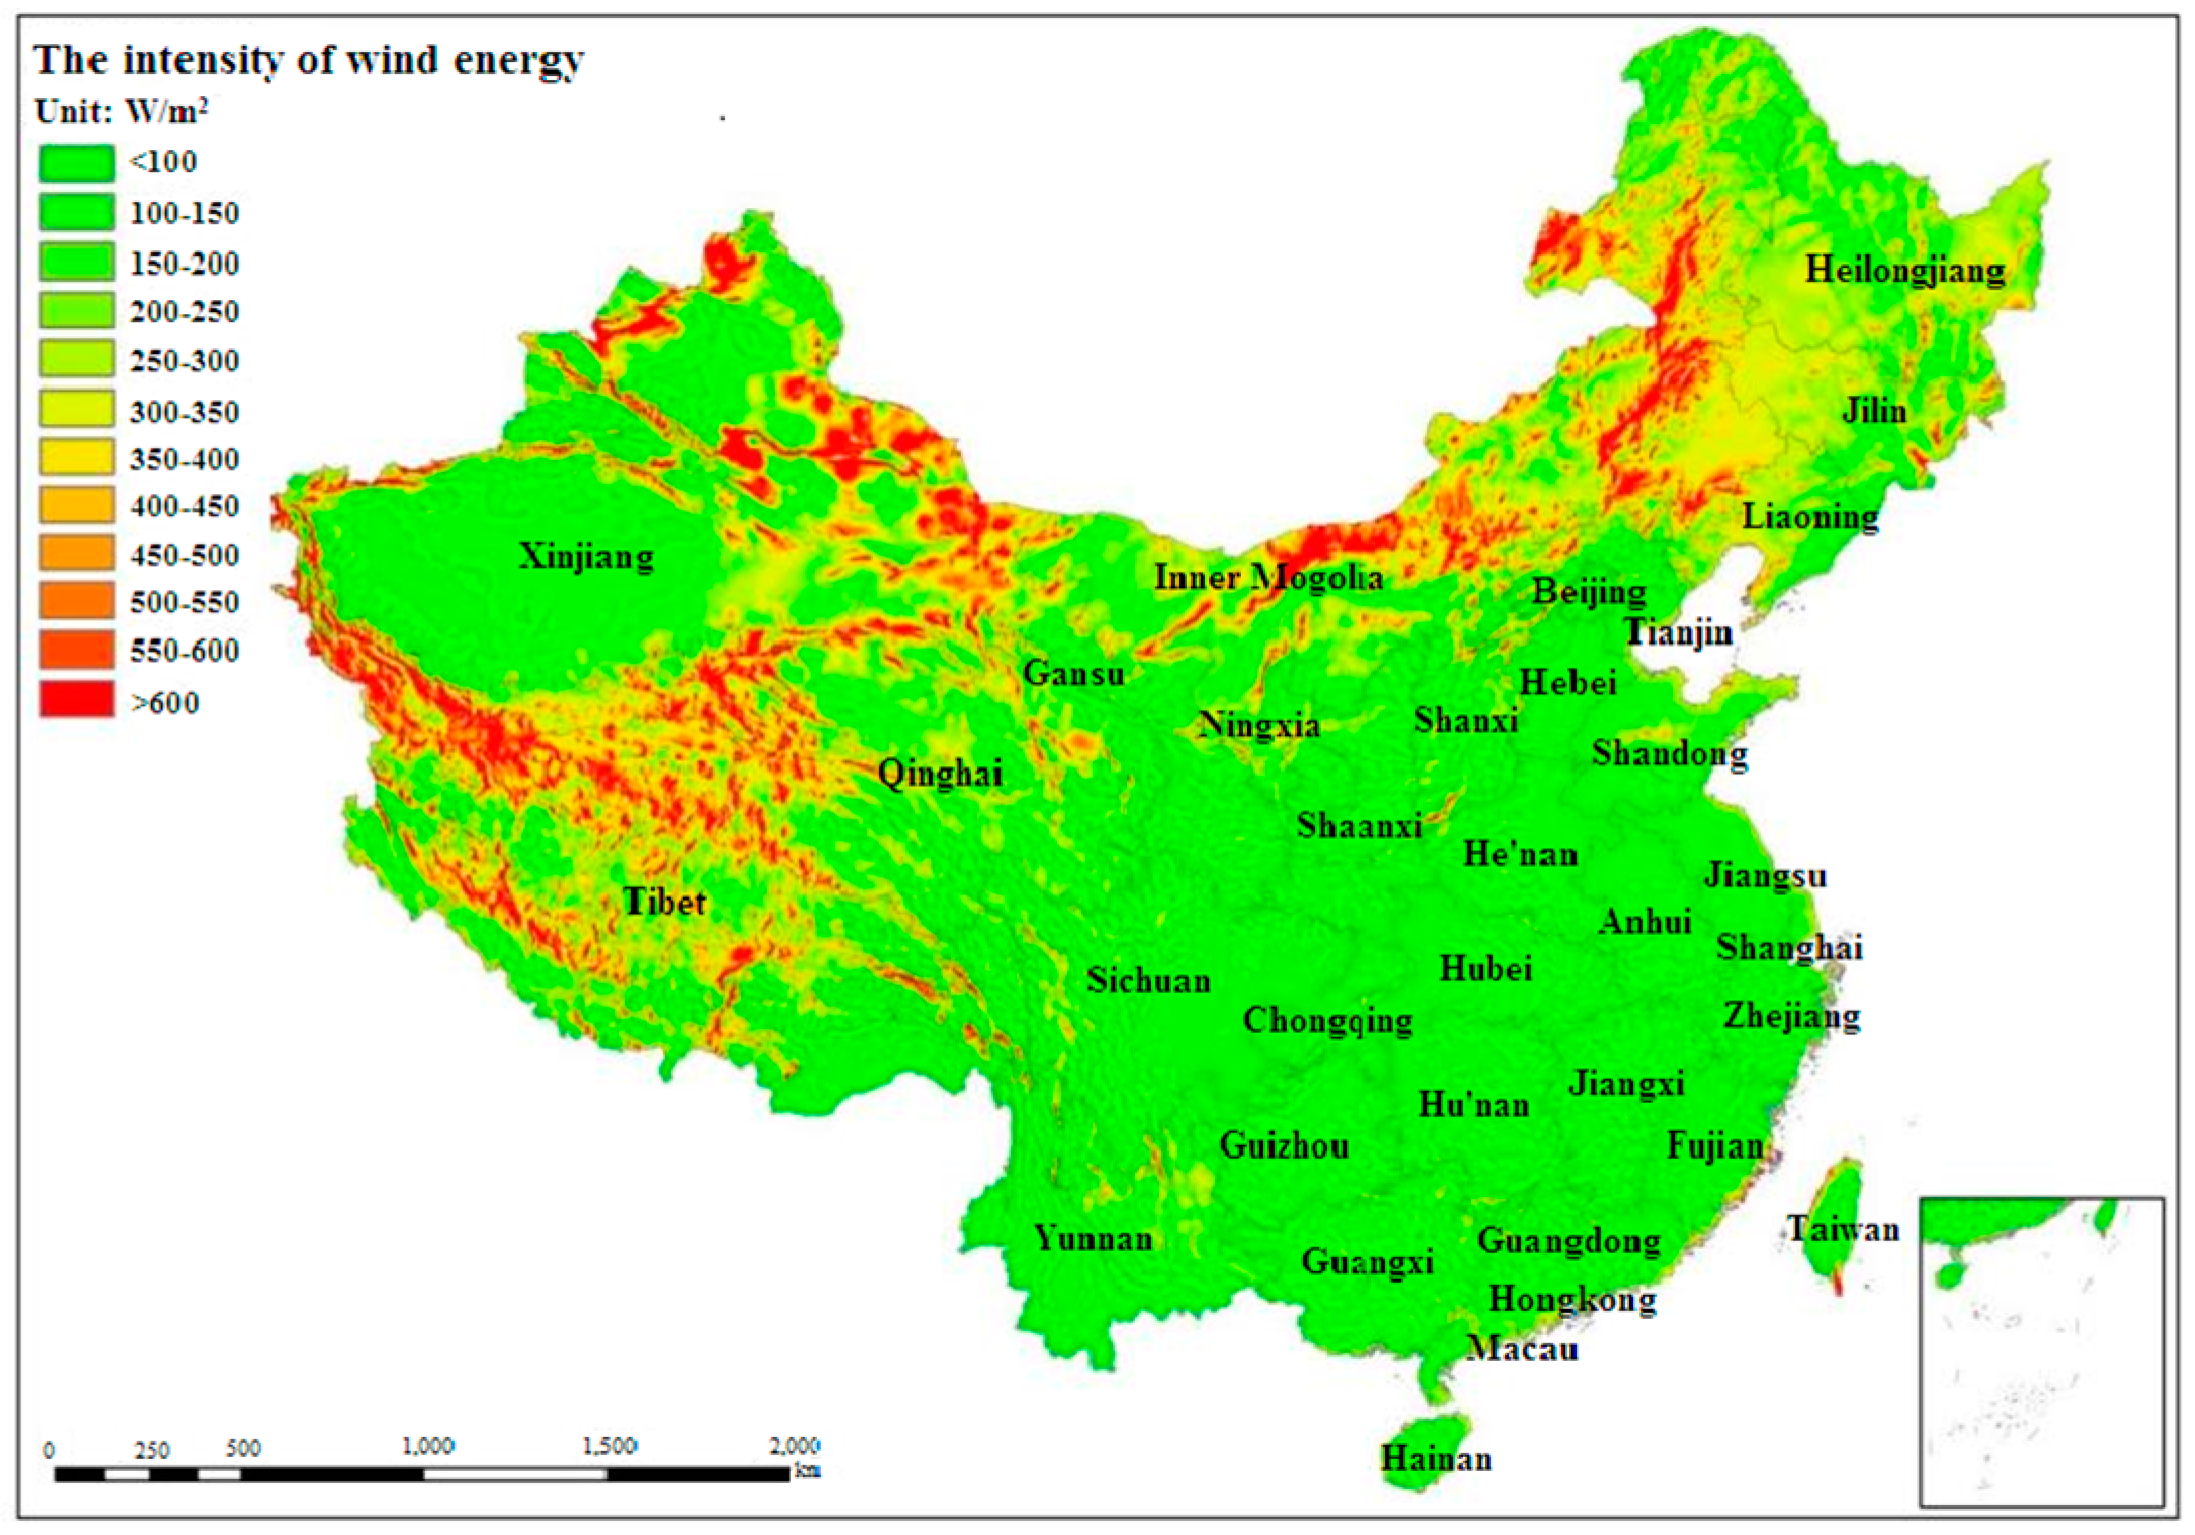
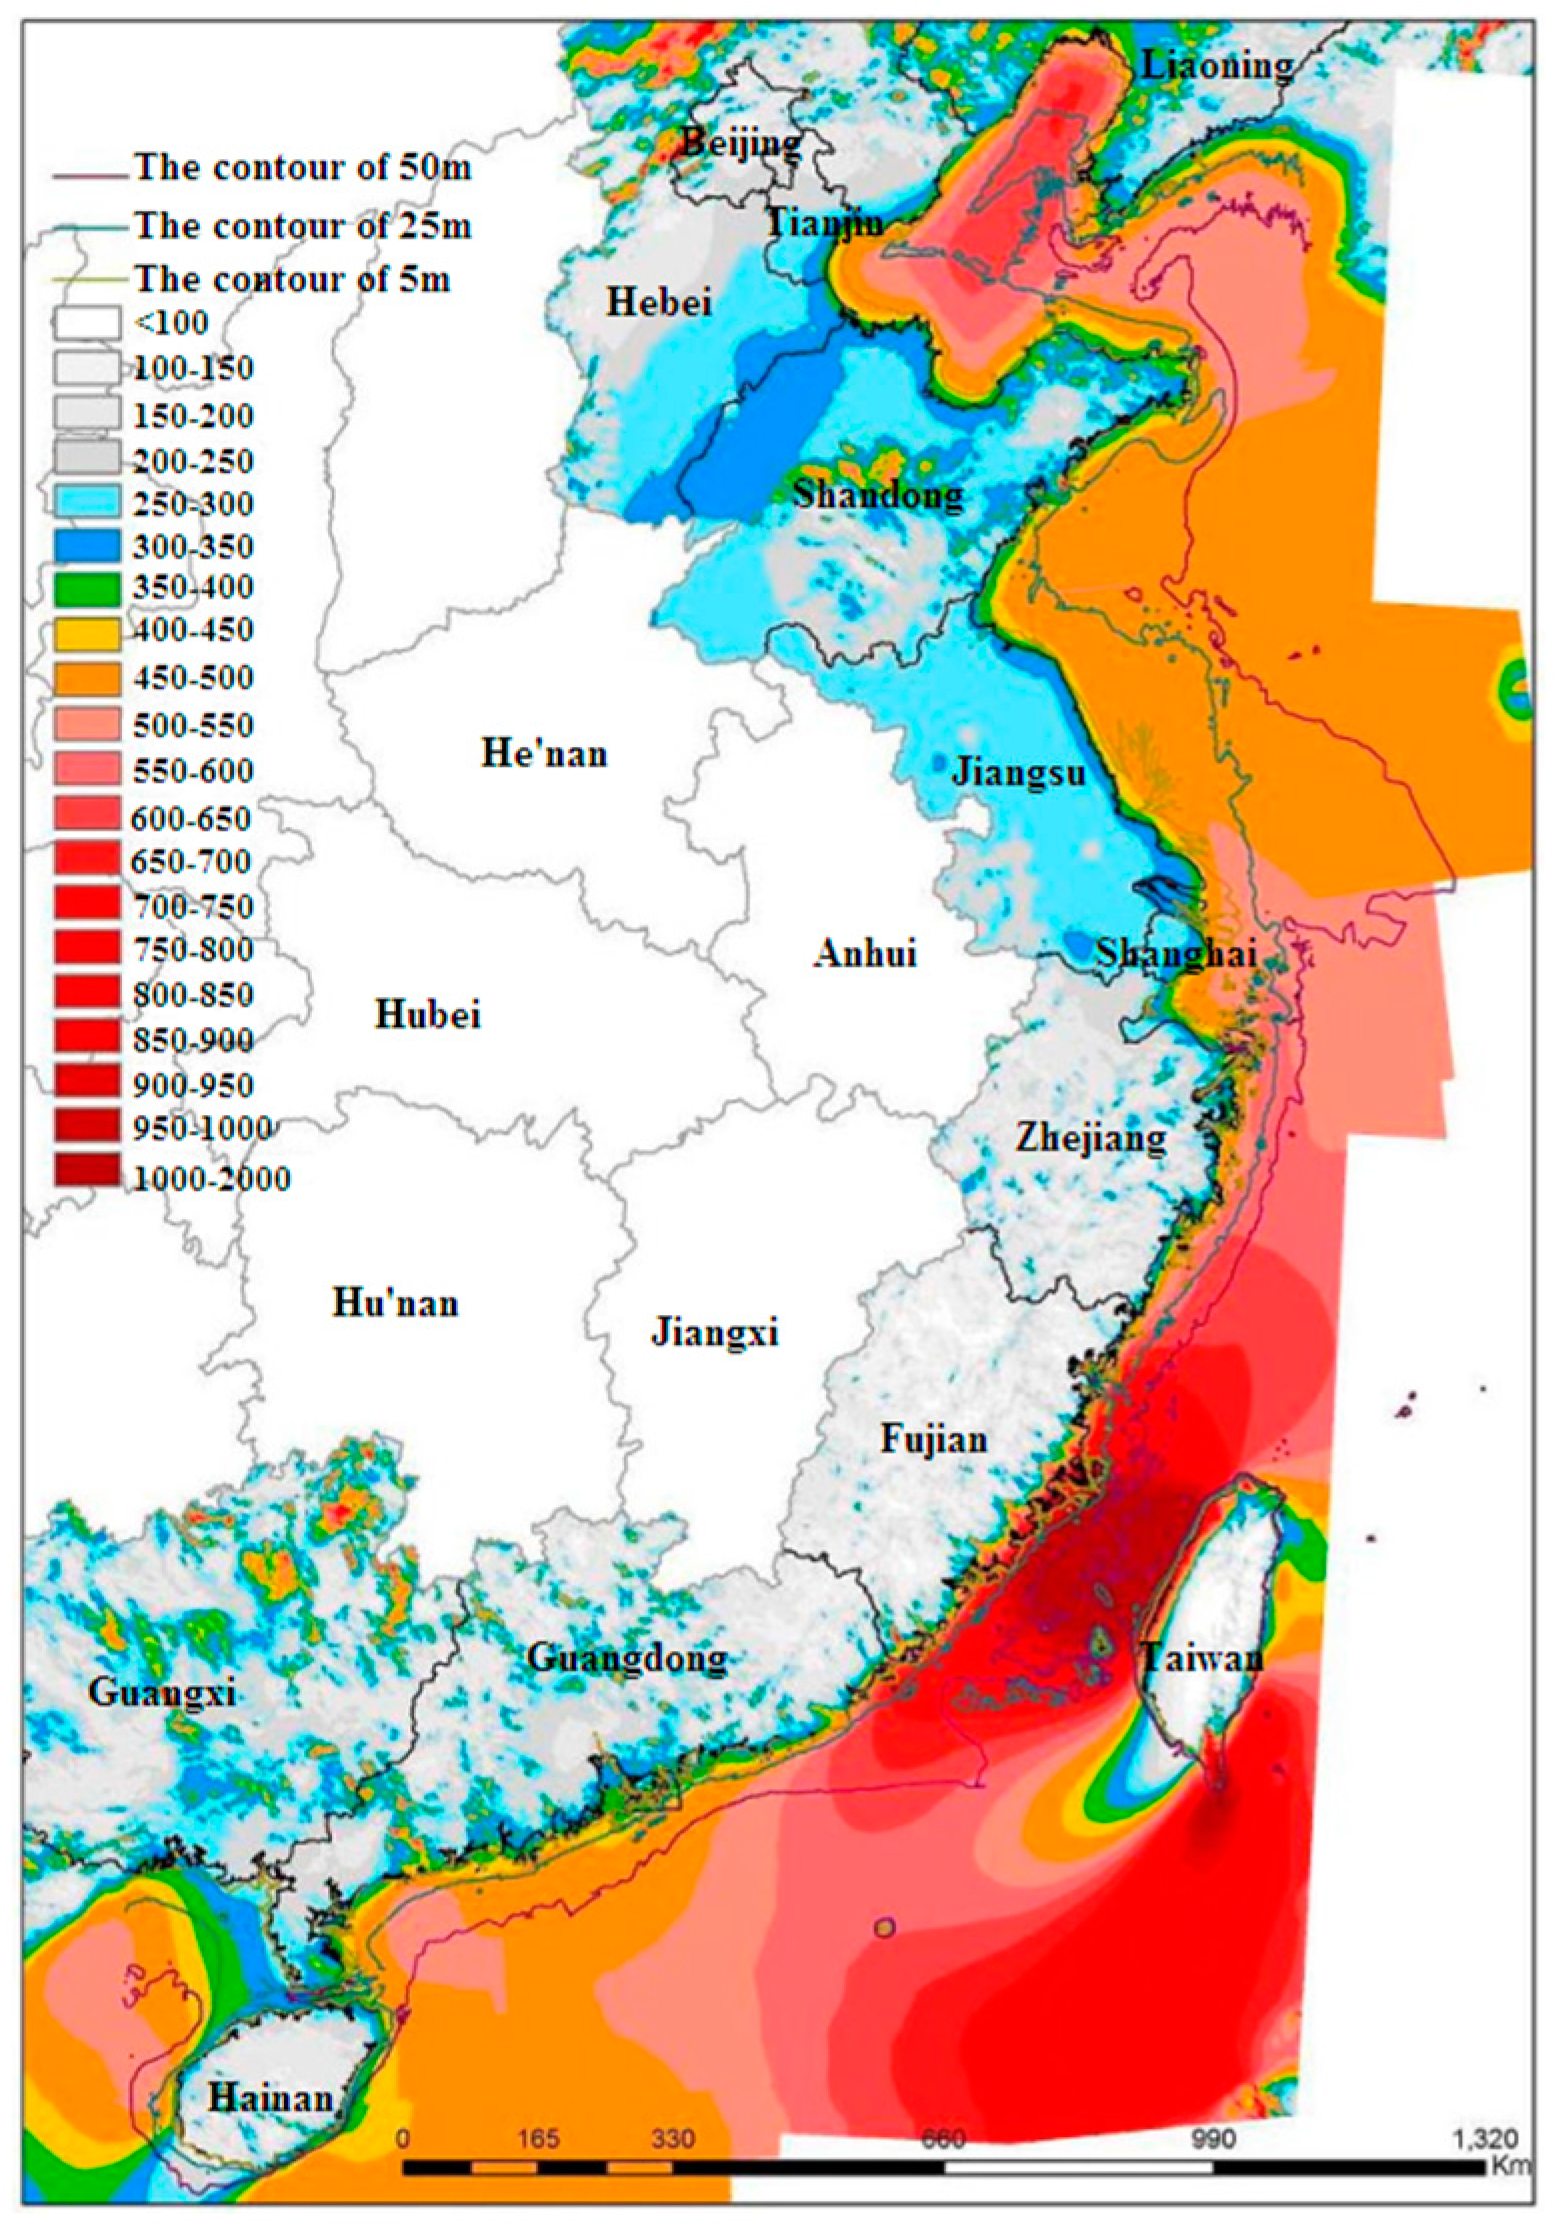
According to the results compiled by the 4th “National Wind Energy Detailed Survey and Evaluation” program, the amount and distribution of onshore and offshore wind energy in China are presented as Table 1 and Figure 1 and Figure 2 following:
Given the intensity of onshore wind energy ≥ 300 W/m2, the technological exploitation of onshore wind energy in China will reach up to 2000–3400 GW in the future as shown in Table 1. It is apparent to observe that the onshore wind energy exploitation potential in China is great.
As can be seen in Figure 1, the north region in China has abundant offshore wind energy including Qinghai, Xinjiang, Inner Mongolia and the northeast area. From Figure 2, it is obvious to find that the Taiwan Strait has great onshore wind energy where wind energy intensity is above 600 W/m2, followed by Guangdong, Guangxi, Hainan and Fujian due to frequent typhoon and tropical depression activity in summer.

2.2. The Wind Power Bases in China

In 2008, Chinese government launched and planned the construction of 1 GW-scale wind power bases that include six onshore bases located in “Three North” region (including Northeast, Northwest and North China as mentioned in Table 2) and one offshore base located in Jiangsu coast. To gain more detailed information of these bases, a wind energy resources assessment system (WERAS/CMA) is developed by the CMA’s Center that adopts the advanced geographical information system (GIS) analysis technology and is suitable for China’s climatic and geographical characteristics [43]. Thus, the information of technological exploitation and installed capacity in horizontal resolution of 1 km by 1 km and the height of 50 m for wind energy are obtained as shown in Table 3. It can be seen that the total potential exploitation of these wind power bases can reach up to 2968.20 GW and the installed capacity could realize 609.99 GW. In addition, Inner Mongolia continues to rank first in the development of wind power in China with a technically exploitable capacity of 381.70 GW, followed by Gansu and Xinjiang with 82.20 GW and 64.80 GW, respectively. As for the wind power potential exploitation, Inner Mongolia makes a great contribution with 1305.30 GW, followed by Jilin and Xinjiang with 1115.40 GW and 249.10 GW, respectively. Thus, it is clear to find that the Inner Mongolia, Xinjiang and Gansu are the primary provinces for the wind power development in the future. Furthermore, the wind power technology in these bases should be improved greatly. In addition, apart from these wind power bases, the Chinese government has taken active action to construct more bases in other provinces such as Shandong.

2.3. The Wind Power Status in China

Since the abundant onshore and offshore wind energy in China, the Chinese wind power has gained remarkable fruits with the rapid growth. In order to facilitate report and discussion, the 31 provinces, cities and autonomous regions (excluding Hong Kong, Macao and Taiwan) in China are grouped into seven regions according to the geographical classification as shown in Table 2.

2.3.1. Installed Capacity

As can be seen in Figure 3, the installed capacity in China has experienced a fast increment from 2006 to 2009 with the growth rate of over 100%, while, from 2010 to 2015, its rate slowed down and remained a constant with approximately 30%. Thus, the year of 2011 is a turn from booming to steady growth of wind power installed capacity. In addition, the Northwest region has the greatest growth rate with 16% to 30%, followed by the North China and the Northeast region with 35% to 26% and 32% to 12%, respectively. The relatively lower growth rate is in the Southwest region and Central China with 0.9% to 6.5% and 0.8% to 3.5%, respectively.
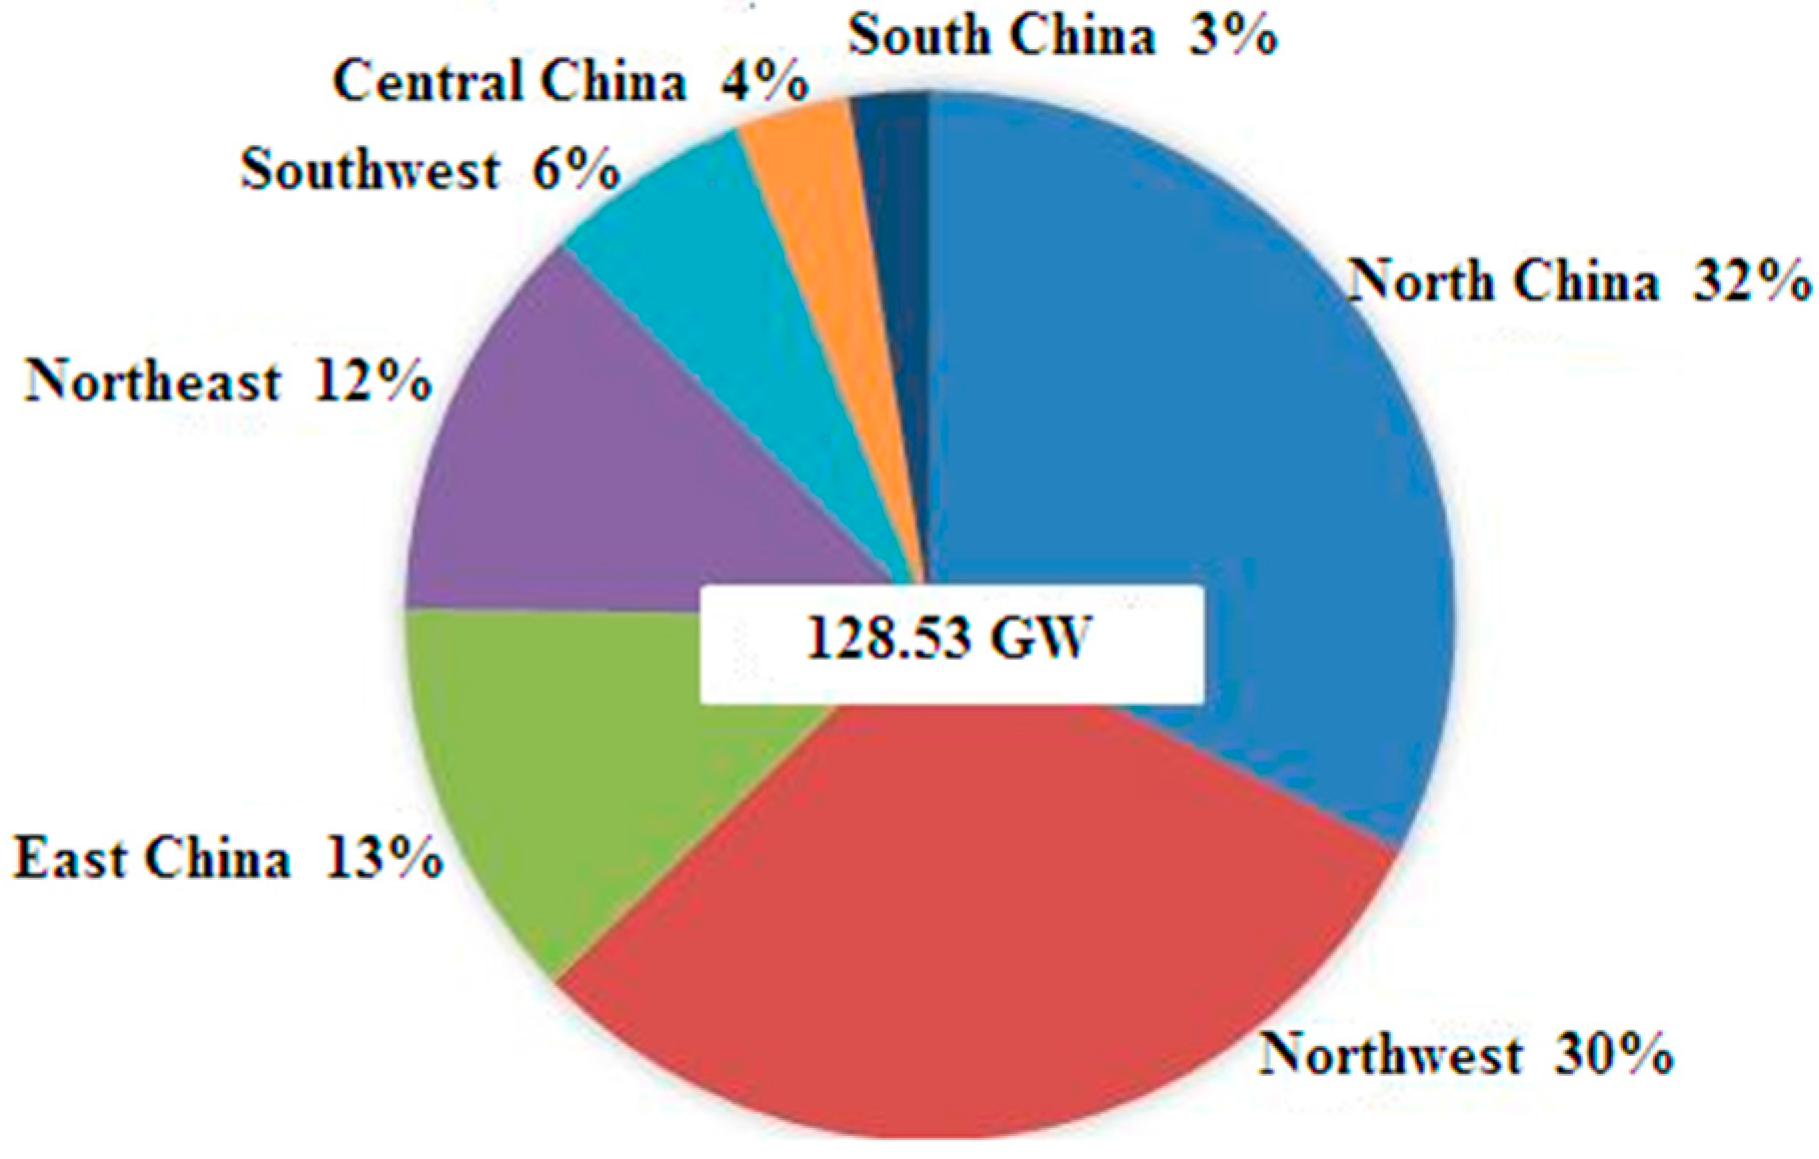
For the cumulative installed capacity as shown in Figure 4, the share of North China to the national level ranks first with 32%, followed by the Northwest region with 16.06 GW accounting for 30% and the East China taking up 13%. The little contribution is made by Southwest region, Central China and South China with 6%, 4% and 3%, respectively. Furthermore, the total cumulative installed capacity in China has reached 128.53 GW, which indicates that the wind power potential in China is great.

2.3.2. Wind Power Generation

With the enlarging scale of installed capacity, the wind power generation is on rise from year to year. In 2009, the total wind power generation achieves 274,000 GW, while it is 1,863,000 GW in 2015, which is six times than that of 2009 as shown in Figure 5. Although the total amount of wind power generation is soaring, the growth rate is declining, which is from 107% in 2009 to 17% in 2015 due to the unbalance between the growth of wind energy and grid construction.
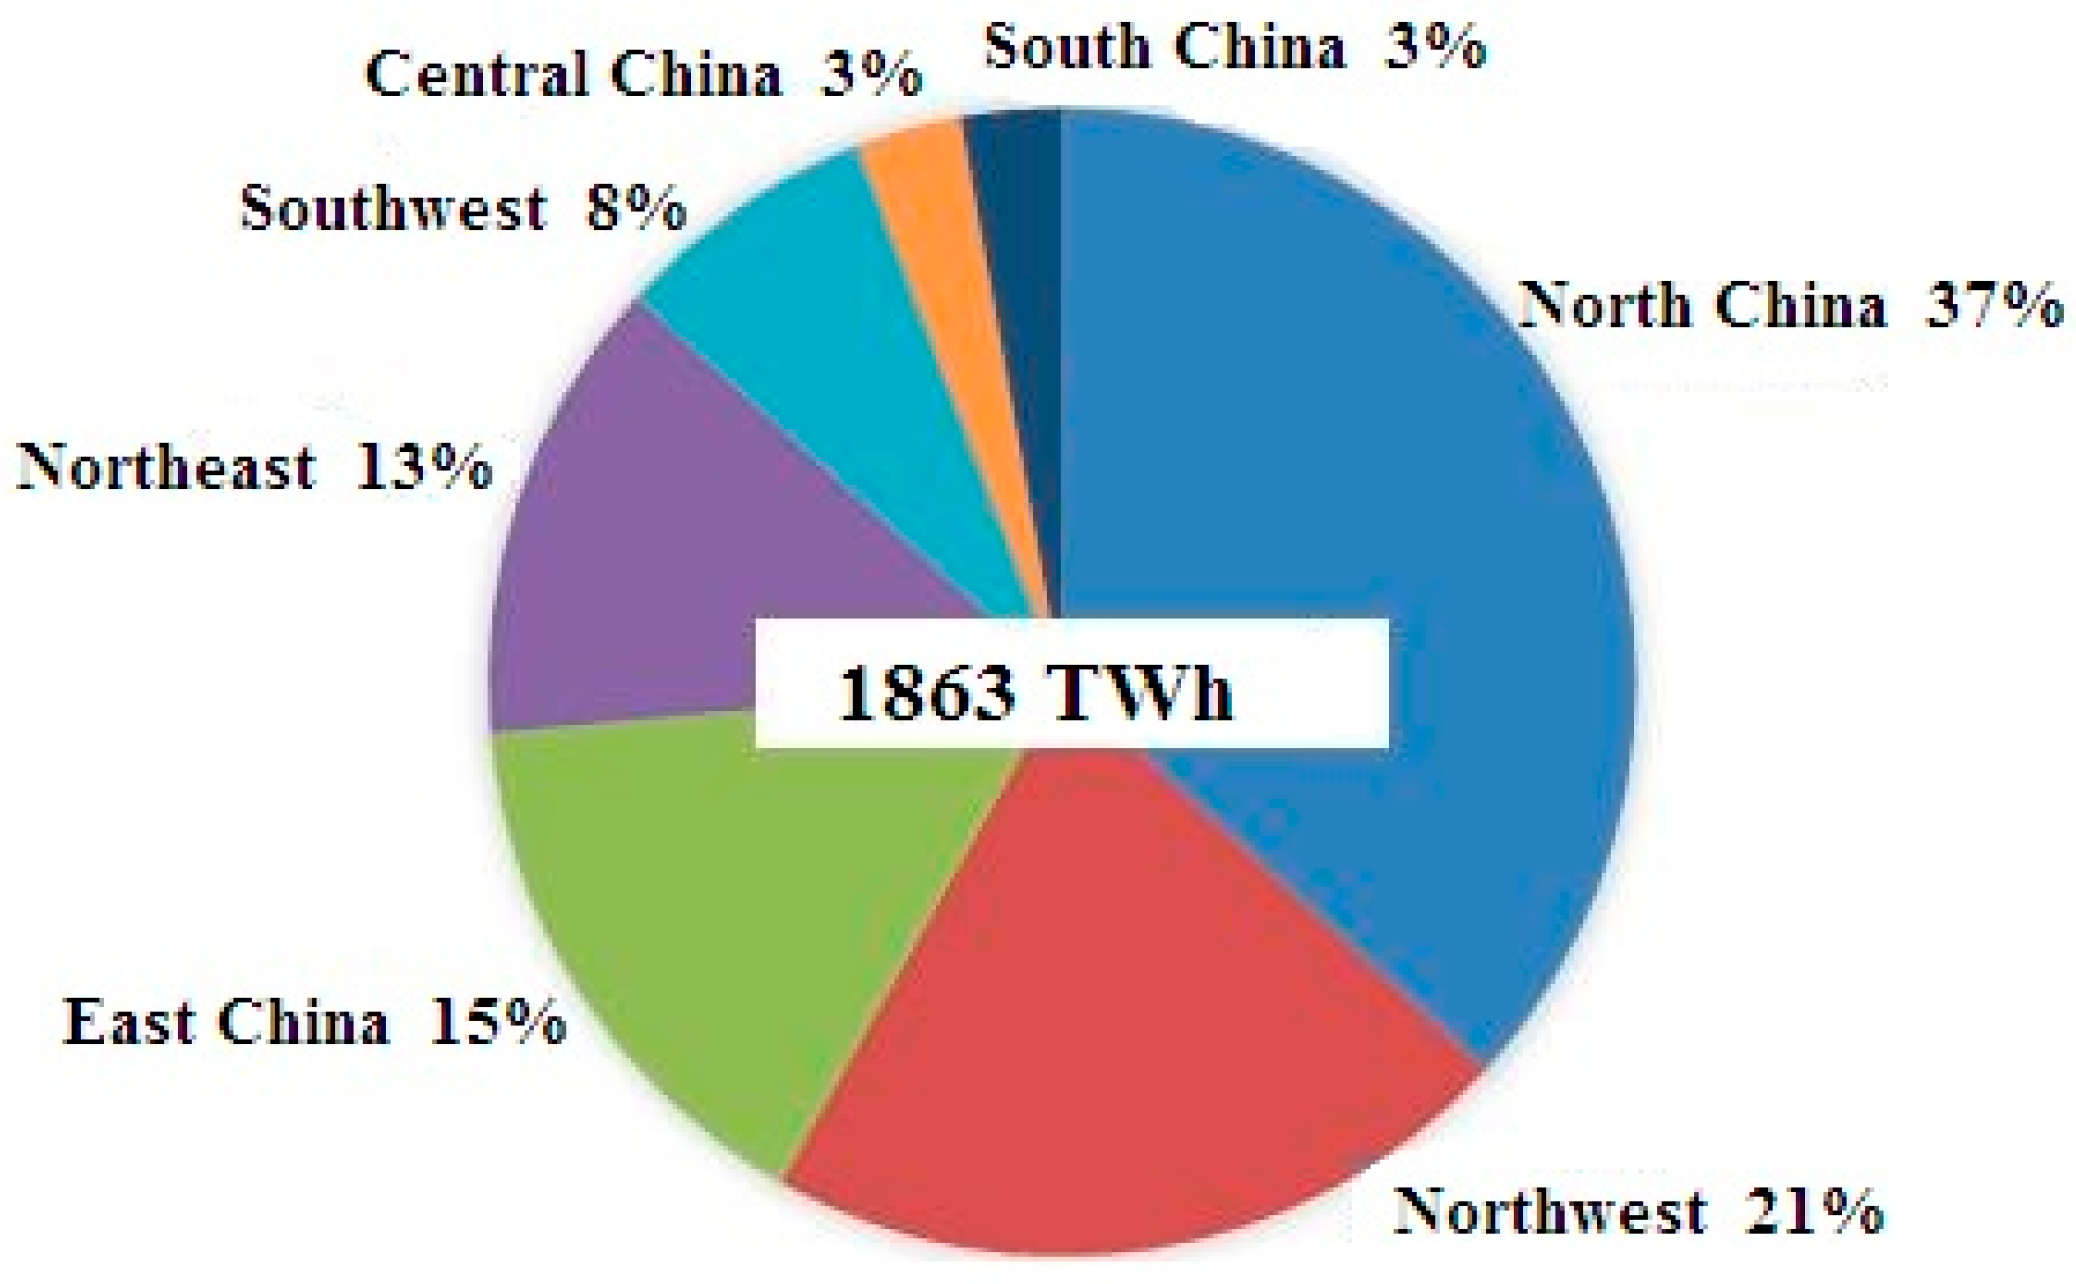
From the spatial perspective as presented in Figure 6, the “Three North” region makes a significant contribution to wind power generation in China with the share of 13% (Northeast), 21% (Northwest) and 37% (North China), respectively.

2.3.3. The Environmental Impact of Wind Power

Greenhouse gases and other associated harmful gaseous emissions, which are byproducts of fossil fuel use, leading to environmental damage, poor health, and early death [46]. Different from the fossil fuel used for power generation, the wind power has significant potential for emissions reduction and energy conservation as presented in Table 4. Obviously, the wind power generation grows at an accelerating rate that reaches up to 7512 TWh in total from 2008 to 2015 and reduces the coal consumption of 23,887 × 104 tce in the same time. In addition, the wind power deployment could not only ease energy shortage but can also make a contribution to the environmental sustainability due to the reduction of CO2, SO2, ox nitride and smoke with 66,854 × 104 tons, 173 × 104 tons, 180 × 104 tons and 30 × 104 tons in total respectively. It could be easily concluded that the wind power employment has a significant influence on making energy saving and emissions reducing.

3. Forecasting the Wind Power in China

In this paper, the GM(1,1) and the scenario analysis method are employed to forecast the wind power in China from 2017 to 2025, and the evaluation of the two approaches is presented at the same time.

3.1. GM(1,1) Model

Firstly, it is essential to test the validity of grey model according to the whitening differential equation [46]. By the calculation on primary data, it is obvious to find that the absolute value of the development coefficient for grey model is greater than 2 and its negative value is less than 0.3; thus, the grey model is suitable for the long-term prediction [48]. In addition, there is a hypothesis that the condition of economy and the government policy in China in the future is stable enough to make certain the accuracy of the prediction with GM(1,1).
Through the initial data processing such as extracting, taking logarithms or smoothing, a non-negative sequence X(0) is gained. Then, its Accumulating Generation Operational Sequence and GM(1,1) model is obtained [49,50,51]. Finally, installed capacity in China from 2017 to 2025 is predicted by its time response sequence.
In this paper, the data of installed capacity during 2006 to 2016 is employed as primary information for the prediction. Then, all of the prediction results are shown in Table 5. Meanwhile, the residual analysis is adopted in order to test the model, and it concludes that the results predicted are reliable.

3.2. Scenario Analysis

Here, the installed capacity is predicted with three scenarios as shown in Table 6. The GDP growth rate is considered as an indicator for the installed capacity prediction in China from 2017 to 2025, and the installed capacity is predicted as shown in Table 7.

3.3. Data

The data of installed capacity in China from 2006 to 2016 is collected from National Energy Administration [43].

3.4. Results and Discussion

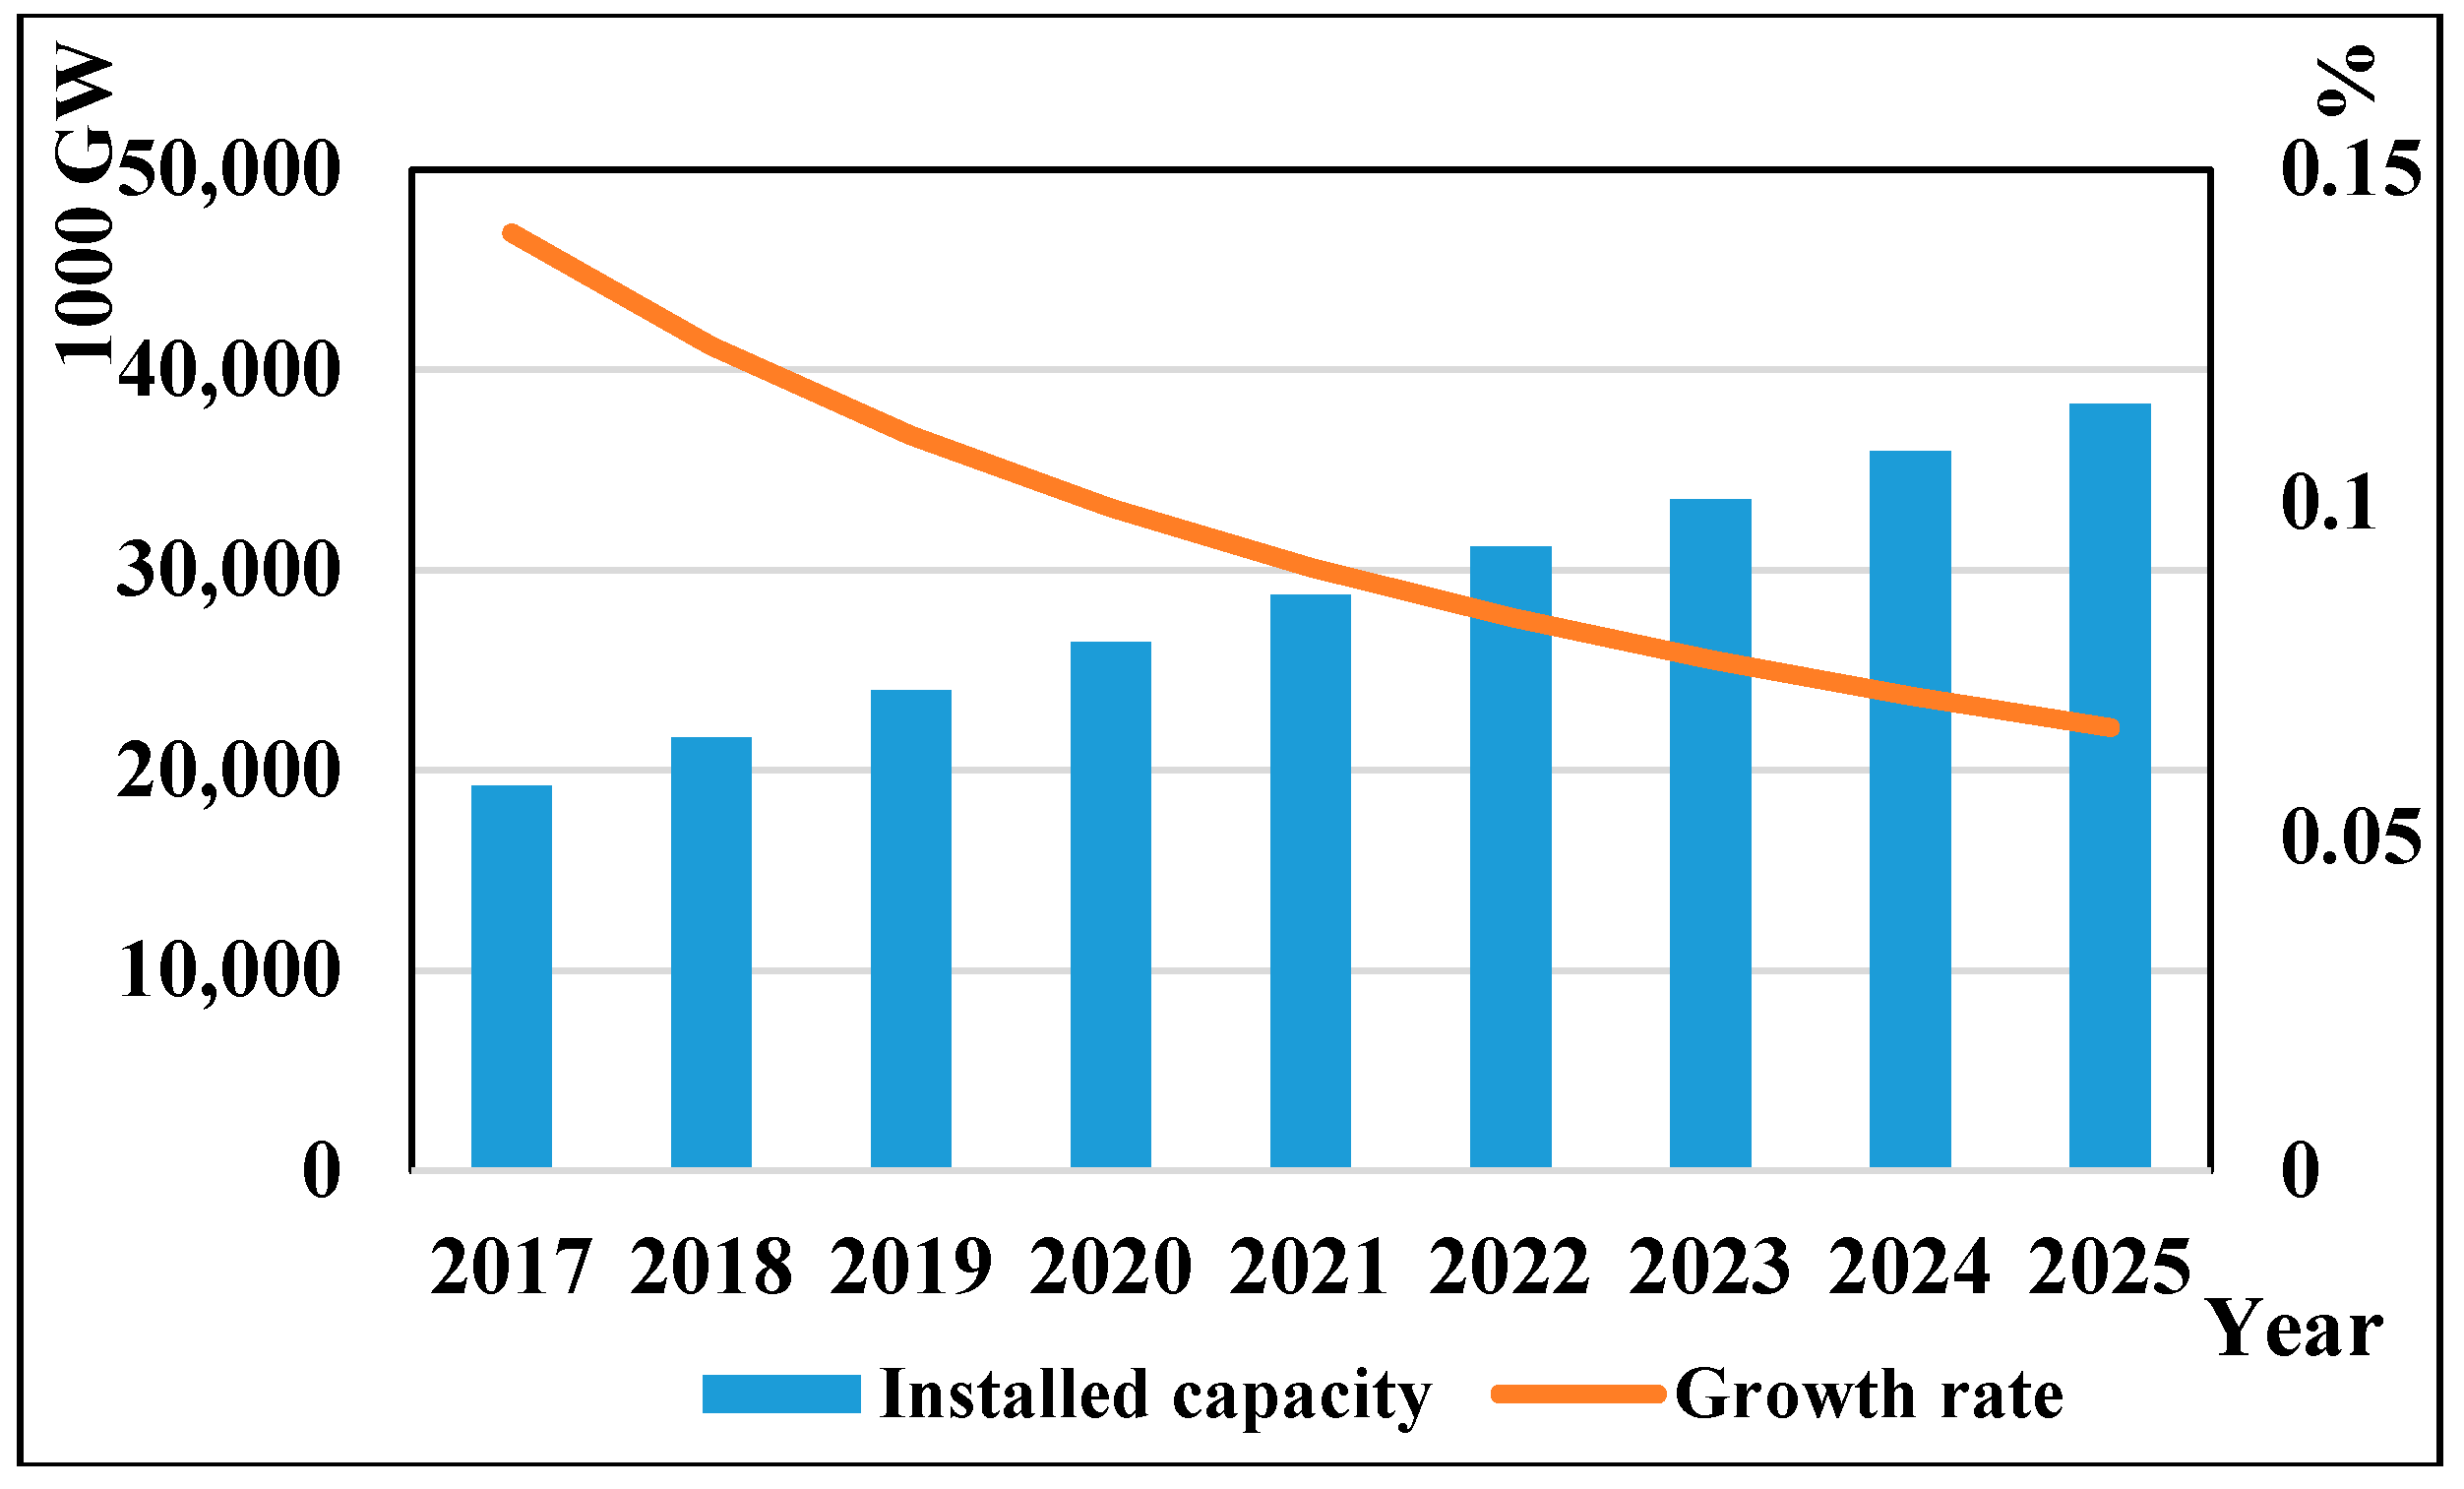
With the GM(1,1), the prediction of installed capacity is presented in Table 5 and Figure 7. It is obvious to find that the installed capacity in China is increasing from year to year with an average annual growth rate of 9.56% from 2017 to 2025. Furthermore, there has a stable slowdown in the growth rate while the value of installed capacity is increasing. In addition, the installed capacity is stable in an approximate liner tendency as shown in Figure 7. It could apparently be concluded that the installed capacity in China is projected to reach 38,311.1810 × 103 GW after about 10 years, which is roughly 2.27 times than that in 2016. The potential of the wind power development in China is great and the government should pay more attention to it.
With the scenario analysis, it is clear to find that the installed capacity in the future is related to the GDP growth rate closely. When the GDP growth rate is high, the installed capacity in China will reach 40,000 × 103 GW in 2025, while it will be 29,000 × 103 GW under the low GDP growth rate. In addition, it can be concluded that the installed capacity in China from 2017 to 2025 is increasing under all scenarios. Thus, paying more attention to wind power is a prior and essential task for policy makers and academic researchers.
Comparing the two approaches, it is apparent to observe that the predicted results with GM(1,1) are consistent with the results with high scenario analysis approximately due to the data limitation. Because it takes quantitative analysis, qualitative analysis, subjective factors and various possible situations together into account for prediction, the scenario analysis method has a better predictive effect than other prediction methods such as trend extrapolation method and GM(1,1).

4. Conclusions

This paper offers a detailed and comprehensive description for the current status and the development of the wind power in China.
Firstly, now the wind energy in China is majorly distributed in the North region with 2500–3000 GW and the offshore wind energy in Southeast is abundant, which should be exploited effectively in the future. The seven wind power bases are introduced and the Inner Mongolia base located in North China not only makes a great contribution to wind power but also has great wind power potential with 1300 GW installed capacity. In addition, the growth rate of installed capacity and wind power generation in China is declining with 100% in 2006 to 30% in 2015, 107% in 2009 to 17% in 2015, while the absolute value of installed capacity and wind power generation is soaring. Furthermore, the “three North” region makes a great contribution to current installed capacity and wind power generation with 74% and 71%, respectively. It can be seen that China has a solid foundation for the development of wind power. Furthermore, wind energy as a renewable and green energy has significant environmental benefits including the reduction of coal, CO2 and SO2 with 23,887 × 104 tce, 66,854 × 104 tone and 173 × 104 tone in total from 2008 to 2015, respectively, which facilitate sustainable energy and sustainable environment.
Secondly, the installed capacity is predicted by GM(1,1) and scenario analysis. It draws that the annual average growth rate of installed capacity from 2017 to 2025 is 9.56% and the installed capacity of 38,311.1810 × 104 GW in 2025 with GM(1,1). Meanwhile, the installed capacity will reach up to 40,000 × 103 GW in 2025 under the high GDP growth rate and 29,000 × 103 GW in 2025 under the low GDP growth rate with the scenario analysis. It is clear to find that the results predicted by the GM(1,1) model are consistent with that of the high GDP growth rate.
In addition, wind energy as a renewable and clean energy has a significant effect on the sustainable development of economy, energy and environment. Thus, the government in China should stimulate its development widely and effectively by carrying out effective policies and encouraging firms to enhance the technological innovative ability. Although some factors hinder the wind power deployment such as material used in wind turbines and the wind power curtailment problems, the booming development tendency of wind energy will not change under the serious threatening of traditional energy depletion and environmental problems.
Finally, although some valuable information has been reached in this paper, there are still several points that can be improved such as another more precise method employed for the prediction of installed capacity, the influence of technological development, detailed wind power problems and so on. These aspects will be improved in further studies.
Acknowledgments

This research is supported by funding from the China Geological Survey Project: China’s Energy and Mineral Resources Security Dynamic Evaluation and Decision Support System Construction (121201103000150112); the cultivating program of the excellent innovation team of Chengdu University of Technology (KYTD201406); the Projects of the National Social Science Foundation of China (17BGL147); and the Key Program of Sichuan Mineral Resources Research Center (SCKCZY2016-ZD001).

Author Contributions

All authors have made a significant contribution to this research. Jianbo Yang and Qunyi Liu conceived and designed the experiments; Xiandan Cui collected data and information; Xin Li provided methods and processed data; Xin Li analyzed the data; Jianbo Yang wrote the paper.

Conflicts of Interest

The authors declare no conflict of Internet.

References

  1. Intergovernmental Panel on Climate Change. Climate Change: Impacts, Adaption, and Vulnerability. 2014. Available online: http://www.ipcc.ch/report/ar5/wg2/ (accessed on 7 September 2015).
  2. NBSC (National Bureau of Statistics of China). China Energy Statistical Year Book; China Statistics Press: Beijing, China, 2014. (In Chinese)
  3. British Petroleum. Statistical Review of World Energy; BP: London, UK, 2014.
  4. Zhu, L.J.; Yue, C.; Wang, S.P.; Fang, J.G. Carbon emissions in China and major countries from 1850 to 2008. Acta Sci. Nat. Univ. Pekin. 2010, 46, 479–504. (In Chinese) [Google Scholar]
  5. Hu, J.L.; Lee, Y.C. Efficient three industrial waste abatement for regions in China. Int. J. Sustain. Dev. World Ecol. 2008, 15, 132–144. [Google Scholar] [CrossRef]
  6. Li, Z. Quantitative analysis of sustainable energy strategies in China. Energy Policy 2010, 38, 2149–2160. [Google Scholar]
  7. Wang, T.; Waston, J. Scenario analysis of China’s emissions pathways in the 21st century for low-carbon transition. Energy Policy 2010, 38, 3537–3546. [Google Scholar] [CrossRef]
  8. Duan, H. Emissions and temperature benefits: The role of wind power in China. Environ. Res. 2017. [Google Scholar] [CrossRef] [PubMed]
  9. Li, N.; Zhang, X.; Shi, M.; Zhou, S. The prospects of China’s long-term economic development and CO2 emissions under fossil fuel supply constraints. Resour. Conserv. Recycl. 2017, 121, 11–22. [Google Scholar] [CrossRef]
  10. China-US Joint Announcement on Climate Change. 2014. Available online: http://www.cma.gov.cn/en2014/news/News/201411/t20141118_267244.html (accessed on 17 January 2015).
  11. Panwar, N.L.; Kaushik, S.C.; Kothari, S. Role of renewable energy sources in environmental protection: A review. Renew. Sustain. Energy Rev. 2011, 15, 1513–1524. [Google Scholar] [CrossRef]
  12. Kothari, R.; Tyagi, V.V.; Pathak, A. Waste-to-energy: A way from renewable energy sources to sustainable development. Renew. Sustain. Energy Rev. 2010, 14, 3164–3170. [Google Scholar] [CrossRef]
  13. Ma, H.; Oxley, L.; Gibson, J.; Li, W. A survey of China’s renewable energy economy. Renew. Sustain. Energy Rev. 2010, 14, 438–445. [Google Scholar] [CrossRef]
  14. Fayaz, H.; Saidur, R.; Razali, N.; Annuar, F.S.; Saleman, A.R.; Islam, M.R. An overview of hydrogen as a vehicle fuel. Renew. Sustain. Energy Rev. 2012, 8, 5511–5528. [Google Scholar] [CrossRef]
  15. Taibi, E.; Gielen, D.; Bazilian, M. The potential for renewable energy in industrial applications. Renew. Sustain. Energy Rev. 2012, 16, 735–744. [Google Scholar] [CrossRef]
  16. Su, L.-W.; Li, X.-R.; Sun, Z.-Y. Flow chart of methanol in China. Renew. Sustain. Energy Rev. 2013. [Google Scholar] [CrossRef]
  17. Feng, Y.; Lin, H.; Ho, S.L.; Yan, J.; Dong, J.; Fang, S.; Huang, Y. Overview of wind power generation in China: Status and development. Renew. Sustain. Energy Rev. 2015. [Google Scholar] [CrossRef]
  18. Da, Z.; Zhang, X.; He, J.; Chai, Q. Offshore wind energy development in China: Current status and future perspective. Renew. Sustain. Energy Rev. 2011, 15, 4673–4684. [Google Scholar] [CrossRef]
  19. Global Wind Energy Council. Global Wind Report, Annual Market Update 2012; Global Wind Energy Council: Brussels, Belgium, 2013. [Google Scholar]
  20. Pei, W.; Chen, Y.; Sheng, K.; Deng, W.; Du, Y.; Qi, Z.; Kong, L. Temporal-spatial analysis and improvement measures of Chinese power system for wind power curtailment problem. Renew. Sustain. Energy Rev. 2015. [Google Scholar] [CrossRef]
  21. Zhao, Z.; Chang, R.; Chen, Y. What hinder the further development of wind power in China?—A socio-technical barrier study. Energy Policy 2016. [Google Scholar] [CrossRef]
  22. Dones, R.; Heck, T.; Emmenegger, M.F.; Jungbluth, N. Life-cycle inventories for the nuclear and natural gas energy systems, and examples of uncertainty analysis. Int. J. Life Cycle Anal. 2005, 10, 10–23. [Google Scholar] [CrossRef]
  23. Vautard, R.; Thais, F.; Tobin, I.; Breon, F.M.; de Lacergne, J.G.D.; Colette, A.; Yiou, R.; Ruti, P.M. Regional climate model simulations indicate limited climatic impacts by operational and planned European wind farms. Nat. Commun. 2014, 5, 1–9. [Google Scholar] [CrossRef] [PubMed]
  24. Xue, B.; Ma, Z.X.; Geng, Y.; Heck, P.; Ren, W.; Tobias, M.; Maas, A.; Jiang, P.; de Oliveira, J.A.P.; Fujita, T. A life cycle co-benefits assessment of wind power in China. Renew. Sustain. Energy Rev. 2015, 41, 338–346. [Google Scholar] [CrossRef]
  25. Nagashima, S.; Uchiyama, Y.; Okajima, K. Environment, energy and economics analysis of wind power generation system installation with input-output table. Energy Procedia 2015, 75, 683–690. [Google Scholar] [CrossRef]
  26. Chen, X.; Wang, K.; Zhang, Z.; Zheng, Y.; Zhang, Y.; O’Driscoll, K. An assessment of wind and wave climate as potential sources of renewable energy in the nearshore Shenzhen coastal zone of the South China Sea. Energy 2017, 134, 789–801. [Google Scholar] [CrossRef]
  27. Xu, Y.; Yuan, J.; Xu, H. Dynamic integrated resource strategic planning model: A case study of China’s power sector planning into 2050. Sustainability 2017, 9, 1177. [Google Scholar] [CrossRef]
  28. Ye, B.; Zhang, K.; Jiang, J.; Miao, L.; Li, J. Towards a 90% renewable energy future: A case study of an island in the South China Sea. Energy Convers. Manag. 2017, 142, 28–41. [Google Scholar] [CrossRef]
  29. Gosens, J.; Kåberger, T.; Wang, Y. China’s next renewable energy revolution: Goals and mechanisms in the 13th Five Year Plan for energy. Energy Sci. Eng. 2017, 5, 141–155. [Google Scholar] [CrossRef]
  30. Ye, B.; Yang, P.; Jiang, J.; Miao, L.; Shen, B.; Li, J. Feasibility and economic analysis of a renewable energy powered special town in China. Resour. Conserv. Recycl. 2017, 121, 40–50. [Google Scholar] [CrossRef]
  31. Hu, J.; Huang, L.; Chen, M.; He, G.; Zhang, H. Impacts of power generation on air quality in China—Part II: Future scenarios. Resour. Conserv. Recycl. 2017, 121, 115–127. [Google Scholar] [CrossRef]
  32. Wang, J.; Wang, Y. A novel wind speed forecasting model for wind farms of Northwest China. Int. J. Green Energy 2017, 14, 463–478. [Google Scholar] [CrossRef]
  33. Zhang, D.; Wang, J.; Lin, Y.; Si, L.; Huang, C.; Yang, J.; Huang, B.; Li, W. Present situation and future prospect of renewable energy in China. Renew. Sustain. Energy Rev. 2017, 76, 865–871. [Google Scholar] [CrossRef]
  34. Sun, B.; Yu, Y.; Qin, C. Should China focus on the distributed development of wind and solar photovoltaic power generation? A comparative study. Appl. Energy 2017, 185, 421–439. [Google Scholar] [CrossRef]
  35. Yan, J.; Liu, Y.; Han, S.; Wang, Y.; Feng, S. Reviews on uncertainty analysis of wind power forecasting. Renew. Sustain. Energy Rev. 2015, 52, 1322–1330. [Google Scholar] [CrossRef]
  36. Lu, Z.; Li, W.; Xie, B.; Shang, L. Study on China’s wind power development path-Based on the target for 2030. Renew. Sustain. Energy Rev. 2015, 51, 197–208. [Google Scholar] [CrossRef]
  37. Ye, L.; Zhao, Y.; Zeng, C.; Zhang, C. Short-term wind power prediction based on spatial model. Renew. Energy 2017, 101, 1067–1074. [Google Scholar] [CrossRef]
  38. Wu, Y.; Lee, C.; Shu, G. Taiwan first large-scale offshore wind farm connection—A real project case study. In Proceedings of the 2010 IEEE Industry Applications Society Annual Meeting (IAS), Housotn, TX, USA, 3–7 October 2010. [Google Scholar] [CrossRef]
  39. Zhao, X.; Ren, L. Focus on the development of offshore wind power in China: Has the golden period come? Renew. Energy 2015, 81, 644–657. [Google Scholar] [CrossRef]
  40. Khanji, H.; Uqaili, M.A.; Memona, M.; Mirza, U.K. Forecasting the diffusion of wind power in Pakistan. Energy 2011, 36, 6068–6073. [Google Scholar]
  41. Quan, D.M.; Ogliari, E.; Grimaccia, F.; Leva, S.; Mussetta, M. Hybrid model for hourly forecast of photovoltaic and wind power. In Proceedings of the IEEE International Conference on Fuzzy Systems, Hyderabad, India, 7–10 July 2013. [Google Scholar] [CrossRef]
  42. China’s Wind Energy Resource Assessment Results. 2014. Available online: http:// www.cma.gov.cn/ (accessed on 13 December 2015). (In Chinese)
  43. Li, J. China Wind Power Outlook 2012. Available online: http://www.gwec.net/wp-content/uploads/2012/11/China-Outlook-2012-EN.pdf (accessed on 21 December 2013). (In Chinese).
  44. China Electric Power Press. China Electric Power Yearbook 2006–2016; China Electric Power Press: Beijing, China, 2017. (In Chinese)
  45. National Energy Administration. Available online: http://www.nea.gov.cn/ (accessed on 3 December 2016).
  46. Geoffrey, H. The Economics of Renewable Energy; Working Paper 15081; National Bureau of Economic Research: Cambridge, MA, USA, 2009.
  47. China National Renewable Energy Centre, China National Energy Administration. China 13th Five-Year Plan for Renewable Energy Development, Key Information at a Glance; CNREC, CNEA: Beijing, China, 2017.
  48. Liu, S.; Deng, J. The validity of GM(1,1). Syst. Eng. Theory Pract. 2000, 20, 121–124. (In Chinese) [Google Scholar]
  49. Yuan, C.; Liu, S.; Fang, Z. Comparison of China’s primary energy consumption forecasting by using ARIMA (the autoregressive integrated moving average) model and GM(1,1) model. Energy 2016, 100, 384–390. [Google Scholar] [CrossRef]
  50. Deng, J. Three properties of Grey Forecasting Model GM(1,1)—The issue on the optimization structure and optimization information volume of grey predictive control. J. Huazhong Univ. Sci. Technol. 1987, 5, 1–6. (In Chinese) [Google Scholar]
  51. Deng, J. The Fundamental of Grey Theory; Huazhong University of Science and Technology Press: Wuhan, China, 2002. (In Chinese) [Google Scholar]
Figure 1. The distribution of average onshore wind energy density of 70 m height for China in 2014. Note: The data is from the 4th National Wind Energy Detailed Survey and Evaluation [42].
Sustainability 09 01454 g001
Figure 2. The distribution of average offshore wind energy density of 200 m height and 5–10 m water depth for China in 2014. Note: The data is from the 4th National Wind Energy Detailed Survey and Evaluation [42].
Sustainability 09 01454 g002
Figure 3. The installed capacity in China from 2006 to 2015. Note: The data is from the China Electric Power Yearbook [44].
Sustainability 09 01454 g003
Figure 4. The share of cumulative installed capacity for China in 2015. Note: The data is from the National Energy Administration [45].
Sustainability 09 01454 g004
Figure 5. The wind power generation for China from 2009 to 2015. Note: The data is from the National Energy Administration [45].
Sustainability 09 01454 g005
Figure 6. The share of wind power generation for China in 2015. Note: The data is from the National Energy Administration [45].
Sustainability 09 01454 g006
Figure 7. The prediction of installed capacity in China from 2017 to 2025.
Sustainability 09 01454 g007
Table 1. The technological exploitation of onshore wind energy in China (Unit: GW).
The Height (m)The Intensity of Wind Energy ≥ 200 W/m2The Intensity of Wind Energy ≥ 300 W/m2The Intensity of Wind Energy ≥ 400 W/m2
5029002000800
70360026001000
100400034001500
Note: The data is from the 4th National Wind Energy Detailed Survey and Evaluation [42].
Table 2. The regional classification in China.
RegionProvinces, Cities and Autonomous Regions
North ChinaBeijing, Tianjin, Hebei, Shanxi, Inner Mongolia
NortheastLiaoning, Jilin, Heilongjiang
NorthwestNingxia, Xinjiang, Qinghai, Shaanxi, Gansu
East ChinaShandong, Jiangsu, Anhui, Zhejiang, Fujian, Shanghai
Central ChinaHubei, Hunan, Henan, Jiangxi
SouthwestSichuan, Guizhou, Yunnan, Tibet, Chongqing
South ChinaGuangdong, Guangxi, Hainan
Table 3. The potential exploitation for wind power (Unit: GW).
The BasesThe Potential ExploitationTechnically Exploitable Capacity
Inner Mongolia *1305.30381.70
Xinjiang249.1064.80
Gansu205.2082.20
Hebei79.3023.79
Jilin1115.4043.60
Jiangsu13.9013.90
Total2968.20609.99
* Include West Inner Mongolia and East Inner Mongolia. Note: The data is from the 4th National Wind Energy Detailed Survey and Evaluation [42].
Table 4. The environmental impact of wind power from 2008 to 2015.
YearsWind Power/TWhCoal Equivalent/104 tceCO2/104 TonsSO2/104 TonsOx Nitride/104 TonsSmoke/104 Tons
200813342111793.03.20.5
200927487324426.36.61.1
20104941571439711.411.92.0
20117392350657717.017.73.0
201210283269915023.624.74.1
20131383439712,30631.833.25.5
20141598508114,22036.738.36.4
20151863592416,58142.844.77.5
Total751223,88766,85417318030
The data is from the China 13th Five-Year Plan for renewable energy development [47].
Table 5. The prediction of China’s installed capacity with GM(1,1) model (Unit: 1000 GW).
YearInstalled Capacity
201719,243.2819
201821,620.1222
201924,000.7966
202026,383.6647
202128,768.1793
202231,153.2431
202333,538.8562
202435,925.0186
202538,311.1810
Table 6. China’s economic development trend forecast from 2017 to 2025.
GDP Growth Rate (%)
Year2017–20202021–2025
Scenarios of High7.06.5
Scenarios of Medium6.56.0
Scenario of Low6.05.5
Table 7. The prediction of China’s installed capacity with scenario analysis (Unit: 1000 GW).
Scenarios201720182019202020212022202320242025
High15,00018,70022,00025,00029,00032,50035,00038,00040,000
Medium14,00017,50019,50022,00024,50027,00030,00032,50034,000
Low14,00016,50018,00020,00022,00023,50026,00027,50029,000