The Seasonal and Diurnal Influence of Surrounding Land Use on Temperature: Findings from Seoul, South Korea


Abstract
1. Introduction
2. Methods
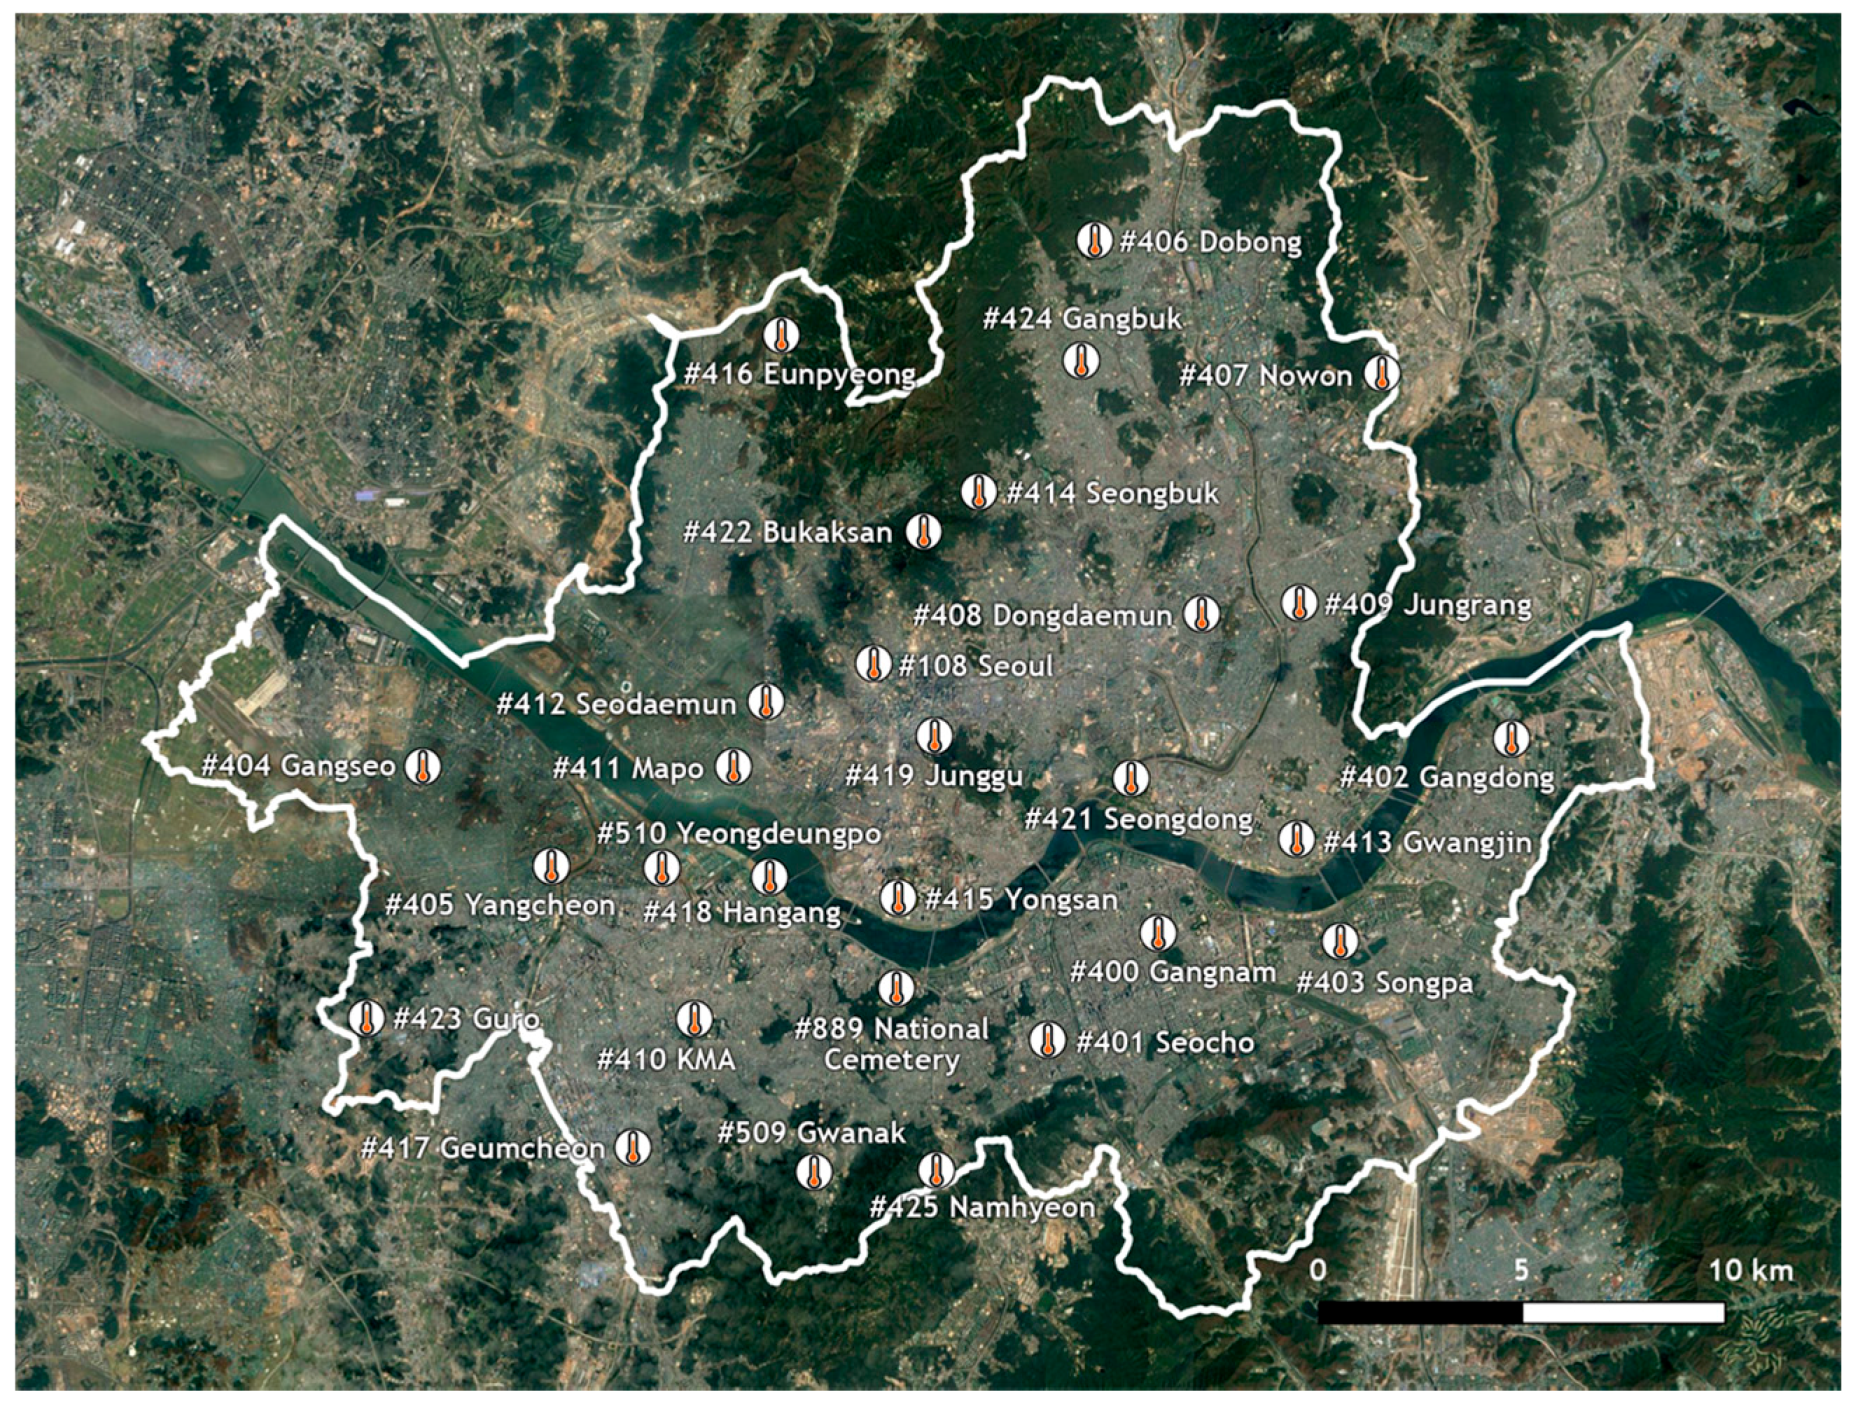
2.1. Study Area
2.2. Data
2.2.1. Temperature Data
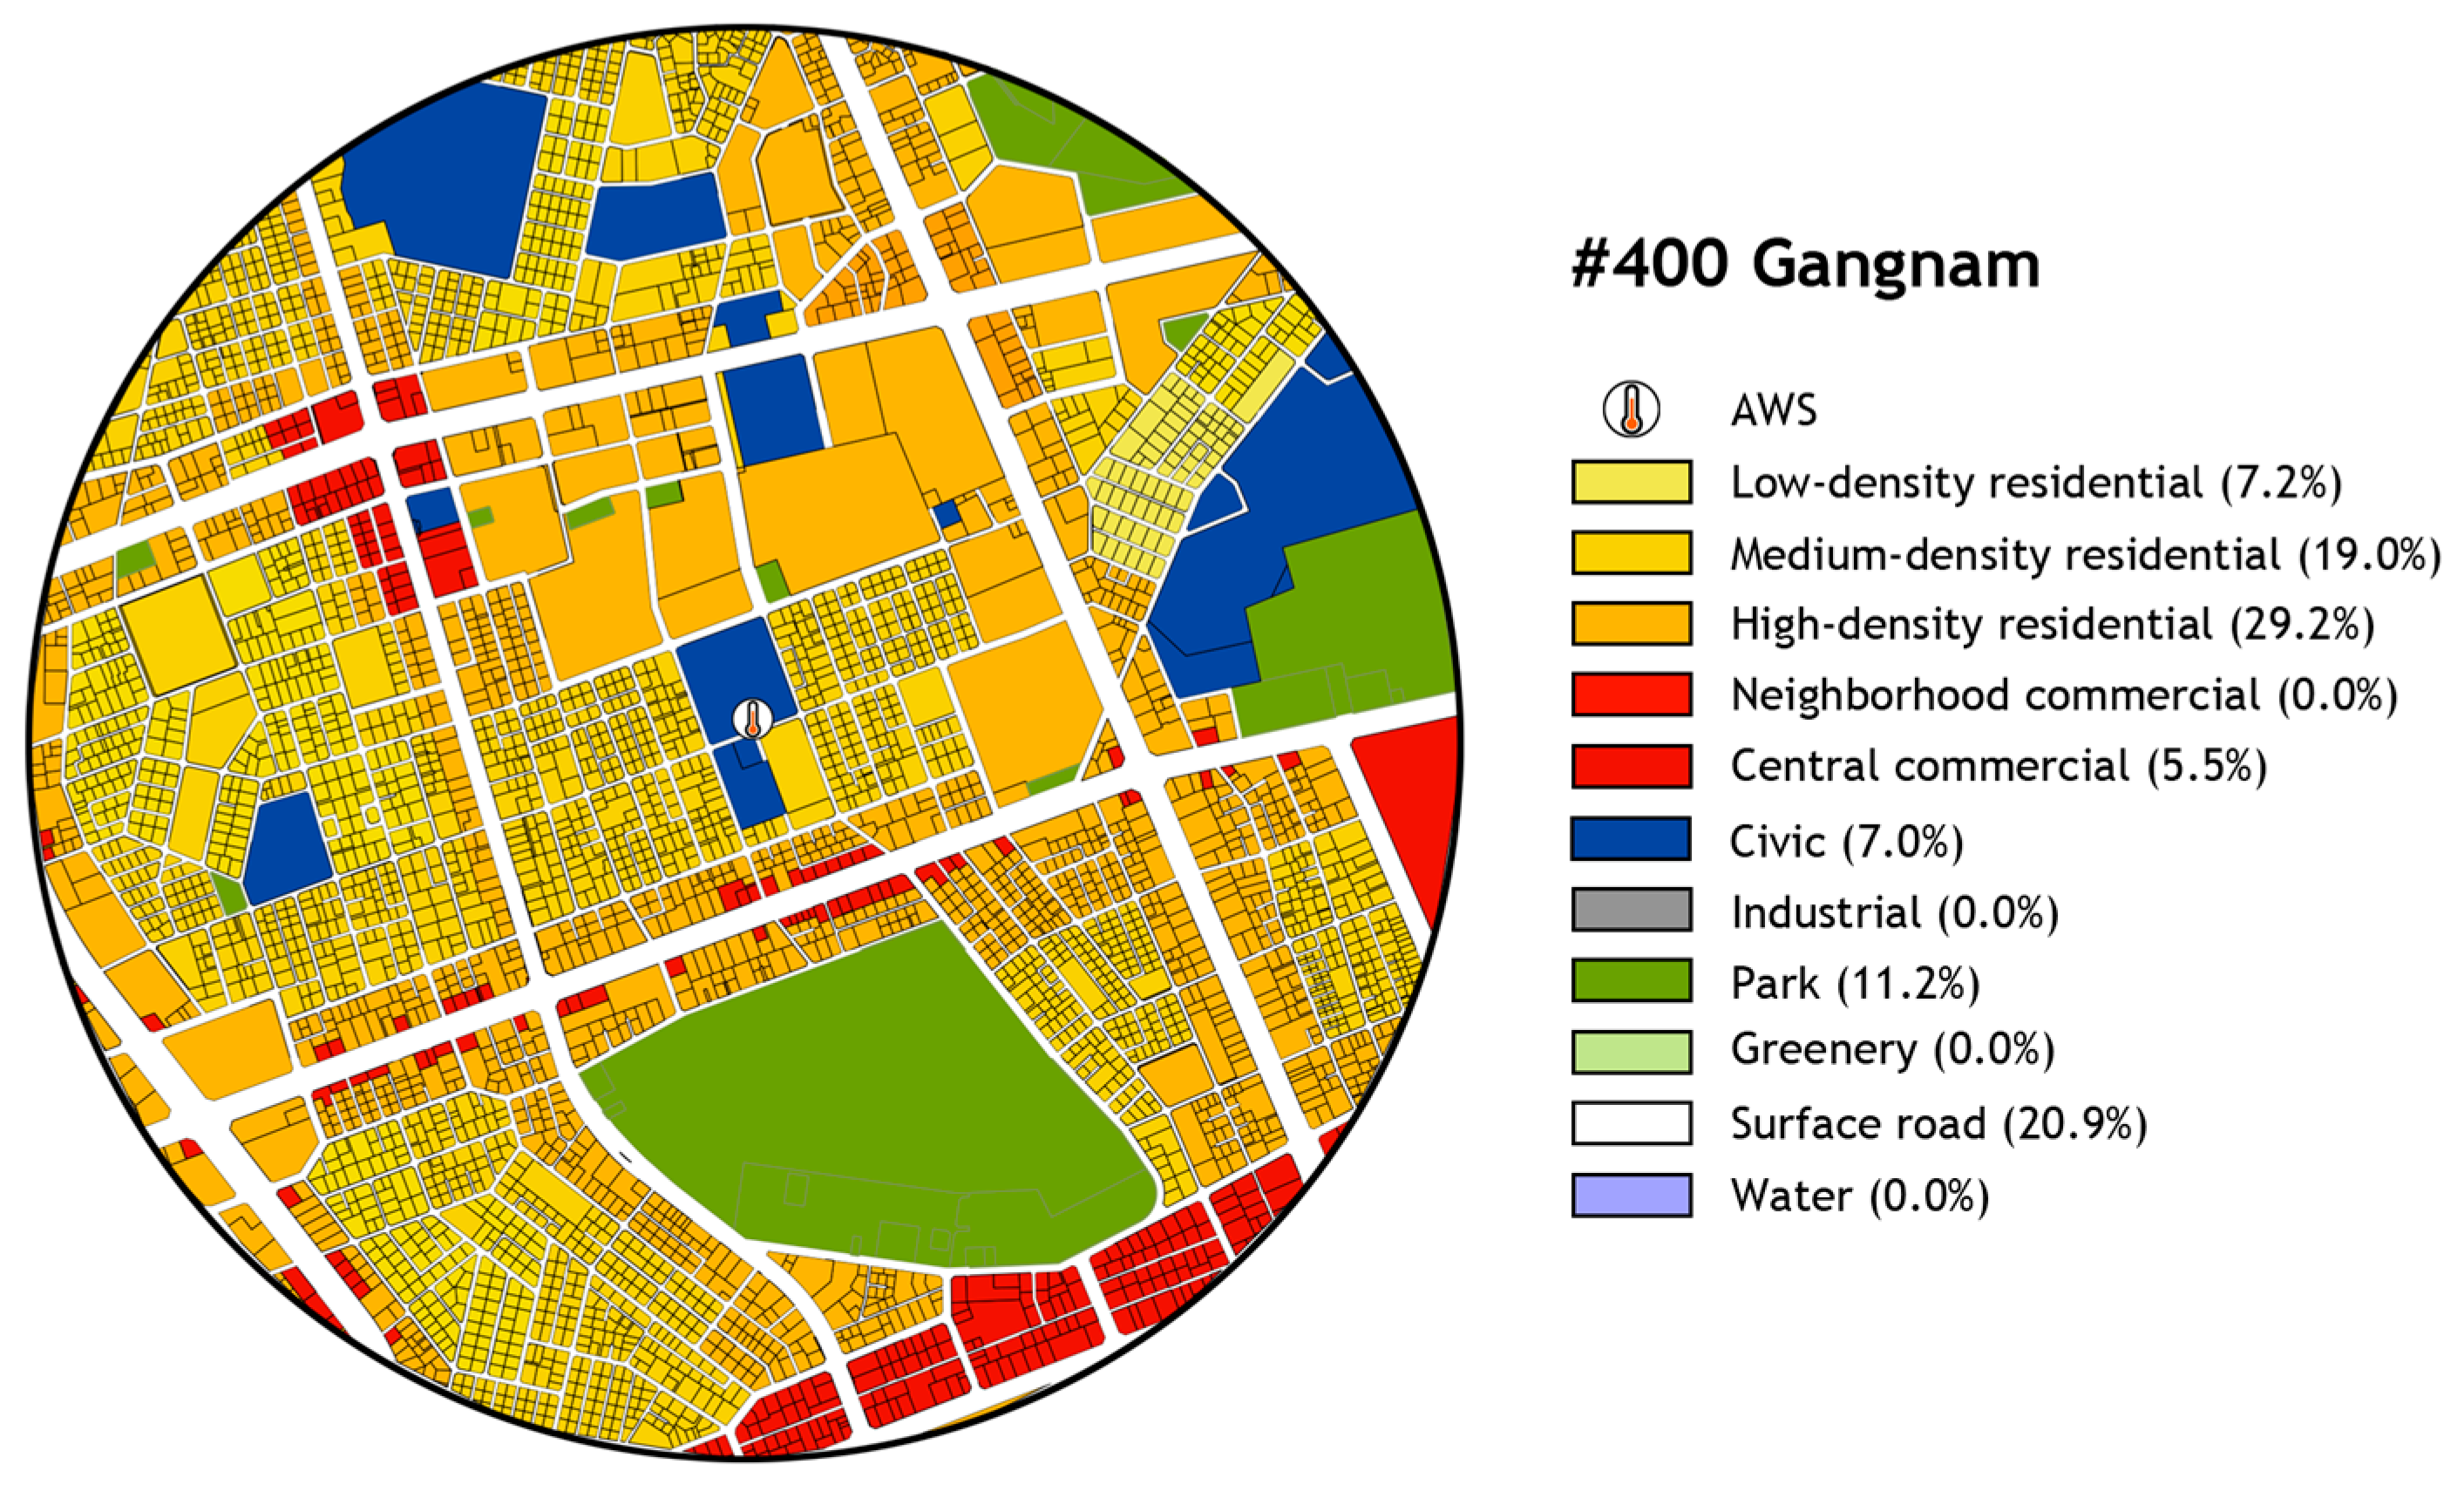
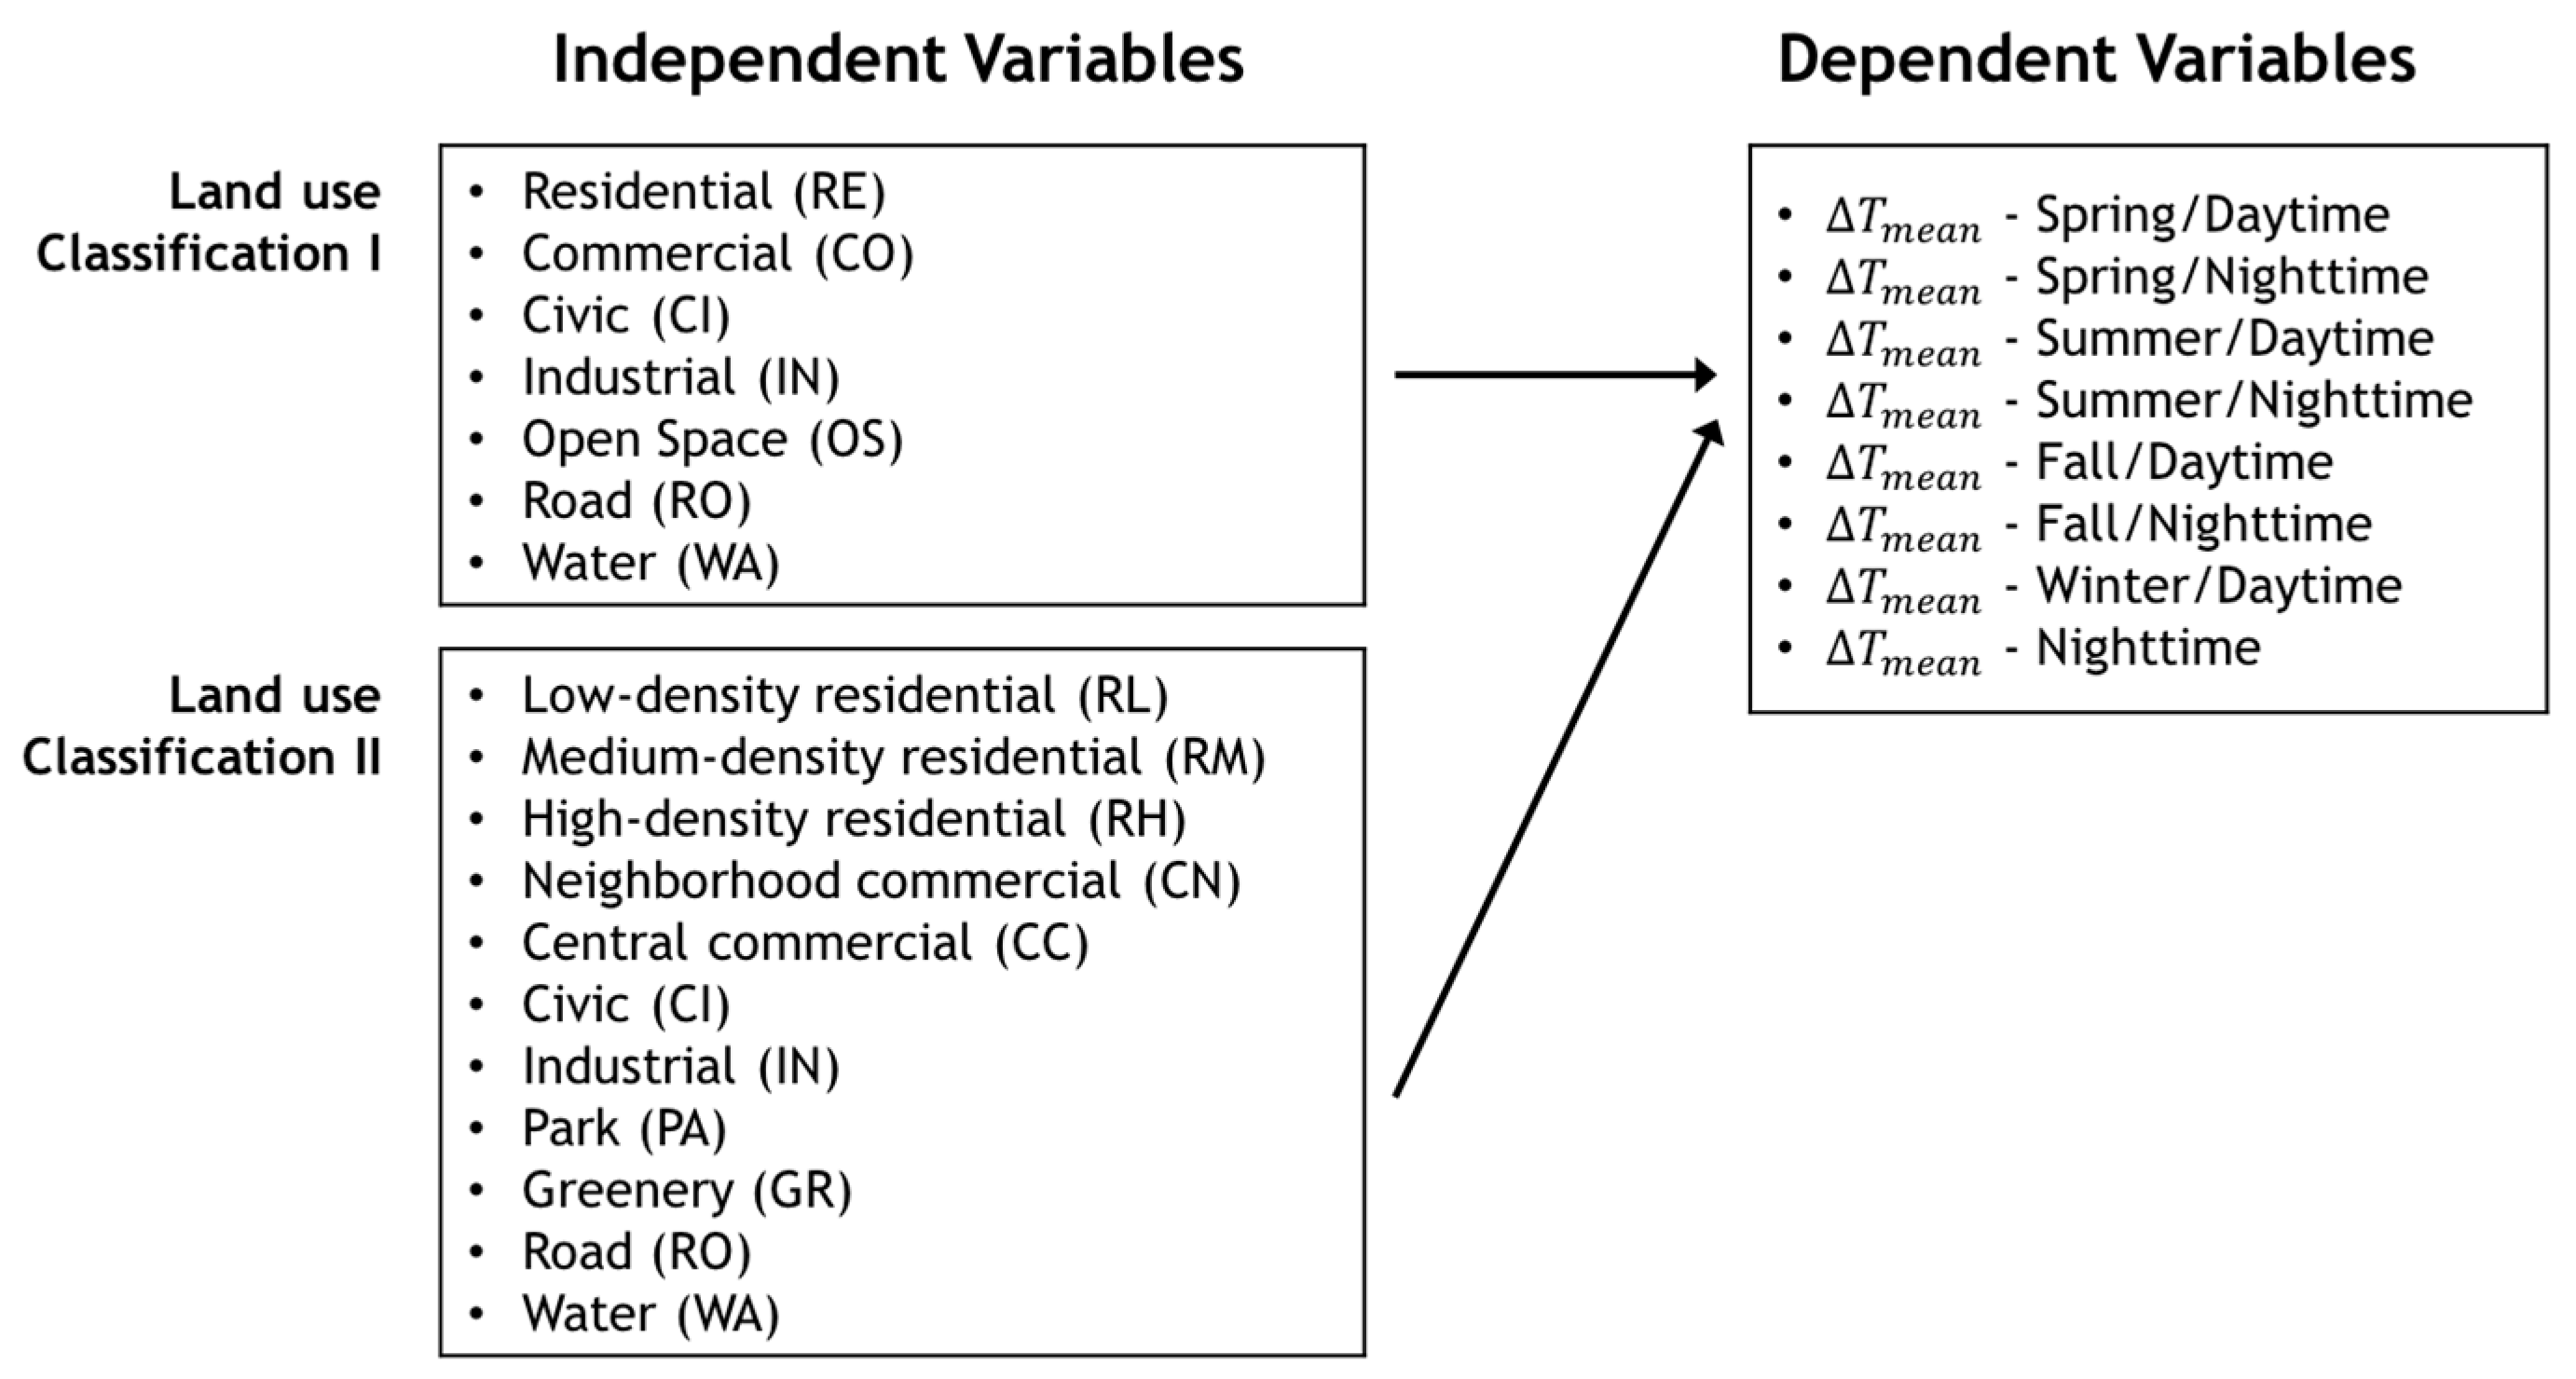
2.2.2. Land Use Data
2.3. Analysis
3. Results
3.1. Testing for Multicollinearity
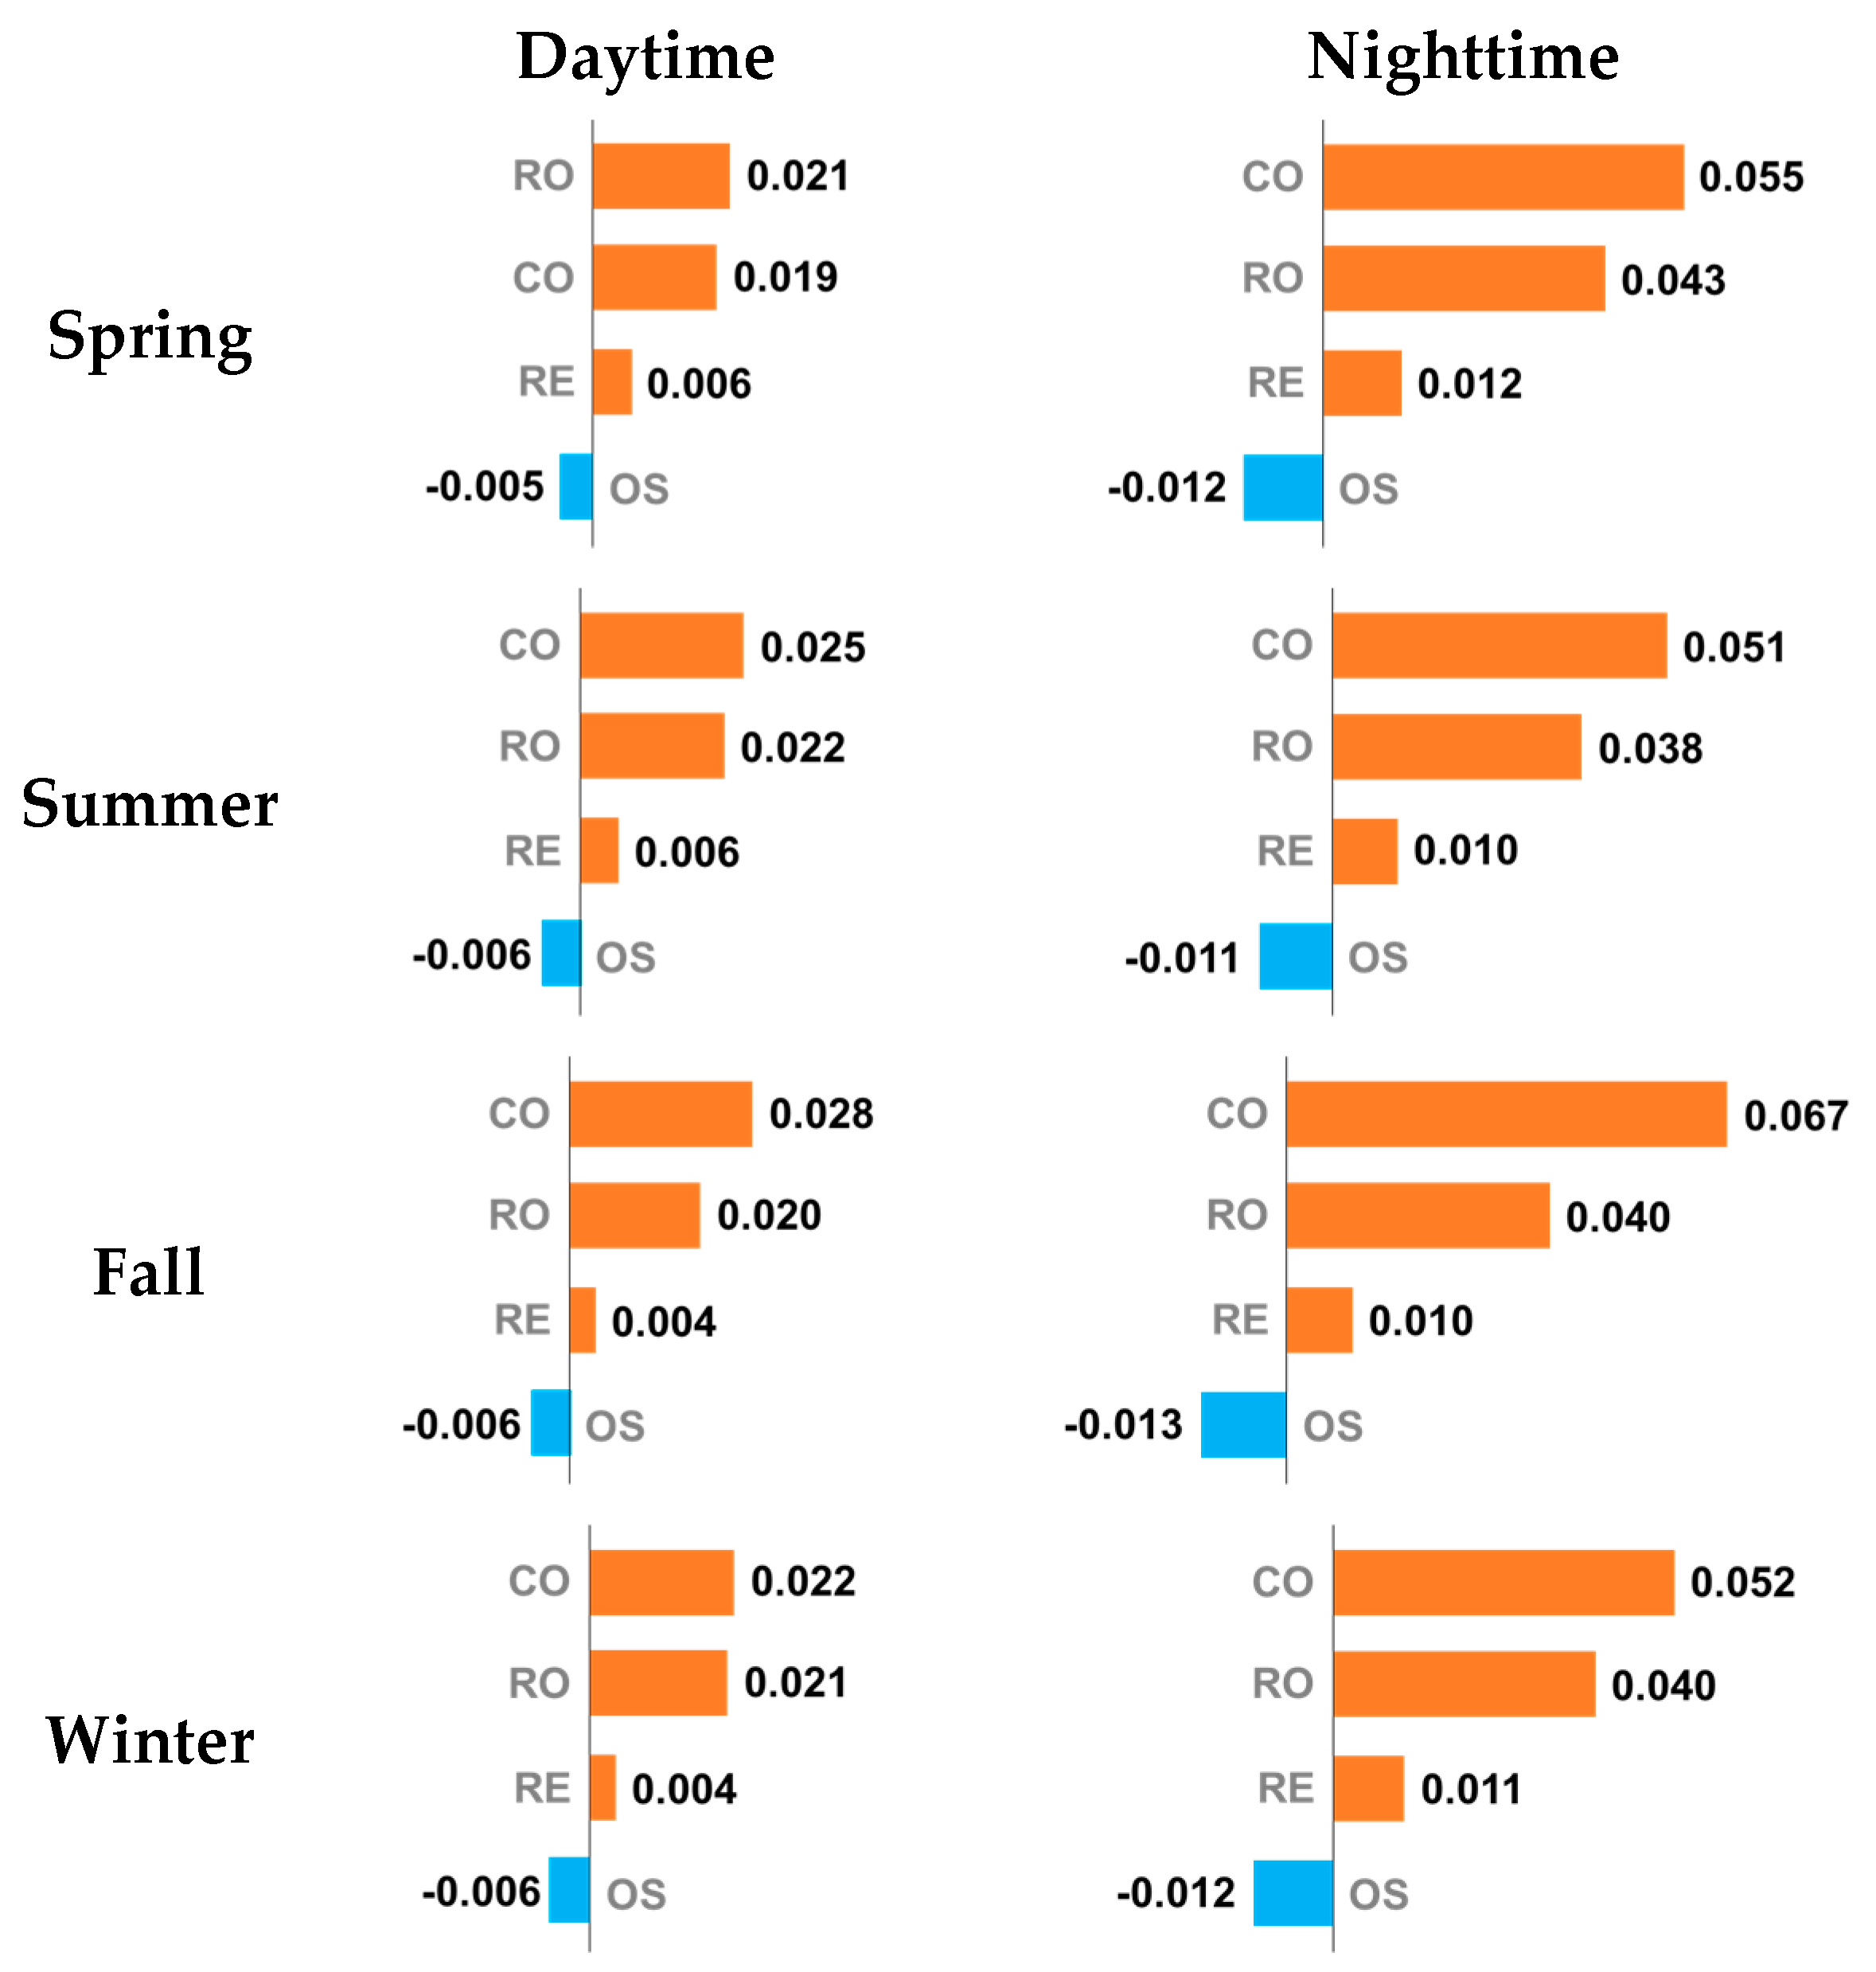
3.2. Land Use Classification I
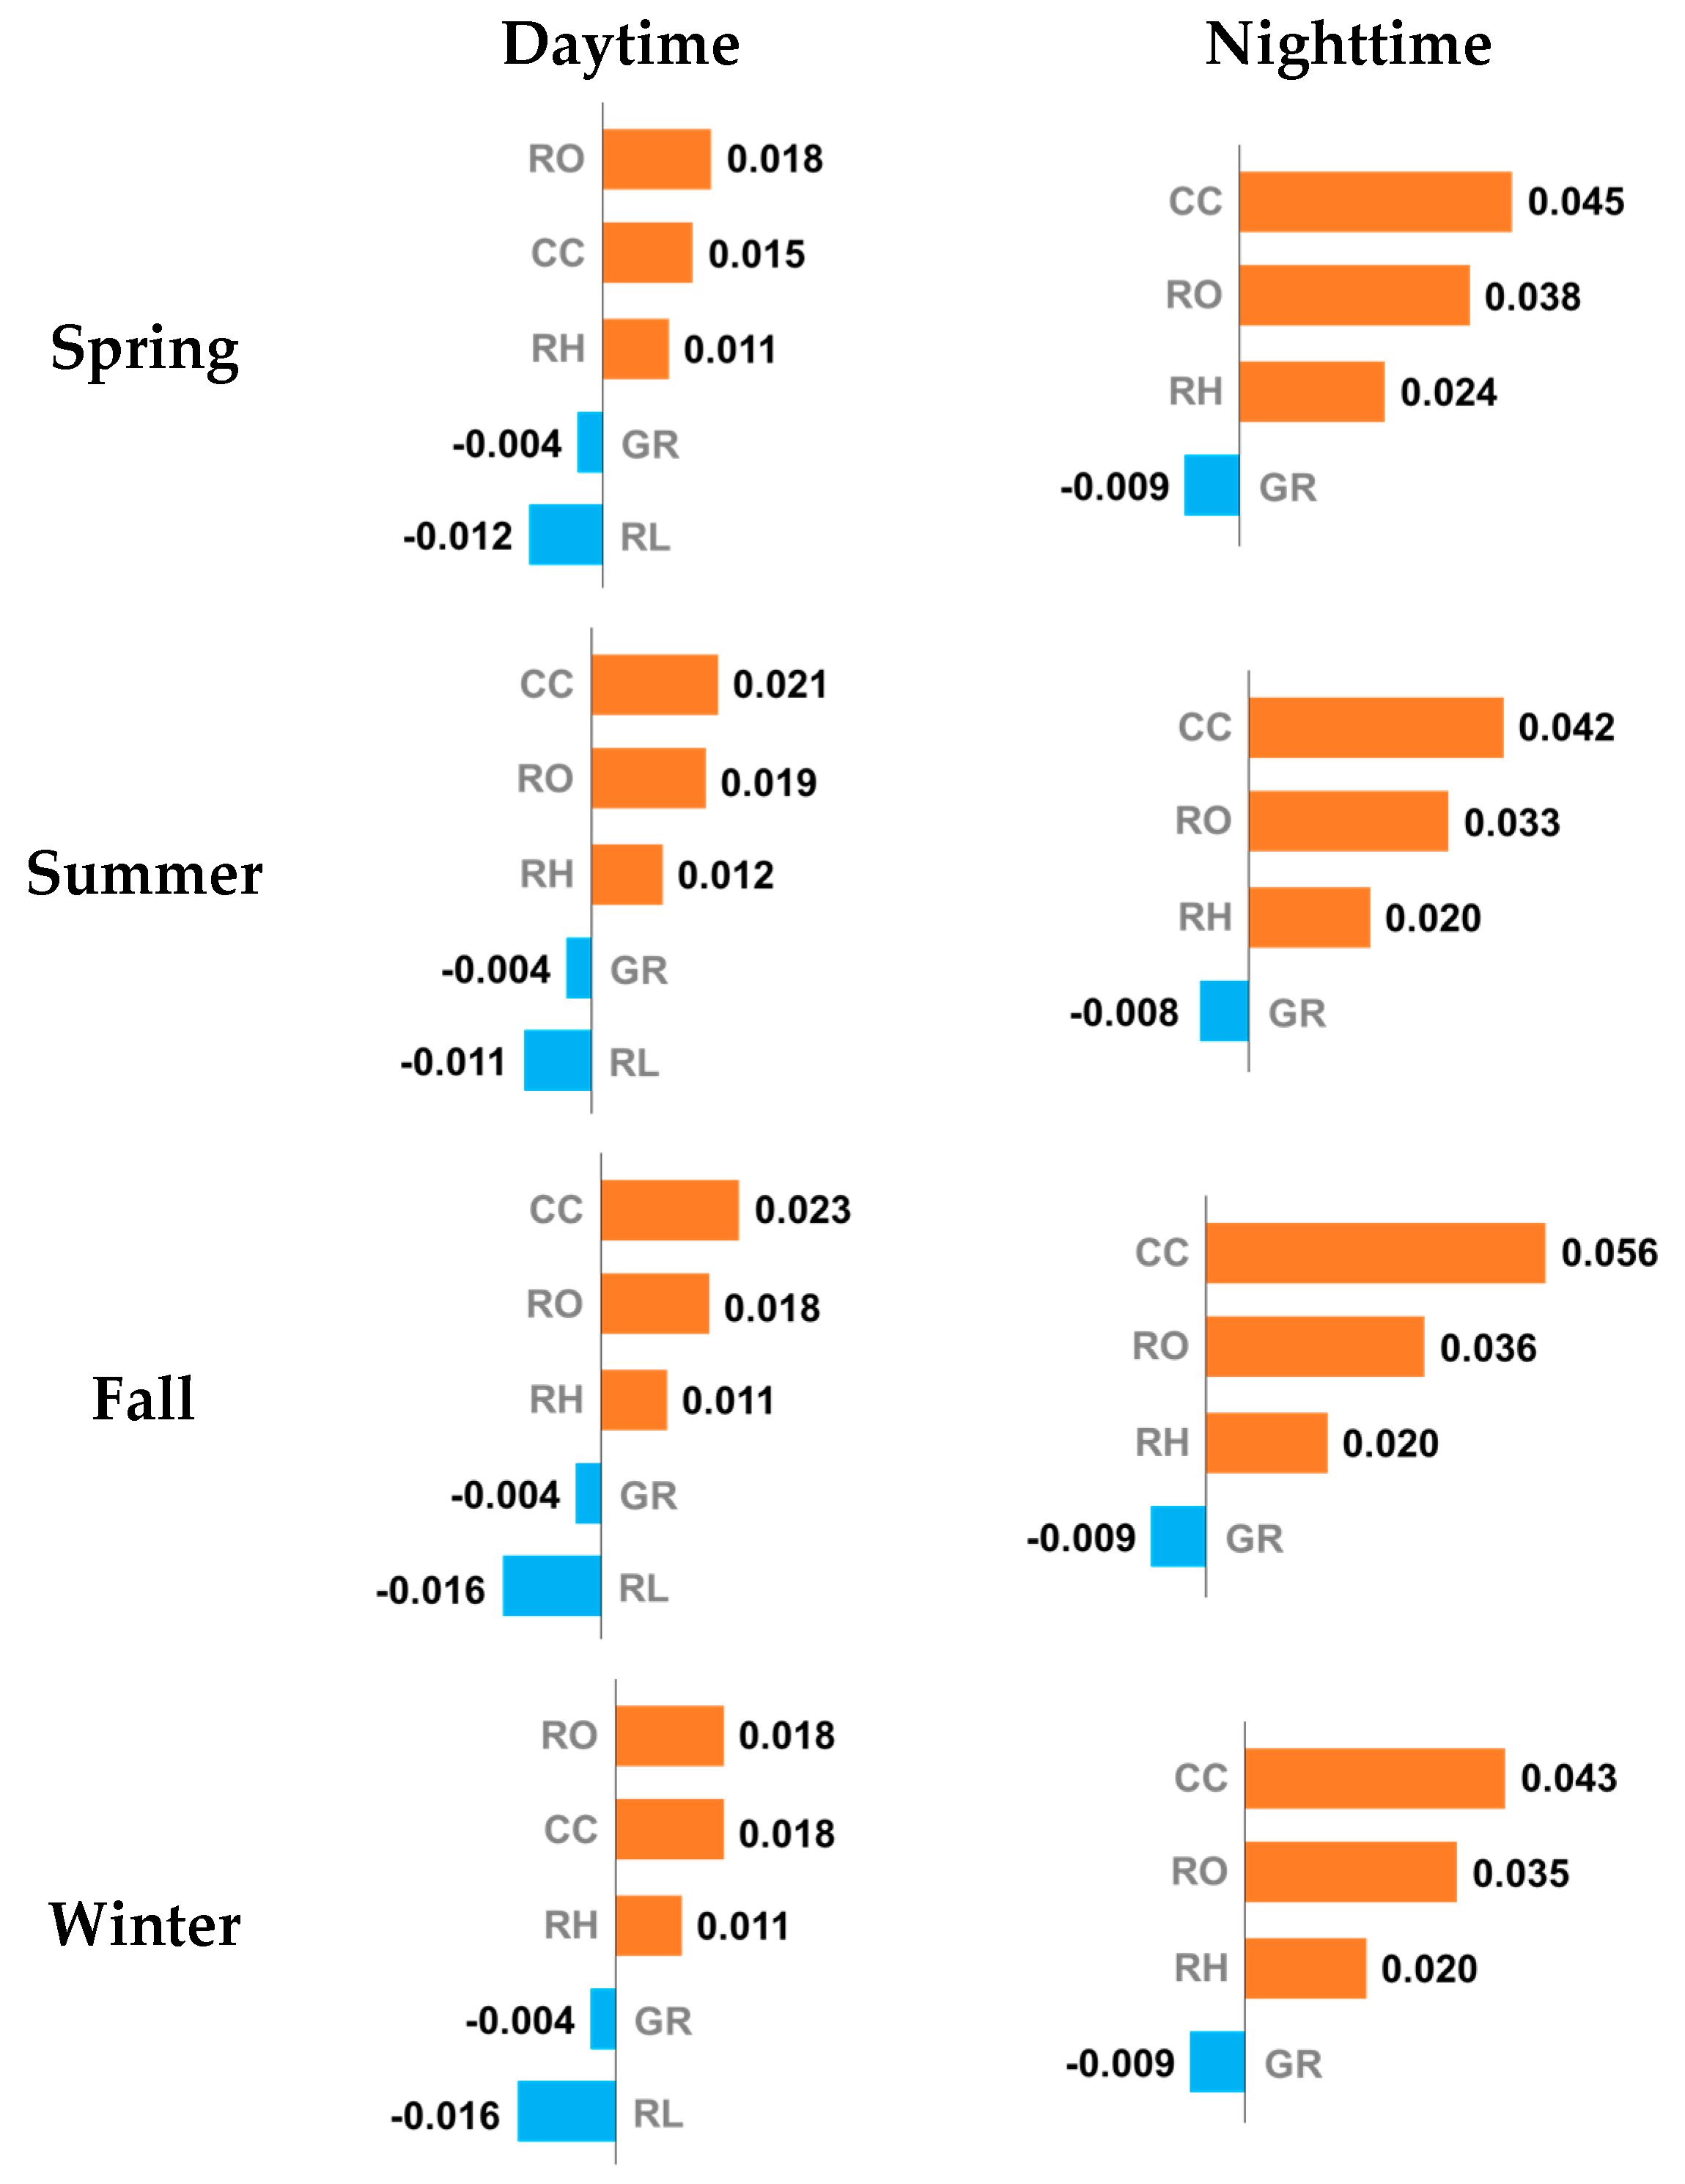
3.3. Land Use Classification II
4. Discussion and Implications
5. Concluding Remarks
Acknowledgments
Author Contributions
Conflicts of Interest
References
- Intergovernmental Panel on Climate Change (IPCC). Climate Change 2014: Synthesis Report. Contribution of Working Groups I, II and III to the Fifth Assessment Report of the Intergovernmental Panel on Climate Change; Intergovernmental Panel on Climate Change: Geneva, Switzerland, 2014. [Google Scholar]
- Bulkeley, H. Cities and Climate Change, 1st ed.; Routledge: New York, NY, USA, 2013; ISBN 978-0-415-59705-0. [Google Scholar]
- Ewing, R.; Bartholomew, K.; Winkelman, S.; Walters, J.; Chen, D. Growing Cooler: The Evidence on Urban Development and Climate Change; Urban Land Institute: Washington, DC, USA, 2008; ISBN 978-0-87420-082-9. [Google Scholar]
- Stone, B. The City and the Coming Climate: Climate Change in the Places We Live, 1st ed.; Cambridge University Press: New York, NY, USA, 2012; ISBN 978-1-107-60258-8. [Google Scholar]
- Hickman, R.; Banister, D. Transport, Climate Change and the City; Routledge: London, UK; New York, NY, USA, 2015; ISBN 978-0-415-66003-7. [Google Scholar]
- Newman, P.; Beatley, T.; Boyer, H.M. Resilient Cities: Responding to Peak Oil and Climate Change, 1st ed.; Island Press: Washington, DC, USA, 2009; ISBN 978-1-59726-499-0. [Google Scholar]
- Deilami, K.; Kamruzzaman, M. Modelling the urban heat island effect of smart growth policy scenarios in Brisbane. Land Use Policy 2017, 64, 38–55. [Google Scholar] [CrossRef]
- Giridharan, R.; Lau, S.S.Y.; Ganesan, S.; Givoni, B. Urban design factors influencing heat island intensity in high-rise high-density environments of Hong Kong. Build. Environ. 2007, 42, 3669–3684. [Google Scholar] [CrossRef]
- Givoni, B. Climate Considerations in Building and Urban Design; Van Nostrand Reinhold: New York, NY, USA, 1998; ISBN 0-442-00991-7. [Google Scholar]
- Lenzholer, S. Weather in the City: How Design Shapes the Urban Climate; nai010 Publishers: Rotterdam, The Netherlands, 2015; ISBN 978-94-6208-198-7. [Google Scholar]
- Mitchell, D.; Enemark, S.; van der Molen, P. Climate resilient urban development: Why responsible land governance is important. Land Use Policy 2015, 48, 190–198. [Google Scholar] [CrossRef]
- Taylor, P.J. Cities in climate change. Int. J. Urban Sci. 2017, 21, 1–14. [Google Scholar] [CrossRef]
- Calthorpe, P. Urbanism in the Age of Climate Change, 2nd ed.; Island Press: Washington, DC, USA, 2013; ISBN 978-1-59726-721-2. [Google Scholar]
- Desouza, K.C.; Flanery, T.H. Designing, planning, and managing resilient cities: A conceptual framework. Cities 2013, 35, 89–99. [Google Scholar] [CrossRef]
- Jabareen, Y. Planning the resilient city: Concepts and strategies for coping with climate change and environmental risk. Cities 2013, 31, 220–229. [Google Scholar] [CrossRef]
- Santamouris, M. Cooling the cities—A review of reflective and green roof mitigation technologies to fight heat island and improve comfort in urban environments. Sol. Energy 2014, 103, 682–703. [Google Scholar] [CrossRef]
- Susca, T.; Gaffin, S.R.; Dell’Osso, G.R. Positive effects of vegetation: Urban heat island and green roofs. Environ. Pollut. 2011, 159, 2119–2126. [Google Scholar] [CrossRef] [PubMed]
- Takebayashi, H.; Moriyama, M. Surface heat budget on green roof and high reflection roof for mitigation of urban heat island. Build. Environ. 2007, 42, 2971–2979. [Google Scholar] [CrossRef]
- Wong, J.K.W.; Lau, L.S.-K. From the “urban heat island” to the “green island”? A preliminary investigation into the potential of retrofitting green roofs in Mongkok district of Hong Kong. Habitat Int. 2013, 39, 25–35. [Google Scholar] [CrossRef]
- Zinzi, M.; Agnoli, S. Cool and green roofs. An energy and comfort comparison between passive cooling and mitigation urban heat island techniques for residential buildings in the Mediterranean region. Energy Build. 2012, 55, 66–76. [Google Scholar] [CrossRef]
- Alexandri, E.; Jones, P. Temperature decreases in an urban canyon due to green walls and green roofs in diverse climates. Build. Environ. 2008, 43, 480–493. [Google Scholar] [CrossRef]
- Santamouris, M. Using cool pavements as a mitigation strategy to fight urban heat island—A review of the actual developments. Renew. Sustain. Energy Rev. 2013, 26, 224–240. [Google Scholar] [CrossRef]
- Chen, L.; Ng, E.; An, X.; Ren, C.; Lee, M.; Wang, U.; He, Z. Sky view factor analysis of street canyons and its implications for daytime intra-urban air temperature differentials in high-rise, high-density urban areas of Hong Kong: A GIS-based simulation approach. Int. J. Climatol. 2012, 32, 121–136. [Google Scholar] [CrossRef]
- Chun, B.; Guhathakurta, S. Daytime and nighttime urban heat islands statistical models for Atlanta. Environ. Plan. B Plan. Des. 2015. [Google Scholar] [CrossRef]
- Chun, B.; Guldmann, J.-M. Spatial statistical analysis and simulation of the urban heat island in high-density central cities. Landsc. Urban Plan. 2014, 125, 76–88. [Google Scholar] [CrossRef]
- Coseo, P.; Larsen, L. How factors of land use/land cover, building configuration, and adjacent heat sources and sinks explain Urban Heat Islands in Chicago. Landsc. Urban Plan. 2014, 125, 117–129. [Google Scholar] [CrossRef]
- Svensson, M.K. Sky view factor analysis—Implications for urban air temperature differences. Meteorol. Appl. 2004, 11, 201–211. [Google Scholar] [CrossRef]
- Yuan, C.; Chen, L. Mitigating urban heat island effects in high-density cities based on sky view factor and urban morphological understanding: A study of Hong Kong. Archit. Sci. Rev. 2011, 54, 305–315. [Google Scholar] [CrossRef]
- Middel, A.; Häb, K.; Brazel, A.J.; Martin, C.A.; Guhathakurta, S. Impact of Urban Form and Design on Mid-Afternoon Microclimate in Phoenix Local Climate Zones. Landsc. Urban Plan. 2014, 122, 16–28. [Google Scholar] [CrossRef]
- Stone, B.; Rodgers, M.O. Urban Form and Thermal Efficiency: How the Design of Cities Influences the Urban Heat Island Effect. J. Am. Plan. Assoc. 2001, 67, 186–198. [Google Scholar] [CrossRef]
- Jamei, E.; Jamei, Y.; Rajagopalan, P.; Ossen, D.R.; Roushenas, S. Effect of built-up ratio on the variation of air temperature in a heritage city. Sustain. Cities Soc. 2015, 14, 280–292. [Google Scholar] [CrossRef]
- Aflaki, A.; Mirnezhad, M.; Ghaffarianhoseini, A.; Ghaffarianhoseini, A.; Omrany, H.; Wang, Z.-H.; Akbari, H. Urban heat island mitigation strategies: A state-of-the-art review on Kuala Lumpur, Singapore and Hong Kong. Cities 2017, 62, 131–145. [Google Scholar] [CrossRef]
- Alavipanah, S.; Wegmann, M.; Qureshi, S.; Weng, Q.; Koellner, T. The Role of Vegetation in Mitigating Urban Land Surface Temperatures: A Case Study of Munich, Germany during the Warm Season. Sustainability 2015, 7, 4689–4706. [Google Scholar] [CrossRef]
- Armson, D.; Stringer, P.; Ennos, A.R. The effect of tree shade and grass on surface and globe temperatures in an urban area. Urban For. Urban Green. 2012, 11, 245–255. [Google Scholar] [CrossRef]
- Bowler, D.E.; Buyung-Ali, L.; Knight, T.M.; Pullin, A.S. Urban greening to cool towns and cities: A systematic review of the empirical evidence. Landsc. Urban Plan. 2010, 97, 147–155. [Google Scholar] [CrossRef]
- Chang, C.-R.; Li, M.-H. Effects of urban parks on the local urban thermal environment. Urban For. Urban Green. 2014, 13, 672–681. [Google Scholar] [CrossRef]
- Chen, A.; Yao, X.A.; Sun, R.; Chen, L. Effect of urban green patterns on surface urban cool islands and its seasonal variations. Urban For. Urban Green. 2014, 13, 646–654. [Google Scholar] [CrossRef]
- Connors, J.P.; Galletti, C.S.; Chow, W.T.L. Landscape configuration and urban heat island effects: Assessing the relationship between landscape characteristics and land surface temperature in Phoenix, Arizona. Landsc. Ecol. 2013, 28, 271–283. [Google Scholar] [CrossRef]
- Feyisa, G.L.; Dons, K.; Meilby, H. Efficiency of parks in mitigating urban heat island effect: An example from Addis Ababa. Landsc. Urban Plan. 2014, 123, 87–95. [Google Scholar] [CrossRef]
- Gill, S.; Handley, J.; Ennos, A.; Pauleit, S. Adapting Cities for Climate Change: The Role of the Green Infrastructure. Built Environ. 2007, 33, 115–133. [Google Scholar] [CrossRef]
- Park, J.-H.; Cho, G.-H. Examining the Association between Physical Characteristics of Green Space and Land Surface Temperature: A Case Study of Ulsan, Korea. Sustainability 2016, 8, 777. [Google Scholar] [CrossRef]
- Shih, W. Greenspace patterns and the mitigation of land surface temperature in Taipei metropolis. Habitat Int. 2017, 60, 69–80. [Google Scholar] [CrossRef]
- Hanamean, J.R., Jr.; Pielke, R.A., Sr.; Castro, C.L.; Ojima, D.S.; Reed, B.C.; Gao, Z. Vegetation greenness impacts on maximum and minimum temperatures in northeast Colorado. Meteorol. Appl. 2003, 10, 203–215. [Google Scholar] [CrossRef]
- Chen, Y.-C.; Tan, C.-H.; Wei, C.; Su, Z.-W. Cooling Effect of Rivers on Metropolitan Taipei Using Remote Sensing. Int. J. Environ. Res. Public Health 2014, 11, 1195–1210. [Google Scholar] [CrossRef] [PubMed]
- Hathway, E.A.; Sharples, S. The interaction of rivers and urban form in mitigating the Urban Heat Island effect: A UK case study. Build. Environ. 2012, 58, 14–22. [Google Scholar] [CrossRef]
- Steeneveld, G.J.; Koopmans, S.; Heusinkveld, B.G.; Theeuwes, N.E. Refreshing the role of open water surfaces on mitigating the maximum urban heat island effect. Landsc. Urban Plan. 2014, 121, 92–96. [Google Scholar] [CrossRef]
- Sun, R.; Chen, L. How can urban water bodies be designed for climate adaptation? Landsc. Urban Plan. 2012, 105, 27–33. [Google Scholar] [CrossRef]
- Han, S.-G.; Huh, J.-H. Estimate of the Heat Island and Building Cooling Load Changes due to the Restored Stream in Seoul, Korea. Int. J. Urban Sci. 2008, 12, 129–145. [Google Scholar] [CrossRef]
- Xiao, R.; Ouyang, Z.; Zheng, H.; Li, W.; Schienke, E.W.; Wang, X. Spatial pattern of impervious surfaces and their impacts on land surface temperature in Beijing, China. J. Environ. Sci. 2007, 19, 250–256. [Google Scholar] [CrossRef]
- Yuan, F.; Bauer, M.E. Comparison of impervious surface area and normalized difference vegetation index as indicators of surface urban heat island effects in Landsat imagery. Remote Sens. Environ. 2007, 106, 375–386. [Google Scholar] [CrossRef]
- Gallo, K.; Xian, G. Application of spatially gridded temperature and land cover data sets for urban heat island analysis. Urban Clim. 2014, 8, 1–10. [Google Scholar] [CrossRef]
- Gallo, K.; Xian, G. Changes in satellite-derived impervious surface area at US historical climatology network stations. ISPRS J. Photogramm. Remote Sens. 2016, 120, 77–83. [Google Scholar] [CrossRef]
- Amiri, R.; Weng, Q.; Alimohammadi, A.; Alavipanah, S.K. Spatial—Temporal dynamics of land surface temperature in relation to fractional vegetation cover and land use/cover in the Tabriz urban area, Iran. Remote Sens. Environ. 2009, 113, 2606–2617. [Google Scholar] [CrossRef]
- Buyantuyev, A.; Wu, J. Urban heat islands and landscape heterogeneity: Linking spatiotemporal variations in surface temperatures to land-cover and socioeconomic patterns. Landsc. Ecol. 2010, 25, 17–33. [Google Scholar] [CrossRef]
- Stathopoulou, M.; Cartalis, C. Daytime urban heat islands from Landsat ETM+ and Corine land cover data: An application to major cities in Greece. Sol. Energy 2007, 81, 358–368. [Google Scholar] [CrossRef]
- Svensson, M.K.; Eliasson, I. Diurnal air temperatures in built-up areas in relation to urban planning. Landsc. Urban Plan. 2002, 61, 37–54. [Google Scholar] [CrossRef]
- Viegas, C.V.; Saldanha, D.L.; Bond, A.; Ribeiro, J.L. D.; Selig, P.M. Urban land planning: The role of a Master Plan in influencing local temperatures. Cities 2013, 35, 1–13. [Google Scholar] [CrossRef]
- Weng, Q.; Lu, D.; Schubring, J. Estimation of land surface temperature—Vegetation abundance relationship for urban heat island studies. Remote Sens. Environ. 2004, 89, 467–483. [Google Scholar] [CrossRef]
- Hart, M.A.; Sailor, D.J. Quantifying the influence of land-use and surface characteristics on spatial variability in the urban heat island. Theor. Appl. Climatol. 2009, 95, 397–406. [Google Scholar] [CrossRef]
- Jusuf, S.K.; Wong, N.H.; Hagen, E.; Anggoro, R.; Hong, Y. The influence of land use on the urban heat island in Singapore. Habitat Int. 2007, 31, 232–242. [Google Scholar] [CrossRef]
- Rinner, C.; Hussain, M. Toronto’s Urban Heat Island—Exploring the Relationship between Land Use and Surface Temperature. Remote Sens. 2011, 3, 1251–1265. [Google Scholar] [CrossRef]
- Santamouris, M. On the energy impact of urban heat island and global warming on buildings. Energy Build. 2014, 82, 100–113. [Google Scholar] [CrossRef]
- Steeneveld, G.J.; Koopmans, S.; Heusinkveld, B.G.; van Hove, L.W.A.; Holtslag, A.A.M. Quantifying urban heat island effects and human comfort for cities of variable size and urban morphology in the Netherlands. J. Geophys. Res. Atmos. 2011, 116, D20129. [Google Scholar] [CrossRef]
- Szymanowski, M. Interactions between thermal advection in frontal zones and the urban heat island of Wrocław, Poland. Theor. Appl. Climatol. 2005, 82, 207–224. [Google Scholar] [CrossRef]
- Busato, F.; Lazzarin, R.M.; Noro, M. Three years of study of the Urban Heat Island in Padua: Experimental results. Sustain. Cities Soc. 2014, 10, 251–258. [Google Scholar] [CrossRef]
- Wong, N.H.; Yu, C. Study of green areas and urban heat island in a tropical city. Habitat Int. 2005, 29, 547–558. [Google Scholar] [CrossRef]
- Seoul Metropolitan Government. Atmospheric Environment Conditions of Seoul; Seoul Metropolitan Government: Seoul, Korea, 2017.
- Intergovernmental Panel on Climate Change (IPCC). Climate Change 2013: The Physical Science Basis; Cambridge University Press: New York, NY, USA, 2013. [Google Scholar]
- Korea Meteorological Administration. Climate Change Projection Report—Seoul, Incheon, and Gyeonggi; Korea Meteorological Administration: Seoul, Korea, 2012.
- Kim, Y.-H.; Baik, J.-J. Daily maximum urban heat island intensity in large cities of Korea. Theor. Appl. Climatol. 2004, 79, 151–164. [Google Scholar] [CrossRef]
- Kim, Y.-H.; Baik, J.-J. Spatial and Temporal Structure of the Urban Heat Island in Seoul. J. Appl. Meteorol. 2005, 44, 591–605. [Google Scholar] [CrossRef]
- Kim, Y.-H.; Baik, J.-J. Maximum Urban Heat Island Intensity in Seoul. J. Appl. Meteorol. 2002, 41, 651–659. [Google Scholar] [CrossRef]
- Lee, S.-H.; Baik, J.-J. Statistical and dynamical characteristics of the urban heat island intensity in Seoul. Theor. Appl. Climatol. 2010, 100, 227–237. [Google Scholar] [CrossRef]
- Cha, Y.-H.; Kim, H.-Y.; Heo, T.-Y. The Effects of Urban Land Use and Land Cover Characteristics on Air Temperature in Seoul Metropolitan Area. Seoul City Res. 2009, 10, 107–120. [Google Scholar]
- Pielke, R., Sr.; Nielsen-Gammon, J.; Davey, C.; Angel, J.; Bliss, O.; Doesken, N.; Cai, M.; Fall, S.; Niyogi, D.; Gallo, K.; et al. Documentation of Uncertainties and Biases Associated with Surface Temperature Measurement Sites for Climate Change Assessment. Bull. Am. Meteorol. Soc. 2007, 88, 913–928. [Google Scholar] [CrossRef]
- Fall, S.; Watts, A.; Nielsen-Gammon, J.; Jones, E.; Niyogi, D.; Christy, J.R.; Pielke, R.A. Analysis of the impacts of station exposure on the U.S. Historical Climatology Network temperatures and temperature trends. J. Geophys. Res. 2011, 116, D14120. [Google Scholar] [CrossRef]
- Korea Meteorological Administration. Guidelines for Surface Meteorological Observation; Korea Meteorological Administration: Seoul, Korea, 2011.
- Kim, Y.; Guldmann, J.-M. Land-use regression panel models of NO2 concentrations in Seoul, Korea. Atmos. Environ. 2015, 107, 364–373. [Google Scholar] [CrossRef]
- Ross, Z.; Jerrett, M.; Ito, K.; Tempalski, B.; Thurston, G.D. A land use regression for predicting fine particulate matter concentrations in the New York City region. Atmos. Environ. 2007, 41, 2255–2269. [Google Scholar] [CrossRef]
- Mallick, J.; Singh, C.K.; Shashtri, S.; Rahman, A.; Mukherjee, S. Land surface emissivity retrieval based on moisture index from LANDSAT TM satellite data over heterogeneous surfaces of Delhi city. Int. J. Appl. Earth Obs. Geoinf. 2012, 19, 348–358. [Google Scholar] [CrossRef]
- Onishi, A.; Cao, X.; Ito, T.; Shi, F.; Imura, H. Evaluating the potential for urban heat-island mitigation by greening parking lots. Urban For. Urban Green. 2010, 9, 323–332. [Google Scholar] [CrossRef]
- Xiao, H.; Ji, W. Relating landscape characteristics to non-point source pollution in mine waste-located watersheds using geospatial techniques. J. Environ. Manag. 2007, 82, 111–119. [Google Scholar] [CrossRef] [PubMed]
- Sampson, P.D.; Richards, M.; Szpiro, A.A.; Bergen, S.; Sheppard, L.; Larson, T.V.; Kaufman, J.D. A regionalized national universal kriging model using Partial Least Squares regression for estimating annual PM2.5 concentrations in epidemiology. Atmos. Environ. 2013, 75, 383–392. [Google Scholar] [CrossRef] [PubMed]
- Woldesenbet, T.A.; Elagib, N.A.; Ribbe, L.; Heinrich, J. Hydrological responses to land use/cover changes in the source region of the Upper Blue Nile Basin, Ethiopia. Sci. Total Environ. 2017, 575, 724–741. [Google Scholar] [CrossRef] [PubMed]
- Yan, B.; Fang, N.F.; Zhang, P.C.; Shi, Z.H. Impacts of land use change on watershed streamflow and sediment yield: An assessment using hydrologic modelling and partial least squares regression. J. Hydrol. 2013, 484, 26–37. [Google Scholar] [CrossRef]
- Abdi, H. Partial least square regression (PLS regression). In Encyclopedia for Research Methods for the Social Sciences; SAGE Publications, Inc.: Thousand Oaks, CA, USA, 2003; pp. 792–805. [Google Scholar]
- Liu, H.-L.; Shen, Y.-S. The Impact of Green Space Changes on Air Pollution and Microclimates: A Case Study of the Taipei Metropolitan Area. Sustainability 2014, 6, 8827–8855. [Google Scholar] [CrossRef]
- Zhao, J.; Deng, W.; Song, Y. Ridership and effectiveness of bikesharing: The effects of urban features and system characteristics on daily use and turnover rate of public bikes in China. Transp. Policy 2014, 35, 253–264. [Google Scholar] [CrossRef]
- Wold, S. Exponentially weighted moving principal components analysis and projections to latent structures. Chemom. Intell. Lab. Syst. 1994, 23, 149–161. [Google Scholar] [CrossRef]


| Classification | Land Use Types | Summary Statistics | Reference Station (#108) | ||
|---|---|---|---|---|---|
| Min. | Max. | Mean. | |||
| Classification I | Residential (RE) | 0.0% | 64.2% | 34.3% | 50.4% |
| Commercial (CO) | 0.0% | 15.1% | 3.2% | 7.7% | |
| Civic (CI) | 0.1% | 56.5% | 7.1% | 8.8% | |
| Industrial (IN) | 0.0% | 24.6% | 2.9% | 0.0% | |
| Open Space (OS) | 2.7% | 93.7% | 31.2% | 12.9% | |
| Road (RO) | 0.2% | 27.5% | 15.0% | 20.1% | |
| Water (WA) | 0.0% | 51.9% | 6.3% | 0.0% | |
| Classification II (Permissible floor area ratio 1 and lot coverage ratio 2) | Low-density residential (RL) (1.5 and 0.5) | 0.0% | 20.5% | 4.8% | 11.6% |
| Medium-density residential (RM) (2.0 and 0.6) | 0.0% | 41.1% | 15.2% | 18.6% | |
| High-density residential (RH) (4.0 and 0.6) | 0.0% | 35.7% | 14.3% | 20.2% | |
| Neighborhood commercial (CN) (6.0 and 0.6) | 0.0% | 1.5% | 0.2% | 0.0% | |
| Central commercial (CC) (10.0 and 0.6) | 0.0% | 15.1% | 3.0% | 7.7% | |
| Civic (CI) 3 | 0.1% | 56.5% | 7.1% | 8.8% | |
| Industrial (IN) (4.0 and 0.6) | 0.0% | 24.6% | 2.9% | 0.0% | |
| Park (PA) (0.5 and 0.2) | 0.0% | 52.8% | 7.2% | 4.8% | |
| Greenery (GR) (0.5 and 0.2) | 0.0% | 93.6% | 24.1% | 8.2% | |
| Road (RO) | 0.2% | 27.5% | 15.0% | 20.1% | |
| Water (WA) | 0.0% | 51.9% | 6.3% | 0.0% | |
| Land Use | RE | CO | CI | IN | OS | RO | WA |
|---|---|---|---|---|---|---|---|
| RE | 1 | ||||||
| CO | 0.181 | 1 | |||||
| CI | −0.175 | −0.178 | 1 | ||||
| IN | −0.025 | 0.347 | −0.161 | 1 | |||
| OS | −0.710 ** | −0.501 ** | −0.034 | −0.278 | 1 | ||
| RO | 0.703 ** | 0.497 ** | −0.353 | 0.358 | −0.797 ** | 1 | |
| WA | −0.279 | 0.129 | −0.186 | −0.087 | −0.228 | 0.007 | 1 |
| Land Use | RL | RM | RH | CN | CC | CI | IN | PA | GR | RO | WA |
|---|---|---|---|---|---|---|---|---|---|---|---|
| RL | 1 | ||||||||||
| RM | −0.076 | 1 | |||||||||
| RH | −0.317 | 0.334 | 1 | ||||||||
| CN | 0.022 | 0.386 * | 0.067 | 1 | |||||||
| CC | −0.300 | −0.130 | 0.555 ** | −0.221 | 1 | ||||||
| CI | 0.084 | −0.148 | −0.174 | 0.000 | −0.176 | 1 | |||||
| IN | −0.197 | 0.086 | −0.037 | 0.331 | 0.310 | −0.161 | 1 | ||||
| PA | 0.423 * | −0.029 | −0.068 | 0.005 | −0.070 | −0.155 | −0.143 | 1 | |||
| GR | 0.045 | −0.535 ** | −0.576 ** | −0.259 | −0.399 * | 0.035 | −0.194 | −0.396 * | 1 | ||
| RO | −0.252 | 0.530 ** | 0.725 ** | 0.307 | 0.460 * | −0.353 | 0.358 | 0.111 | −0.780 ** | 1 | |
| WA | −0.323 | −0.174 | -0.109 | −0.161 | 0.142 | −0.186 | −0.087 | −0.003 | −0.208 | 0.007 | 1 |
| Spring | Summer | Fall | Winter | |||||||||||||
|---|---|---|---|---|---|---|---|---|---|---|---|---|---|---|---|---|
| Day | VIP | Night | VIP | Day | VIP | Night | VIP | Day | VIP | Night | VIP | Day | VIP | Night | VIP | |
| Land Use Coefficient | ||||||||||||||||
| RE | 0.006 †† | 1.129 | 0.012 †† | 1.063 | 0.006 †† | 1.091 | 0.010 † | 0.976 | 0.004 † | 0.836 | 0.010 † | 0.829 | 0.004 † | 0.877 | 0.011 † | 0.961 |
| CO | 0.019 † | 0.847 | 0.055 †† | 1.055 | 0.025 †† | 1.027 | 0.051 †† | 1.103 | 0.028 †† | 1.169 | 0.067 †† | 1.234 | 0.022 † | 0.996 | 0.052 †† | 1.075 |
| CI | −0.002 | 0.240 | −0.006 | 0.325 | −0.003 | 0.272 | −0.007 | 0.399 | −0.001 | 0.100 | −0.007 | 0.358 | 0.000 | 0.031 | −0.005 | 0.266 |
| IN | −0.001 | 0.043 | 0.012 | 0.382 | 0.002 | 0.132 | 0.014 | 0.492 | 0.007 | 0.462 | 0.021 | 0.614 | 0.006 | 0.387 | 0.015 | 0.494 |
| OS | −0.005 †† | 1.471 | −0.012 †† | 1.508 | −0.006 †† | 1.487 | −0.011 †† | 1.482 | −0.006 †† | 1.523 | −0.013 †† | 1.484 | −0.006 †† | 1.544 | −0.012 †† | 1.533 |
| RO | 0.021 †† | 1.618 | 0.043 †† | 1.416 | 0.022 †† | 1.504 | 0.038 †† | 1.390 | 0.020 †† | 1.448 | 0.040 †† | 1.266 | 0.021 †† | 1.567 | 0.040 †† | 1.390 |
| WA | 0.003 | 0.408 | 0.008 | 0.476 | 0.003 | 0.436 | 0.008 | 0.549 | 0.004 | 0.544 | 0.012 | 0.693 | 0.004 | 0.499 | 0.009 | 0.570 |
| Goodness-of-fit Statistics | ||||||||||||||||
| R2 | 0.405 | 0.721 | 0.477 | 0.790 | 0.392 | 0.669 | 0.357 | 0.670 | ||||||||
| Q2 | 0.259 | 0.679 | 0.342 | 0.755 | 0.260 | 0.621 | 0.223 | 0.614 | ||||||||
| Spring | Summer | Fall | Winter | |||||||||||||
|---|---|---|---|---|---|---|---|---|---|---|---|---|---|---|---|---|
| Day | VIP | Night | VIP | Day | VIP | Night | VIP | Day | VIP | Night | VIP | Day | VIP | Night | VIP | |
| Land Use Coefficient | ||||||||||||||||
| RL | −0.012 † | 0.909 | −0.020 | 0.685 | −0.011 † | 0.807 | −0.019 | 0.747 | −0.016 †† | 1.162 | −0.017 | 0.578 | −0.016 †† | 1.173 | −0.018 | 0.672 |
| RM | 0.005 | 0.774 | 0.010 | 0.761 | 0.005 | 0.748 | 0.009 | 0.722 | 0.003 | 0.530 | 0.008 | 0.589 | 0.004 | 0.568 | 0.009 | 0.715 |
| RH | 0.011 †† | 1.723 | 0.024 †† | 1.605 | 0.012 †† | 1.695 | 0.020 †† | 1.516 | 0.011 †† | 1.570 | 0.020 †† | 1.330 | 0.011 †† | 1.577 | 0.020 †† | 1.460 |
| CN | 0.061 | 0.337 | 0.202 | 0.495 | 0.045 | 0.227 | 0.164 | 0.448 | 0.044 | 0.219 | 0.147 | 0.353 | 0.097 | 0.499 | 0.184 | 0.487 |
| CC | 0.015 † | 0.894 | 0.045 †† | 1.168 | 0.021 †† | 1.137 | 0.042 †† | 1.231 | 0.023 †† | 1.251 | 0.056 †† | 1.430 | 0.018 †† | 1.014 | 0.043 †† | 1.199 |
| CI | −0.002 | 0.267 | −0.006 | 0.381 | −0.002 | 0.312 | −0.006 | 0.469 | −0.001 | 0.110 | −0.007 | 0.432 | 0.000 | 0.033 | −0.004 | 0.313 |
| IN | −0.001 | 0.048 | 0.011 | 0.447 | 0.002 | 0.152 | 0.013 | 0.578 | 0.006 | 0.511 | 0.019 | 0.741 | 0.005 | 0.419 | 0.013 | 0.582 |
| PA | 0.000 | 0.057 | −0.003 | 0.234 | −0.001 | 0.201 | −0.003 | 0.271 | −0.002 | 0.327 | −0.001 | 0.072 | −0.001 | 0.145 | −0.001 | 0.065 |
| GR | −0.004 †† | 1.477 | −0.009 †† | 1.521 | −0.004 †† | 1.480 | −0.008 †† | 1.482 | −0.004 †† | 1.408 | −0.009 †† | 1.614 | −0.004 †† | 1.474 | −0.009 †† | 1.631 |
| RO | 0.018 †† | 1.798 | 0.038 †† | 1.657 | 0.019 †† | 1.725 | 0.033 †† | 1.632 | 0.018 †† | 1.602 | 0.036 †† | 1.527 | 0.018 †† | 1.696 | 0.035 †† | 1.637 |
| WA | 0.002 | 0.453 | 0.007 | 0.557 | 0.003 | 0.499 | 0.007 | 0.645 | 0.004 | 0.602 | 0.011 † | 0.836 | 0.003 | 0.540 | 0.008 | 0.672 |
| Goodness-of-fit Statistics | ||||||||||||||||
| R2 | 0.451 | 0.730 | 0.503 | 0.795 | 0.450 | 0.637 | 0.424 | 0.665 | ||||||||
| Q2 | 0.266 | 0.663 | 0.349 | 0.737 | 0.253 | 0.567 | 0.213 | 0.591 | ||||||||
© 2017 by the authors. Licensee MDPI, Basel, Switzerland. This article is an open access article distributed under the terms and conditions of the Creative Commons Attribution (CC BY) license (http://creativecommons.org/licenses/by/4.0/).
Share and Cite
Kim, H.; Kim, S.-N. The Seasonal and Diurnal Influence of Surrounding Land Use on Temperature: Findings from Seoul, South Korea. Sustainability 2017, 9, 1443. https://doi.org/10.3390/su9081443
Kim H, Kim S-N. The Seasonal and Diurnal Influence of Surrounding Land Use on Temperature: Findings from Seoul, South Korea. Sustainability. 2017; 9(8):1443. https://doi.org/10.3390/su9081443
Chicago/Turabian StyleKim, Hyungkyoo, and Seung-Nam Kim. 2017. "The Seasonal and Diurnal Influence of Surrounding Land Use on Temperature: Findings from Seoul, South Korea" Sustainability 9, no. 8: 1443. https://doi.org/10.3390/su9081443
APA StyleKim, H., & Kim, S.-N. (2017). The Seasonal and Diurnal Influence of Surrounding Land Use on Temperature: Findings from Seoul, South Korea. Sustainability, 9(8), 1443. https://doi.org/10.3390/su9081443