Article

An Improved Hybrid Grey Relational Analysis Approach for Green Resilient Supply Chain Network Assessment

by
Amirmahdi Malek
1,
Sadoullah Ebrahimnejad
2,* and
Reza Tavakkoli-Moghaddam
3
1
Department of Industrial Engineering, Science and Research Branch, Islamic Azad University, 14778–93855 Tehran, Iran
2
Department of Industrial Engineering, Karaj Branch, Ismalic Azad University, 31486–35731 Karaj, Iran
3
School of Industrial Engineering, College of Engineering, University of Tehran, 14399–57131 Tehran, Iran
*
Author to whom correspondence should be addressed.
Sustainability 2017, 9(8), 1433; https://doi.org/10.3390/su9081433
Submission received: 21 May 2017 / Revised: 28 July 2017 / Accepted: 8 August 2017 / Published: 17 August 2017
(This article belongs to the Section Economic and Business Aspects of Sustainability)

Abstract

:
In the growing and turbulent market of the current world both in national and in international relations, the need for reviewing and assessment of the resiliency of suppliers as one of the new concepts in supply chain management has been prioritized. In addition, globalization, increasing the regulations of governmental and non-governmental organizations, customers’ request and pressure regarding environmental issues has led organizations to evaluate the measures necessary to implement green supply chain management, to improve their environmental and economic performance. The subject of selecting and evaluating suppliers on green supply chain with resilience capability first requires the identification of the supplier evaluation criteria so that it considers the resiliency of the supply chain concurrent with the concepts of green supply chain. Secondly, right tools should be used for the decision. Considering all the criteria and indicators in conditions of uncertainty encourages the development and application of methods, such as fuzzy theory and grey systems theory. In this research, a comprehensive model for evaluating green resilience supply chain network is provided. In order to apply both quantitative and qualitative criteria, the possibility of making the target based criteria dimensionless along the cost or benefit criteria, the use of experts’ opinions in the allocation of weights to the criteria and indicators using grey numbers, grey relational analysis are developed and improved. In the end, the implementation of the proposed model is explained step by step in a case study and the future conclusions and recommendations are suggested.

1. Introduction

Risk factors (e.g., pollution, global warming, and increasing amount of greenhouse gases) can lead to the extinction of the human race. Therefore, environmental protection and related strategies became the priority of programs as a major organizational innovation. The organization had to consider profitability and competitive advantage on one side and eliminating or minimizing the losses (energy, greenhouse, chemical/hazardous gases and solid waste) on the other hand.
The customer always wants the best, the cheapest and fastest products. This causes environmental pollution and producing products and processes, which were not in harmony with the environment. In this regard, the organizations found their survival in three areas of responsibility in economic, social and environmental fields. Green attitude in organizations and organizational structures as a green guarantee has replaced with the organizational units such as quality assurance. Green supply chain is the process of considering criteria or environmental considerations throughout the supply chain.
Factors (e.g., fluctuations in demand, political issues, technological change, financial instability, and natural disasters) increase the risks of uncertainty and risk in the supply chain. Management of such risks is necessary to reduce the vulnerability of the supply chain.
Evaluation of flexible suppliers in the green supply chain, which is considered to be the main subject of this research, first, requires identifying the criteria for evaluating network suppliers so that it considers the elasticity of supply chain coincided with the environmental and green criteria. Secondly, right tool should be used for the decision. A review of the literature shows that Multi-criteria decision-making tools for the evaluation and selection of flexible supplier in the green supply chain are not used. However, there is always uncertainty on the vulnerability of the supply chain and the elasticity of suppliers and observing the standards and requirements of the green supply chain [1].
Pressure from government regulations to obtain environmental standards on the one hand and the increasing demand of customers for the supply of green products (without harmful effects on the environment) on the other made the concept of green supply chain and its management sustainable. Today, the green supply chain managers in leading companies try through the creation of environmental utility and satisfaction throughout the supply chain to benefit green logistics and improved environmental performance in the green supply chain as a strategic weapon to gain sustainable competitive advantages [2]. A new approach has emerged to achieve the target of companies to gain market share by reducing the risk and impact on the environment. The idea of green supply chain management is to eliminate or minimize losses (energy, greenhouse, chemical/hazardous gases and solid waste) along the supply chain. Environmental issues under the Act and guidelines for customers especially in the US, Europe, and Japan have become an important concern for producers. As a major innovation, GSCM helps organizations to develop strategies to achieve the common goals of profits and market by reducing environmental risks and increasing the environmental efficiency.
According to variety, volume, quantity of parts and products of case study and with layered and networking structure of suppliers and technical requirements and environmental regulations, this research try to present a suitable assessment model for ranking and removing weak suppliers.
The reminder of the paper is organized as follow: Section 2 reviews the literature on GRSCM, green and resilient supplier selection criteria, evaluation methods and theory of grey systems. In Section 3 while designing a model for evaluating, ranking and selecting suppliers in supply chain with resilience and green capability using grey relational analysis (as one of the new methods in the face of uncertainty) intends to introduce a tool with Multiple Attribute Decision Making under uncertainty to discuss the quantitative and qualitative indicators in the model as introduced and explain mathematical equations step by step. Section 4 presents a case study of the heavy and semi-heavy automotive industry and in Section 5 a sensitivity analysis with different scenarios performed is presented, and the results are compared. The results of improved hybrid grey relational grade of suppliers’ network of the company presented in Section 6 and conclusion and recommendations for future studies are presented in Section 7.

2. Review of Literature

In recent studies, various methods are used to make decision on the assessment and selection of supplier. A combination of AHP methods with mathematical programming proposed by [3,4]. Also Yang and Chen [5] used a combination of AHP with grey theory and a combination of ANP and multi-objective mathematical programming applied by [6]. The score based and fuzzy expert system for supplier selection used by [7]. A combination of the fuzzy theory and decision making methods is also applied by [8,9,10]. Li et al. [11] use the GRA and Golmohammadi and Mellat-Parast [12] apply the combination of grey theory and decision making methods. The grey system theory to select the supplier in the supply chain with resilience used by [13]. Fuzzy TOPSIS for evaluating suppliers in the automotive industry proposed by [14].

2.1. Evaluation and Selection of Suppliers

The literature review shows that the criteria of quality, cost and flexibility are the most important primary factors in the supplier selection problem [3,15,16,17]. Clearly providing quality products at affordable prices and with the necessary flexibility to meet the various demands have higher priority in selection. Flexibility is the capability of the supplier to manage losing connection and respond to changes in demand which is reinforced by high redundancy, adaptation and standardizing the processes [1,18,19,20,21].
In addition, Pack [22] and Christopher [18] believe that the supplier must be so strong that he can deal with changes in demand. By searching through flexible supply chain concepts it is clear that the supplier must have the least vulnerability with full awareness of the risks and enjoy the appropriate procedures and guidelines for integrated management of the supply chain [23,24]. Also it is better that the suppliers have a research and development (R&D) unit or technical office so that while ensuring a good level of technical support they could prepare guidelines and proper procedures in the areas of construction, safety and maintenance and keep the supplied in the competitive market [25,26,27].
The supplier should be able to be available in the company in the least time while he should enjoy a high speed which means that he should reduce the demand to delivery time and moreover he should act fast in receiving and meeting demand in spite of the rapid changes [18].
Transparency means whether the supplier has sufficient evidence and transparency regarding the upstream and downstream investments, demand and supply conditions and his sales and production. Transparency is directly related to the supplier. Transmission of information increases supplier’s transparency in both upstream and downstream levels [22].
Suppliers must be the least vulnerable to loss of connection. They should cooperate with the company and be aware of the possible risks and threats and consider the required measures for the effective management and potential risk reduction.
Interactive cooperation with suppliers reduces anticipated risk and leads to better management of the capital. A great part of loss of connections between the supplier and the company can be reduced by increasing the level of participation [23].
Tools (e.g., supply chain planning, supply chain activities, supply chain change management) must be well established among suppliers to reduce potential threats [28]. Knowledge of financial, processes, structural and environmental risks increases the supplier’s power to confront and mitigate risks. Integrated supply chain management is another important factor in choosing suppliers. Development of risk management culture is essential to strengthen resilience. Risk assessment as a decision-making approach should be established at all levels of the organization as one of the integrated supply chain management processes [28].
Supplier must be strong in technical capabilities. It is better that suppliers have the technical offices or R&D units to provide technical opinions on all levels well. Technological power of supplier must be strong enough to be compatible with new technologies. New technologies are applied in order to maintain the quality standards and risk reduction [25]. Research and development activities help the supplier to produce quality products in the market turbulence [29].
The supplier should prioritize the green activities and keep safety and the environment in mind at all stages to survive in a competitive market. Attention to the environment means the necessity to have environment system certificates, such as ISO 14001, registry and implementation of all preventive and corrective activities in areas (e.g., the use of PPE (Personal Protective Equipment) and risk monitoring and evaluation [30]).
In recent years, organizations have paid more attention to green issues in the supply chain and have taken serious steps to reduce hazards and environmental pollution [26,27]. Implementation of preventive programs is one of the suppliers’ most important steps to achieve and realize green supply chain strategies [31]. A summary of the recent major studies in decision-making and supplier evaluation and selection is presented in Table 1.

2.2. The Resilience of Supply Chain

Since 2005, the resilience in the supply chain that was discussed by Sheffi in various studies are conducted in this regard. The interruption of supply chain and its effects (e.g., reduced income, increased costs, damage to reputation and loss of customers and market share) studied by [41]. Ponomarov and Holcomb [1] studied the relationship between logistics capabilities and resilience of supply chain. The capabilities in the supply chain that can reduce the negative impact of interrupts and how to manage risk tested by [42]. Suppliers’ role in the creation of resilience in the supply chain is discussed by [28]. They stressed the need to establish collaborative relationships with suppliers. Peck [22] showed that high levels of collaboration with suppliers can increase the resilience of supply chain. Moore and Manring [43] stressed that issues related to environment and sustainable development can affect the supply chain’s resilience. Some related studies are presented in Table 2.

2.3. Green Supply Chain Management

Green supply chain management from the perspective of product life cycle includes all stages of raw materials, product design and manufacture, product sales and transportation, product use and recycling of the product. Using supply chain management and green technology the companies can reduce environmental impacts and achieve optimal use of resources and energy.
Hsu and Hu [52] introduced 19 environmental criteria and classified these criteria into five groups. They considered five groups of purchasing management, R&D management, process management, quality control of incoming materials and systems management and then, using ANP they chose the suppliers.
Tseng and Chiu [53] selected 18 criteria the most important of which include environmental criteria, environmental management system, profitability of supplier and the closeness of the relations with the supplier and then used the fuzzy theory and to convert the linguistic criteria to definite numbers. Through the case study in the Taiwan PCB companies they sought to implement green supply chain management to select supplier. They studied environmental and non-environmental measures in case study; determined the development and criteria weight on the basis of two qualitative and quantitative factors and finally used the grey analysis to rank the suppliers.
Shaik and Abdul-Kader [54] used a framework of environmental standards, green measures and organizational criteria for supplier selection. They created a hierarchy for the evaluation of criteria and sub criteria for green suppliers, which lead to develop viable strategies by managers.
Ip et al. [55] proposed a comprehensive approach to model and assess supply chain performance. For this evaluation they considered six criteria of reliability, employee satisfaction, customer satisfaction, on time delivery, profitability, growth and performance.
Kotzab et al. [56] identified green supply chain indicators in the retail and classified the index in the eight classes of environmental management systems, energy use, attention to the input, products, packaging, transportation, usage and waste.
Large and Thomson [57] identified green supply chain management indices and proposed them under five components of green supplier management capabilities, green shopping, environmental commitments, environmental assessment of the suppliers and collaboration with suppliers.
Wang et al. [58] optimized the green supply chain by providing a multi-objective model. Considering factors (e.g., transport costs, the flow of products through the supply chain and investment in environmental protection) they developed their research model.
Govindan et al. [59] in the study of green supply chain literature proposed 10 main criteria derived from frequency of application in research and papers as the Table 3.
Nielsen et al. [60] stated a summary of the criteria used in selecting suppliers in the field of environmental and public criteria. In addition to the study of 57 articles in the field of green supply chain between 1996 and 2014 they compared the frequency of environmental criteria used in the selection of suppliers with [59] and expressed the results as Table 4.
Kuo [61] proposed an MCDM hybrid method to evaluate green suppliers in electronics. Based on the 4th edition of EICC (Electronic Industry Citizenship Coalition) they identified and defined 17 criteria in the field of environmental management systems.

2.4. Grey Systems Theory

The concept of grey theory introduced by Prof. Deng from the grey set in combination with systems theory, theory of space and control theory [62]. The methodology of grey system could well change the ambiguity in human decision into mathematical language [11,63,64,65,66,67]. Also grey theory can be successfully combined with other methods of decision-making and improve the quality of expert judgment [5,68,69].
One of the main advantages of the grey systems theory is that it can provide satisfactory results from small quantities of data and a lot of factors of variables. Grey theory has widely been used in making industrial and engineering decisions. Table 5 shows some of the most important applications of grey theory separately or in combination with other decision making methods.

Reviewing the Literature of Grey Relational Analysis and Comparison with the Proposed Model

One of the major advantages of grey relational analysis compared to other methods of calculating is that in the grey relational analysis there is no particular limitation in sample size and normally distributed data and its computational method is easy as well [93]. In most studies that have been conducted on grey relational analysis, the weight of the criteria is considered certain and the target based criterion does not exist in the problem or has a crisp value in case of existence [83]. Table 6 presents the gap of the study compared with previous studies.

3. Methodology

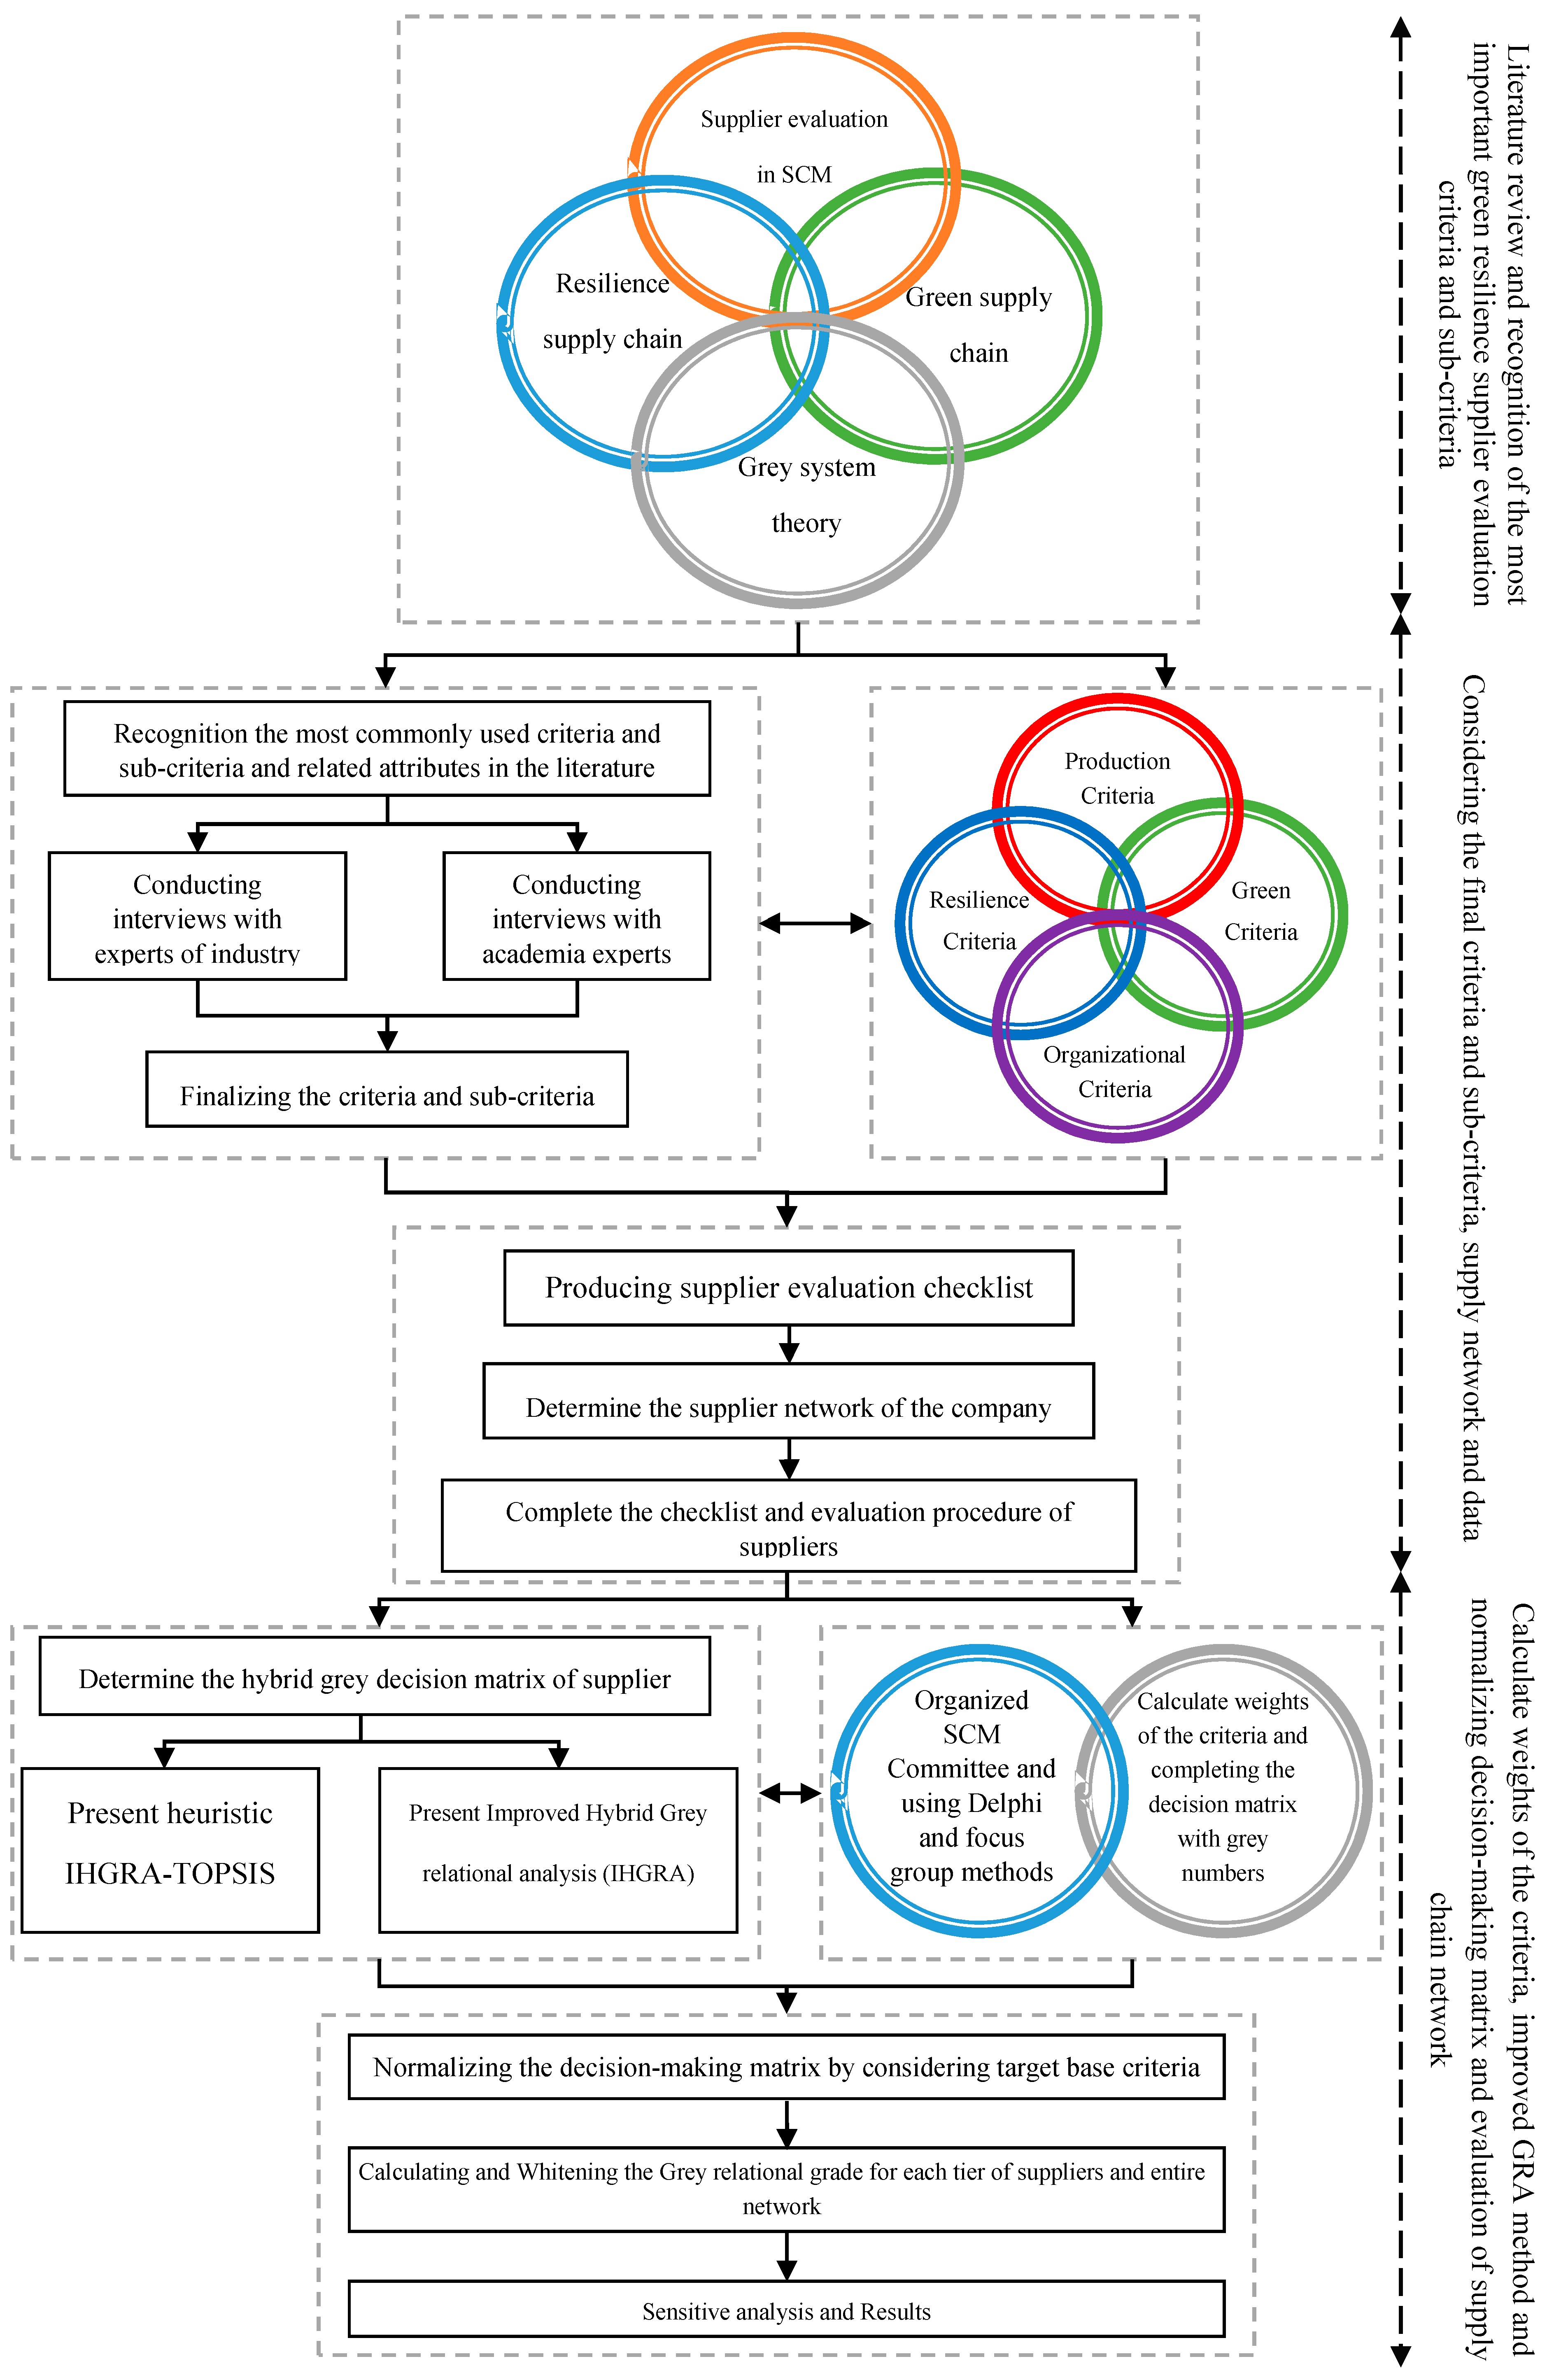
As mentioned in detail in the second part, several different sets of criteria and indicators are used for evaluating and ranking suppliers in the literature. The thing that this study is paying attention to is the evaluation of the supply network and the need to consider the second and third tiers of suppliers in terms of environment and resilience while this research does not look for supplier selection among the potential suppliers based on one type of product. Rather, as in the real world and based on the relationship between the companies and suppliers, all companies are looking to maintain and strengthen their key and value creator suppliers and creating a network of colleagues for a whole or partial ownership of stock is mostly considered by senior managers. Accordingly, it is necessary to evaluate the current network of suppliers to in addition to identify the strengths and weaknesses of the suppliers, measures are taken to strengthen their technical and management aspects. Of course, the purpose of evaluation is the careful examination of all technical and management aspects of a supplier in the supply network. The mere attention and traditional application of criteria and indicators to assess suppliers cannot be a useful indicator in senior managers’ decision-making anymore. On the other hand upstream principles, states’ policies and the international standards necessitate the companies to pay attention to green supply chain issues in in the field of safety and environment. However, adding green criteria cannot lead to a proper assessment anymore because the rapid changes in the domestic and foreign markets taken from the states’ expansion and contraction policies and implementing financial restrictions and sanctions threaten the suppliers. Prediction of these threats and planning to control and maintain the current situation of the company and even jump on it and reach to a higher level of technical capabilities are among the requirements of a resilient supply chain. For this purpose, more than a hundred indicators and criteria has been used and defined in the literature for evaluating suppliers in the green resilient supply chain. Unfortunately, some of the global resilient green supply chain indices are not controlled and monitored continuously in the country and manufacturing industry and it is necessary to use qualitative expert opinions in the evaluation. Therefore, there will be a combination of qualitative and quantitative indicators that it is necessary to design and use the appropriate methodology for decision-making. To deal with this uncertainty the fuzzy and grey systems theories have been more applied in the literature. In this research the grey systems theory and grey relational analysis is used as a basic methods to analyze and make effective decisions on the integrative indexes the proposed model is developed. Our flow chart of the proposed methodology is shown in Figure 1.

3.1. Evaluation of Green Resilience Supply Network Model

Accordingly among the examined criteria and indicators in this study a set of resilience evaluation criteria of the suppliers in the green supply chain was collected and in the next stage after obtaining the opinions of a number of specialists and experts from academia and industry, around 100 independent indices were proposed as the primary variables.
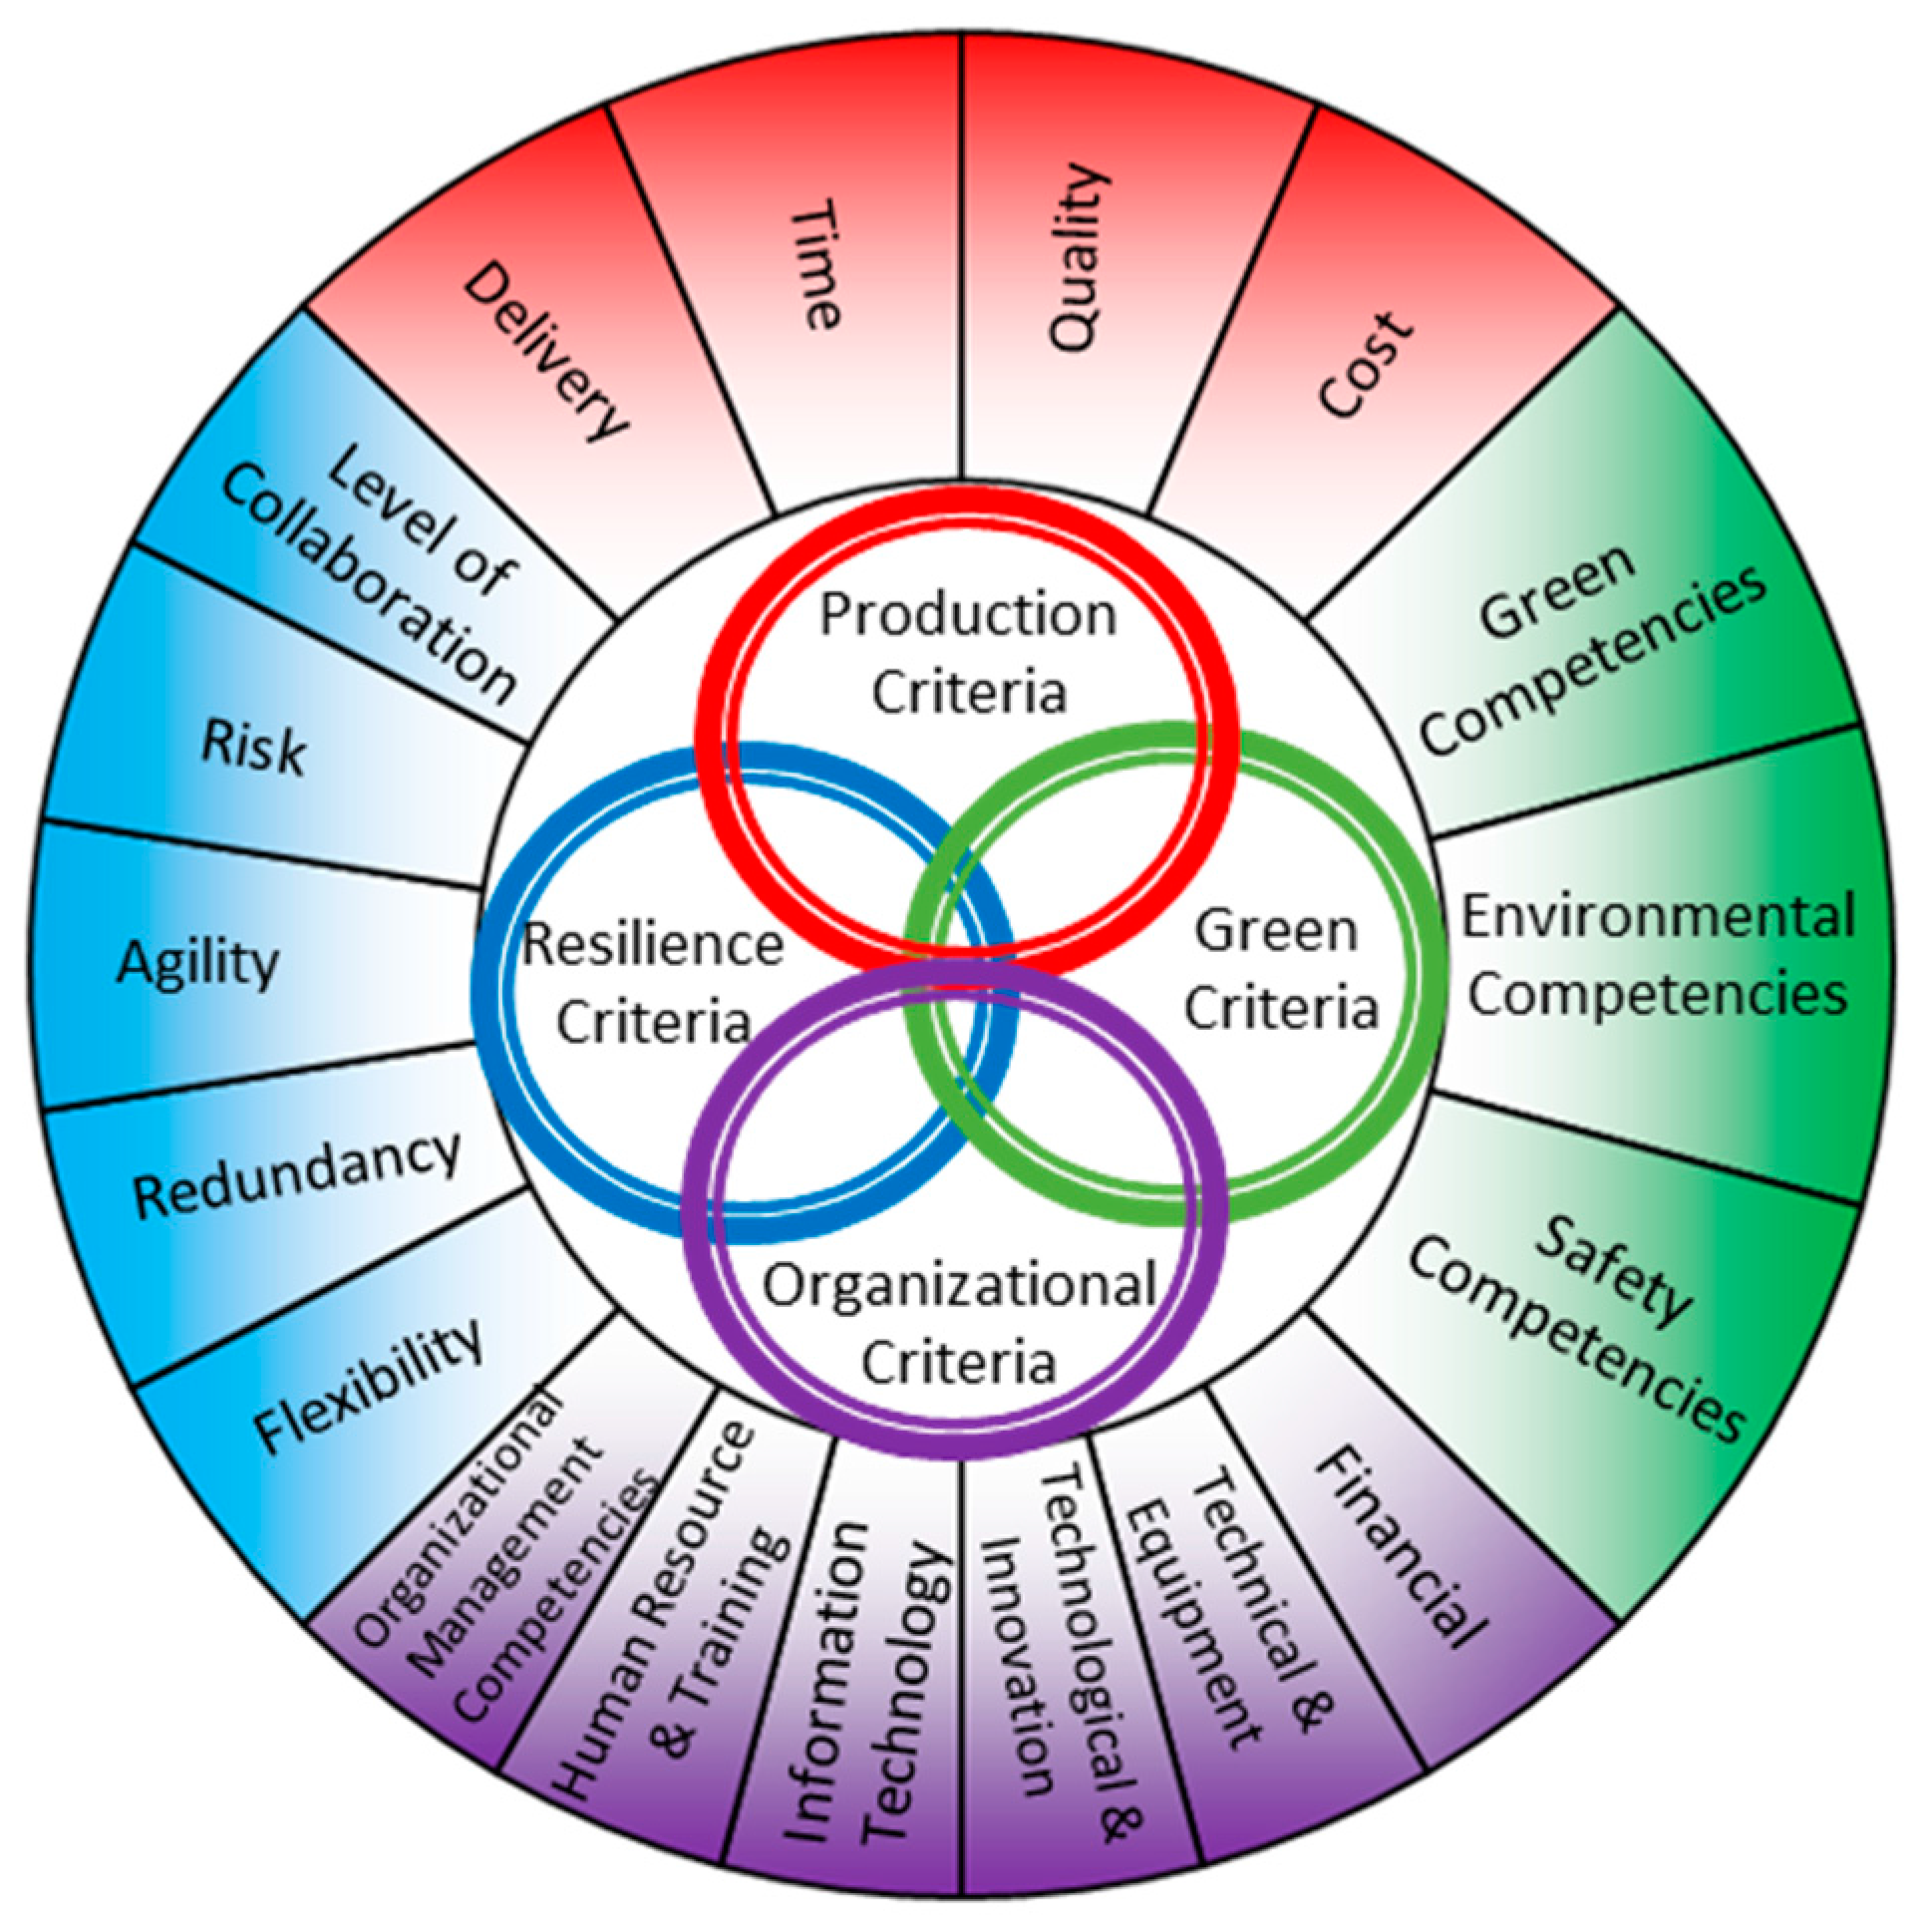
After the presentation of these indices and according to experts from academia and industry some criteria were reduced and finalized through taking into account the conditions such as the effectiveness and importance, existence of information and indices’ value in the supply network and ease in obtaining quantitative or qualitative values of each index by numerous expert and management meetings of the company. Moreover, in the classification and determining the criteria some minor changes were applied and the model was updated. An example in this regard is the addition of green competence and green sub-criteria, environmental and safety sub-criteria. In the indexes by eliminating the indexes with low impact ultimately 54 indicators classified in the form of four main criteria including product, green, resilience and organizational criteria and presented according to Figure 2 of the evaluation of green resilience supply network model.

3.2. Developed Grey Relational Analysis Method

Suppose that A = ( A 1 , A 2 , , A m ) is the set of alternatives and C = ( C 1 , C 2 , , C n ) is n member set of the independent indices. Generally among these n indices there are k quantitative and n k or p qualitative indices ( k + p = n ) . To facilitate the analysis of mathematical relations the value of alternative A i for qualitative indicators C j that defined by grey numbers are presented as G i j and for the qualitative indices are presented as Q i j . The grey number is represented as G i j = [ G _ i j , G ¯ i j ] where G _ i j is lower and G ¯ i j is an upper bound of grey number. Therefore, the grey relational analysis steps are as follows:
Step 1:
Generating and normalizing Hybrid decision-making matrix
A = [ Q 11 Q 12 Q 1 k G 1 k + 1 G 1 k + 2 G 1 p Q 21 Q 22 G 2 k + 1 G 2 k + 2 Q m 1 Q m k G m k + 1 G m p ]
Normalizing positive and negative quantitative criteria:
Q i j * = Q i j max Q j 1 j k
Q i j * = min Q j Q i j 1 j k
Normalizing target-based quantitative criteria:
Q j = | Q o Q j | Q i j * = min Q j Q i j 1 j k
Normalizing positive and negative qualitative criteria [13]:
G i j * = [ G _ i j max G ¯ j , G ¯ i j max G ¯ j ] k + 1 j p
G i j * = [ min G _ j G _ i j , min G ¯ j G ¯ i j ] k + 1 j p
Normalizing target-based qualitative criteria:
D G 0 G j = 1 2 q [ ( G _ o G _ j ) q + ( G ¯ o G ¯ j ) q ] 1 q G i j * = min D G o G j D G o G j k + 1 j p
Step 2:
Reference sequence definition
X 0 = { max Q i 1 * 1 i m , max Q i 2 * 1 i m , , max Q i k * 1 i m , [ max G _ i k + 1 * 1 i m , max G ¯ i k + 1 * 1 i m ] , [ max G _ i k + 2 * 1 i m , max G ¯ i k + 2 * 1 i m ] , , [ max G _ i p * 1 i m , max G ¯ i p * 1 i m ] }
Step 3:
Calculate the difference between the alternatives and the reference alternative
The difference between the alternatives and the reference alternative for crisp and grey number is calculated as follows respectively.
Δ i j = | Q 0 j Q i j |
D 0 i ( j ) = 1 2 [ ( G _ 0 G _ i ) 2 + ( G ¯ 0 G ¯ i ) 2 ]
Step 4:
Grey relational coefficient calculation
γ ( X 0 ( j ) , X i ( j ) ) = ( min min i , j D 0 i ( j ) ) + ρ ( max max i , j D 0 i ( j ) ) D 0 i ( j ) + ρ ( max max i , j D 0 i ( j ) )
where ρ represents the distinguishing coefficient, taking the value of 0.5 in this paper.
Step 5:
Grey relational grade calculation
A Grey relational grade is a weighted sum of the Grey relational coefficients, as shown in Equation (12):
Γ ( X 0 , X i ) = j = 1 n w j γ ( X 0 ( j ) , X i ( j ) )

Assigning of Uncertain Weights and Determining the Importance of Criteria

Another improvement used in this study is assigning weights to each uncertain indicator. In other words, in cases where the importance and priority of an index is not clear, it is possible to extract the index weight in combination with methods such as Delphi using expert opinion, review of the literature and grey numbers.
To take advantage of the uncertain grey numbers to assign weights to each indicator, the following methods are proposed.
  • Forming normalized weighted matrix: In this method, decision matrix by using grey relations is converted to normalized weight matrix. In other words using the grey numbers, linguistic preferences and Table 7 the weight of each criterion is mentioned as w j = [ 0 , 1 ] . In this case, if k experts provide their opinions on the weight of a criterion the weight of that criterion is obtained as follows.
    w j = 1 k [ w j 1 + w j 2 + + w j k ]
    Then the weight of criterion is multiplied by decision-making matrix. In this case, since all weights are uncertain and qualitative the whole decision matrix will be uncertain. Then, using the rule of normalization the decision matrix is converted to normalized weighted matrix and the rest of process continues in accordance with what is described. The disadvantage of this method is that multiplying two grey numbers makes the grey number interval larger which reduces the accuracy of the calculations and decisions.
  • Whitening the grey weights and its usage in calculating the grey relational grade: In this method, after calculating the grey weights of criteria, the difference between the weight of criteria j and the reference weight [ 1 , 1 ] is calculated and whitened by using Equation (14).
    D w 0 w j = 1 2 [ ( w _ 0 w _ j ) 2 + ( w ¯ 0 w ¯ j ) 2 ] W j = D w 0 w j j = 1 n D w 0 w j which   j = 1 n w j = 1

3.3. Heuristic Method of the Combination of Grey-TOPSIS and Grey Relational Analysis

In this combined method, the first step is similar to the developed method but in the second step instead of choosing the reference variable as a maximum value or 1, the grey number [0,1] is considered, therefore the steps of the heuristic method are expressed as follows:
Step 2: Generating the reference set.
At this step as discussed in the relations (reference variable relations) it is possible to consider the ideal values between 0 (negative ideal) and 1 (positive ideal) for the reference variable with respect to the normalized decision matrix. Contrary to what the literature usually max Q i j * is used for the certain numbers and max G i j * is used for the grey numbers. In other words, for every number zero and 1 values are considered and the desirable variable is the one with minimum distance from 1 and the maximum distance from the zero. For the quantitative values the positive ideal will be 1 and the negative ideal will be 0 and for the qualitative values shown with grey numbers the upper bound is compared with 1 and the lower bound is compared with 0. Thus, the reference variable is defined as follows.
X 0 + = { max Q i 1 * 1 i m , max Q i 2 * 1 i m , , max Q i k * 1 i m , [ max G ¯ i k + 1 * 1 i m ] , [ max G ¯ i k + 2 * 1 i m ] , , [ max G ¯ i p * 1 i m ] } X 0 = { min Q i 1 * 1 i m , min Q i 2 * 1 i m , , min Q i k * 1 i m , [ min G _ i k + 1 * 1 i m ] , [ min G _ i k + 2 * 1 i m ] , , [ min G _ i p * 1 i m ] } max Q i 1 * 1 i m 1 j k = 1   ,   max G _ i k + 1 * 1 i m k + 1 j p = 1 min Q i 1 * 1 i m 1 j k = 0   ,   min G _ i k + 1 * 1 i m k + 1 j p = 0
Step 3: Calculating the difference between the variables and the reference variable.
The difference between the variable X i and the reference variable is divided by the difference between the negative ideal X 0 and the positive ideal X 0 + . The improvement used in this step is the separation of higher and lower bound in the grey number and calculation of the difference of positive and negative ideal individually.
If the index value is crisp, the difference between the variable X i and reference variable X 0 of the criterion i is calculated by Equation (16) and if the index value is grey number, it is calculated by Equation (17).
Δ i j + = | 1 Q i j | Δ i j = | 0 Q i j |
D 0 i ( j ) + = | 1 G ¯ i j | D 0 i ( j ) = | 0 G _ i j |
A _ * = [ Δ _ 11 Δ _ 12 Δ _ 1 k D _ 1 k + 1 D _ 1 k + 2 D _ 1 p Δ _ 21 Δ _ 22 D _ 2 k + 1 D _ 2 k + 2 Δ _ m 1 Δ _ m k D _ m k + 1 D _ m p ]
A ¯ * = [ Δ ¯ 11 Δ ¯ 12 Δ ¯ 1 k D ¯ 1 k + 1 D ¯ 1 k + 2 D ¯ 1 p Δ ¯ 21 Δ ¯ 22 D ¯ 2 k + 1 D ¯ 2 k + 2 Δ ¯ m 1 Δ ¯ m k D ¯ m k + 1 D ¯ m p ]
Step 4: calculating and whitening the Grey relational coefficient.
γ _ ( X 0 ( j ) , X i ( j ) ) = D 0 i ( j ) + ρ ( max max i , j D 0 i ( j ) ) ( max max i , j D 0 i ( j ) ) + ρ ( max max i , j D 0 i ( j ) )
γ ¯ ( X 0 ( j ) + , X i ( j ) ) = ( min min i , j D 0 i ( j ) + ) + ρ ( max max i , j D 0 i ( j ) + ) D 0 i ( j ) + + ρ ( max max i , j D 0 i ( j ) + )
γ ( X 0 ( j ) , X i ( j ) ) = 1 2 ( γ _ + γ ¯ )
Step 5: calculating and whitening the Grey relational grade.
Γ ( X 0 , X i ) = j = 1 n w j γ ( X 0 ( j ) , X i ( j ) )

4. Case Study

Since outsourcing is one of the main strategies of the automotive industry, especially heavy and semi-heavy vehicles industries, the production of most parts is assigned to the domestic and foreign suppliers, thus the outsourced suppliers play an essential role in the realization of green resilience supply chain. Moreover, competition in domestic and foreign markets and increase in sales, exit of the financial crisis, the investment opportunities, growth and technical and research development is subject to more attention to suppliers as one of the critical success factors of the companies.
Iran Khodro Diesel Company (IKD Co., Tehran, Iran) is an organized organization that started its work under the name Khavar Industrial Group, by assembly of a truck a day started its activity in 1964 in Iran and due to increasing automobile demand in the country, increased production by construction of suitable halls and production lines, training and recruiting experts and improving product quality and built various types trucks under Mercedes Benz Co. license.
Considering Accumulated losses of $340 million, and Company’s high financial debt to the suppliers and high cost of supply chain due to multiplicity and lack of appropriate control and management on suppliers’ performance, and also variety, volume, quantity of parts and products of IKD Company and with layered and networking structure of suppliers and technical requirements and environmental regulations, this research try to present a suitable assessment model for ranking and removing weak suppliers.
From the other side, one of the important strategy taken by the company was further constructing of suppliers network with the aim of making it smaller, also optimization and reinforcement of key suppliers with the aim of debt reduction, enhancement of products’ quality and increasing of competitive ability in global market.
According to the contracts, EPCO is the only company that produces all IKD parts except the engines, drive systems and front and rear axle for vehicles and thus it is among the main suppliers of diesel car and has a supply chain much than Idem, Charkheshgar, Vamco and production of truck parts.
In this study, based in the large number of second tier suppliers of EPCO during the meetings with the company it was decided that the key suppliers that produce the strategic pieces in large number and cost are included in the study and evaluated by the evaluation team.
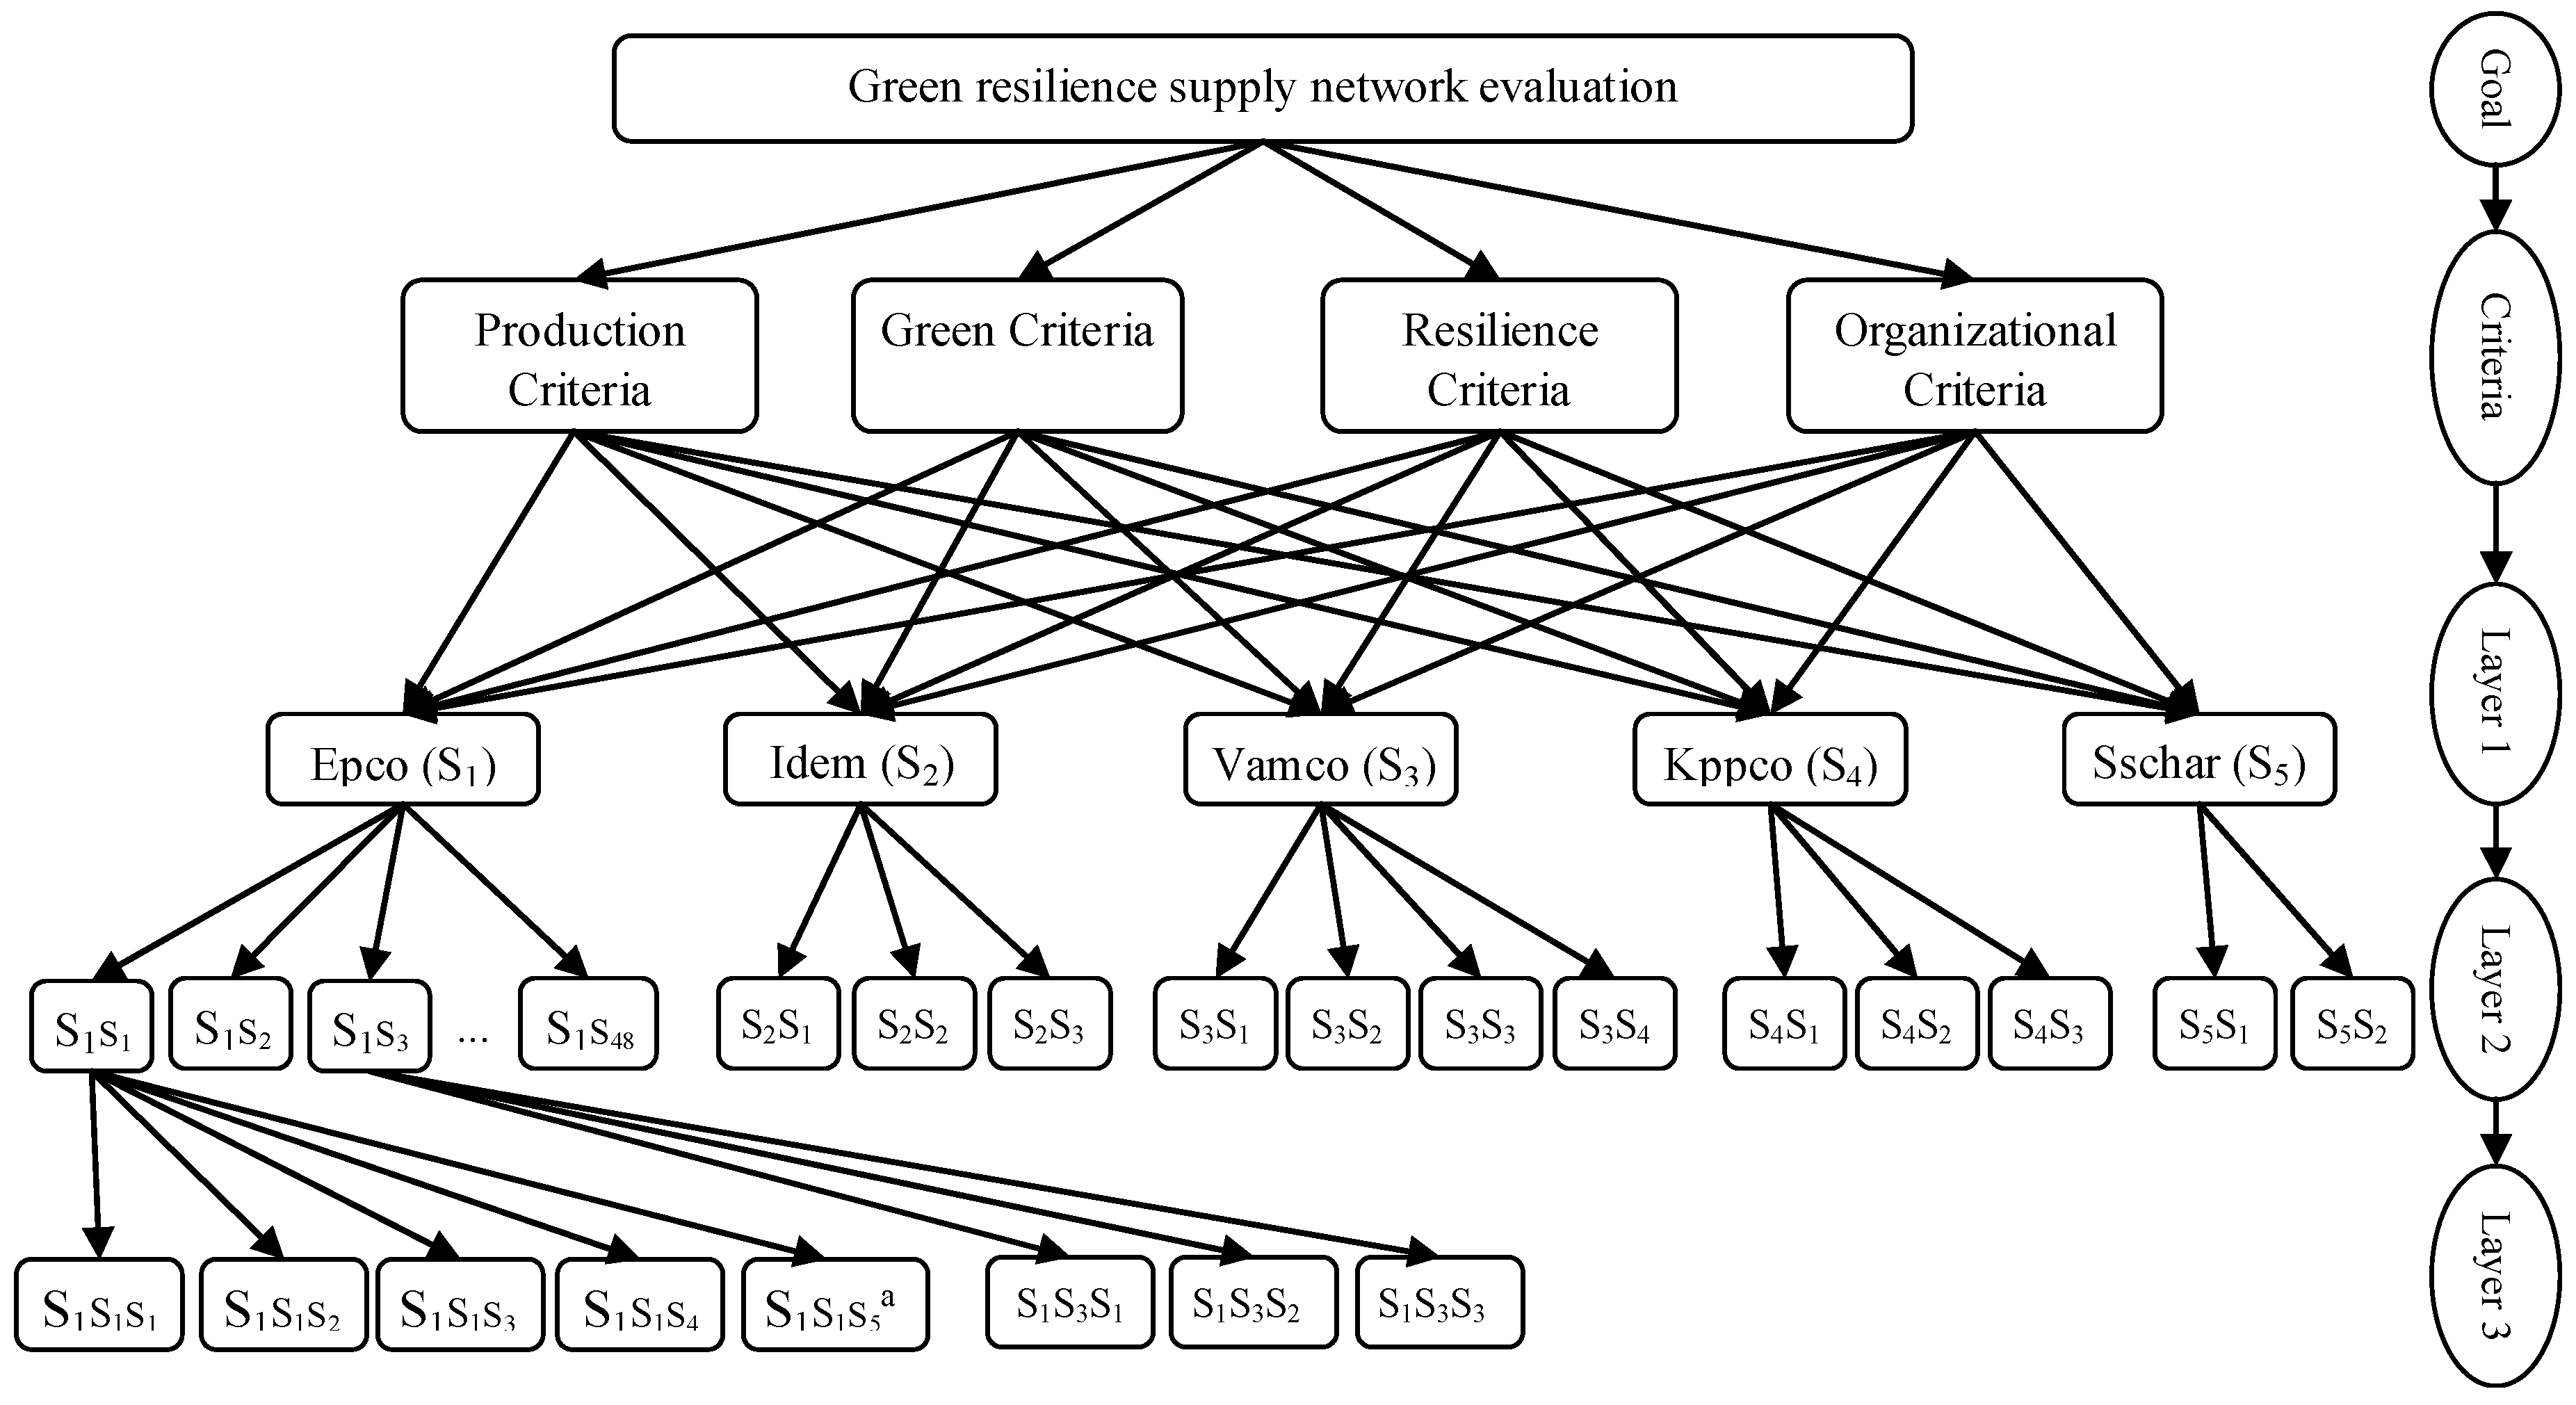
Accordingly, among the approximately 150 large and small suppliers in EPCO, 48 suppliers were considered as the second tier and 8 suppliers were considered as the third tier suppliers for IKD. According to the company's requirements based on observing the corporate information the suppliers of the remaining companies are presented in Figure 3.
Thus, the research problem is converted to a decision matrix consisting of 5 suppliers in the first tier, 60 suppliers in the second tier and 8 suppliers in the third tier.

4.1. Determining the Importance of the Sub Criteria

Given the multiplicity of criteria, complicated analysis and the closeness of the criteria only the importance of 18 sub-criteria is determined and accordingly the importance of the related indices is determined. To determine the importance and weight of the criteria a questionnaire was prepared and presented to committee members so that the weight of criteria is determined based on the linguistic terms, and grey numbers in accordance with Table 7.
To maximize experts’ team accuracy and better decision making of 17 members of the supply chain committee according to the status and degree each one obtained weights based on the Table 8.
Effective criteria in green supply chain and the most useful ones in environmental issues are explained in Table 3 and Table 4 which all of them are used directly or indirectly in indicators and criteria used for case study.
Also some indicators such as DAFWII (C23) were added by scientific and industrial experts due to its importance in automotive industry specially heavy and semi-heavy industries.
To calculate the weight of the criteria and indicators using the improvement used in this study the Euclidean distance is used such that the weight of the criteria will be as Table 9.

4.2. Assessing the Resilience of the Green Supply Network

After determining the type and nature of the indicators in the supply chain committee the first, second and third tier supplier companies in the supply chain were identified and by prior arrangement the technical assessment team consisting of (representatives of business management, financial management, quality management, design, research and development management and human resources management) present the self-reports and site visits for evaluation and analyzing the values of the indices. Accordingly, the values of each indicator at the end of site visits and the final evaluation of the evaluator team is determined and recorded and a questionnaire is not used to obtain the values of intuition and judgment of experts. The use of checklist leads to the same interpretation of indicators based on the previous training while according to the evaluation each team assesses the part related to itself. This leads to higher levels of accuracy and the proposed solution is designed and applied based on the existing realities. For example, the finance team through examining the audited financial statements in the last year calculates the financial indices of the liquidity, profitability, investment and activity ratios and based on the company’s target determines the level of the supplier using the linguistic variables and 7-point likert scale. Then the linguistic variables are converted to the qualitative values by the grey numbers shown in Table 10 and used in the grey decision matrix. In this scaling using the grey numbers the likert scale symmetry requirement is used.
After forming the decision matrix and with regard to the integration of the compilation and the qualitative criteria based on objective using improved grey relational analysis, the grey relational grade is calculated for each of the suppliers.
As noted, EPCO is considered to be the most important supplier for IKD has the second and third tier suppliers. Thus, for the third tier and 8 suppliers in this tier the integrated matrix information is presented based on the Table 11. Therefore, grey relational grade is obtained in accordance with the steps referred to in Section 3.
As mentioned in the research model there are 12 quantitative and 42 qualitative indicators. Thus, for the first supplier of the third tier of IKD Co. (S1S1S1), the integrated matrix for the 54 indicators is presented as follows.
The reference set X 0 is generated by Equation (8) and by using Equation (23) and weight of criteria in Table 10, we calculated grey relational grade of supplier in tier 3 of IDK Co. and shown it in Table 12.
Similarly the above processes are repeated for other first and second tier suppliers and the grey relational grade of each tier is determined. To obtain the final value of the grey relational grade it is necessary to obtain the mean grey relational grade of the third tier and multiplied by the mean relational grade of the second tier. Finally, the final grade is obtained by multiplying this value by the relational score of the first tier.

4.3. The Improved Method to Combine Grey-TOPSIS and GRA

As mentioned in Section 3, in this method instead of determining the reference variable elements as the maximum for each criterion, the reference variable has the positive and negative ideal variable based on the TOPSIS state. In this state, the positive and negative ideal variables can be defined as a grey number [0,1]. In other words the distance of any of the criteria from the above grey number is calculated. However, in this improved method, instead of using a Euclidean distance the grey number G = [ G _ , G ¯ ] is converted into two parts and G _ and G ¯ will be compared with zero and one. If the index value is crisp (product price), the difference between the variable X i and the reference variable X 0 of the criterion j is calculated by Equation (16) and if the index value is grey (delivery lead time), it is calculated by Equation (17).
According to this method, the normalized hybrid decision-making matrix A * is divided to tow quantitative A ¯ and A _ matrix. So by using Equations (20)–(23), grey relational coefficient and grade can be calculated by IHGRA-TOPSIS method and results are shown in Table 13.
To represent the precedence of alternatives and enhance the believability and acceptance of the results found out from grey analysis, the supplier evaluation for tier 3 have also done through an existing method fuzzy TOPSIS. Triangular fuzzy numbers (TFN) used to quantify the uncertainty in decision-making due to their intuitive appeal and computational efficient representation.
The results are shown in Table 14.
The results show that Improved Hybrid Grey Relational Analysis (IHGRA) and fuzzy TOPSIS results in the same order of ranking for the suppliers. Although grey based method and fuzzy TOPSIS are both appropriate for MCDM problem, grey based approach is intuitively appealing and simplicity in structure. The normalization procedure in GRA is simple and logical as compared to fuzzy TOPSIS method. Also the grey based approach clearly provides distinction among the alternatives because high degree of variation of ranking values is observed. However, if the alternatives increased, sometimes the ranking values in case of fuzzy TOPSIS are not distinguishable.

5. Sensitivity Analysis and Management Decisions

In this section, seven scenarios as shown in Table 15 are proposed for sensitivity analysis of the model and compare it with existing models in the literature.
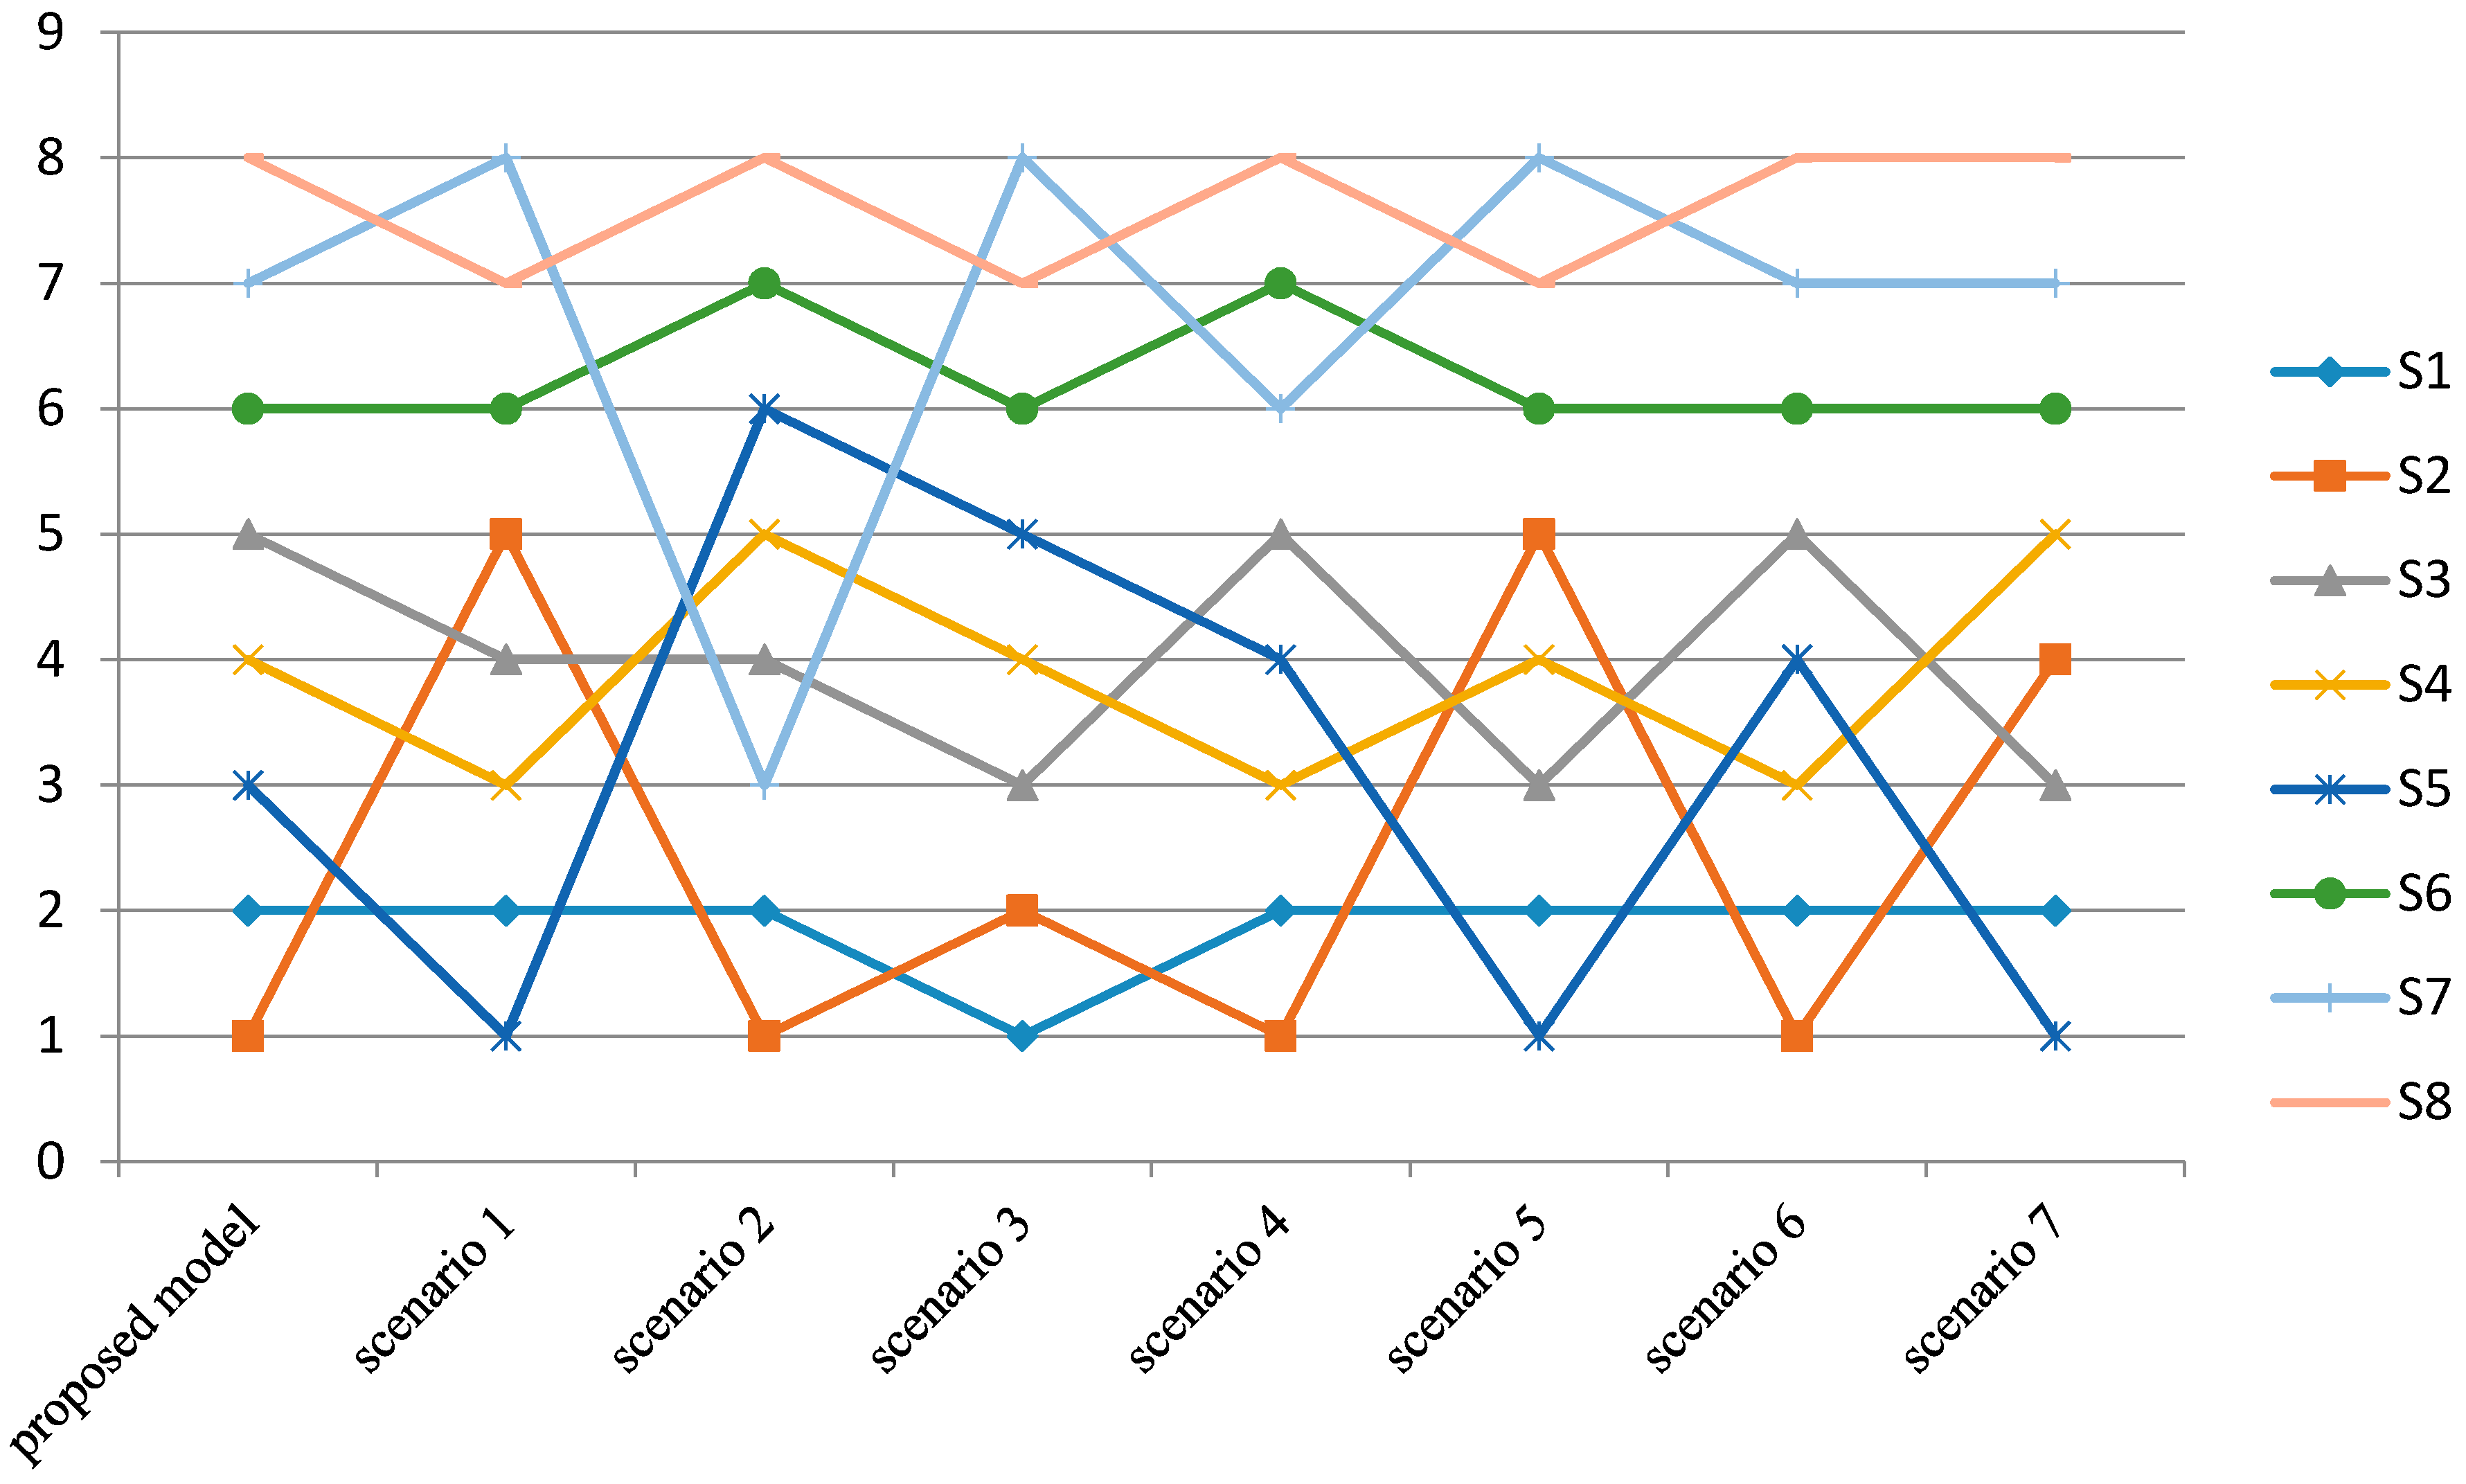
The results of grey relational grade and rank of each supplier for different scenarios are summarized in Table 16 and graphical representation of these results illustrated in Figure 4.
Figure 4 indicate that the rank suppliers in different scenarios mostly related to which criteria applied in the model and the weights of them. Because of the accuracy of proposed model and considering all of the criteria and indices that is important on supplier evaluation and the weight of production, organization, green and resilient criteria exactly on heavy and semi-heavy automation industries, other scenarios cannot calculate the rank of the suppliers properly. In addition, the results of scenario 6 are very closely to proposed model but when the number of supplier increased, scenario 6 had mistaken on ranking the mediate of the suppliers. Figure 4 also illustrated that by studying the situation of the suppliers in different scenarios based on the rank repetition in different scenarios it can be mentioned that the S2 supplier is the best one and S1 has the second rank. Another sensitive analysis that performed in this paper is changed in value of distinguish coefficient. In this paper, the distinguishing coefficient was set as 0.5 initially, while some other different distinguishing coefficients (0.1, 0.2, 0.3, 0.4, 0.6, 0.7, 0.8 and 0.9) were then tested for analysis. The results shows that the differences between grey relational coefficient of S2, S1, and S5 always change when different distinguishing coefficients are adopted, but no matter what the distinguishing coefficient is, the rank order of S2, S1, and S5 is always the same.

6. Results and Discussion

The problem of evaluation and selection of suppliers which is addressed by different models and methods used in the research literature, in addition to the technical and managerial competencies criteria of the suppliers demands paying attention to the resilience features of the suppliers and environmental and safety requirements.
The design and presentation of a comprehensive model that can help the management in optimal and comprehensive decision making and considering technical, managerial, environmental and resilience criteria is one of the objectives of this study.
This study develops a method based on grey relational analysis and is a comprehensive method from the perspective of the type and nature of decision-making criteria. In many practical problems of management especially in the real world first it is necessary to consider the quantitative and qualitative criteria simultaneously in the process. Secondly, in some applied research especially when specific features or performance (such as weight), expectation level or standard is intended in decision making, the use of target based indicators in addition to more common positive and negative criteria is inevitable.
Another advantage of the developed method of hybrid grey relational analysis is obtaining expert opinions independently and then its addition to the model which increases flexibility of the model compared with AHP and TOPSIS models. This flexibility is effective in sensitivity analysis, analyzing various scenarios and low and high opinions. Also since in the previous GRA methods the qualitative and quantitative indices are not used simultaneously and through considering target based criteria, IHGRA method has made solving this problem possible. The sum of these factors has led to the green resilience supplier evaluation model being applicable in other decision making methods or in choosing the supplier selection. Another IHGRA method advantage is that the whitening process of grey relational grade is at the end of steps and the uncertainties in the problem is maintained throughout all stages of calculation.
Practical results of this study indicate that according to the company’s accumulated loss of 340 million dollars, it is proposed to hold a General Assembly and ask the stakeholders to provide financial information and transparency on their company’s debts and encourage them to pay part of their debt by selling part of their property. The company also must use this model to reassess the suppliers and grade them and remove the suppliers with the GRG less than 0.5 or at least threats them to do so.
As shown in Table 17, the company could also grade the companies again based on A and B by classifying the grey relational grade. It is also proposed to grade the values above 0.7 in grade A, values [0.6,0.7] in grade B and values [0.5,0.6] in grade C and deal with them according to the commercial guidelines. Also the results shows that three suppliers must be removed from tier 3, 17 supplier removed from tier 2 of supply network. So the supplier network of the company reduced from 73 to 53.

7. Conclusions

The model designed and presented in this study has attempted to apply all the dimensions of the green supply chain and resilience of the suppliers along with technical and managerial criteria. However, the conditions and views of the experts’ opinion have been effective in proving and disproving the importance of the criteria. On the other hand IKD Co. based on the financial conditions, balance sheet and profit and loss account has had more attention on financial criteria and has considered more indices in field of management and organizational mainstream competence. In future research it is possible to consider more qualitative indicators in the areas of green and environmental criteria and resilience and increase model accuracy more than ever. Moreover, the increase in criteria and indicators make the model more complex. Obviously to evaluate a small company with a small number of suppliers and based on the type of product and the industry in which it is employed it is possible to provide a more appropriate model. For example, in industries producing perishable products, hospitals, and medical centers attention to packaging and productivity and separation of waste is far more important than the status quo in the study. In order to apply both quantitative and qualitative criteria, such as the possibility of making the target based criteria dimensionless along the cost or benefit criteria, the use of experts’ opinions in the allocation of weights to the criteria, and indicators using grey numbers, are some of the limitations. Furthermore, early identification of data requirements and stakeholders’ responsibilities for data provision are other limitations of this study. Eventually, using checklist instead of questionnaire brought up with numerous constraints and complexities. It is recommended to prepare proper databases by the companies and update the supplier information and contracts constantly to collect data easier.
Moreover, a comprehensive software can be designed and developed to evaluate suppliers based on research model or localized model to report the suppliers’ conditions as online or by charts and images as six-month intervals or based on the problem annually. The method presented in this study includes step-by-step methodology that enables the decision maker to consider qualitative and quantitative positive, negative and target based indicators in decision optimization process in certain and uncertain conditions.
In this research, researchers are looking for assessment of suppliers' situation in multi-tier supply network of the company and removing weak suppliers from the network by ranking them. So the question of multi criteria decision making in uncertain situations was developed with the aim of assessment and choosing suppliers. While in LARG supply chain problem, the goal is to compare scenarios and activities which the company can do for improving suppliers’ situation by considering the lean, agile, green and resilience indicators [109]. However, this research is one step back and is going to identify weak and strong suppliers by further constructing of the supply network and in the next step it can assess and rank scenarios of improving situation of the company through the LARG supply chain.
With the recent popularity of the proposed methodology, the implementation of this methodology in multi-criteria decision-making problems in other areas of management is one of the recommendations of this study. On the other hand, the methodology of this study is based on Grey relational analysis; as a recommendation for future studies it is possible to develop and compare this methodology by other methods (e.g., ANP, PROMOTEE, DEA and Structural Analysis) or other methods to deal with uncertainty such as the second type of fuzzy numbers, cognitive maps and so on.

Acknowledgments

Hereby the contributions, comments and suggestions of those who helped to gather information and the Dear editors are appreciated.

Author Contributions

Amirmahdi Malek was PI for the project and conceived the study. Ebrihimnejad and Tavakkoli-Moghaddam provides guidance in the application of the methodological steps and contributes with ideas and concepts incorporated in work. All authors read and approved the final manuscript.

Conflicts of Interest

The authors declare no conflict of interest.

References

  1. Ponomarov, S.Y.; Holcomb, M.C. Understanding the concept of supply chain resilience. Int. J. Logist. Manag. 2009, 20, 124–143. [Google Scholar] [CrossRef]
  2. Boks, C.; Stevels, A. Essential perspectives for design for environment. Experiences from the electronics industry. Int. J. Prod. Res. 2007, 45, 4021–4039. [Google Scholar] [CrossRef]
  3. Ghodsypour, S.H.; O’Brien, C. A decision support system for supplier selection using an integrated analytic hierarchy process and linear programming. Int. J. Prod. Econ. 1998, 56, 199–212. [Google Scholar] [CrossRef]
  4. Kokangul, A.; Susuz, Z. Integrated analytical hierarch process and mathematical programming to supplier selection problem with quantity discount. Appl. Math. Model. 2009, 33, 1417–1429. [Google Scholar] [CrossRef]
  5. Yang, C.-C.; Chen, B.-S. Supplier selection using combined analytical hierarchy process and grey relational analysis. J. Manuf. Technol. Manag. 2006, 17, 926–941. [Google Scholar] [CrossRef]
  6. Demirtas, E.A.; Üstün, Ö. An integrated multiobjective decision making process for supplier selection and order allocation. Omega 2008, 36, 76–90. [Google Scholar] [CrossRef]
  7. Kwong, C.; Ip, W.; Chan, J. Combining scoring method and fuzzy expert systems approach to supplier assessment: A case study. Integr. Manuf. Syst. 2002, 13, 512–519. [Google Scholar] [CrossRef]
  8. Wang, Y. Application of fuzzy decision optimum model in selecting supplier. J. Sci. Technol. Eng. 2005, 5, 1100–1103. [Google Scholar]
  9. Boran, F.E.; Genç, S.; Kurt, M.; Akay, D. A multi-criteria intuitionistic fuzzy group decision making for supplier selection with TOPSIS method. Expert Syst. Appl. 2009, 36, 11363–11368. [Google Scholar] [CrossRef]
  10. Vinodh, S.; Ramiya, R.A.; Gautham, S. Application of fuzzy analytic network process for supplier selection in a manufacturing organisation. Expert Syst. Appl. 2011, 38, 272–280. [Google Scholar] [CrossRef]
  11. Li, G.-D.; Yamaguchi, D.; Nagai, M. A grey-based decision-making approach to the supplier selection problem. Math. Comput. Model. 2007, 46, 573–581. [Google Scholar] [CrossRef]
  12. Golmohammadi, D.; Mellat-Parast, M. Developing a grey-based decision-making model for supplier selection. Int. J. Prod. Econ. 2012, 137, 191–200. [Google Scholar] [CrossRef]
  13. Rajesh, R.; Ravi, V. Supplier selection in resilient supply chains: A grey relational analysis approach. J. Clean. Prod. 2015, 86, 343–359. [Google Scholar] [CrossRef]
  14. Lima-Junior, F.R.; Carpinetti, L.C.R. Combining SCOR® model and fuzzy TOPSIS for supplier evaluation and management. Int. J. Prod. Econ. 2016, 174, 128–141. [Google Scholar] [CrossRef]
  15. Choi, T.Y.; Hartley, J.L. An exploration of supplier selection practices across the supply chain. J. Oper. Manag. 1996, 14, 333–343. [Google Scholar] [CrossRef]
  16. Verma, R.; Pullman, M.E. An analysis of the supplier selection process. Omega 1998, 26, 739–750. [Google Scholar] [CrossRef]
  17. De Boer, L.; Labro, E.; Morlacchi, P. A review of methods supporting supplier selection. Eur. J. Purch. Supply Manag. 2001, 7, 75–89. [Google Scholar] [CrossRef]
  18. Christopher, M. Logistics & Supply Chain Management, 5th ed.; Pearson Education Limited: London, UK, 2016. [Google Scholar]
  19. Sheffi, Y. The Resilient Enterprise: Overcoming Vulnerability for Competitive Advantage; MIT Press: Cambridge, MA, USA, 2005; Volume 1. [Google Scholar]
  20. Talib, F.; Rahman, Z.; Qureshi, M. A study of total quality management and supply chain management practices. Int. J. Product. Perform. Manag. 2011, 60, 268–288. [Google Scholar] [CrossRef]
  21. Helper, S.R.; Sako, M. Supplier relations in Japan and the United States: Are they converging? Sloan Manag. Rev. 1995, 36, 77. [Google Scholar]
  22. Peck, H. Drivers of supply chain vulnerability: An integrated framework. Int. J. Phys. Distrib. Logist. Manag. 2005, 35, 210–232. [Google Scholar] [CrossRef]
  23. Squire, B.; Cousins, P.D.; Lawson, B. The effect of supplier manufacturing capabilities on buyer responsiveness: The role of collaboration. Int. J. Oper. Prod. Manag. 2009, 29, 766–788. [Google Scholar] [CrossRef]
  24. Wu, D.D.; Zhang, Y.; Wu, D.; Olson, D.L. Fuzzy multi-objective programming for supplier selection and risk modeling: A possibility approach. Eur. J. Oper. Res. 2010, 200, 774–787. [Google Scholar] [CrossRef]
  25. Mahapatra, S.K.; Narasimhan, R.; Barbieri, P. Strategic interdependence, governance effectiveness and supplier performance: A dyadic case study investigation and theory development. J. Oper. Manag. 2010, 28, 537–552. [Google Scholar] [CrossRef]
  26. Seuring, S. Sustainability Management beyond Corporate Boundaries; Elsevier: Amsterdam, The Netherlands, 2010. [Google Scholar]
  27. Seuring, S.; Müller, M. From a literature review to a conceptual framework for sustainable supply chain management. J. Clean. Prod. 2008, 16, 1699–1710. [Google Scholar] [CrossRef]
  28. Christopher, M.; Lee, H. Mitigating supply chain risk through improved confidence. Int. J. Phys. Distrib. Logist. Manag. 2004, 34, 388–396. [Google Scholar] [CrossRef] [Green Version]
  29. Wang, S.-Y.; Chang, S.-L.; Wang, R.-C. Assessment of supplier performance based on product-development strategy by applying multi-granularity linguistic term sets. Omega 2009, 37, 215–226. [Google Scholar] [CrossRef]
  30. Punniyamoorthy, M.; Mathiyalagan, P.; Parthiban, P. A strategic model using structural equation modeling and fuzzy logic in supplier selection. Expert Syst. Appl. 2011, 38, 458–474. [Google Scholar] [CrossRef]
  31. Lee, A.H.; Kang, H.-Y.; Hsu, C.-F.; Hung, H.-C. A green supplier selection model for high-tech industry. Expert Syst. Appl. 2009, 36, 7917–7927. [Google Scholar] [CrossRef]
  32. Kamfiroozi, M.H.; Naeini, A.B. Supplier Selection in Grey Environment: A Grey, AHP, Bulls-Eye and ELECTRE Approach. Int. J. Inf. Secur. Sys. Manag. 2013, 2, 110–116. [Google Scholar]
  33. Deng, X.; Hu, Y.; Deng, Y.; Mahadevan, S. Supplier selection using AHP methodology extended by D numbers. Expert Syst. Appl. 2014, 41, 156–167. [Google Scholar] [CrossRef]
  34. Karsak, E.E.; Dursun, M. An integrated fuzzy MCDM approach for supplier evaluation and selection. Comput. Ind. Eng. 2015, 82, 82–93. [Google Scholar] [CrossRef]
  35. Pitchipoo, P.; Venkumar, P.; Rajakarunakaran, S. Grey decision model for supplier evaluation and selection in process industry: A comparative perspective. Int. J. Adv. Manuf. Technol. 2015, 76, 2059–2069. [Google Scholar] [CrossRef]
  36. Kar, A.K. A hybrid group decision support system for supplier selection using analytic hierarchy process, fuzzy set theory and neural network. J. Comput. Sci. 2015, 6, 23–33. [Google Scholar] [CrossRef]
  37. Moghaddam, K.S. Fuzzy multi-objective model for supplier selection and order allocation in reverse logistics systems under supply and demand uncertainty. Expert Syst. Appl. 2015, 42, 6237–6254. [Google Scholar] [CrossRef]
  38. Dey, B.; Bairagi, B.; Sarkar, B.; Sanyal, S.K. Multi objective performance analysis: A novel multi-criteria decision making approach for a supply chain. Comput. Ind. Eng. 2016, 94, 105–124. [Google Scholar] [CrossRef]
  39. Wang, T.-K.; Zhang, Q.; Chong, H.-Y.; Wang, X. Integrated Supplier Selection Framework in a Resilient Construction Supply Chain: An Approach via Analytic Hierarchy Process (AHP) and Grey Relational Analysis (GRA). Sustainability 2017, 9, 289. [Google Scholar] [CrossRef]
  40. Guo, Z.; Liu, H.; Zhang, D.; Yang, J. Green Supplier Evaluation and Selection in Apparel Manufacturing Using a Fuzzy Multi-Criteria Decision-Making Approach. Sustainability 2017, 9, 650. [Google Scholar]
  41. Tang, C.; Tomlin, B. The power of flexibility for mitigating supply chain risks. Int. J. Prod. Econ. 2008, 116, 12–27. [Google Scholar] [CrossRef]
  42. Jüttner, U.; Maklan, S. Supply chain resilience in the global financial crisis: An empirical study. Supply Chain Manag. Int. J. 2011, 16, 246–259. [Google Scholar] [CrossRef]
  43. Moore, S.B.; Manring, S.L. Strategy development in small and medium sized enterprises for sustainability and increased value creation. J. Clean. Prod. 2009, 17, 276–282. [Google Scholar] [CrossRef]
  44. Christopher, M.; Peck, H. Building the resilient supply chain. Int. J. Logist. Manag. 2004, 15, 1–14. [Google Scholar] [CrossRef] [Green Version]
  45. Tang, C.S. Robust strategies for mitigating supply chain disruptions. Int. J. Logist. Res. Appl. 2006, 9, 33–45. [Google Scholar] [CrossRef]
  46. Pettit, T.J.; Fiksel, J.; Croxton, K.L. Ensuring supply chain resilience: Development of a conceptual framework. J. Bus. Logist. 2010, 31, 1–21. [Google Scholar] [CrossRef]
  47. Ates, A.; Bititci, U. Change process: A key enabler for building resilient SMEs. Int. J. Prod. Res. 2011, 49, 5601–5618. [Google Scholar] [CrossRef]
  48. Tveiten, C.K.; Albrechtsen, E.; Wærø, I.; Wahl, A.M. Building resilience into emergency management. Saf. Sci. 2012, 50, 1960–1966. [Google Scholar] [CrossRef] [Green Version]
  49. Soni, U.; Jain, V.; Kumar, S. Measuring supply chain resilience using a deterministic modeling approach. Comput. Ind. Eng. 2014, 74, 11–25. [Google Scholar] [CrossRef]
  50. Scholten, K.; Schilder, S. The role of collaboration in supply chain resilience. Supply Chain Manag. Int. J. 2015, 20, 471–484. [Google Scholar] [CrossRef]
  51. Torabi, S.; Baghersad, M.; Mansouri, S. Resilient supplier selection and order allocation under operational and disruption risks. Transp. Res. Part E Logist. Transp. Rev. 2015, 79, 22–48. [Google Scholar] [CrossRef]
  52. Hsu, C.-W.; Hu, A.H. Applying hazardous substance management to supplier selection using analytic network process. J. Clean. Prod. 2009, 17, 255–264. [Google Scholar] [CrossRef]
  53. Tseng, M.-L.; Chiu, A.S. Evaluating firm's green supply chain management in linguistic preferences. J. Clean. Prod. 2013, 40, 22–31. [Google Scholar] [CrossRef]
  54. Shaik, M.; Abdul-Kader, W. Green supplier selection generic framework: A multi-attribute utility theory approach. Int. J. Sustain. Eng. 2011, 4, 37–56. [Google Scholar] [CrossRef]
  55. Ip, W.; Chan, S.; Lam, C. Modeling supply chain performance and stability. Ind. Manag. Data Syst. 2011, 111, 1332–1354. [Google Scholar] [CrossRef]
  56. Kotzab, H.; Munch, H.M.; de Faultrier, B.; Teller, C. Environmental retail supply chains: When global Goliaths become environmental Davids. Int. J. Retail Distrib. Manag. 2011, 39, 658–681. [Google Scholar] [CrossRef] [Green Version]
  57. Large, R.O.; Thomsen, C.G. Drivers of green supply management performance: Evidence from Germany. J. Purch. Supply Manag. 2011, 17, 176–184. [Google Scholar] [CrossRef]
  58. Wang, F.; Lai, X.; Shi, N. A multi-objective optimization for green supply chain network design. Decis. Support Syst. 2011, 51, 262–269. [Google Scholar] [CrossRef]
  59. Govindan, K.; Rajendran, S.; Sarkis, J.; Murugesan, P. Multi criteria decision making approaches for green supplier evaluation and selection: A literature review. J. Clean. Prod. 2015, 98, 66–83. [Google Scholar] [CrossRef]
  60. Nielsen, I.E.; Banaeian, N.; Golińska, P.; Mobli, H.; Omid, M. Green supplier selection criteria: From a literature review to a flexible framework for determination of suitable criteria. In Logistics Operations, Supply Chain Management and Sustainability; Springer: Berlin, Germany, 2014; pp. 79–99. [Google Scholar]
  61. Kuo, T.C.; Hsu, C.-W.; Li, J.-Y. Developing a green supplier selection model by using the DANP with VIKOR. Sustainability 2015, 7, 1661–1689. [Google Scholar] [CrossRef]
  62. Deng, J.-L. Control problems of grey systems. Syst. Control Lett. 1982, 1, 288–294. [Google Scholar]
  63. Deng, J.-L. Introduction to grey system theory. J. Grey Syst. 1989, 1, 1–24. [Google Scholar]
  64. Li, P.; Tan, T.; Lee, J. Grey relational analysis of amine inhibition of mild steel corrosion in acids. Corrosion 1997, 53, 186–194. [Google Scholar] [CrossRef]
  65. Lin, C.; Chen, L. A grey analysis of bank re-decreasing the required reserve ratio. J. Grey Syst. 1999, 11, 119–132. [Google Scholar]
  66. Lee, W.; Liao, Y.; Chang, S.-H. Neural-based WEDM optimization via grey analysis. J. Grey Syst. 2001, 13, 135–146. [Google Scholar]
  67. Pan, L.K.; Wang, C.C.; Wei, S.L.; Sher, H.F. Optimizing multiple quality characteristics via Taguchi method-based Grey analysis. J. Mater. Process. Technol. 2007, 182, 107–116. [Google Scholar] [CrossRef]
  68. Tseng, M.-L. A causal and effect decision making model of service quality expectation using grey-fuzzy DEMATEL approach. Expert Syst. Appl. 2009, 36, 7738–7748. [Google Scholar] [CrossRef]
  69. Zhai, L.-Y.; Khoo, L.-P.; Zhong, Z.-W. Design concept evaluation in product development using rough sets and grey relation analysis. Expert Syst. Appl. 2009, 36, 7072–7079. [Google Scholar] [CrossRef]
  70. Liang, R.-H. Application of grey relation analysis to hydroelectric generation scheduling. Int. J. Electr. Power Energy Syst. 1999, 21, 357–364. [Google Scholar] [CrossRef]
  71. Hsu, C.-I.; Wen, Y.-H. Application of grey theory and multiobjective programming towards airline network design. Eur. J. Oper. Res. 2000, 127, 44–68. [Google Scholar] [CrossRef]
  72. Hsu, Y.-T.; Yeh, J. A novel image compression using grey models on a dynamic window. Int. J. Syst. Sci. 2000, 31, 1125–1141. [Google Scholar] [CrossRef]
  73. Wu, H.-H. A comparative study of using grey relational analysis in multiple attribute decision making problems. Qual. Eng. 2002, 15, 209–217. [Google Scholar] [CrossRef]
  74. Tsai, C.-H.; Chang, C.-L.; Chen, L. Applying grey relational analysis to the vendor evaluation model. Int. J. Comput. Internet Manag. 2003, 11, 45–53. [Google Scholar]
  75. Wang, C.-H.; Tong, L.-I. Optimization of dynamic multi-response problems using grey multiple attribute decision making. Qual. Eng. 2004, 17, 1–9. [Google Scholar] [CrossRef]
  76. Chen, M.-F.; Tzeng, G.-H. Combining grey relation and TOPSIS concepts for selecting an expatriate host country. Math. Comput. Model. 2004, 40, 1473–1490. [Google Scholar] [CrossRef]
  77. Zhang, J.; Wu, D.; Olson, D.L. The method of grey related analysis to multiple attribute decision making problems with interval numbers. Math. Comput. Model. 2005, 42, 991–998. [Google Scholar] [CrossRef]
  78. Deng, J. The Primary Methods of Grey System Theory; Huazhong University of Science and Technology Press: Wuhan, China, 2005. [Google Scholar]
  79. Morán, J.; Granada, E.; Miguez, J.L.; Porteiro, J. Use of grey relational analysis to assess and optimize small biomass boilers. Fuel Process. Technol. 2006, 87, 123–127. [Google Scholar] [CrossRef]
  80. Olson, D.L.; Wu, D. Simulation of fuzzy multiattribute models for grey relationships. Eur. J. Oper. Res. 2006, 175, 111–120. [Google Scholar] [CrossRef]
  81. Chan, J.W.; Tong, T.K. Multi-criteria material selections and end-of-life product strategy: Grey relational analysis approach. Mater. Des. 2007, 28, 1539–1546. [Google Scholar] [CrossRef]
  82. Li, G.-D.; Yamaguchi, D.; Nagai, M. A grey-based rough decision-making approach to supplier selection. Int. J. Adv. Manuf. Technol. 2008, 36, 1032–1040. [Google Scholar] [CrossRef]
  83. Kuo, Y.; Yang, T.; Huang, G.-W. The use of grey relational analysis in solving multiple attribute decision-making problems. Comput. Ind. Eng. 2008, 55, 80–93. [Google Scholar] [CrossRef]
  84. Jadidi, O.; Hong, T.S.; Firouzi, F.; Yusu, R.M. An optimal grey based approach based on TOPSIS concepts for supplier selection problem. Int. J. Manag. Sci. Eng. Manag. 2009, 4, 104–117. [Google Scholar]
  85. Hu, Y. Supplier selection based on analytic hierarchy process and grey relational analysis. In Proceedings of the 2009 ISECS International Colloquium on Computing, Communication, Control, and Management, Sanya, China, 29 September 2009; IEEE: Piscataway, NJ, USA, 2009. [Google Scholar]
  86. Bai, C.; Sarkis, J. Integrating sustainability into supplier selection with grey system and rough set methodologies. Int. J. Prod. Econ. 2010, 124, 252–264. [Google Scholar] [CrossRef]
  87. Baskaran, V.; Nachiappan, S.; Rahman, S. Indian textile suppliers' sustainability evaluation using the grey approach. Int. J. Prod. Econ. 2012, 135, 647–658. [Google Scholar] [CrossRef]
  88. Bali, O.; Kose, E.; Gumus, S. Green supplier selection based on IFS and GRA. Grey Syst. Theory Appl. 2013, 3, 158–176. [Google Scholar] [CrossRef]
  89. Tang, H. A novel fuzzy soft set approach in decision making based on grey relational analysis and Dempster–Shafer theory of evidence. Appl. Soft Comput. 2015, 31, 317–325. [Google Scholar] [CrossRef]
  90. Hashemi, S.H.; Karimi, A.; Tavana, M. An integrated green supplier selection approach with analytic network process and improved Grey relational analysis. Int. J. Prod. Econ. 2015, 159, 178–191. [Google Scholar] [CrossRef]
  91. Ramesh, S.; Viswanathan, R.; Ambika, S. Measurement and optimization of surface roughness and tool wear via grey relational analysis, TOPSIS and RSA techniques. Measurement 2016, 78, 63–72. [Google Scholar] [CrossRef]
  92. Wang, P.; Zhu, Z.; Wang, Y. A novel hybrid MCDM model combining the SAW, TOPSIS and GRA methods based on experimental design. Inf. Sci. 2016, 345, 27–45. [Google Scholar] [CrossRef]
  93. Tseng, M.-L. Using linguistic preferences and grey relational analysis to evaluate the environmental knowledge management capacity. Expert Syst. Appl. 2010, 37, 70–81. [Google Scholar] [CrossRef]
  94. Lin, C.; Lin, J.; Ko, T. Optimisation of the EDM process based on the orthogonal array with fuzzy logic and grey relational analysis method. Int. J. Adv. Manuf. Technol. 2002, 19, 271–277. [Google Scholar] [CrossRef]
  95. Fung, C.-P. Manufacturing process optimization for wear property of fiber-reinforced polybutylene terephthalate composites with grey relational analysis. Wear 2003, 254, 298–306. [Google Scholar] [CrossRef]
  96. Kao, P.; Hocheng, H. Optimization of electrochemical polishing of stainless steel by grey relational analysis. J. Mater. Process. Technol. 2003, 140, 255–259. [Google Scholar] [CrossRef]
  97. Lo, S.; Hu, B.Q.; Liu, M.; Yuen, K.K. On the use of reliability interval method and grey relational model for fire safety ranking of existing buildings. Fire Technol. 2005, 41, 255–270. [Google Scholar] [CrossRef]
  98. Chiang, K.-T.; Chang, F.-P. Optimization of the WEDM process of particle-reinforced material with multiple performance characteristics using grey relational analysis. J. Mater. Process. Technol. 2006, 180, 96–101. [Google Scholar] [CrossRef]
  99. Tosun, N. Determination of optimum parameters for multi-performance characteristics in drilling by using grey relational analysis. Int. J. Adv. Manuf. Technol. 2006, 28, 450–455. [Google Scholar] [CrossRef]
  100. Zeng, G.; Jiang, R.; Huang, G.; Xu, M.; Li, J. Optimization of wastewater treatment alternative selection by hierarchy grey relational analysis. J. Environ. Manag. 2007, 82, 250–259. [Google Scholar] [CrossRef] [PubMed]
  101. He, R.-S.; Hwang, S.-F. Damage detection by a hybrid real-parameter genetic algorithm under the assistance of grey relation analysis. Eng. Appl. Artif. Intell. 2007, 20, 980–992. [Google Scholar] [CrossRef]
  102. Kung, C.-Y.; Wen, K.-L. Applying grey relational analysis and grey decision-making to evaluate the relationship between company attributes and its financial performance—A case study of venture capital enterprises in Taiwan. Decis. Support Syst. 2007, 43, 842–852. [Google Scholar] [CrossRef]
  103. Wang, Y.-J. Applying FMCDM to evaluate financial performance of domestic airlines in Taiwan. Expert Syst. Appl. 2008, 34, 1837–1845. [Google Scholar] [CrossRef]
  104. Chan, F.T.S.; Kumar, N.; Tiwari, M.K.; Lau, H.C.W.; Choy, K.L. Global supplier selection: A fuzzy-AHP approach. Int. J. Prod. Res. 2008, 46, 3825–3857. [Google Scholar] [CrossRef]
  105. Chakradhar, D.; Gopal, A.V. Multi-objective optimization of electrochemical machining of EN31 steel by grey relational analysis. Int. J. Model. Optim. 2011, 1, 113. [Google Scholar] [CrossRef]
  106. Manivannan, S.; Devi, S.; Arumugam, R.; Sudharsan, N.M. Multi-objective optimization of flat plate heat sink using Taguchi-based Grey relational analysis. Int. J. Adv. Manuf. Technol. 2011, 52, 739–749. [Google Scholar] [CrossRef]
  107. Yang, Y.; Shih, C.; Fung, R. Multi-objective optimization of the light guide rod by using the combined Taguchi method and Grey relational approach. J. Intell. Manuf. 2014, 25, 99–107. [Google Scholar] [CrossRef]
  108. Ghorabaee, M.K.; Zavadskas, E.K.; Amiri, M.; Esmaeili, A. Multi-criteria evaluation of green suppliers using an extended WASPAS method with interval type-2 fuzzy sets. J. Clean. Prod. 2016, 137, 213–229. [Google Scholar] [CrossRef]
  109. Cabral, I.; Grilo, A.; Cruz-Machado, V. A decision-making model for lean, agile, resilient and green supply chain management. Int. J. Prod. Res. 2012, 50, 4830–4845. [Google Scholar] [CrossRef]
Figure 1. Flow chart of the proposed methodology.
Sustainability 09 01433 g001
Figure 2. Proposed Green Resilience supply chain evaluation model.
Sustainability 09 01433 g002
Figure 3. IKD supply chain network. (a) S1S1S5 Describe the fifth supplier of the tier three for the first supplier of tier tow and first supplier of tier one.
Sustainability 09 01433 g003
Figure 4. Sensitivity analysis.
Sustainability 09 01433 g004
Table 1. Some recent studies about the evaluation and selection of suppliers.
Researcher(s)MethodologyDescription
[32]Grey, AHP, Bulls-Eye and ELECTRESupplier selection using interval grey numbers and Bulls Eye and ELECTRE combined approach, and taking into account the five criteria of price, transportation costs, technological capability, and delay in the delivery and quality of products in Sadra company.
[33]AHP & D NumbersConsidering five main criteria and 19 sub criteria with D numbers and AHP to choose supplier in a numerical example.
[34]Fuzzy Multi-Criteria group Decision Making & QFD & 2-tuple linguistic representationSupplier evaluation based on nine criteria of production volume, delivery, payment methods, diversity of supply, reliability, skills, history of trade relations, management and geographic location, and using Fuzzy group multiple criteria decision making, QFD and 2-tuple fuzzy linguistic numbers in a private hospital in Turkey.
[35]Grey Relational Analysis & Principal component analysis & EntropyTaking into account four criteria of cost, delivery, production capacity and guarantee and the use of grey relational analysis in combination with entropy and principal component analysis for evaluating and selecting suppliers.
[36]AHP & Fuzzy & Neural NetworksOut of 63 Common Criteria for supplier evaluation, seven criteria are selected in a multinational company in India and evaluated using FAHP method and fuzzy neural network.
[37]Fuzzy Multi-ObjectiveConsidering uncertainty in customer demand and supplier capacity and the percentage of return of the product the Fuzzy multi-objective mathematical model is designed and solved using Fuzzy group programming (FGP) and Monte Carlo simulation
[38]Multi objective performance analysis (MOPA)The best potential provider is selected by multi-objective analysis of performance and the proposed method is compared with ELECTRE, TOPSIS and VIKOR
[14]Fuzzy TOPSIS & SCOR modelIn this study, derived from SCOR, 11 criteria are proposed for evaluating suppliers in the automotive industry using fuzzy TOPSIS.
[39]AHP & GRAProposed an integrated BIM and GIS supplier selection framework in a resilient construction supply chain under a combined methodology consisting of AHP and GRA.
[40]Fuzzy axiomatic design (AD) & MCDMProposed a green supplier evaluation model with 6 main criteria and 10 sub-criteria based on the triple bottom line principle.
Table 2. A review of the literature on the resilient supply chain.
Researcher(s)Description
[44]They claimed that the resilience in the supply chain is caused by four principles and other features like agility, accessibility, performance, flexibility, redundancy, speed and transparency are the secondary factors of resilience.
[45]The strategies that increased the resilience of the supply chain are described.
[1]The relationship between logistics capabilities and the supply chain resilience are analyzed and it is stated that cohesion, integrity, and the relationship between logistics capabilities improves resilience in the supply chain and facilitates return from incidents and interruptions
[46]A comprehensive model designed that enables the managers to balance between capabilities and vulnerabilities by the supply chain balanced resilience
[47]Resilience in small and medium companies is promoted based on the change management process, long-term planning, improving organizational communications and adopting proactive strategy
[42]Supply chain risk management and knowledge management capabilities by improving the flexibility, transparency, accountability and response and collaboration time have a positive impact on the resilience of the supply chain.
[48]Development of effective emergency management through a comprehensive method including monitoring, predicting, responding and learning as four main dimensions of resilience
[49]Measuring supply chain resilience using graph theory
[50]The cooperation criteria in the supply chain with resilience described and their effect on the resilience of the supply chain is discussed.
[51]Developed a linear probabilistic two-objective integer model based on scenario to create a resilient supplier based on the global supply chain and could respond to uncertainties and interruptions due to operational risks and disturbance
Table 3. Top ten criteria for green supplier selection.
CriteriaFrequency of Resources
Environmental management systems12
Quality7
Price/cost6
Services6
Technology4
Green design6
Green image5
Environmental performance4
Environmental advantages4
Green Partnership with suppliers3
Table 4. The frequency of the most common methods of environmental criteria in choosing suppliers.
[59][60]
Period1996–20111996–2014
The number of reviewed articles3357
CriteriaEnvironmental management systems1120
Green image48
Environmental advantages36
Green design35
The costs of environmental improvements25
Environmental performance35
Table 5. The most important applications of grey systems theory.
Researcher(s)MethodologyApplication
[64]GRAChemical Engineering (steel corrosion)
[70]GRAElectrical Engineering (hydroelectric production scheduling)
[71]Grey theory & MOPDesigning overhead network
[72]Grey theoryImage Density
[73]GRAA Comparative Study of MADM problems
[74]GRASales assessment
[75]Grey Decision MakingDynamic systems with multiple responses
[76]GRA & TOPSISChoosing the country for citizenship
[77]GRA & interval numberMADM problem with interval numbers
[78]Grey System TheoryThe fundamental problem
[79]GRAOptimization problem (boiler)
[80]Grey & Fuzzy SetSimulation (MADM model)
[5]GRA & AHPSupplier selection
[81]GRAProduct lifetime
[11]Grey Possibility DegreeSupplier selection
[82]GRA & Rough SetSupplier selection
[83]GRAMADM practical problem
[84]Grey & TOPSISSupplier selection
[85]GRA & AHPSupplier selection
[86]Grey & Rough SetSustainability in supplier selection
[87]Grey TheoryEvaluation of supplier sustainability
[12]GRA & Fuzzy SetSupplier selection
[88]GRA & IFS (Intuitionistic fuzzy set)Green supplier selection
[53]GRA & Fuzzy SetGreen supply chain
[89]GRA & Fuzzy SetDeveloping Dempster-Shafer decision making model
[13]GPDSelecting resilient supplier
[90]GRA & ANPGreen supplier selection
[91]GRA & TOPSISMeasurement and optimization of surface hardness and tool wear
[92]GRA & SAW & TOPSISMCDM hybrid model based on experimental design
Table 6. The gap of the study compared with previous studies.
Researcher(s)Type of CriteriaType of Target Base CriteriaType of Entry of Decision MatrixWeight of CriteriaApplication
Cost/Benefit BaseTarget BaseQuantitativeQualitativeCrispUncertainType of UncertaintyQuantitativeQualitative
[63] Numerical Example
[94] Fuzzy Optimization of the EDM Process
[95] Manufacturing process optimization
[96] Optimization of Electrochemical Polishing Of Stainless Steel
[97] Fire Safety Ranking of Existing Buildings
[77] Interval Numerical Example
[98] Optimization of the WEDM Process
[79] assess and optimize small biomass boilers
[99] Optimum Parameters for Multi-Performance Characteristics in Drilling
[100] Fuzzy Optimization of Wastewater Treatment Alternative Selection
[101] Damage detection
[81] Multi-criteria material selections
[102] Evaluate the Relationship Between Company Attributes and Its Financial Performance
[11] Grey Supplier selection
[103]) Fuzzy Evaluate Financial Performance of Domestic Airlines in Taiwan
[82] Grey Supplier selection
[83] facility layout and dispatching rules selection problem
[104] Fuzzy Supplier selection
[93] Fuzzy Evaluate the Environmental Knowledge Management Capacity
[105] Multi-Objective Optimization of Electrochemical machining
[106] Multi-Objective Optimization of Flat Plate Heat Sink
[107] Multi-Objective Optimization of the Light Guide Rod
[13] Grey Supplier selection in resilient supply chains
[33] D Numbers Supplier selection
[108] Interval type-2 fuzzy sets Multi-criteria evaluation of green suppliers
Table 7. Criteria weight assessment using grey numbers.
Linguistic VariablesVery Low (VL)Low (L)Medium Low (ML)Medium (M)Medium High (MH)High (H)Very High (VH)
Scale of Grey number (⊗W)[0,0.1][0.1,0.3][0.3,0.4][0.4,0.6][0.6,0.7][0.7,0.9][0.9,1]
Table 8. Committee members and experts’ team weights.
MembersNo. MembersNormalized Weight
Senior management and surrogate20.18
Commercial, marketing and sale, financial, planning and budgeting, quality, production and material managements80.55
R&D, HRM, strategy development, legal and contract managements50.22
Customer relationship and supply chain management technicians20.05
171
Table 9. Whitening the weight of sub-criteria.
Criteria Sub-CriteriaIndices W j
ProductionQ1CostProduct Price (C1), Product Cost (C2)0.053
Q2Quality% Of defects/Violations/Deviations found on Process Control (C3), % Yield (C4), Warranties and Claim Policies (C5)0.051
Q3TimeProduction Lead Time (C6)0.034
Q4DeliveryDelivery Lead Time (C7), Compliance with due Date (C8), Compliance with Quantity (C9), Compliance with Packaging Standard (C10), Delivery Reliability (C11), Delivery Documents (C12)0.066
GreenQ5Green CompetenciesGreen Design (C13), Green Image (C14), Green Material (C15), Green Technology (C16)0.050
Q6Environmental CompetenciesPollution Control (C17), Environmental Management System (C18), Energy Consumption Management (C19), Packaging & Reverse Logistics (C20), Collaboration & Suppliers Environmental Monitoring (C21)0.069
Q7Safety CompetenciesOHSAS-18001 Certification (C22), Days Away from Work Injury and Illness (DAFWII) Rate (C23)0.066
OrganizationalQ8FinancialCapital Structure & Market Analysis Ratios (C24), Activity Analysis Ratios (C25), Profitability Analysis Ratios (C26), Liquidity Analysis Ratios (C27)0.069
Q9Technical & EquipmentOverall Equipment Effectiveness (OEE) (C28), Technical manufacturing & assembly Equipment and Plant (C29), Technical Quality control & Test Equipment (C30), Solving Technical Problems with Suppliers (C31)0.055
Q10Technological & InnovationR&D Productivity (C32), Number of Patent Citations & Confirmed International papers (C33), Rate Of Technological Innovation (C34)0.076
Q11Information TechnologyInternet Access (C35), Network & Information Security (C36), Computer Hardware and Software (C37) 0.042
Q12Human Resource & Training% Of HR Budget Spent on Training & Human Resource Study (C38), work Experience (C39), Training Penetration Rate (C40)0.037
Q13Organizational Management CompetenciesGeographical Location (C41), Performance History (C42), Quality Certification & Standards (C43), Strategic Management (C44), Management Commitment (C45)0.039
ResilienceQ14FlexibilityFlexibility (C46)0.049
Q15RedundancyRedundancy (C47)0.061
Q16AgilityVelocity (C48), Visibility (C49)0.064
Q17RiskVulnerable (C50), Risk Awareness (C51)0.054
Q18Level of CollaborationTrust (C52), Collaboration among Players (C53), Information Sharing (C54)0.067
Table 10. Scale of grey number for supplier’s assessment.
Linguistic VariablesVery Poor (VP)Poor (P)Medium Poor (MP)Medium (M)Medium Good (MG)Good (G)Very Good (VG)
Scale of Grey number (⊗G)[0,1][1,3][3,4][4,6][6,7][7,9][9,10]
Table 11. The entry of integrated matrix for the first of the first of the first EPCO supplier (S1S1S1).
Sub-CriteriaCrispGreySub-CriteriaCrispGrey
C10.860 C280.911
C2 [0.333,0.75]C29 [0.778,1]
C30.545 C30 [0.778,1]
C41.000 C310.500
C5 [0.9,1]C32 [0.857,1]
C60.938 C330.600
C70.727 C34 [0.429,0.571]
C8 [0.7,0.9]C35 [0.778,1]
C90.500 C36 [0.857,1]
C10 [0.7,0.9]C37 [0.667,0.778]
C11 [0.778,1]C380.150
C12 [0.4,0.6]C390.210
C13 [0.444,0.667]C400.615
C14 [0.333,0.444]C41 [0.778,1]
C15 [0.778,1]C42 [0.778,1]
C16 [0.667,0.778]C43 [0.778,1]
C17 [0.333,0.444]C44 [0.857,1]
C18 [0.7,0.9]C45 [0.778,1]
C19 [0.6,0.7]C46 [0.778,1]
C20 [0.429,0.571]C47 [0.667,0.778]
C21 [0.667,0.778]C48 [0.778,1]
C22 [0.9,1]C49 [0.857,1]
C230.885 C50 [0.429,0.571]
C24 [0.778,1]C51 [0.857,1]
C25 [0.778,1]C52 [0.571,0857]
C26 [0.778,1]C53 [0.857,1]
C27 [0.667,0.778]C54 [0.667,0.778]
Table 12. Results of grey relational grade and ranking of tier 3 of suppliers by proposed IHGRA method.
Tier 1Tier 2Tier 3GRGRanking Results of IHGRA
S1S1S1S1S1S10.7212
S1S1S20.7491
S1S1S30.5855
S1S1S40.5994
S1S1S50.6163
S1S3S1S3S10.4766
S1S3S20.4517
S1S3S30.4028
Table 13. Results of grey relational grade and ranking of tier 3 of suppliers by proposed IHGRA-TOPSIS method.
Tier 1Tier 2Tier 3GRGRanking Results of IHGRA-TOPSIS
S1S1S1S1S1S10.8052
S1S1S20.8301
S1S1S30.7233
S1S1S40.7185
S1S1S50.7224
S1S3S1S3S10.6236
S1S3S20.6067
S1S3S30.5568
Table 14. Results of Fuzzy TOPSIS compared with proposed methods.
Tier 3IHGRAIHGRA-TOPSISFuzzy-TOPSIS
Γ ( X 0 , X i ) Rank Γ ( X 0 , X i ) Rank C C i Rank
S10.72120.80520.612
S20.74910.83010.651
S30.58550.72330.573
S40.59940.71850.535
S50.61630.72240.564
S60.47660.62360.486
S70.45170.60670.427
S80.40280.55680.418
Table 15. Description of different scenarios to analyze sensitivity of the proposed model.
Scenario No.Scenario TitleScenario Description
Proposed modelAll criteria18 sub-criteria and 54 indices with different kind and types
1Production criteria4 sub-criteria and 12 indices
2Green criteria3 sub-criteria and 11 indices
3Organizational criteria6 sub-criteria and 22 indices
4Resilience Criteria5 sub-criteria and 9 indices
5Supplier selection model by [12]6 sub-criteria include Price, Quality, Delivery, Transportation cost, Production systems and Technology
6Resilience supplier selection model by [13]13 sub-criteria include Quality, Cost, flexibility, Velocity, Visibility, Vulnerability, Level of Collaboration, Risk Awareness, Supply chain continuity
Management, Technological capability, Research and development, Safety and Concern for environment
7Green supplier selection model by [90]6 sub-criteria include Cost, Quality, Technology, Resource consumption, Pollution production and Management commitment
Table 16. Supplier grey relational grade and ranking for different scenarios.
Scenario No. S1S2S3S4S5S6S7S8
Proposed modelGRG0.72130.74930.58510.59920.61590.47640.45080.402
Rank21543678
1GRG0.13950.12570.12600.12820.15270.09000.08190.0892
Rank25431687
2GRG0.12130.15430.09620.09550.09360.08180.10330.0682
Rank21456738
3GRG0.23600.22440.20070.19870.19660.19170.13250.1366
Rank12345687
4GRG0.22450.24480.16220.17690.17300.11290.13320.1080
Rank21534768
5GRG0.18710.17070.18150.17410.19600.14870.10840.1174
Rank25341687
6GRG0.40030.40190.32640.33040.33140.25280.25070.2021
Rank21543678
7GRG0.16000.14680.14910.13520.16800.13010.09700.0904
Rank24351678
Table 17. The results of improved hybrid grey relational grade of IKD supplier network.
Tier 1Tier 2Tier 3
SGRGSGRGSGRGSGRGSGRGSGRG
S10.6589S1S10.6689 S1S1S10.7213
S1S1S20.7493
S1S1S30.5851
S1S1S40.5992
S1S1S50.6159
S1S20.6954
S1S30.5562 S1S3S10.4764
S1S3S20.4508
S1S3S30.4020
S1S40.5731S1S160.5694S1S270.4556S1S380.5805
S1S50.5713S1S170.4681S1S280.4392S1S390.5724
S1S60.4559S1S180.4384S1S290.4028S1S400.4808
S1S70.4441S1S190.4037S1S300.7566S1S410.4386
S1S80.4022S1S200.7674S1S310.6679S1S420.4090
S1S90.4447S1S210.6778S1S320.6786S1S430.5511
S1S100.4132S1S220.6924S1S330.7701S1S440.5769
S1S110.6796S1S230.7656S1S340.4386S1S450.6722
S1S120.6763S1S240.5532S1S350.4106S1S460.6825
S1S130.7680S1S250.5736S1S360.7644S1S470.7828
S1S140.5531S1S260.5654S1S370.5515S1S480.4460
S1S150.5757
S20.6891S2S10.4091
S2S20.7643
S2S30.6666
S30.6867S3S10.6758
S3S20.7643
S3S30.4437
S3S40.4122
S40.5614S4S10.7704
S4S20.4514
S4S30.4121
S50.6794S5S10.5538
S5S20.5663

