Exhaust Pollutants Characteristic of In-Use Vehicles under Acceleration Simulation Mode and Emission Standard Revision for Hei Longjiang Province, China

Abstract
:1. Introduction
2. Materials and Methods
2.1. Data Acquisition
2.2. ASM Test Conditions
2.3. Classification Method Based on Service Life Interval
2.4. Determining Principles and Requirements of Emission Standard
2.4.1. Determining Principles
2.4.2. Basic Requirements
3. Results and Discussion
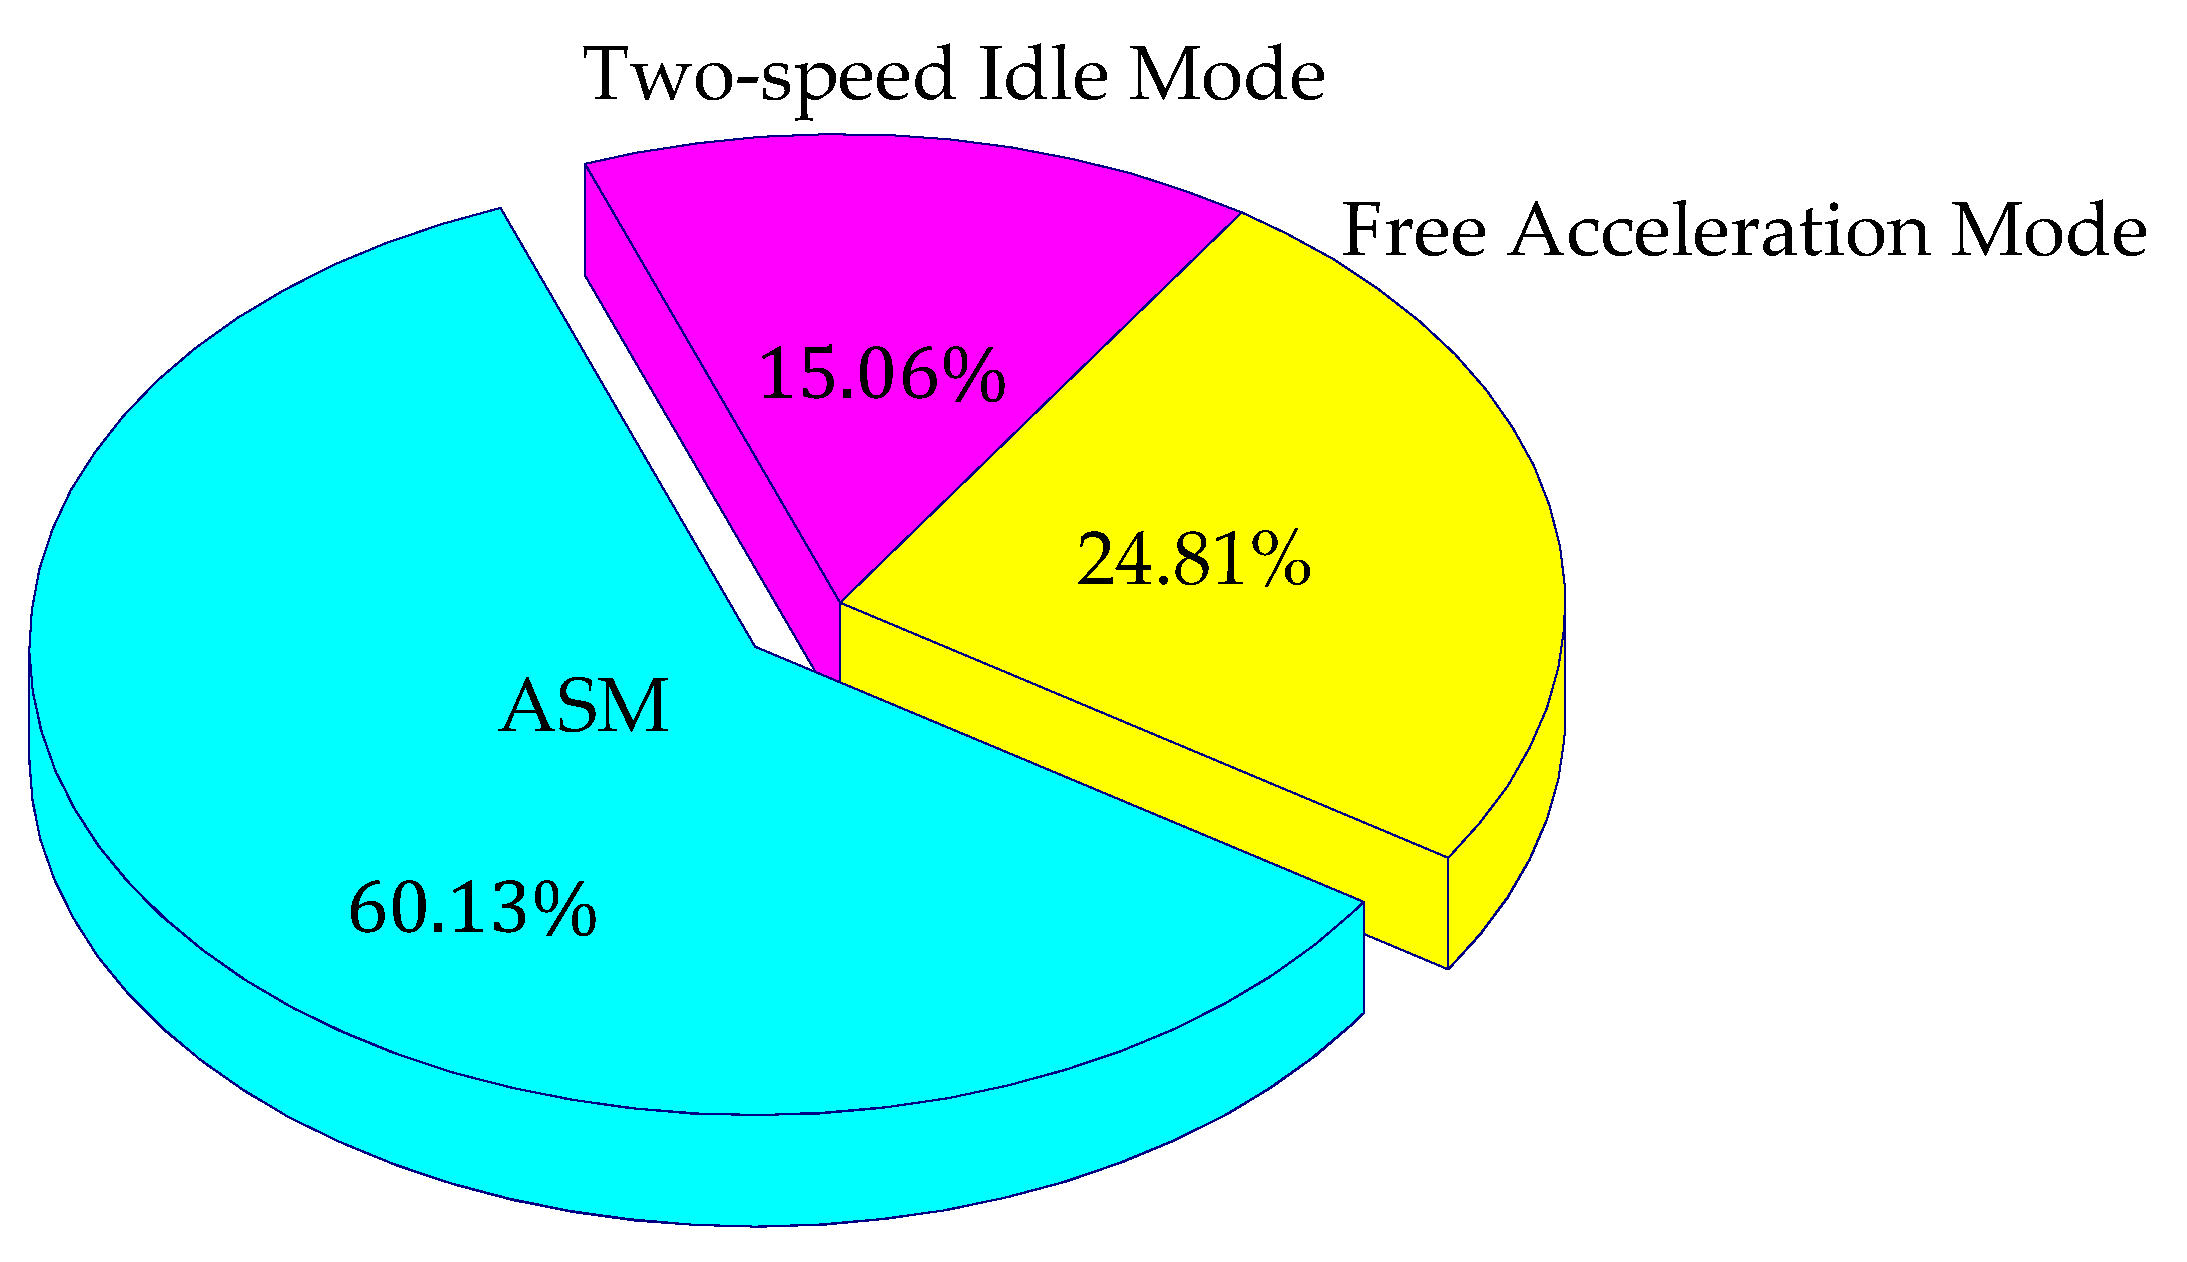
3.1. Overall UR
3.2. Comparative Analysis of UR
3.2.1. Under Different Test Conditions
3.2.2. Under Same Test Conditions
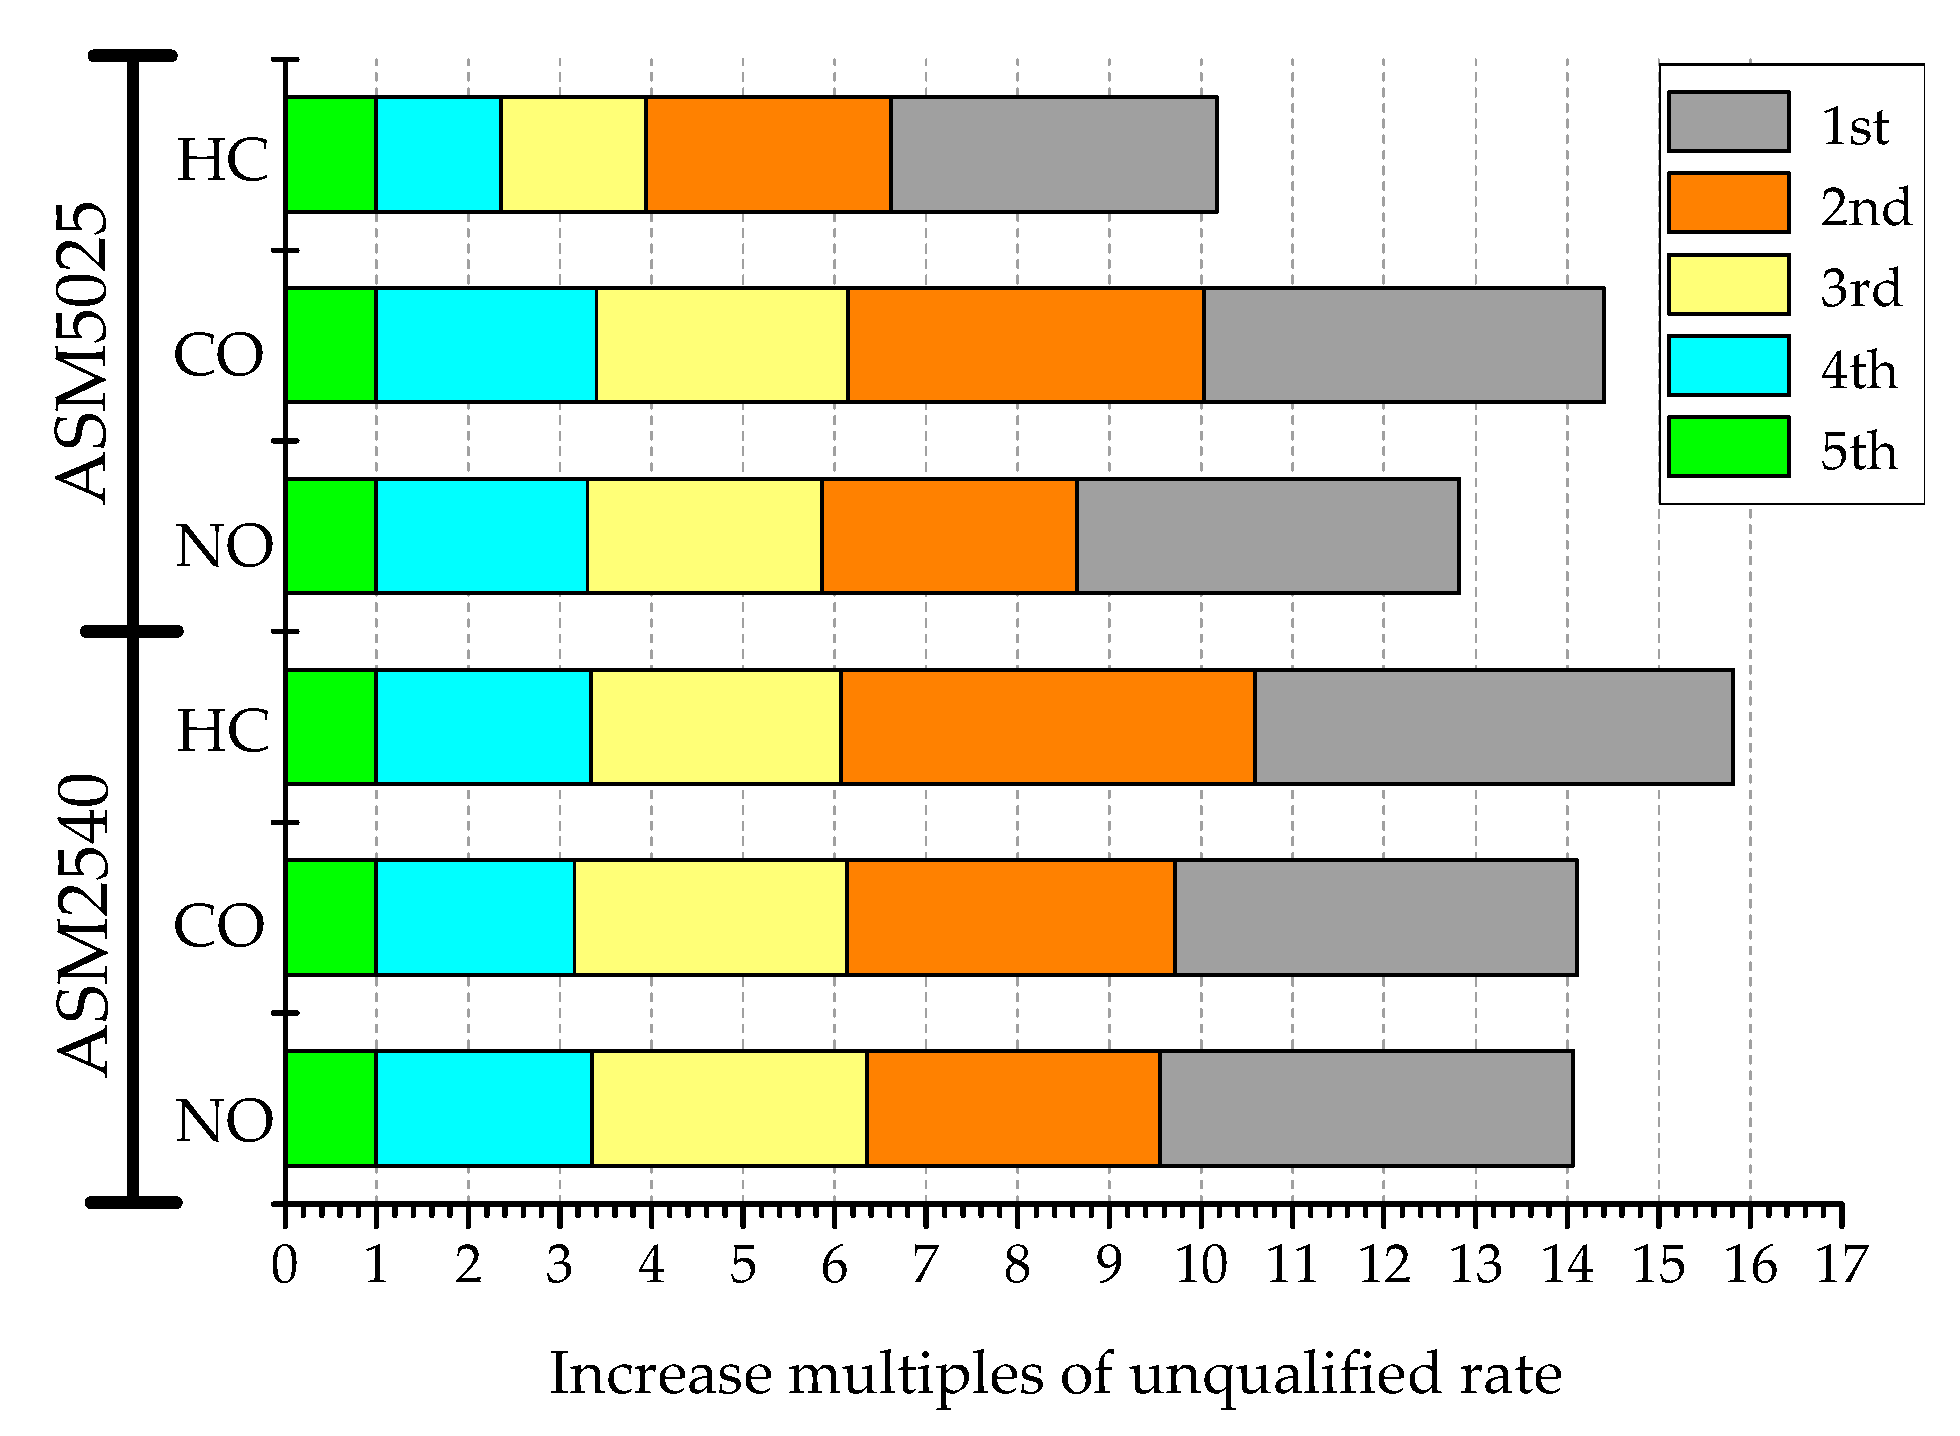
3.3. Average and Variation
3.4. Emission Standard Revision
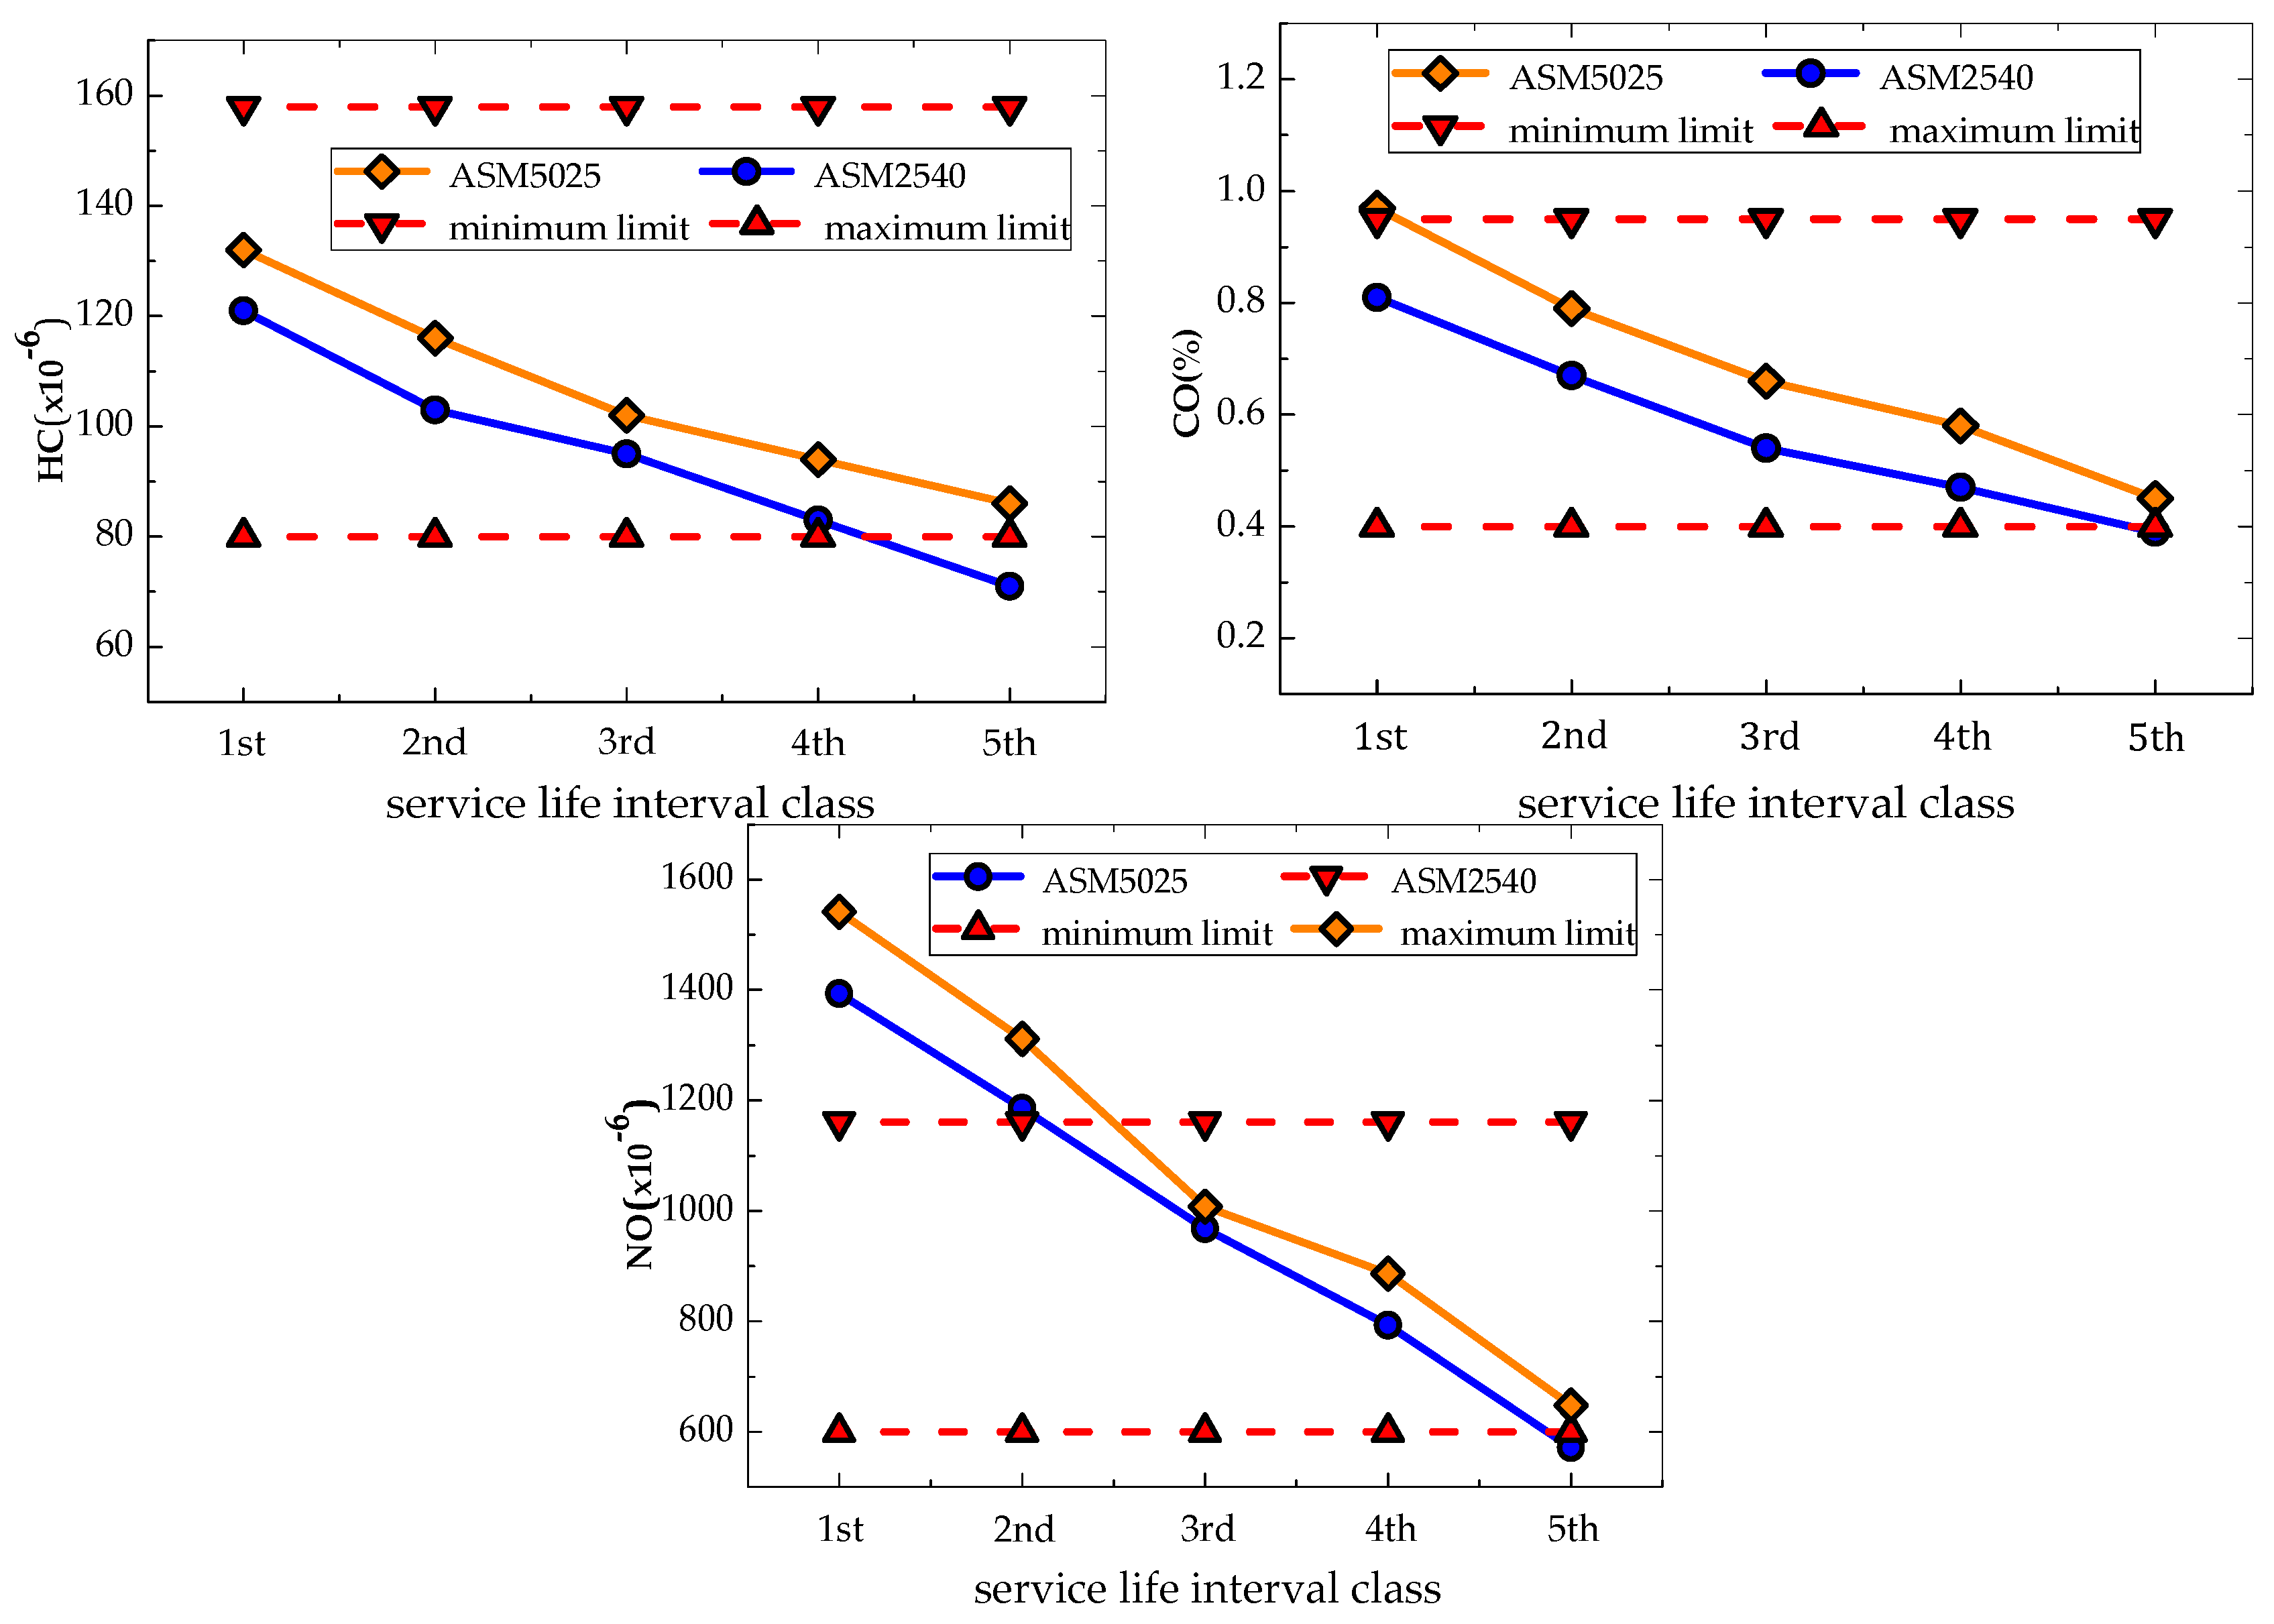
3.4.1. Pre-Revised Limits Comparison of NO
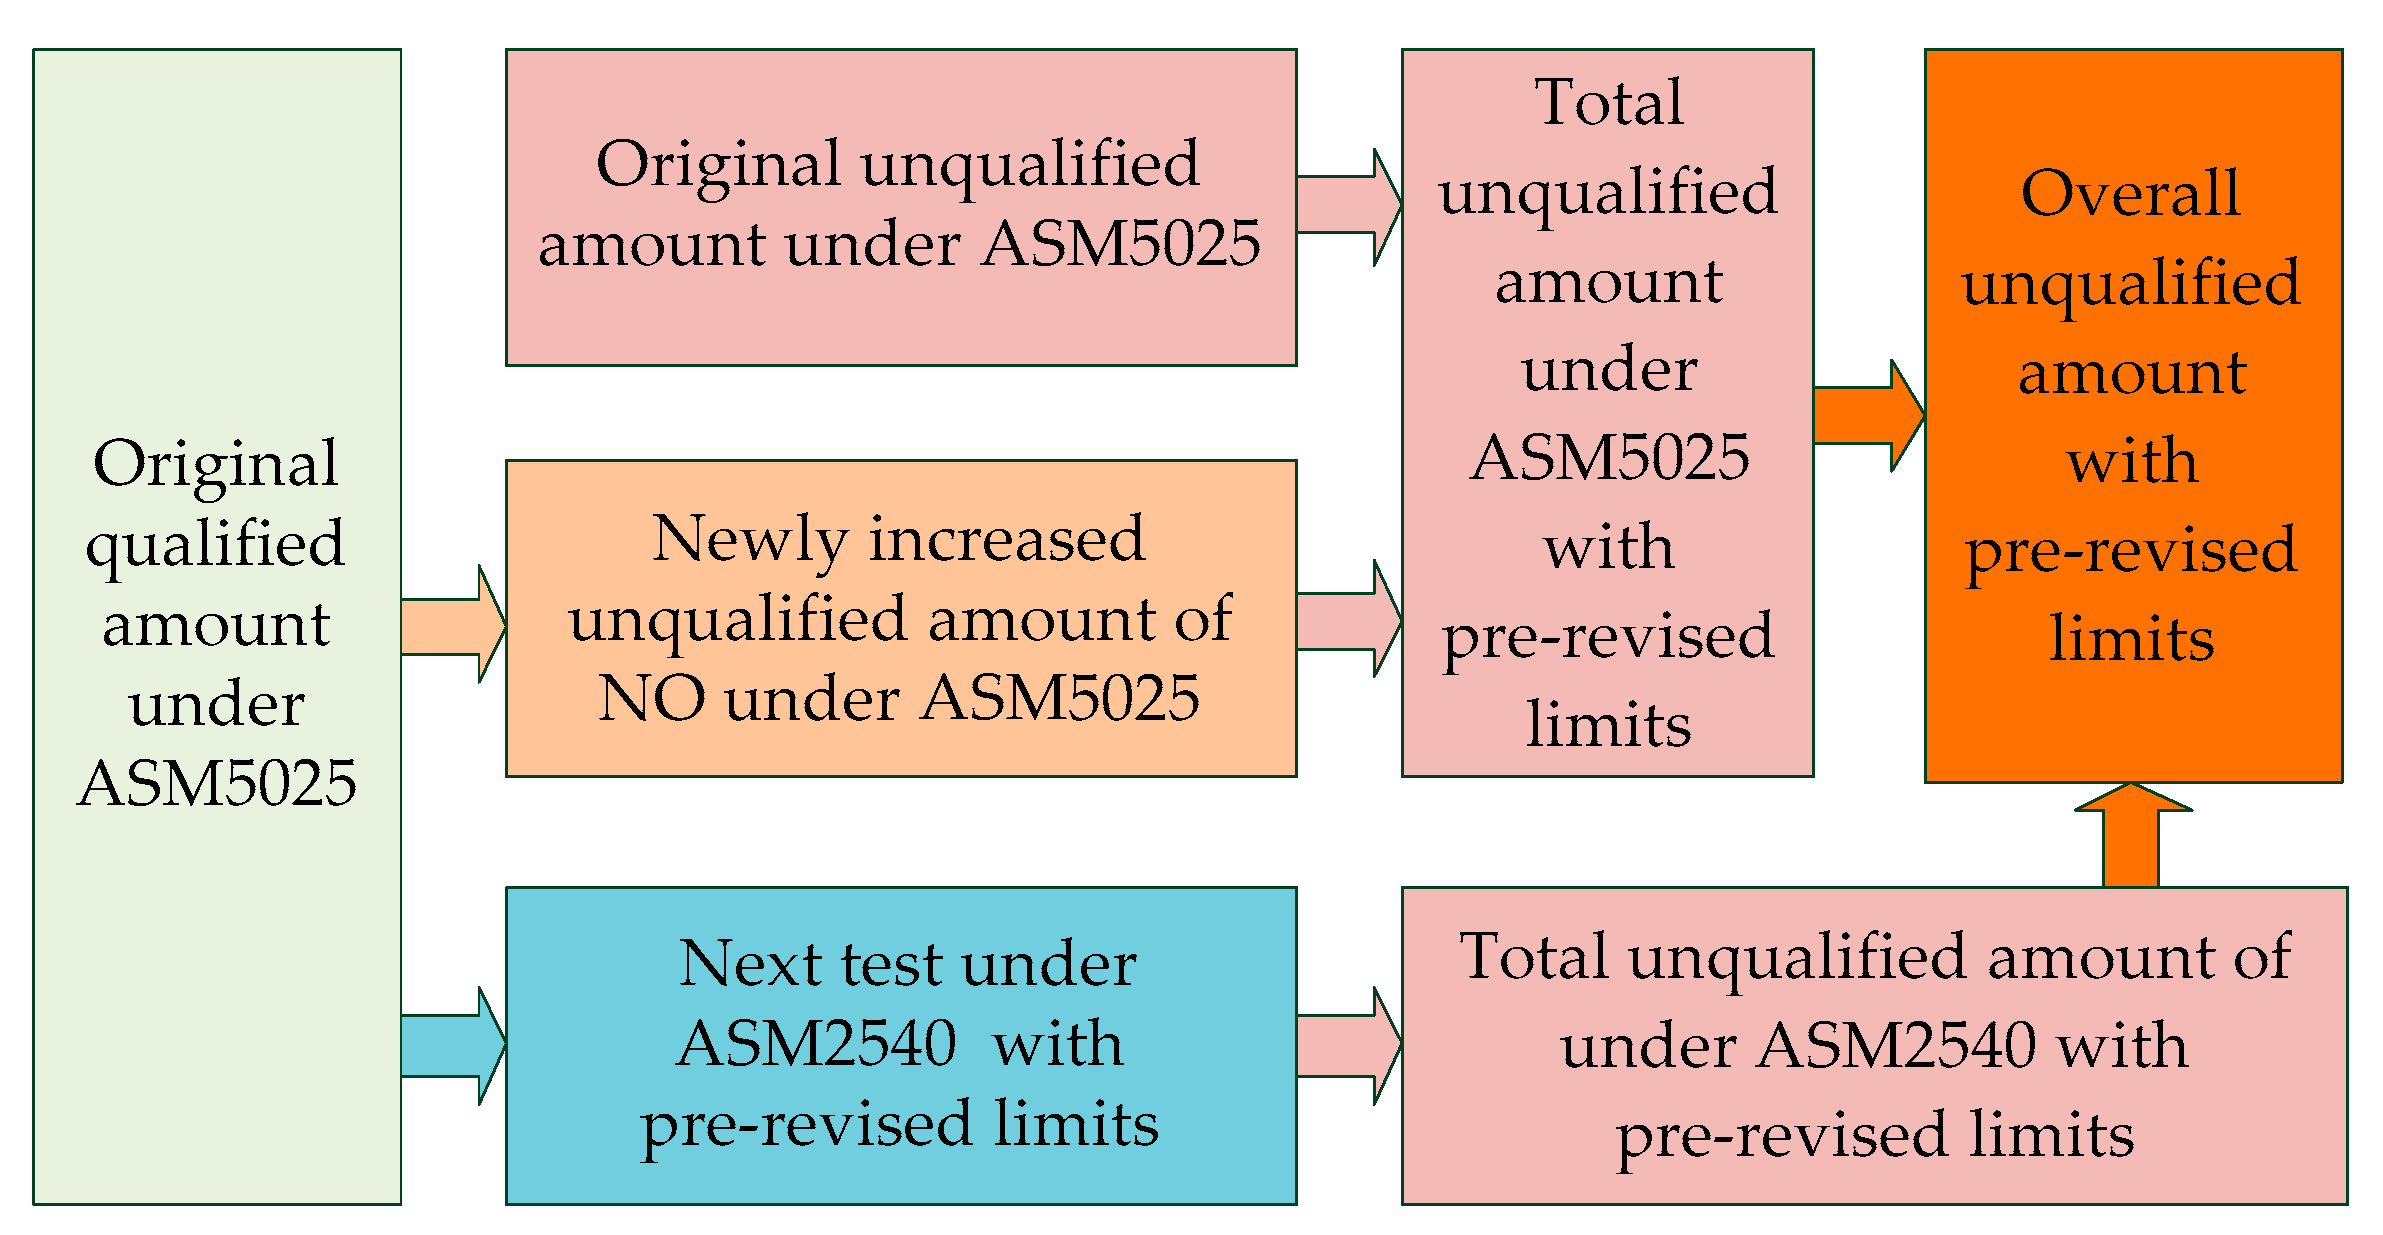
3.4.2. UR Prediction Based on the Pre-Revised Limits
3.4.3. UR Prediction Based on the Revised Standard
4. Conclusions
Acknowledgments
Author Contributions
Conflicts of Interest
Abbreviations
| MEPOPRC | Ministry of the Environmental Protection of the People’s Republic of China |
| CO2 | carbon dioxide |
| CO | carbon monoxide |
| NOx | nitrogen oxide |
| ASM | acceleration simulation mode |
| EPL | exhaust pollutants limits |
| HC | hydrocarbon |
| NO | nitric oxide |
| RM | reference mass |
| UR | unqualified rate |
| UA | unqualified amount |
References
- Liu, H.; Wang, Y.; Chen, X.; Han, S. Vehicle emission and near-road air quality modeling in Shanghai, China, based on taxi GPS data and MOVES revised emission inventory. Transp. Res. Rec. 2013, 2340, 38–48. [Google Scholar] [CrossRef]
- Li, H.L.; Chu, J.W.; Li, J.L.; Cui, P.F.; Wang, Z.Z. Energy recovery data characteristics extraction of flywheel energy storage control system for vehicular applications. Adv. Mech. Eng. 2017, 4. [Google Scholar] [CrossRef]
- Zhang, S.; Wu, Y.; Wu, X.; Li, M.; Ge, Y.; Liang, B.; Xu, Y.; Zhou, Y.; Liu, H.; Fu, L.; et al. Historic and future trends of vehicle emissions in Beijing, 1998–2020: A policy assessment for the most stringent vehicle emission control program in China. Atmos. Environ. 2014, 89, 216–229. [Google Scholar] [CrossRef]
- Cai, B.; Cao, D.; Liu, L.; Zhang, Z.; Zhou, Y. Study on Road Transportation CO2 Emission in China. China Energy 2011, 33, 26–30. [Google Scholar]
- Sadri, A.; Ardehali, M.M.; Amirnekooei, K. General Procedure for Long-term Energy-Environmental Planning for Transportation Sector of Developing Countries with Limited Data based on LEAP (long-range energy alternative planning and Energy PLAN. Energy 2014, 77, 831–843. [Google Scholar] [CrossRef]
- Franco, V.; Kousoulidou, M.; Muntean, M.; Ntziachristos, L.; Hausberger, S.; Dilara, P. Road vehicle emission factors development: A review. Atmos. Environ. 2013, 70, 84–97. [Google Scholar] [CrossRef]
- Bing, X.; Jiang, Y.; Zhang, C.; Zhang, Y.; Lu, J. Effects of intersection lane configuration on traffic emissions. Adv. Transp. Stud. 2014, 32, 23–36. [Google Scholar]
- Boroujeni, B.Y.; Frey, H.C. Road grade quantification based on global positioning system data obtained from real-world vehicle fuel use and emissions measurements. Atmos. Environ. 2014, 85, 179–186. [Google Scholar] [CrossRef]
- Chan, L.Y.; Chu, K.W.; Zou, S.C.; Chan, C.Y.; Wang, X.M.; Barletta, B.; Donald, R.B.; Guo, H.; Tsai, W.Y. Characteristics of nonmethane hydrocarbons (NMHCs) in industrial, industrial-urban, and industrial-suburban atmospheres of the Pearl River Delta (PRD) region of south China. J. Geophys. Res. 2006, 111, 1937–1952. [Google Scholar] [CrossRef]
- Wang, C.; Wang, B.G.; Zhong, L.J.; Feng, Z.C.; Feng, A.M. Motor vehicle emission control measures in Pearl River Delta. Environ. Sci. Technol. 2009, 6, 195–199. [Google Scholar]
- Javid, R.J.; Nejat, A.; Hayhoe, K. Selection of CO2 mitigation strategies for road transportation in the United States using a multi-criteria approach. Renew. Sustain. Energy Rev. 2014, 38, 960–972. [Google Scholar] [CrossRef]
- Rhys-Tyler, G.A.; Bell, M.C. Toward reconciling instantaneous roadside measurements of light duty vehicle exhaust emissions with type approval driving cycles. Environ. Sci. Technol. 2012, 19, 10532–10538. [Google Scholar] [CrossRef] [PubMed]
- Song, X.Y.; Xie, S.D. Development of Vehicular Emission Inventory in China. Environ. Sci. 2006, 6, 1041–1045. [Google Scholar]
- Liu, H.; He, K.B.; Wang, Q.D. Vehicular emissions inventory and influencing factors in Tianjin. J. Tsinghua Univ. Sci. Technol. 2008, 3, 370–373. [Google Scholar]
- Wang, H.K.; Chen, C.H.; Huang, C.; Fu, L.X. On-road vehicle emission inventory and its uncertainty analysis for Shanghai, China. Sci. Total. Environ. 2008, 1, 60–67. [Google Scholar] [CrossRef] [PubMed]
- Mao, X.Q.; Ma, G.H.; Liu, Q.; Xing, Y.K. An environmental effect analysis for the application of European emission standards of motor vehicle in Beijing. Environ. Sci. Technol. 2011, 5, 193–198. [Google Scholar]
- Guo, X.R.; Ji, M.S.; Lang, J.L.; Chen, D.S.; Cheng, S.Y. Based on the scenario analysis of Beijing motor vehicle emission control research. China Environ. Sci. 2013, 9, 1690–1696. [Google Scholar]
- Ji, L.; Yuan, Y.; Li, G.; Wu, X.F. Study on Emission reduction effect of motor vehicle emission standards in China. Environ. Eng. 2011, 2, 237–242. [Google Scholar]
- Huo, H.; Zhang, Q.; He, K.B.; Yao, Z.L.; Wang, X.T.; Zheng, B.; David, G.S.; Wang, Q.D.; Ding, Y. Modeling vehicle emissions in different types of Chinese cities: Importance of vehicle fleet and local features. Environ. Pollut. 2011, 10, 2954–2960. [Google Scholar] [CrossRef] [PubMed]
- Wang, C.; Cai, W.; Lu, X.; Chen, J. CO2 mitigation scenarios in China’s road transport sector. Energy Convers. Manag. 2007, 48, 2110–2118. [Google Scholar] [CrossRef]
- Hong, S.; Chung, Y.; Kim, J.; Chun, D. Analysis on the level of contribution to the national greenhouse gas reduction target in Korean transportation sector using LEAP model. Renew. Sustain. Energy Rev. 2016, 60, 549–559. [Google Scholar] [CrossRef]
- Giechaskiel, B.; Mamakos, A.; Andersson, J.; Dilara, P.; Martini, G.; Schindler, W.; Bergmann, A. Measurement of automotive nonvolatile particle number emissions within the European legislative framework: A review. Aerosol Sci. Technol. 2012, 7, 719–749. [Google Scholar] [CrossRef]
- Liu, Y.H.; Bi, S.Y.; Zhou, B.; Wang, C.; Liao, H.B.; Li, L.; Cai, M. Study on vehicular emission reduction effect of traffic control in Foshan central district. China Environ. Sci. 2010, 11, 1563–1567. [Google Scholar]
- Li, X.X.; Sun, G.J.; Tian, W.L.; Zhang, Q.Y. Study on abatement policy of NOx emission from vehicles in Hangzhou during 12th Five-Year Plan. China Environ. Sci. 2012, 8, 1416–1421. [Google Scholar]
- Park, S.; Lee, J.B.; Lee, C. State-of-the-art automobile emissions models and applications in North America and Europe for sustainable transportation. KSCE J. Civ. Eng. 2016, 3, 1053–1065. [Google Scholar] [CrossRef]
- Cai, H.; Xie, S.D. Estimation of vehicular emission inventories in China from 1980 to 2005. Atmos. Environ. 2007, 39, 8963–8979. [Google Scholar] [CrossRef]
- Li, L.; Du, L.L.; Zhang, J. Analysis and control of excessive vehicle exhaust emission in Xi’an. Environ. Eng. 2014, 1, 478–481. [Google Scholar]
- Cai, H.; Xie, S.D. Determination of emission factors from motor vehicles under different emission standards in China. Acta Sci. Nat. Univ. Peking. 2010, 3, 319–326. [Google Scholar]
- Wyatt, D.W.; Li, H.; Tate, J.E. The impact of road grade on carbon dioxide (CO2) emission of a passenger vehicle in real-world driving. Transp. Res. Part D 2014, 32, 160–170. [Google Scholar] [CrossRef]
- Ministry of Environmental Protection of the People’s Republic of China. Principle and Method of Confirm Limits for Exhaust Pollutants from In-Use Vehicle Equipped Ignition Engine under Simple Driving Mode Conditions; China Environmental Publishing: Beijing, China, 2005.
- Li, Y.; Bao, L.; Li, W.X.; Deng, H.P. Inventory and Policy Reduction Potential of Greenhouse Gas and Pollutant Emissions of Road Transportation Industry in China. Sustainability 2016, 12, 1218. [Google Scholar] [CrossRef]
- Zhang, Y.; Wu, W.; Li, Y.; Liu, Q.; Li, C. Does the Built Environment Make a Difference? An Investigation of Household Vehicle Use in Zhongshan Metropolitan Area, China. Sustainability 2014, 6, 4910–4930. [Google Scholar] [CrossRef]
- Zhang, Q.Y.; Wei, Y.M.; Tian, W.L. Impact of national vehicle emission standards on vehicle pollution emission factors. Res. Environ. Sci. 2015, 5, 606–612. [Google Scholar]
- Wang, H.; Yu, L.; Hao, H.; Song, G.; Guo, Y. Calculation of vehicle specification power for heavy-duty vehicles. SAFE Environ. Eng. 2011, 18, 124–128. [Google Scholar]
- Ministry of Environmental Protection of the People’s Republic of China; General Administration of Quality Supervision Inspection and Quarantine of the People’s Republic of China. Limits and Measurement Method for Exhaust Pollutants from Compression Ignition and Gas Fuelled Positive Ignition Engines of Vehicles (III, IV, V); China Environmental Publishing: Beijing, China, 2005.
- Department of Environmental Protection of Hei Longjiang Province; Hei Longjiang Bureau of Quality and Technical Supervision. Limits for Exhaust Pollutants from In-Use Vehicles Equipped Ignition Engine under Steady-State Loaded Mode Conditions; Hei Longjiang Environmental Publishing: Harbin, China, 2006.
- Xu, Y.; Yu, L.; Song, G. VSP-Bin division for light-duty vehicles oriented to carbon dioxide. Acta Sci. Circumst. 2010, 30, 1358–1365. [Google Scholar]
- Prati, M.V.; Costagliola, M.A.; Tommasino, C.; Della Ragione, L.; Meccariello, G. Road Grade Influence on the Exhaust Emissions of a Scooter Fuelled with Bioethanol/Gasoline Blends. Transp. Res. Procedia 2014, 3, 790–799. [Google Scholar] [CrossRef]


| Interval Class | Classification Conditions of Service Life Interval | Service Life | National Standard | Analog Standard |
|---|---|---|---|---|
| 1st | Registration date before 15 April 2001 | >12 | --- | --- |
| 2nd | Registration date between 16 April 2001and 30 June 2004 | 9–12 | GB 18352.1-2001 China I | Euro I |
| 3rd | Registration date between 1 July 2004 and 30 June 2007 | 6–8 | GB 18352.2-2001 China II | Euro II |
| 4th | Registration date between 1 July 2007 and 30 June 2011 | 1.5–5 | GB 18352.3-2005 China III, IV | Euro III |
| 5th | Registration date between 1 July 2011 and 31 December 2012 | <1.5 | Euro IV |
| RM (kg) | Class I | Class II | ||||||||||
|---|---|---|---|---|---|---|---|---|---|---|---|---|
| ASM5025 | ASM2540 | ASM5025 | ASM2540 | |||||||||
| HC (×10−6) | CO (%) | NO (×10−6) | HC (×10−6) | CO (%) | NO (×10−6) | HC (×10−6) | CO (%) | NO (×10−6) | HC (×10−6) | CO (%) | NO (×10−6) | |
| RM ≤ 1020 | 175 | 1.75 | 3400 | 170 | 2.15 | 3150 | 175 | 0.95 | 1400 | 170 | 1.05 | 1275 |
| 1020 < RM ≤ 1250 | 145 | 1.45 | 2750 | 140 | 1.80 | 2700 | 145 | 0.80 | 1150 | 140 | 0.85 | 1025 |
| 1250 < RM ≤ 1470 | 130 | 1.30 | 2450 | 125 | 1.65 | 2275 | 130 | 0.75 | 1000 | 125 | 0.80 | 925 |
| 1470 < RM ≤ 1700 | 120 | 1.20 | 2175 | 115 | 1.45 | 2025 | 120 | 0.65 | 900 | 115 | 0.75 | 825 |
| 1700 < RM ≤ 1930 | 100 | 1.00 | 1800 | 100 | 1.20 | 1675 | 100 | 0.60 | 750 | 100 | 0.60 | 675 |
| 1930 < RM ≤ 2150 | 90 | 0.90 | 1650 | 90 | 1.15 | 1500 | 90 | 0.50 | 675 | 90 | 0.55 | 625 |
| 2150 < RM ≤ 2500 | 85 | 0.85 | 1400 | 80 | 1.00 | 1300 | 85 | 0.45 | 575 | 80 | 0.50 | 525 |
| Interval Class | ASM5025 | ASM2540 | ||||||||||||
|---|---|---|---|---|---|---|---|---|---|---|---|---|---|---|
| Test Samples | HC | CO | NO | Test Samples | HC | CO | NO | |||||||
| UA | UR (%) | UA | UR (%) | UA | UR (%) | UA | UR (%) | UA | UR (%) | UA | UR (%) | |||
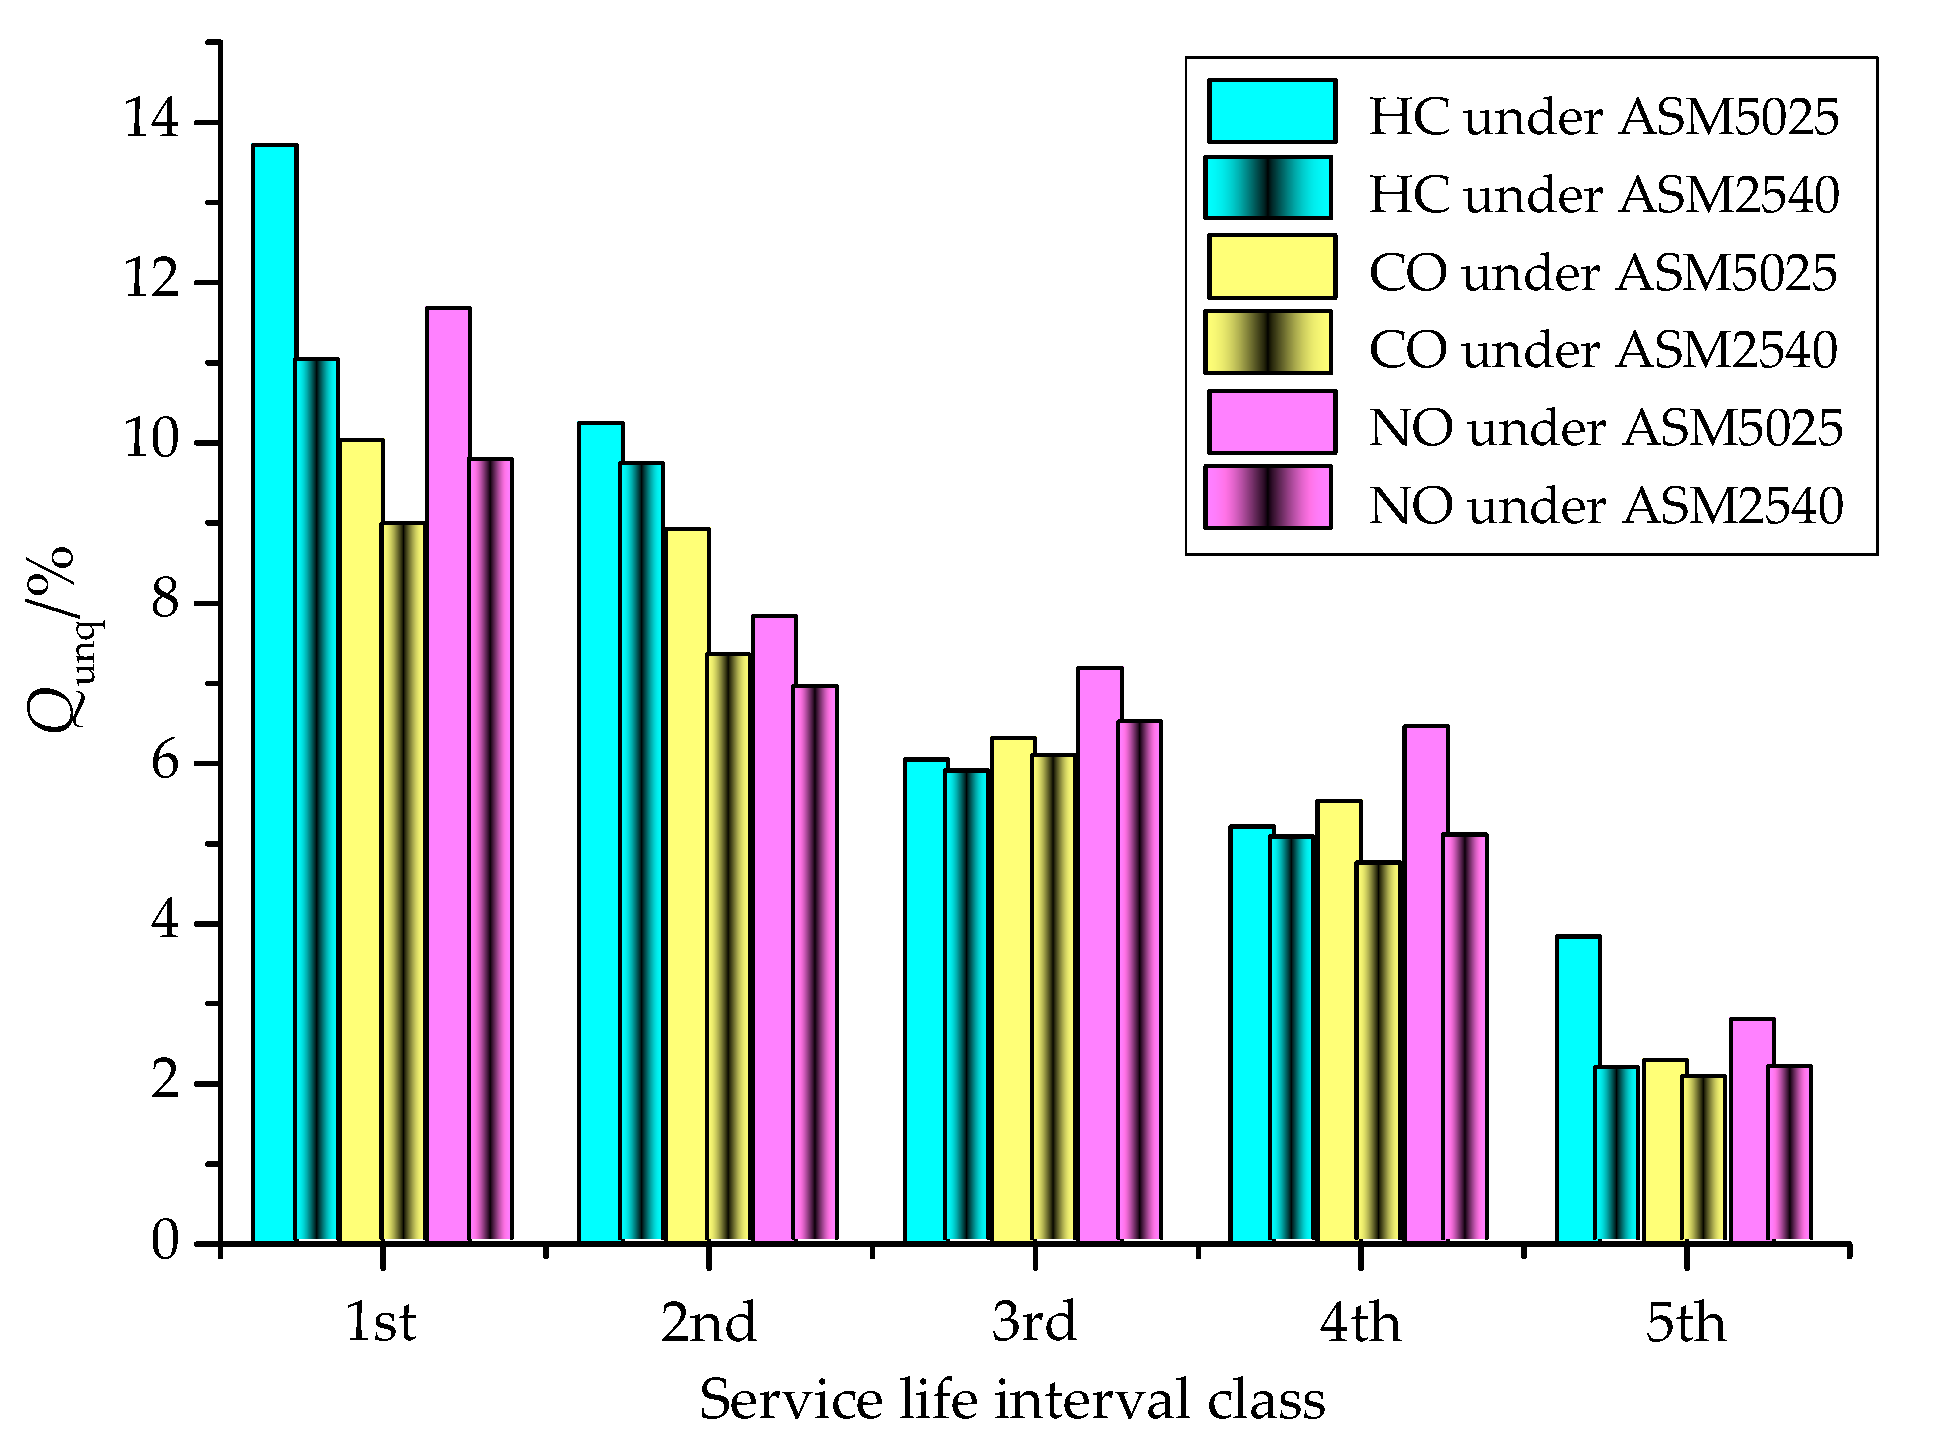
| 1st | 4738 | 650 | 13.72 | 440 | 10.04 | 553 | 11.68 | 3305 | 365 | 11.03 | 296 | 8.96 | 323 | 9.77 |
| 2nd | 7675 | 787 | 10.25 | 685 | 8.93 | 602 | 7.84 | 6214 | 604 | 9.72 | 455 | 7.32 | 431 | 6.93 |
| 3rd | 13,847 | 838 | 6.05 | 875 | 6.32 | 996 | 7.19 | 12,731 | 747 | 5.87 | 771 | 6.06 | 825 | 6.48 |
| 4th | 28,964 | 1509 | 5.21 | 1602 | 5.53 | 1871 | 6.46 | 28,347 | 1429 | 5.04 | 1335 | 4.71 | 1437 | 5.07 |
| 5th | 391 | 15 | 3.84 | 9 | 2.30 | 11 | 2.81 | 369 | 8 | 2.15 | 8 | 2.04 | 8 | 2.16 |
| Total | 55,615 | 3799 | 6.83 | 3611 | 6.49 | 4033 | 7.25 | 50,966 | 3153 | 6.19 | 2865 | 5.62 | 3024 | 5.93 |
| Interval Class | 1st | 2nd | 3rd | 4th | 5th | |
|---|---|---|---|---|---|---|
| ASM5025 | HC | 3.57 | 2.67 | 1.58 | 1.36 | 1.00 (3.84%) |
| CO | 4.37 | 3.88 | 2.75 | 2.40 | 1.00 (2.30%) | |
| NO | 4.17 | 2.79 | 2.56 | 2.30 | 1.00 (2.81%) | |
| ASM2540 | HC | 5.22 | 4.52 | 2.73 | 2.34 | 1.00 (2.15%) |
| CO | 4.39 | 3.59 | 2.97 | 2.16 | 1.00 (2.04%) | |
| NO | 4.52 | 3.20 | 3.00 | 2.35 | 1.00 (2.16%) | |
| Interval Class | ASM5025 | ASM2540 | ||||
|---|---|---|---|---|---|---|
| HC (×10−6) | CO (%) | NO (×10−6) | HC (×10−6) | CO (%) | NO (×10−6) | |
| 1st | 132 | 0. 97 | 1542 | 121 | 0.81 | 1394 |
| 2nd | 116 | 0.79 | 1312 | 103 | 0.67 | 1186 |
| 3rd | 102 | 0.66 | 1008 | 95 | 0.54 | 968 |
| 4th | 94 | 0.58 | 887 | 83 | 0.47 | 793 |
| 5th | 86 | 0.45 | 648 | 71 | 0.39 | 571 |
| Average Value of Limit (RM ≤ 2500 kg) | Minimum Limit (▼) | Maximum Limit (▲) | ||||||||||
|---|---|---|---|---|---|---|---|---|---|---|---|---|
| ASM5025 | ASM2540 | ASM5025 | ASM2540 | |||||||||
| HC (×10−6) | CO (%) | NO (×10−6) | HC (×10−6) | CO (%) | NO (×10−6) | HC (×10−6) | CO (%) | NO (×10−6) | HC (×10−6) | CO (%) | NO (×10−6) | |
| Class I | 159 | 1.48 | 2735 | 157 | 1.96 | 2557 | 83 | 0.9 | 1729 | 77 | 1.0 | 1593 |
| Class II | 159 | 0.9 | 1214 | 157 | 1.0 | 1107 | 83 | 0.4 | 629 | 77 | 0.4 | 570 |
| Average Limit | HC (×10−6) | CO (%) | NO (×10−6) | HC (×10−6) | CO (%) | NO (×10−6) | ||||||
| Class I | 158 | 1.72 | 2646 | 80 | 0.95 | 1665 | ||||||
| Class II | 158 | 0.95 | 1160.5 | 80 | 0.4 | 600 | ||||||
| Testing Method | Vehicles Amount | Ratio (%) | Individual Unqualified Rate (%) | Total Unqualified Rate (%) | |||||
|---|---|---|---|---|---|---|---|---|---|
| ASM | 57,997 | 57.00 | ASM5025 | ASM2540 | 8.55 | ||||
| HC | CO | NO | HC | CO | NO | ||||
| 3.83 | 2.04 | 3.28 | 1.02 | 0.36 | 1.70 | ||||
| 6.41 | 2.14 | ||||||||
| RM (kg) | ASM5025 | ASM2540 | ||||
|---|---|---|---|---|---|---|
| HC (10−6) | CO (%) | NO (10−6) | HC (10−6) | CO (%) | NO (10−6) | |
| RM ≤ 1020 | 180 | 1.5 | 2800/3200/2600 | 170 | 1.6 | 2500/3000/2400 |
| 1020 < RM ≤ 1250 | 170 | 1.3 | 2300/2800/2100 | 160 | 1.4 | 2100/2600/2000 |
| 1250 < RM ≤ 1470 | 150 | 1.1 | 2100/2400/1900 | 150 | 1.2 | 2000/2300/1750 |
| 1470 < RM ≤ 1700 | 130 | 1.0 | 1800/2100/1700 | 130 | 1.1 | 1600/2000/1550 |
| 1700 < RM ≤ 1930 | 120 | 0.9 | 1600/1800/1400 | 120 | 1.0 | 1500/1600/1300 |
| 1930 < RM ≤ 2150 | 110 | 0.8 | 1400/1600/1300 | 110 | 0.9 | 1300/1400/1150 |
| 2150 < RM ≤ 2500 | 100 | 0.7 | 1200/1300/1100 | 100 | 0.8 | 1100/1200/1000 |
| Average Limit | 1886/2171/1726 | Average Limit | 1729/2014/1600 | |||
| RM (kg) | ASM5025 | ASM2540 | ||||
|---|---|---|---|---|---|---|
| HC (10−6) | CO (%) | NO (10−6) | HC (10−6) | CO (%) | NO (10−6) | |
| RM ≤ 1020 | 150 | 0.9 | 1000/1300/950 | 140 | 1.0 | 900/1200/850 |
| 1020 < RM ≤ 1250 | 130 | 0.8 | 900/1100/800 | 120 | 0.9 | 800/1000/700 |
| 1250 < RM ≤ 1470 | 120 | 0.7 | 800/1000/700 | 110 | 0.8 | 700/900/650 |
| 1470 < RM ≤ 1700 | 110 | 0.6 | 700/900/600 | 100 | 0.7 | 650/800/550 |
| 1700 < RM ≤ 1930 | 100 | 0.5 | 600/700/500 | 90 | 0.6 | 550/650/450 |
| 1930 < RM ≤ 2150 | 90 | 0.4 | 500/600/450 | 80 | 0.5 | 450/550/450 |
| 2150 < RM ≤ 2500 | 90 | 0.4 | 450/500/400 | 80 | 0.5 | 400/450/350 |
| Average Limit | 707/871/629 | Average Limit | 636/793/571 | |||
| RM (kg) | ASM5025 | ASM2540 | ||||||
|---|---|---|---|---|---|---|---|---|
| Original Limits | Pre-Revised Limits | Tightened Proportion (%) | Unqualified Increment | Original Limits | Pre-Revised Limits | Tightened Proportion (%) | Unqualified Increment | |
| RM ≤ 1020 | 3200 | 2800 | 12.5 | 1 | 3000 | 2500 | 16.67 | 16 |
| 1020 < RM ≤ 1250 | 2800 | 2300 | 17.9 | 10 | 2600 | 2100 | 19.23 | 31 |
| 1250 < RM ≤ 1470 | 2400 | 2100 | 12.5 | 8 | 2300 | 2000 | 13.04 | 30 |
| 1470 < RM ≤ 1700 | 2100 | 1800 | 14.3 | 20 | 2000 | 1600 | 20.00 | 85 |
| 1700 < RM ≤ 1930 | 1800 | 1600 | 11.1 | 14 | 1600 | 1500 | 6.25 | 14 |
| 1930 < RM ≤ 2150 | 1600 | 1400 | 12.5 | 7 | 1400 | 1300 | 7.14 | 5 |
| 2150 < RM ≤ 2500 | 1300 | 1200 | 7.69 | 6 | 1200 | 1100 | 8.33 | 13 |
| Average tightened proportion (%) | 12.64 | 66 | Average tightened proportion (%) | 12.95 | 194 | |||
| Total tightened proportion: 12.80% | ||||||||
| Total unqualified increment: 270 | ||||||||
| RM (kg) | ASM5025 | ASM2540 | ||||||
|---|---|---|---|---|---|---|---|---|
| Original Limits | Pre-Revised Limits | Tightened Proportion (%) | Unqualified Increment | Original Limits | Pre-Revised Limits | Tightened Proportion (%) | Unqualified Increment | |
| RM ≤ 1020 | 1300 | 1000 | 23.08 | 421 | 1200 | 900 | 25.00 | 813 |
| 1020 < RM ≤ 1250 | 1100 | 900 | 18.18 | 599 | 1000 | 800 | 20.00 | 913 |
| 1250 < RM ≤ 1470 | 1000 | 800 | 20.00 | 1410 | 900 | 700 | 22.22 | 1501 |
| 1470 < RM ≤ 1700 | 900 | 700 | 22.20 | 716 | 800 | 650 | 18.75 | 537 |
| 1700 < RM ≤ 1930 | 700 | 600 | 14.29 | 336 | 650 | 550 | 15.38 | 212 |
| 1930 < RM ≤ 2150 | 600 | 500 | 16.67 | 283 | 550 | 450 | 18.18 | 171 |
| 2150 < RM ≤ 2500 | 500 | 450 | 10.00 | 132 | 450 | 400 | 11.11 | 90 |
| Average tightened proportion (%) | 17.78 | 4927 | Average tightened proportion (%) | 18.66 | 5434 | |||
| Total tightened proportion: 18.22% | ||||||||
| Total unqualified increment: 10,361 | ||||||||
| RM (kg) | ASM5025 | ASM2540 | ||||||
|---|---|---|---|---|---|---|---|---|
| Original Limits | Loosened up Limits | Tightened Proportion (%) | Unqualified Increment | Original Limits | Loosened up Limits | Tightened Proportion (%) | Unqualified Increment | |
| RM ≤ 1020 | 1300 | 1100 | 15.4 | 323 | 1200 | 1000 | 16.7 | 586 |
| 1020 < RM ≤ 1250 | 1100 | 1000 | 9.10 | 599 | 1000 | 900 | 10.0 | 913 |
| 1250 < RM ≤ 1470 | 1000 | 900 | 10.0 | 1410 | 900 | 800 | 11.1 | 1501 |
| 1470 < RM ≤ 1700 | 900 | 800 | 11.1 | 479 | 800 | 700 | 12.5 | 440 |
| 1700 < RM ≤ 1930 | 700 | 650 | 7.14 | 336 | 650 | 550 | 15.4 | 212 |
| 1930 < RM ≤ 2150 | 600 | 550 | 8.33 | 283 | 550 | 450 | 18.2 | 171 |
| 2150 < RM ≤ 2500 | 500 | 500 | 0.00 | 132 | 450 | 400 | 11.1 | 90 |
| Average tightened proportion (%) | 10.18 | 3562 | Average tightened proportion (%) | 13.57 | 3913 | |||
| Total tightened proportion: 11.88% | ||||||||
| Total unqualified increment: 7475 | ||||||||
© 2017 by the authors. Licensee MDPI, Basel, Switzerland. This article is an open access article distributed under the terms and conditions of the Creative Commons Attribution (CC BY) license (http://creativecommons.org/licenses/by/4.0/).
Share and Cite
Li, H.; Chu, J.; Li, J.; Wang, H.; Wang, S. Exhaust Pollutants Characteristic of In-Use Vehicles under Acceleration Simulation Mode and Emission Standard Revision for Hei Longjiang Province, China. Sustainability 2017, 9, 1430. https://doi.org/10.3390/su9081430
Li H, Chu J, Li J, Wang H, Wang S. Exhaust Pollutants Characteristic of In-Use Vehicles under Acceleration Simulation Mode and Emission Standard Revision for Hei Longjiang Province, China. Sustainability. 2017; 9(8):1430. https://doi.org/10.3390/su9081430
Chicago/Turabian StyleLi, Hongliang, Jiangwei Chu, Jialu Li, Haosong Wang, and Shengjun Wang. 2017. "Exhaust Pollutants Characteristic of In-Use Vehicles under Acceleration Simulation Mode and Emission Standard Revision for Hei Longjiang Province, China" Sustainability 9, no. 8: 1430. https://doi.org/10.3390/su9081430
APA StyleLi, H., Chu, J., Li, J., Wang, H., & Wang, S. (2017). Exhaust Pollutants Characteristic of In-Use Vehicles under Acceleration Simulation Mode and Emission Standard Revision for Hei Longjiang Province, China. Sustainability, 9(8), 1430. https://doi.org/10.3390/su9081430