Article

Curvilinear Relationship between Corporate Innovation and Environmental Sustainability

1
Meehan School of Business, Stonehill College, Easton, MA 02357, USA
2
Ewha School of Business, Ewha Womans University, Seoul 03760, Korea
*
Author to whom correspondence should be addressed.
Sustainability 2017, 9(7), 1267; https://doi.org/10.3390/su9071267
Submission received: 7 June 2017 / Revised: 3 July 2017 / Accepted: 11 July 2017 / Published: 20 July 2017

Abstract

:
This paper proposes and tests the impacts of firms’ innovation activities, such as patents, on their involvement in environmental sustainability, such as environmental performance. Combining resource allocation and eco-innovation perspectives assuming constant levels of trade-off costs, this study proposes diminishing trade-off costs between corporate innovation and environmental sustainability. Specifically, this research hypothesizes a U-shaped relationship, suggesting that a firm will suffer trade-off costs between innovation and environment-oriented activities up to a certain level, and that once a firm accumulates an adequate level of innovation, it may reduce trade-off costs, caring more for environmental issues. A proposed hypothesis is supported by empirical testing of a sample of 11,657 firm-year observations with 1564 firms, spanning from 1991 to 2010. We also found that corporate patenting activities are relevant to undesirable impacts on environmental performance overall, instead of satisfying outcomes. We suggest that firms and managers should care for environmental sustainability issues once they accumulate an adequate level of innovation assets through patenting activities.

1. Introduction

Do firms’ innovation activities affect their environmental sustainability? Researchers propose that corporate social responsibility (CSR) is highly correlated with innovation such as intangible assets and research and development or R&D activities [1,2,3]. However, there has been little research into the relationship between corporate innovation, CSR and environmental sustainability. In order to fill this gap, this paper proposes and tests the impacts of firms’ innovation activities, such as patenting, on their involvement in environmental sustainability, such as environmental performance.
Regarding this issue, two relevant but contradictory theoretical frameworks are considered: From the resource allocation approach [4,5,6,7], assuming budget constraints in each firm, corporations must choose either innovation or environmental sustainability. Thus, there will be negative relationships between a firm’s innovation and its environmental performance. Meanwhile, the eco-innovation approach [8,9,10], arguing effective management of both innovation and environmental issues, proposes that firms with higher-quality innovation will take better care of the environment. As such, the more innovative a firm is, the more environmentally friendly it will be.
In this paper, we integrate these seemingly contradictory theories of the relationship between innovation and environmental sustainability using a conceptual framework on contextual ambidexterity [11,12]. Specifically, combining resource allocation and eco-innovation perspectives, we hypothesize a U-shaped relationship, suggesting that a firm will suffer trade-off costs between innovation and environment-oriented activities up to a certain level, and that once a firm accumulates an adequate level of innovation, it may reduce trade-off costs, caring more for environmental issues. Unlike existing theoretical frames assuming constant levels of trade-off costs, this study proposes diminishing trade-off costs between corporate innovation and environmental sustainability, depending upon the levels of corporate innovation activities.
This paper is structured as follows. In the next section, we provide a conceptual framework in which we review two contrasting academic literatures on innovation and corporate sustainability. We also propose hypotheses with theoretical frames about the relationship between corporate innovation activities and environmental performance, using the mechanisms of trade-off costs. Then, data, research methods, and research findings are presented. In the final section, we discuss the results, and give some conclusions in this study and possible avenues for future research.

2. Theory and Hypotheses

Regarding the relationship between corporate innovation and environmentally sustainable activities, both the resource allocation and eco-innovation approach speak implicitly to assume trade-off costs between the two areas. Although both perspectives presume a constant trade-off relationship, positive or negative, this research proposes that the trade-off costs will be steadily decreased because of firms’ ambidextrous capacities, causing a curvilinear relationship between innovation and sustainability.

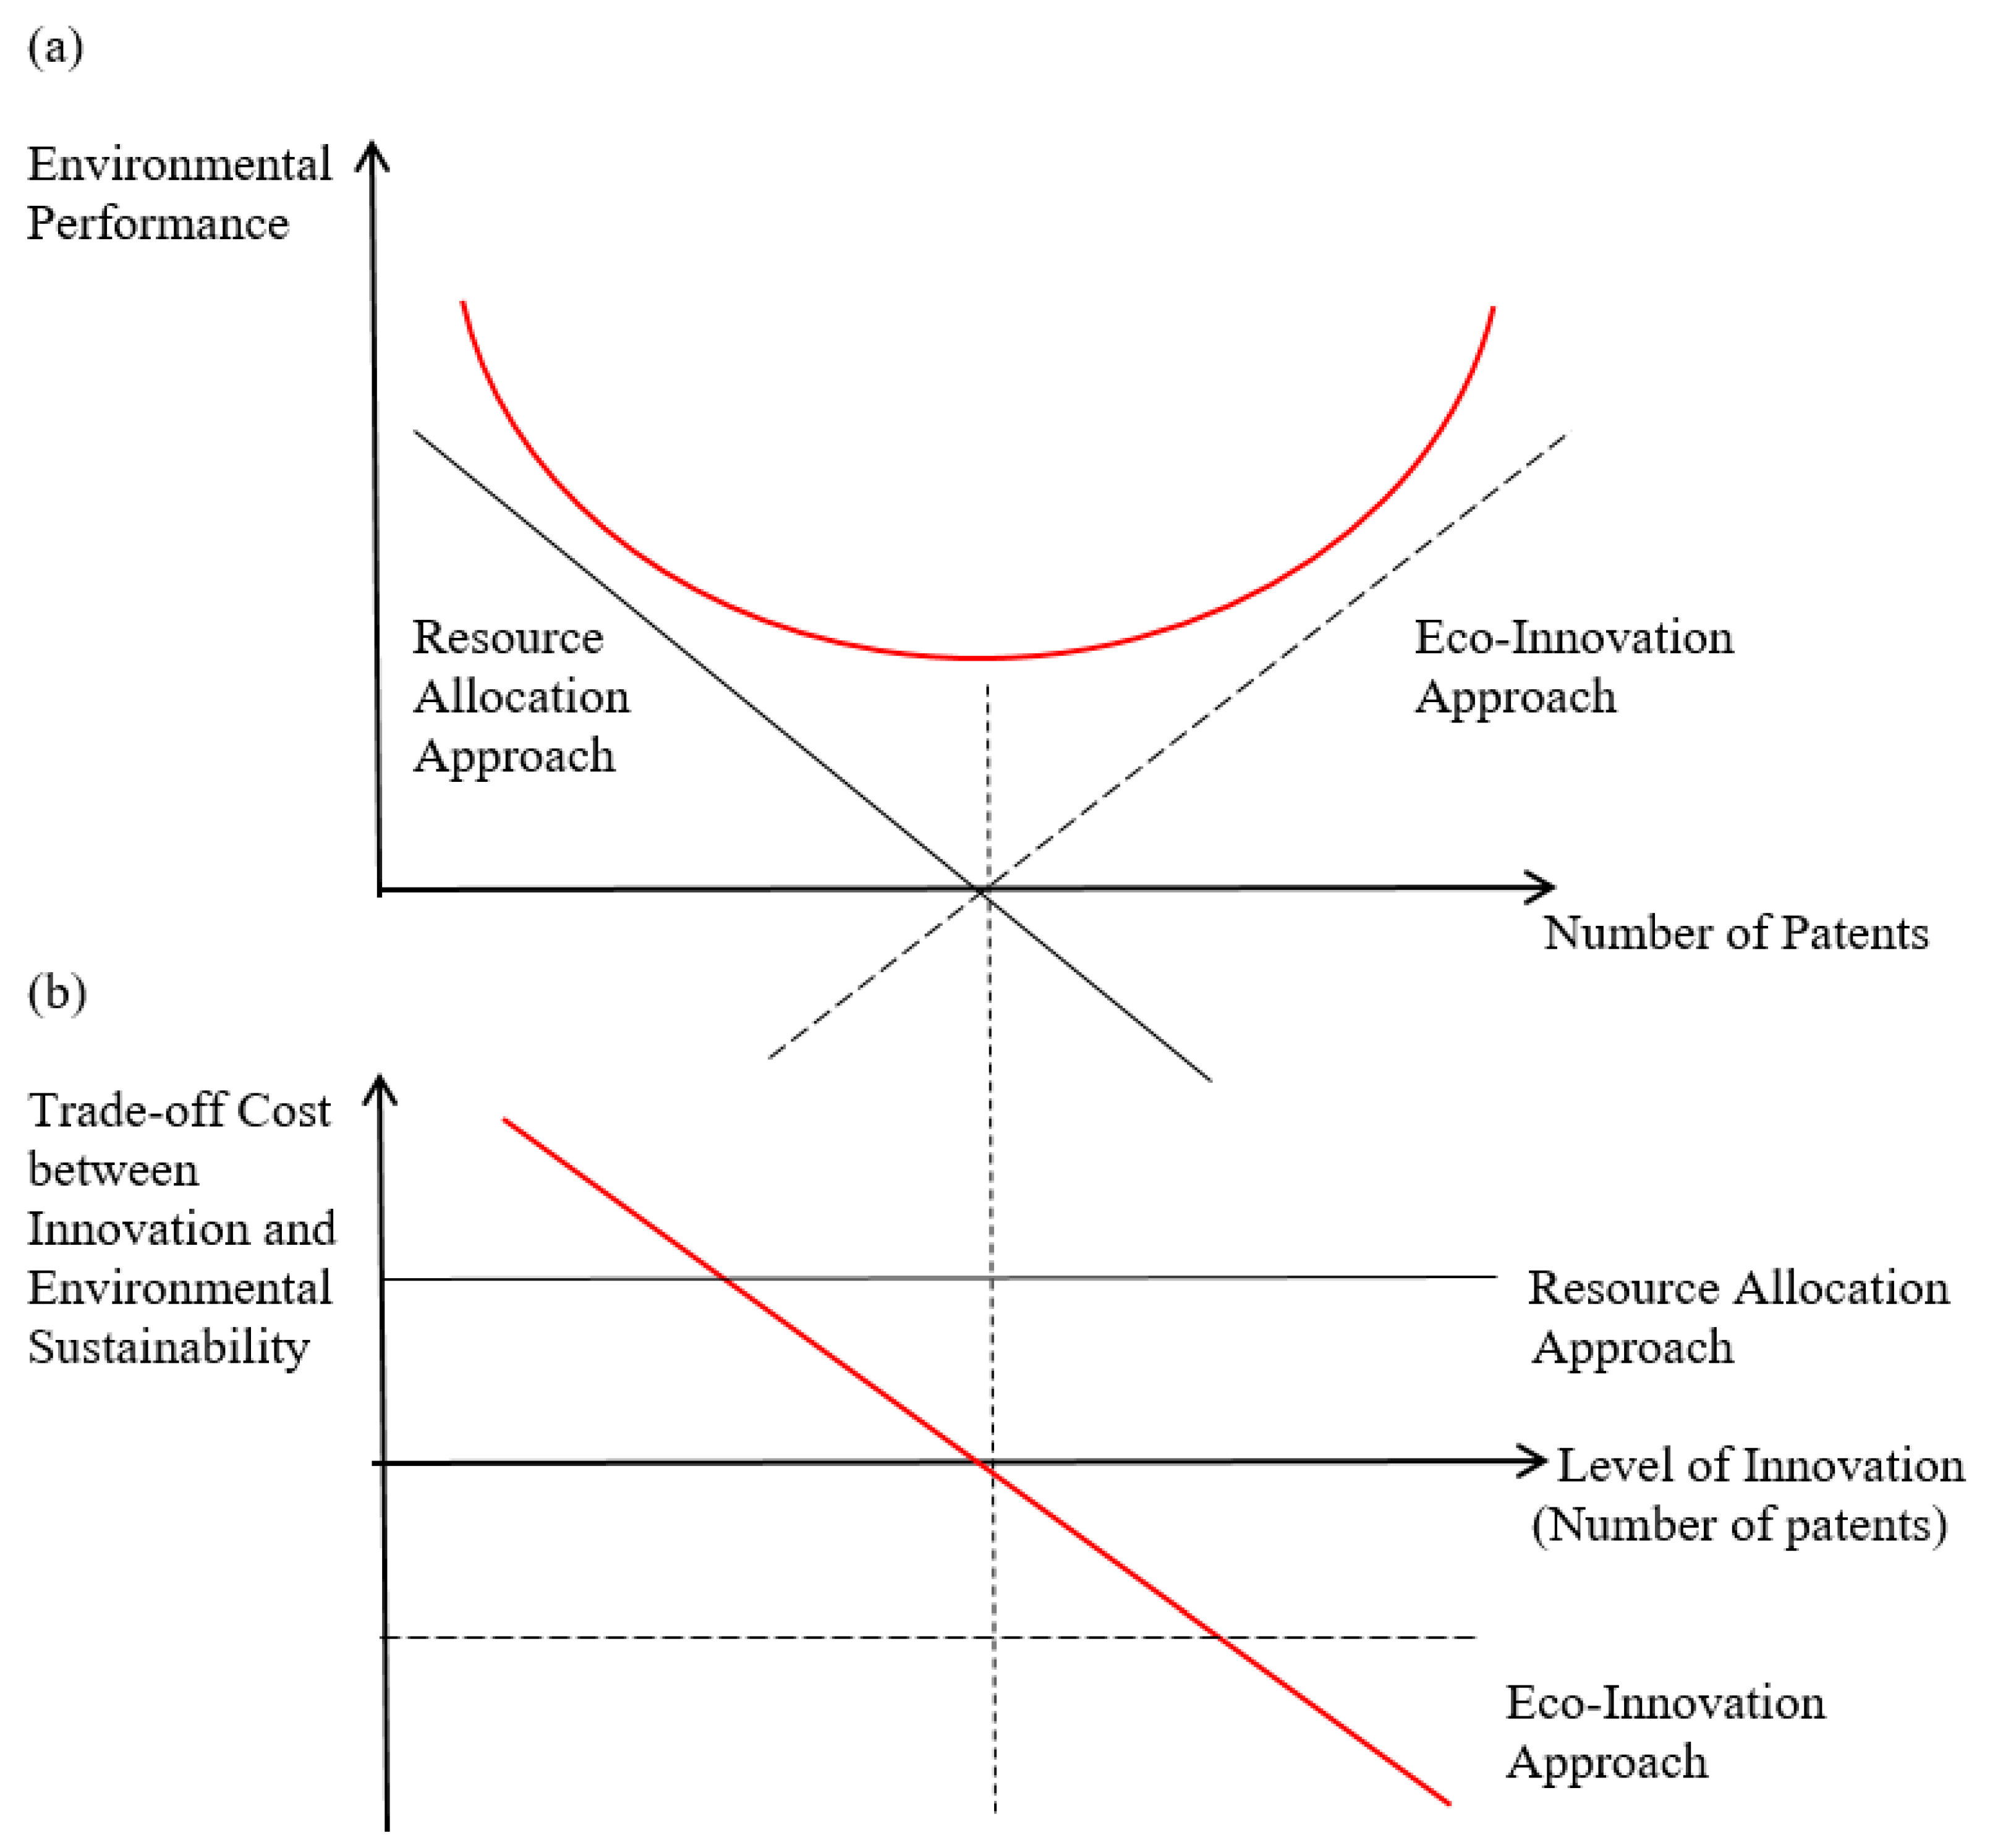
2.1. Resource Allocation Approach

Emphasizing the constant trade-off costs between corporate activities, the resource-allocation approach proposes that the way managers prioritize between corporate innovation and environmental sustainability is critical for firm value. The trade-off cost approach due to resource-allocation constraints has been proposed by March’s seminal work [13], in which he points out that firms should choose one of various possible activities “by making resource-allocation decisions, thereby facing trade-offs between expected consequences of these activities” [14]. In other words, due to limited resource availability, corporate managers favor a certain activity over others. This perspective is also related to strategic decision-making, defined essentially as making disciplined choices about resource allocation [15,16,17]. In strategic decision-making, corporate performance is best if managers effectively build portfolios of corporate activities under certain constraints, i.e., the restricted budgets to be invested in appropriate activities [18].
Likewise, the CSR literature states that corporate actors have a good reason to choose either innovation activities or environmental sustainability, rather than both [7,19]. Academic literature on strategic CSR states that a firm’s CSR activities add to its intangible assets, such as reputation/brand, innovation/R&D, human resources, and ultimately, financial valuation [20,21]. Following the resource-allocation approach [2,5,6,7,8], however, due to limited resources or budget constraints, corporate innovation activities and environmental sustainability are incompatible. Thus, because a firm’s engagements in innovation and responsibility alike contribute to its intangible assets, and because trade-off costs between two activities are clear, the firm tends to focus on either innovation activities or environmental performance.
Incidentally, under the resource allocation conditions, corporations prefer activities resulting in internal assets and resources to those for external benefits, with the following two reasons: First, because returns from externally driven activities are less certain and more remote in time than those from internal assets [14], firms are likely to invest in activities for internal resources [13]. Second, relevant to the first point, between corporate innovation such as patents and environmental issues, firms choose the former to protect their innovation from competitors’ imitation [22].
Accordingly, managers and firms should choose activities either for corporate innovation or environmental sustainability. This “either-or” approach has well-coincided with managerial motivations to choose corporate innovation activities. According to the innovation literature, innovation is a key driver in the business world, but the public good nature of ideas prevents corporate actors from investing their full efforts [23]. However, firms and business people actively pursuing patents or copyrights are motivated by anti-common incentives, i.e., privatizing scientific knowledge and limiting scientific progress [24,25]. In contrast to initiatives for social benefits or responsible practices, intellectual property rights may inhibit the free flow of scientific knowledge, instead of accumulating social benefits. Thus, due to divergent motivations for innovation and environmental sustainability, the connections between patenting activities and environmental performance would be inversely related.
In summary, research areas mentioned above are mainly rooted in the assumption that trade-off costs between innovation activities and environmental sustainability are constantly positive. Firms must dedicate time and money to particular activities and programs, with impact on their expected value [16]. Additionally, however, when investing in intellectual capital by patenting, firms and business people can be easily motivated by “anti-common” perspectives. Thus, corporate motivations for patenting activities and engagements in environmental performance should be mutually incompatible because of budget constraints and/or limited resources. A relevant proposition is that there will be a negative association between a firm’s patents and its environmental performance.

2.2. Eco-Innovation Approach

Some researchers pay attention to the property of mutual influence between corporate activities relevant to intangible assets. This research stream implicates the risk-management approach, emphasizing that a firm’s involvement in innovation and environmental sustainability positively impacts its values [26,27], resulting in null or negative trade-off costs. Accordingly, the “negative” trade-off costs would be basic motivation for firms to partake in activities relevant to both innovation and sustainability issues. Regarding this “both-and” logic, the following two approaches argue relevant propositions.
First, researchers studying eco-innovation, defined as “the production of process, service or management which results in a reduction of environmental risk, pollution and other negative impacts of resources used” [28], find reciprocal relationships between innovative and responsible activities of firms [29,30,31]. For example, by developing operational and energy efficiency, companies would achieve a desirable environmental performance as well as superior economic returns [8,9,32,33], such as eco-efficiency [30]. With the modus operandi of integrating innovation and environmental sustainability, which also reduces trade-off costs between them, corporations can perform well in both economic and environmental counts.
Second, scholars emphasizing normative standpoints propose that desirable management activities such as innovative practices and effective stakeholder relationships lead to a good reputation among stakeholders, which ultimately results in better performance [34,35,36]. Their basic argument is that “by developing close relationships with primary stakeholders a firm can develop certain intangible resources which enable the most efficient and competitive use of the firm’s assets and help it to acquire a competitive advantage over its rivals” [21] (p. 467). As a result, “positive perceptions of the firm by outside stakeholders may lead to increased sales or reduced stakeholder management costs” [37] (p. 307). A firm’s patenting activities indicate its desire to provide knowledge creation to the society, as well as its specific industrial community [38,39]. As such, a firm’s concern about environmental performance, such as pollution, demonstrates a larger wish to decrease damage and increase the benefit to external society. From the moral sphere perspective, corporate involvement in patenting and environmental performance sheds light on similar levels of moral boundaries. Based on their similar standpoints, therefore, patenting and environmental performance can be intermingled into a harmonious stage.
Accordingly, corporate motivations for patents and environmental performance can be compatible. Both activities contribute intangible outcomes, and ultimately mitigate risk. Furthermore, there will be fewer or no trade-off costs; rather, activities for patenting and environmental sustainability lead to an effective countervailing force against trade-off costs. Hence, there will be no or negative trade-off costs (i.e., benefits) between innovation and sustainability activities.
Given this inconsistency in two theoretical approaches and relevant findings, the question of the general relationship between patenting and environmental performance still raises research attention. Previous research in both “either/or” and “both/and” traditions study innovation and sustainability as if they were strictly antithetical to each other. Per the resource-allocation approach, trade-off costs between innovation and sustainability are continuously positive, so a firm should choose one of those activities, i.e., the “either/or” logic. On the contrary, the eco-innovation approach insists on negative trade-off costs or benefits between them—as a firm invests in innovation and/or sustainability, it will reduce trade-off costs and increase mutual aids between them, i.e., the “both/and’ logic. Hence, the trade-off costs between innovation activities and environmental sustainability provide fundamental mechanisms for both approaches. Below we seek to address this issue by unfolding a latent mechanism of trade-off costs behind the seemingly contradictory theoretical approaches mentioned above.

2.3. An Integrative Approach: Diminishing Trade-Off Costs

The natural resource-based view (NRBV) provides a conceptual basis for this integrative approach [5]. According to the NRBV, “constrained by and dependent upon ecosystems,” a firm’s “strategy and competitive advantage will be rooted in capabilities that facilitate environmentally sustainable economic activities” [5] (p. 991). In particular, the NRBV proposes that firms with a demonstrated capability will be able to accumulate the resources necessary for pollution prevention, which eventually contributes to reductions in emissions [5] (p. 1000). To respond to increasing environmentally caused pressures, companies need to accumulate heterogeneous resources and ambidextrous capabilities with a long-term perspective instead of a short-term focus [40,41].
The NRBV’s emphasis on external legitimacy has been recognized by management literature, which suggest that corporate activities for building intangible assets are sequentially linked with two impetuses: the first impetus is motivated by the “being different” perspective, while the second is motivated by the “being legitimate” attitude [42]. In order to obtain a competitive advantage by improving asset-specificity or “being different”, business managers tend to put their efforts into innovation-related activities such as R&D investment and patenting activities, and/or in CSR engagements. Interestingly, intellectual property rights may enhance the ability of society to realize the social and commercial benefits of a given scientific discovery and research [43]. Hinging upon differentiated resources, corporate managers are eager to “be legitimate” or conform to institutional demands by way of adopting and engaging in CSR or environmental issues [44]. For example, a firm’s commitment to philanthropy is influenced by institutional factors such as the community it belongs to and normative pressures, including regulatory sanctions [45,46]. Integrating two directions in the motivations for “being different” and “being legitimate”, corporate actors and managers pursue both innovation activities and responsible business.
Integrating the resource allocation and eco-innovation approaches, a basic argument in this study attributes the successive diminishment of trade-off costs between innovation and sustainability to the increasing level of the corporate innovation activities. The diminishing mechanism of trade-off costs is possible, as firms achieve the stage of ambidextrous capacity resolving the tension between innovation (patents) activities and environmental sustainability. Specifically, as the level of intangible assets induced from innovation activities, i.e., patenting, increases, the trade-off costs for a firm switching from innovation activities to engagements for environmental sustainability, or vice versa, decrease. That is, besides separate effects for boosting corporate intangible assets, a firm’s innovation activities and environmental sustainability are linked through a mechanism: trade-off costs.
Figure 1 describes the mechanism of the diminishing of trade-off costs. In Figure 1a,b, the solid lines represent the resource-allocation frame, such that the relationship between the number of patents and environmental performance monotonically decreases in Figure 1a, as the trade-off cost between them is constantly positive in Figure 1b. Additionally, the dashed lines exhibit the eco-innovation approach, such that the trade-off cost between two activities is negative, i.e., mutually beneficial (Figure 1b), so the linkage between them steadily increases (Figure 1a).
In Figure 1, the mechanism of diminishing trade-off costs between patents and environmental performance is illustrated with three consecutive mechanisms. First, when a firm does not have enough resources, i.e., the constraints in budgets, its managers have to make “allocation decisions”. In order for “gains from focus” [47] (p. 429), corporate decision-makers must choose either innovation or environmental issues, which brings about positive “trade-off” relationships. Under this circumstance, the more patenting activities a firm chooses to invest in, the less environmental performance it will engage in.
Second, the relationship between patents and sustainability is negatively associated up to a certain point, where the trade-off approaches null. Then, this relationship is shifted to a positive association. As growing or experiencing more, some firms can allocate their resources into diverse purposes. They can then develop and maintain their intangible assets based on multiple sources, such as innovation, reputation, and environmental sustainability which ultimately benefit the environment [48]. This is presented as the red line approaching the zero-point in Figure 1b, eventuating the bottom curve of the red U-shaped curve in Figure 1a. By virtue of zero or almost no trade-off costs, corporate managers may choose activities for both innovation and sustainability under this situation.
Third, as a firm accumulates more experiences by creating intangible resource activities, it gradually reduces the trade-off costs between patenting and environmental performance. Firms from this group show the positive relationships among their activities for intangible assets, i.e., achieving the stage of “gains from ambidexterity” [47] (p. 429). In Figure 1a, this affinity is shown in the increasing area of the U-shaped red line and the matching trade-off cost in Figure 1b, i.e., the red line below zero, implying that firms in this context enjoy positive synergic effects from both activities.
Therefore, we expect that high environmental performance will be found around either relatively low or high levels of patenting activities, and that environmental performance will decrease consistently until the point at which the firm’s ambidextrous capacities reverse the trend, creating low environmental performance at moderate levels of corporate innovation. Accordingly, as the red U-shaped curve in Figure 1a exhibits, there will be a curvilinear relationship between patents and the environmental performance of a firm. A corresponding hypothesis is the following:
Hypothesis 1.
There will be a curvilinear relationship between a firm’s innovation activities and its engagement in environmental sustainability.

3. Research Methods

3.1. Sample and Data

The sample used to test our hypothesis was composed of multiple databases, such as Kinder Lydenberg and Domin (KLD), United States Patent and Trademark Office (USPTO), ExecComp, and Compustat. To investigate the environmental performance, we chose the KLD dataset because it has been popularly used by CSR researchers [1,2,5,27,36,37]. We started sampling with the firms from the KLD database by identifying all large U.S. public firms whose environmental performances were evaluated by KLD. Then, in order to operationally define corporate innovation, we collected patent data of the firms from the USPTO database, as it stores most of the patent information of large U.S. corporations since 1976 [49,50]. Lastly, we added the sample firms’ financial/accounting information and firm-specific characteristics, which were extracted from Standard & Poor’s Compustat database; both have been popularly used by management researchers [1,27]. This sampling procedure yielded 11,657 firm-year observations with 1564 firms, spanning from 1991 to 2010.

3.2. Measures

3.2.1. Dependent Variable

As hypothesized, the dependent variable was considered the environmental performance, which is defined as “the degree to which a firm ensures that environmental concerns that arise either out of its business operations or otherwise are addressed” [51] (p. 1256). According to the KLD evaluation, the environmental performance was measured by subtracting the negative environmental performance (“concerns”) from the positive environmental performance (“strengths”) of a firm, by year. First, the strengths referred to the extent to which a firm took an action addressing environmental issues in a given year. The action was specified into seven categories: (1) environmentally beneficial products and services; (2) pollution prevention; (3) recycling; (4) clean energy; (5) communications (e.g., environmental reports); (6) property, plant, and equipment; and (7) management systems through ISO 14001 certification; all of these were coded as dichotomous variables. We summed up the 0/1 variables across the categories to construct the positive environmental performance of a given firm at each year. Second, the concerns were defined as the extent to which a firm was involved in the activities that could exacerbate environmental issues. In the KLD data, the negative activities were evaluated in six aspects with binary codes: (1) hazardous waste, (2) violations, (3) ozone-depleting chemicals, (4) substantial emissions, (5) agricultural chemicals, and (6) the combustion of coal or oil and its derivative fuel products. We accordingly summed up the binary codes of a given firm by year to measure the negative environmental performance.

3.2.2. Independent Variable

To illustrate corporate innovation activities, we considered how firms created and developed their patents. Patenting refers to a firm’s activities to codify knowledge [52,53], and thus it can be measured with the number of patents that are filed to USPTO in a given year [49,50]. On the other hand, prior patents are previously codified knowledge, and they are represented by the cumulative number of patents that were previously filed to USPTO until a given year. In that the contribution of previously developed patents decreases by 20% annually [54,55], we measured prior patents with the equation shown below:
S i t = s i t + ( 1 δ ) S i t 1
where Sit and Sit−1 denote the cumulative number of patents of firm i filed until time t and t − 1 respectively; sit indicates the number of patents created at time t in region i; and δ is the depreciation rate, assumed as 0.2.

3.2.3. Control Variable

This study included several control variables that could potentially affect a firm’s environmental performance. First, we considered industry asset intensity. Industry asset intensity has been viewed as a barrier to exit in studying diversification strategies [56]. It influences a firm’s activities when firms perceive the industry-level assets as sunk investment. We measured this by aggregating total assets for firms with the given 3-digit Standard Industrial Classification (SIC) code.
Second, we considered prior performance environmentally and financially. For the prior environmental performance, we used a one-year-lagged variable of the overall environmental performance. For the prior financial performance, we measured return-on-assets (ROA), which was adjusted by industry-level ROA. Industry-level ROA is measured with the mean value of ROA for firms with the given 3-digit SIC code.
Third, firm size is a factor determining firm performance because it represents a firm’s capability. The number of employees was used as a proxy variable to capture the firm size. Additionally, we considered the value of total assets as another variable to capture the firm size.
Fourth, the environmental performance can be influenced by the upper-echelon’s decision-making. To control for this, we included the number of executives as a control variable.
Fifth, we considered marketing intensity and capital expenditures. Marketing intensity was measured with the ratio of administrative expenditures to R&D expenditures. As the administrative expenditure heavily depends on a given firm’s resources, we normalized the scale of expenditure by dividing it by the net income.
Last, we acknowledged that hypothesis tests depend on the firms that have been awarded. As this can entail a sample selection bias, we had to control for the latent effects where the firms that were rated by KLD but hadn’t been awarded with their own patents could reveal significant relations between intangible assets and environmental performance. To consider the sample selection bias, we calculated inverse Mill’s ratios of the sample firms. From our compiled dataset, we computed Probit estimations of the probability, where the sample firms of the KLD database had their own patents with respect to industrial dummies (year dummies) and the dollar amount of R&D expenditures (which were normalized by total assets). The estimated probabilities were included in our estimation models as independent control variables.
Table 1 summarizes the variables, including the mean value, standard deviation, and minimum and maximum values.
Table 2 presents a correlation matrix for all 15 variables used in the models. Interestingly, overall environmental performance (EPO) had a positive correlation value with environmental performance strengths (EPS), while it had a negative correlation with environmental performance concerns (EPC). Additionally, the number of patents (NP) had a positive association with R&D expenditures (R&D), but the cumulative number of patents (CNP) had a positive correlation with the number of employees (EMP).

4. Results

4.1. Hypothesis Tests

To examine the hypothetical relations between corporate innovation and environmental performance, we used a fixed-effect model, as the Hausman test suggests [57]. The Hausman test is typically used to compare fixed- and random-effect models in econometrics. If the statistic for the test has p-values lower than the 0.05 significance level, the random-effect model shows inconsistent results. In this study, we found the statistic to be 919.89 (p < 0.001). We, therefore, employed fixed-effect models.
Table 3 presents the estimations of environmental performance with respect to control variables (Model 1) and our hypothesized variables, the number of patents (Models 2 and 3) and the number of cumulative patents (Models 4 and 5). Model 1 included only control variables. In Models 2 and 3, the hypothesized variable, the number of patents, was added to Model 1 to estimate the environmental performance.
From Model 3, we found a negative effect from the number of patents on the environmental performance (β = −0.001; p < 0.001) and a positive effect from its quadratic terms (β = 0.000; p < 0.001). Likewise, Model 5 presented a quadratic effect of the cumulative number of patents on environmental performance, which also supported our hypothesis. Specifically, there was a negative effect of the cumulative number of patents on the environmental performance (β = −0.232; p < 0.01) and a positive effect of its quadratic terms (β = 0.008; p < 0.1).
This finding revealed a U-shaped relation between the number of patents and environmental performance, as shown in Figure 2 and Figure 3 below. Figure 2 presents the quadratic relationship between the number of patents and environmental performance, and Figure 3 shows the U-shaped relationships between the cumulative number of patents and environmental performance.

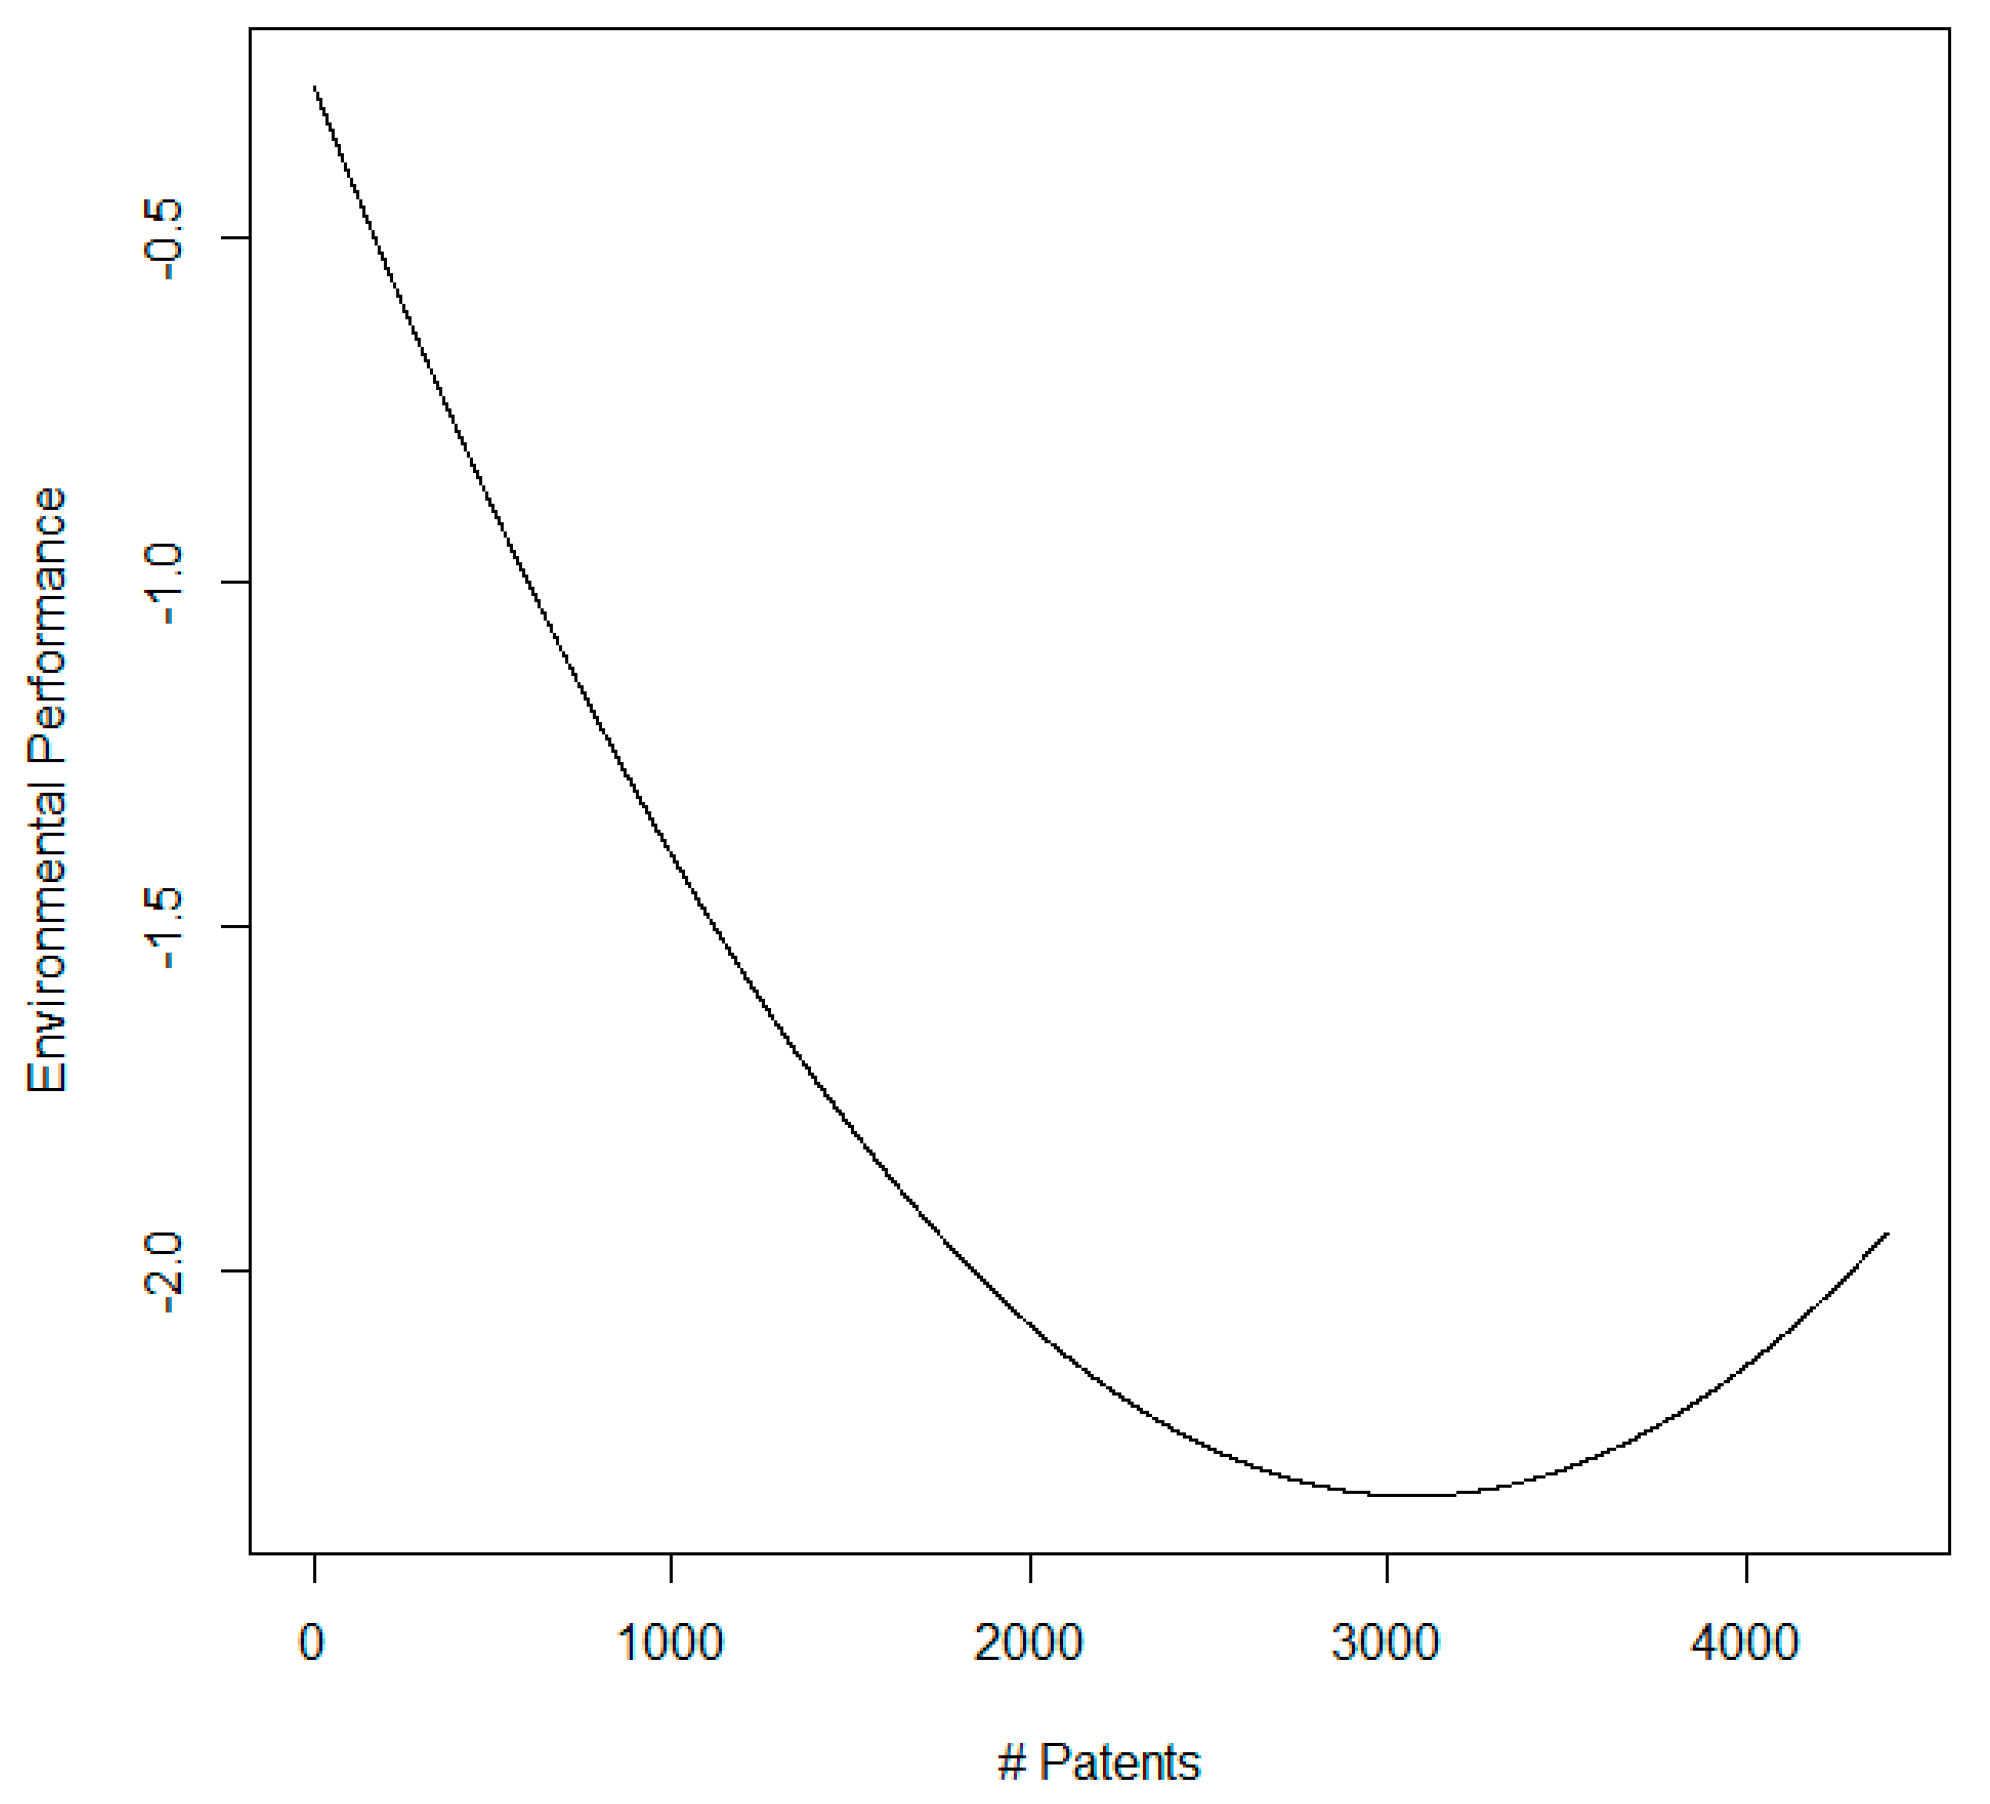
4.2. Specification of Environmental Performance

As a robustness check of the environmental performance, we separated the performance measure into two independent components: positive and negative environmental performances. To predict the respective environmental performance measures, we considered three aspects in selecting estimation models.
First, the overall distributions of the respective variables (positive and negative) were right-skewed. The distributions were interpreted as indicating that the activities related to environmental issues tend to be episodic. Second, given that the variables were made by summing up binary codes, the values of the variables represented the frequency of episodic activities in a certain time period. Additionally, the over-dispersion issue was considered, i.e., if the variance value was excessively large relative to the mean value. Thus, we tested if the focal variables (positive and negative) were vulnerable to the over-dispersion bias. The test results revealed that the goodness-of-fit statistics were 8172.50 (p = 0.99) for the positive environmental performance, and 13,124.69 (p = 0.77) for the negative environmental performance, indicating that there were no over-dispersion issues. Third, in our sample data, the positive and negative variables contained many zeros, which could influence the estimation results. To delineate the influence of the zero-valued dependent variables, we finally considered the zero-inflated Poisson regression model.
Table 4 shows the zero-inflated Poisson estimation results for the positive and negative environmental performance being regressed on the number of patents. Models 1 and 4 included only the control variable for estimating “positive” and “negative”. The number of patents and the cumulative number of patents were added to Models 1 and 4.
The findings reveal that neither the number of patents nor the cumulative number of patents affected the positive environmental performance (Models 2 and 3). However, as shown in Models 5 and 6, they had significant curvilinear effects on the negative environmental performance, with positive linear effects (β = 0.001 and p < 0.01 for the number of patents, and β = 0.179 and p < 0.01 for the cumulative number of patents) and negative quadratic effects (β = −0.001 and p < 0.01 for the number of patents, and β = −0.010 and p < 0.05 for the cumulative number of patents).
Specifically, there were inverted U-shaped relations between the number of patents and the negative environmental performance. These quadratic relations indicate that the number of patents can exacerbate the activities for environmental sustainability up to a point, but after the threshold, patents will initiate and integrate environmentally sustainable activities.

5. Discussion and Implications

In this study, building on both the resource allocation and eco-innovation frames, we examined the relationships between corporate patents and environmental performance. We found that the relationship between firms’ involvements in patenting activities and their engagements in environmental sustainability was not linear, but U-shaped curvilinear. Regarding this curvilinearity, we proposed a latent mechanism of the trade-off costs between corporate innovation and environmental sustainability. More interestingly, we found that the level of corporate patenting enhanced the negative environmental performance, with an inverted U-shaped relationship. Our findings thereby contribute to existing literature in the following two ways:
First, our findings provide a more nuanced understanding of the curvilinear effects of corporate patents and environmental performance. Previous literature assumes either positive or negative trade-off costs between them, constantly. We found systematic evidence for a third mechanism of the trade-off costs, which steadily decreases in the long-term. More specifically, the resource allocation approaches, assuming positive trade-off costs, are most relevant when the level of patents is relatively low. Meanwhile, the eco-innovation frames, presuming negative trade-off costs, are primarily relevant when the levels of corporate patenting activities are high enough to attenuate trade-off costs. Thus, the two existing theoretical frameworks can supplement each other at different levels of corporate patents, while remaining internally consistent with their research traditions, especially based on the trade-off cost mechanisms.
An integrative mechanism proposed and tested in this study concurs with the contextual ambidexterity literature [14] (p. 129) on resolving the tension between innovation (patents) activities and environmental sustainability, by maintaining both activities simultaneously. In particular, the resource allocation approach implies a substitution effect in which doing more patent-related activities decreases the marginal performance in environmental sustainability [58]. Under the resources allocation approach, firms should consider “gains from focus” instead of diverse engagements. Meanwhile, the eco-innovation approach persistently amplifies environmental sustainability through increased levels of innovation, i.e., complementary effects between them, which also suggests firms engage in “gains from ambidexterity” [47]. Thus, both logics for resource-allocation and eco-innovation approaches are supplementary with each other, with strategies of gains and trade-off costs at different levels.
Second, another theoretical contribution is our identification of a curvilinear relationship between corporate patenting activities and negative environmental performance. This finding implies that as the level of corporate patenting activities increases, environmental impairment increases to a certain point, and then undesirable impacts to the environment decrease at relatively high levels of corporate patents. This finding is fundamental to our understanding of the effect of innovation on environmental sustainability: corporate patenting activities are relevant to undesirable impacts on environmental performance overall, instead of satisfying outcomes. For example, by adding engagements in patenting activities, firms are more likely to produce environmental hazards, not better the environment.
Our findings should be interpreted with some caution. First, in our study, we did not distinguish between different kinds of environmental performance. We utilized diverse databases for corporate activities regarding environmental issues. Second, by considering only USPTO patents, we did not consider patents that were granted by other agencies and non-patented inventions. Third, this study was conducted within large North American firms, and was restricted to a particular time period. Thus, extension of this study should investigate whether the findings vary under a variety of temporal scenarios, with numerous environmental issues and corporate innovation activities.
Limitations aside, based on our results, we suggest that the motivation for “doing good” for the environment is accelerated once innovation assets through patenting activities are accumulated. We also offer a practical implication that corporations who are “stuck in the middle” with a moderate innovation level should attempt to diminish their negative environmental activities, as well as to develop intangible assets, further. Even companies achieving certain levels of corporate innovation should care for environmental sustainability once they accumulate an adequate level of innovation.

Acknowledgment

Parts of the earlier version of this paper have been presented at the Sixth International Conference on Corporate Sustainability and Responsibility at Humboldt University, Berlin, Germany, October 2014, and at the Sustainability, Ethics and Entrepreneurship Conference at Denver, Colorado, May 2015. The authors appreciated helpful comments and suggestions from participants in both conferences.

Conflicts of Interest

The authors declare no conflict of interest.

References

  1. McWilliams, A.; Siegel, D.S. Corporate social responsibility and financial performance: Correlation or misspecification? Strateg. Manag. J. 2000, 21, 603–609. [Google Scholar] [CrossRef]
  2. Hull, C.E.; Rothenberg, S. Firm performance: The interactions of corporate social performance with innovation and industry differentiation. Strateg. Manag. J. 2008, 29, 781–789. [Google Scholar] [CrossRef]
  3. Padgett, R.C.; Galan, J.I. The effect of R&D intensity on corporate social responsibility. J. Bus. Ethics 2010, 93, 407–418. [Google Scholar] [CrossRef]
  4. Hart, S.A. Natural resource based-view of the firm. Acad. Manag. Rev. 1995, 20, 986–1014. [Google Scholar] [CrossRef]
  5. Russo, M.; Fouts, P.A. Resource-based perspective on corporate environmental performance and profitability. Acad. Manag. J. 1997, 40, 534–559. [Google Scholar] [CrossRef]
  6. McWilliams, A.; Siegel, D.S. Corporate social responsibility: A theory of the firm perspective. Acad. Manag. Rev. 2001, 26, 117–127. [Google Scholar] [CrossRef]
  7. Siegel, D.S. Green management matters only if it yields more green: An economic/strategic perspective. Acad. Manag. Perspect. 2009, 23, 5–16. [Google Scholar] [CrossRef]
  8. Dangelico, R.M.; Pujari, D. Mainstreaming green product innovation: Why and how companies integrate environmental sustainability. J. Bus. Ethics 2010, 95, 471–486. [Google Scholar] [CrossRef]
  9. Tiguero, A.; Moreno-Mondéjar, L.; Davia, M.A. Drivers of different types of eco-innovation in European SMEs. Ecol. Econ. 2013, 92, 25–33. [Google Scholar] [CrossRef]
  10. Lee, K.H.; Min, B. Green R&D for eco-innovation and its impact on carbon emissions and firm performance. J. Clean. Prod. 2015, 108, 534–542. [Google Scholar] [CrossRef]
  11. Gibson, C.B.; Birkinshaw, J. The antecedents, consequences, and mediating role of organizational ambidexterity. Acad. Manag. J. 2004, 47, 209–226. [Google Scholar] [CrossRef]
  12. Brunner, D.J.; Staats, B.R.; Tushman, M.; Upton, D.M. Wellsprings of creation: How perturbation sustains exploration in mature organizations. Harv. Bus. Sch. Organ. Behav. Unit Work. Pap. 2010. [Google Scholar] [CrossRef]
  13. March, J.G. Exploration and exploitation in organizational learning. Org. Sci. 1991, 2, 71–87. [Google Scholar] [CrossRef]
  14. Lavie, D.; Stettner, U.; Tushman, M.L. Exploration and exploitation within and across organizations. Acad. Manag. Ann. 2010, 4, 109–155. [Google Scholar] [CrossRef]
  15. Van Beurden, P.; Gössling, T. The worth of values—A literature review on the relation between corporate social and financial performance. J. Bus. Ethics 2008, 82, 407–424. [Google Scholar] [CrossRef]
  16. McWilliams, A.; Siegel, D.S.; Wright, P.M. Corporate social responsibility: Strategic implications. J. Manag. Stud. 2006, 43, 1–8. [Google Scholar] [CrossRef]
  17. Porter, M.E.; Kramer, M.R. Strategy and society: The link between corporate social responsibility and competitive advantage. Harv. Bus. Rev. 2006, 84, 78–92. [Google Scholar] [PubMed]
  18. Baron, R.A. Behavioral and cognitive factors in entrepreneurship: entrepreneurs as the active element in new venture creation. Strateg. Entrep. J. 2007, 1, 167–182. [Google Scholar] [CrossRef]
  19. Mackey, A.; Mackey, T.B.; Barney, J.B. Corporate social responsibility and firm performance: Investor preferences and corporate strategies. Acad. Manag. Rev. 2007, 32, 817–835. [Google Scholar] [CrossRef]
  20. Gardberg, N.A.; Fombrun, C.J. Corporate citizenship: Creating intangible assets across institutional environments. Acad. Manag. Rev. 2006, 31, 329–346. [Google Scholar] [CrossRef]
  21. Surroca, J.; Tribó, J.A.; Waddock, S. Corporate responsibility and financial performance: The role of intangible resources. Strateg. Manag. J. 2010, 31, 463–490. [Google Scholar] [CrossRef] [Green Version]
  22. Argyres, N.S.; Liebeskind, J.P. Privatizing the intellectual commons: Universities and the commercialization of biotechnology. J. Econ. Behav. Org. 1998, 35, 427–454. [Google Scholar] [CrossRef]
  23. Arrow, K. Economic welfare and the allocation of resources for invention. In The Rate and Direction of Inventive Activity: Economic and Social Factors; Princeton University Press: Princeton, NJ, USA, 1962; pp. 609–626. [Google Scholar]
  24. Heller, M.A.; Eisenberg, R.S. Can patents deter innovation? The anticommons in biomedical research. Science 1998, 280, 698–701. [Google Scholar] [CrossRef] [PubMed]
  25. Cohen, W.M.; Nelson, R.R.; Walsh, J.P. Protecting Their Intellectual Assets: Appropriability Conditions and Why U.S. Manufacturing Firms Patent (or Not). Natl. Bur. Econ Res. 2000, 7552. [Google Scholar] [CrossRef]
  26. Klassen, R.D.; Whybark, D.C. The impact of environmental technologies on manufacturing performance. Acad. Manag. J. 1999, 42, 599–615. [Google Scholar] [CrossRef]
  27. Sharfman, M.P.; Fernando, C.S. Environmental risk management and the cost of capital. Strateg. Manag. J. 2008, 29, 569–592. [Google Scholar] [CrossRef]
  28. Arundel, A.; Kemp, R. Measuring Eco-Innovation; United Nations University: Maastricht, The Netherlands, 2009. [Google Scholar]
  29. Guadamillas-Gómez, F.; Donate-Manzanares, M.J. Ethics and corporate social responsibility integrated into knowledge management and innovation technology: A case study. J. Manag. Dev. 2011, 30, 569–581. [Google Scholar] [CrossRef]
  30. Rexhepi, G.; Kurtishi, S.; Bexheti, G. Corporate Social Responsibility (CSR) and Innovation–The Drivers of Business Growth? Procedia Soc. Behav. Sci. 2013, 75, 532–541. [Google Scholar] [CrossRef]
  31. Ferauge, P.A. Conceptual framework of corporate social responsibility and innovation. Glob. J. Bus. Res. 2012, 6, 85–96. [Google Scholar]
  32. Aquilani, B.; Silvestri, C.; Ruggieri, A. Sustainability, TQM and Value Co-Creation Processes: The Role of Critical Success Factors. Sustainability 2016, 8, 995. [Google Scholar] [CrossRef]
  33. Chen, R.J.C. An Integrated Sustainable Business and Development System: Thoughts and Opinions. Sustainability 2014, 6, 6862–6871. [Google Scholar] [CrossRef]
  34. Klassen, R.D.; McLaughlin, C.P. The impact of environmental management on firm performance. Manag. Sci. 1996, 42, 1199–1214. [Google Scholar] [CrossRef]
  35. Harrison, J.S.; Freeman, R.E. Stakeholders, social responsibility, and performance: Empirical evidence and theoretical perspectives. Acad. Manag. J. 1999, 42, 479–485. [Google Scholar] [CrossRef]
  36. Godfrey, P.C.; Merrill, C.B.; Hansen, J.M. The relationship between corporate social responsibility and shareholder value: An empirical test of the risk management hypothesis. Strateg. Manag. J. 2009, 30, 425–445. [Google Scholar] [CrossRef]
  37. Waddock, S.A.; Graves, S.B. The corporate social performance-financial performance link. Strateg. Manag. J. 1997, 18, 303–319. [Google Scholar] [CrossRef]
  38. Liu, X.F.; Xu, F.N. Corporate social responsibility and innovation: Evidence from emerging economies. In Proceedings of the 2014 IEEE International Conference on Management of Innovation and Technology, Singapore, 23–25 September 2014; IEEE: Piscataway, NJ, USA, 2014. [Google Scholar]
  39. Boulouta, I.; Pitelis, C.N. Who needs CSR? The impact of corporate social responsibility on national competitiveness. J. Bus. Ethics 2014, 119, 349–364. [Google Scholar] [CrossRef]
  40. Hart, S.L. Innovation, creative destruction and sustainability. Res. Technol. Manag. 2005, 48, 21–27. [Google Scholar] [CrossRef]
  41. Hart, S.L.; Dowell, G. Invited editorial: A natural-resource-based view of the firm fifteen years after. J. Manag. 2011, 37, 1464–1479. [Google Scholar] [CrossRef]
  42. Deephouse, D.L. To be different, or to be the same? It’s a question (and theory) of strategic balance. Strateg. Manag. J. 1999, 20, 147–166. [Google Scholar] [CrossRef]
  43. Hellman, T. When do employees become entrepreneurs? Manag. Sci. 2007, 53, 919–933. [Google Scholar] [CrossRef] [Green Version]
  44. Campbell, J.L. Why would corporations behave in socially responsible ways? An institutional theory of corporate social responsibility. Acad. Manag. Rev. 2007, 32, 946–967. [Google Scholar] [CrossRef]
  45. Galaskiewicz, J.; Burt, R.S. Interorganization contagion in corporate philanthropy. Admin. Sci. Q. 1991, 1, 88–105. [Google Scholar] [CrossRef]
  46. Marquis, C.; Glynn, M.A.; Davis, G.F. Community isomorphism and corporate social action. Acad. Manag. Rev. 2007, 32, 925–945. [Google Scholar] [CrossRef]
  47. Gulati, R.; Puranam, P. Renewal through reorganization: The value of inconsistencies between formal and informal organization. Org. Sci. 2009, 20, 422–440. [Google Scholar] [CrossRef]
  48. Rahdari, A.; Sepasi, S.; Moradi, M. Achieving sustainability through Schumpeterian social entrepreneurship: The role of social enterprises. J. Clean. Prod. 2016, 137, 347–360. [Google Scholar] [CrossRef]
  49. Ahuja, G.; Katila, R. Where do resources come from? The role of idiosyncratic situations. Strateg. Manag. J. 2004, 25, 887–907. [Google Scholar] [CrossRef]
  50. Zucker, L.G.; Darby, M.R.; Furner, J.; Liu, R.C.; Ma, H. Minerva unbound: Knowledge stocks, knowledge flows and new knowledge production. Res. Policy 2007, 36, 850–863. [Google Scholar] [CrossRef]
  51. Jayachandran, S.; Kalaignanam, K.; Eilert, M. Product and environmental social performance: Varying effect on firm performance. Strateg. Manag. J. 2013, 34, 1255–1264. [Google Scholar] [CrossRef]
  52. Eckstein, C. The measurement and recognition of intangible assets: then and now. Account. Forum 2004, 28, 139–158. [Google Scholar] [CrossRef]
  53. Funk, R.J. Making the most of where you are: Geography, networks, and innovation in organizations. Acad. Manag. J. 2014, 57, 193–222. [Google Scholar] [CrossRef]
  54. Darby, M.R.; Zucker, L.G. Grilichesian Breakthroughs: Inventions of Methods of Inventing and Firm Entry in Nanotechnology. Annales d'Économie et de Statistique 2005, 79, 143–164. [Google Scholar] [CrossRef]
  55. Griliches, Z. Patent statistics as economic indicators: A survey. In R&D and Productivity: The Econometric Evidence; Griliches, Z., Ed.; University of Chicago Press: Chicago, IL, USA, 1998; pp. 287–343. [Google Scholar]
  56. Robins, J.; Wiersema, M.F. A resource-based approach to the multibusiness firm: Empirical analysis of portfolio interrelationships and corporate financial performance. Strateg. Manag. J. 1995, 16, 277–299. [Google Scholar] [CrossRef]
  57. Hausman, J.A. Specification tests in econometrics. Econometrica 1978, 46, 1251–1271. [Google Scholar] [CrossRef]
  58. Milgrom, P.; Roberts, J. The economics of modern manufacturing: Technology, strategy, and organization. Am. Econ. Rev. 1990, 1, 511–528. [Google Scholar]
Figure 1. Relationship between patents, environmental performance, and the trade-off costs. The graph at (a) presents the curvilinear relationship between the number of patents and the environmental performance, which is derived from the trade-off costs between resource allocation approach and the eco-innovation approach. The graph at (b) specifies how the trade-off costs are diminished as the level of innovation increases. The solid red line is yielded by differentiating the curvilinear function shown in (a).
Sustainability 09 01267 g001
Figure 2. Quadratic relation between the number of patents and environmental performance.
Sustainability 09 01267 g002
Figure 3. Quadratic relation between the cumulative number of patents and environmental performance.
Sustainability 09 01267 g003
Table 1. Descriptive Statistics 1.
VariablesMeanSDMinMax
Environmental Performance, Overall−0.110.93−55
Environmental Performance, Strengths0.280.6705
Environmental Performance, Concerns0.390.870.006
Prior Environmental Performance, Overall−0.010.64−4.283.96
Prior Environmental Performance, Strengths0.030.46−2.253.94
Prior Environmental Performance, Concerns0.030.59−2.864.25
No. of Patents0.030.0500.87
Cumulative No. of Patents27.94155.7004392
Prior Industry ROA0.372.00−41.4616.53
Industry Asset Intensity0.372.00−41.4616.53
No. of Executives1.702.810.0430.34
Total Assets5.741.60015
No. of Employees43.33153.590.023973.04
Marketing Expenditures26.1574.950.012100
R&D Expenditures0.230.21−0.042.96
1 N = 11,657.
Table 2. Correlation Matrix.
Variables 11234567891011121314
1. EPO
2. EPS0.44
3. EPC−0.720.30
4. PEPO0.600.24−0.45
5. PEPS0.320.680.190.45
6. PEPC−0.400.270.63−0.730.29
7. NP0.11−0.01−0.130.020.01−0.02
8. CNP−0.020.120.120.000.150.120.12
9. IROA−0.000.000.00−0.00−0.01−0.00−0.02−0.02
10. IAI0.000.000.000.00−0.010.00−0.08−0.020.01
11. EXC−0.210.120.32−0.040.010.05−0.16−0.03−0.010.01
12. TA−0.070.060.12−0.030.020.05−0.030.07−0.03−0.010.03
13. EMP−0.180.250.38−0.130.230.32−0.050.320.03−0.030.260.08
14. MKT−0.040.150.16−0.060.150.18−0.090.190.120.030.140.080.45
15. R&D0.18−0.11−0.280.03−0.04−0.060.23−0.02−0.080.12−0.19−0.03−0.140.02
1 EPO: environmental performance, overall. EPS: environmental performance, strengths. EPC: environmental performance, concerns. PEPO: prior environmental performance, overall. PEPS: prior environmental performance, strengths. PEPC: prior environmental performance, concerns. NP: no. of patents. CNP: cumulative no. of patents. IROA: prior industry ROA. IAI: industry asset intensity. EXC: no. of executives. TA: total assets. EMP: no. of employees. MKT: marketing expenditures. R&D: R&D expenditures.
Table 3. The effect of patenting on environmental performance 1.
Model 1Model 2Model 3Model 4Model 5
Intercept−0.348 ** (0.102)−0.298 ** (0.103)−0.279 ** (0.103)−0.317 ** (0.102)−0.300 ** (0.103)
PEPO0.079 *** (0.015)0.078 *** (0.015)0.079 *** (0.017)0.078*** (0.015)0.079 *** (0.015)
IROA−0.001 (0.002)−3.001 (0.002)−0.001 (0.002)−0.001 (0.002)−0.001 (0.002)
IAI0.008 (0.011)0.007 (0.011)0.006 (0.010)0.006 (0.011)0.006 (0.011)
EXC−0.003 (0.005)−0.003 (0.005)−0.003 (0.005)−0.003 (0.005)−0.003 (0.005)
TA0.001 ** (0.000)0.001 ** (0.000)0.001 ** (0.000)0.001 ** (0.000)0.001 ** (0.000)
EMP−0.002 *** (0.000)−0.002 *** (0.000)−0.002 *** (0.000)−0.002 *** (0.000)−0.002 *** (0.000)
MKT−0.033 (0.109)−0.036 (0.108)−0.040 (0.108)−0.031 (0.108)−0.031 (0.108)
R&D−0.081 (0.258)−0.084 (0.257)−0.090 (0.257)−0.083 (0.257)−0.084 (0.257)
NP −0.001 *** (0.000)−0.001 *** (0.000)
NP 2 0.000 *** (0.000)
CNP −0.120 ** (0.041)−0.232 ** (0.078)
CNP 2 0.008 (0.005)
Inverse Mill’s Ratio−0.180 *** (0.034)−0.175 *** (0.034)−0.169 *** (0.034)−0.177 *** (0.034)−0.175 *** (0.034)
Firm DummiesIncludedIncludedIncludedIncludedIncluded
Year DummiesIncludedIncludedIncludedIncludedIncluded
AR(1)-DW0.5540.5490.5480.5540.554
Log Likelihood−8043.14−8017.02−8008.90−8037.78−8036.19
AIC16,142.2716,092.0316,077.7916,133.5616,132.38
χ252.24 ***68.48 ***10.72 **13.9 ***
p < 0.1; * p < 0.05; ** p < 0.01; *** p < 0.001. 1 The number of firm-year: 11,657; the number of firms: 1564; standard errors are in parentheses.
Table 4. Zero-inflated estimation of environmental performance 1.
Positive Env. PerformanceNegative Env. Performance
Model 1Model 2Model 3Model 4Model 5Model 6
Intercept−1.001 *** (0.185)−1.003 *** (0.186)−0.999 *** (0.187)−0.231 (0.137)−0.269 * (0.135)−1.001 *** (0.185)
Prior Environmental Performance0.503 *** (0.029)0.505 *** (0.029)0.509 *** (0.028)0.601 *** (0.033)0.610 *** (0.030)0.610 *** (0.030)
Prior Industry ROA−0.030 (0.023)−0.030 (0.023)−0.030 (0.023)0.100 ** (0.032)0.101 ** (0.031)0.101 ** (0.031)
Industry Asset Intensity0.001 (0.006)0.000 (0.006)0.000 (0.006)0.024 ** (0.007)0.026 *** (0.007)0.027 *** (0.007)
No. of Executives0.009 (0.014)0.009 (0.014)0.007 (0.014)0.025 (0.014)0.029 * (0.013)0.028 * (0.013)
Total Assets0.000 (0.000)0.000 (0.000)0.000 (0.000)−0.000 (0.000)−0.000 (0.000)−0.000 (0.000)
No. of Employees0.000 (0.000)0.000 (0.000)0.000 * (0.000)−0.000 (0.001)−0.000 (0.001)−0.000 (0.001)
Marketing Expenditures0.078 (0.169)0.077 (0.170)0.077 (0.183)−2.929 *** (0.406)−2.925 *** (0.410)−2.918 *** (0.409)
R&D Expenditures−1.647 ** (0.593)−1.630 ** (0.598)−1.733 ** (0.644)−0.088 (1.549)−0.979 (1.689)−1.165 (1.711)
No. of Patents 0.000 (0.000) 0.001 ** (0.000)
No. of Patents 2 −0.000 (0.000) −0.000 ** (0.000)
Cum. No. of Patents 0.037 (0.039) 0.179 ** (0.069)
Cum. No. of Patents 2 −0.004 (0.003) −0.010 * (0.004)
Inverse Mill’s Ratio0.270 *** (0.055)0.271 *** (0.055)0.259 *** (0.056)0.459 *** (0.081)0.410 *** (0.083)0.408 *** (0.083)
Log Likelihood−5766.51−5766.11−5763.69−7115.40−7102.63−7104.53
AIC11,643.0311,646.2211,641.3814,340.8114,319.2514,323.06
χ20.85.64 25.54 ***21.74 ***
# Observations13,27813,27813,27813,27813,27813,278
# Zero Observations10,70710,70710,70710,32010,32010,320
p < 0.1; * p < 0.05; ** p < 0.01; *** p < 0.001. 1 The number of firms: 1564; standard errors are in parentheses.

