Mapping the Soil Texture in the Heihe River Basin Based on Fuzzy Logic and Data Fusion


Abstract
:1. Introduction
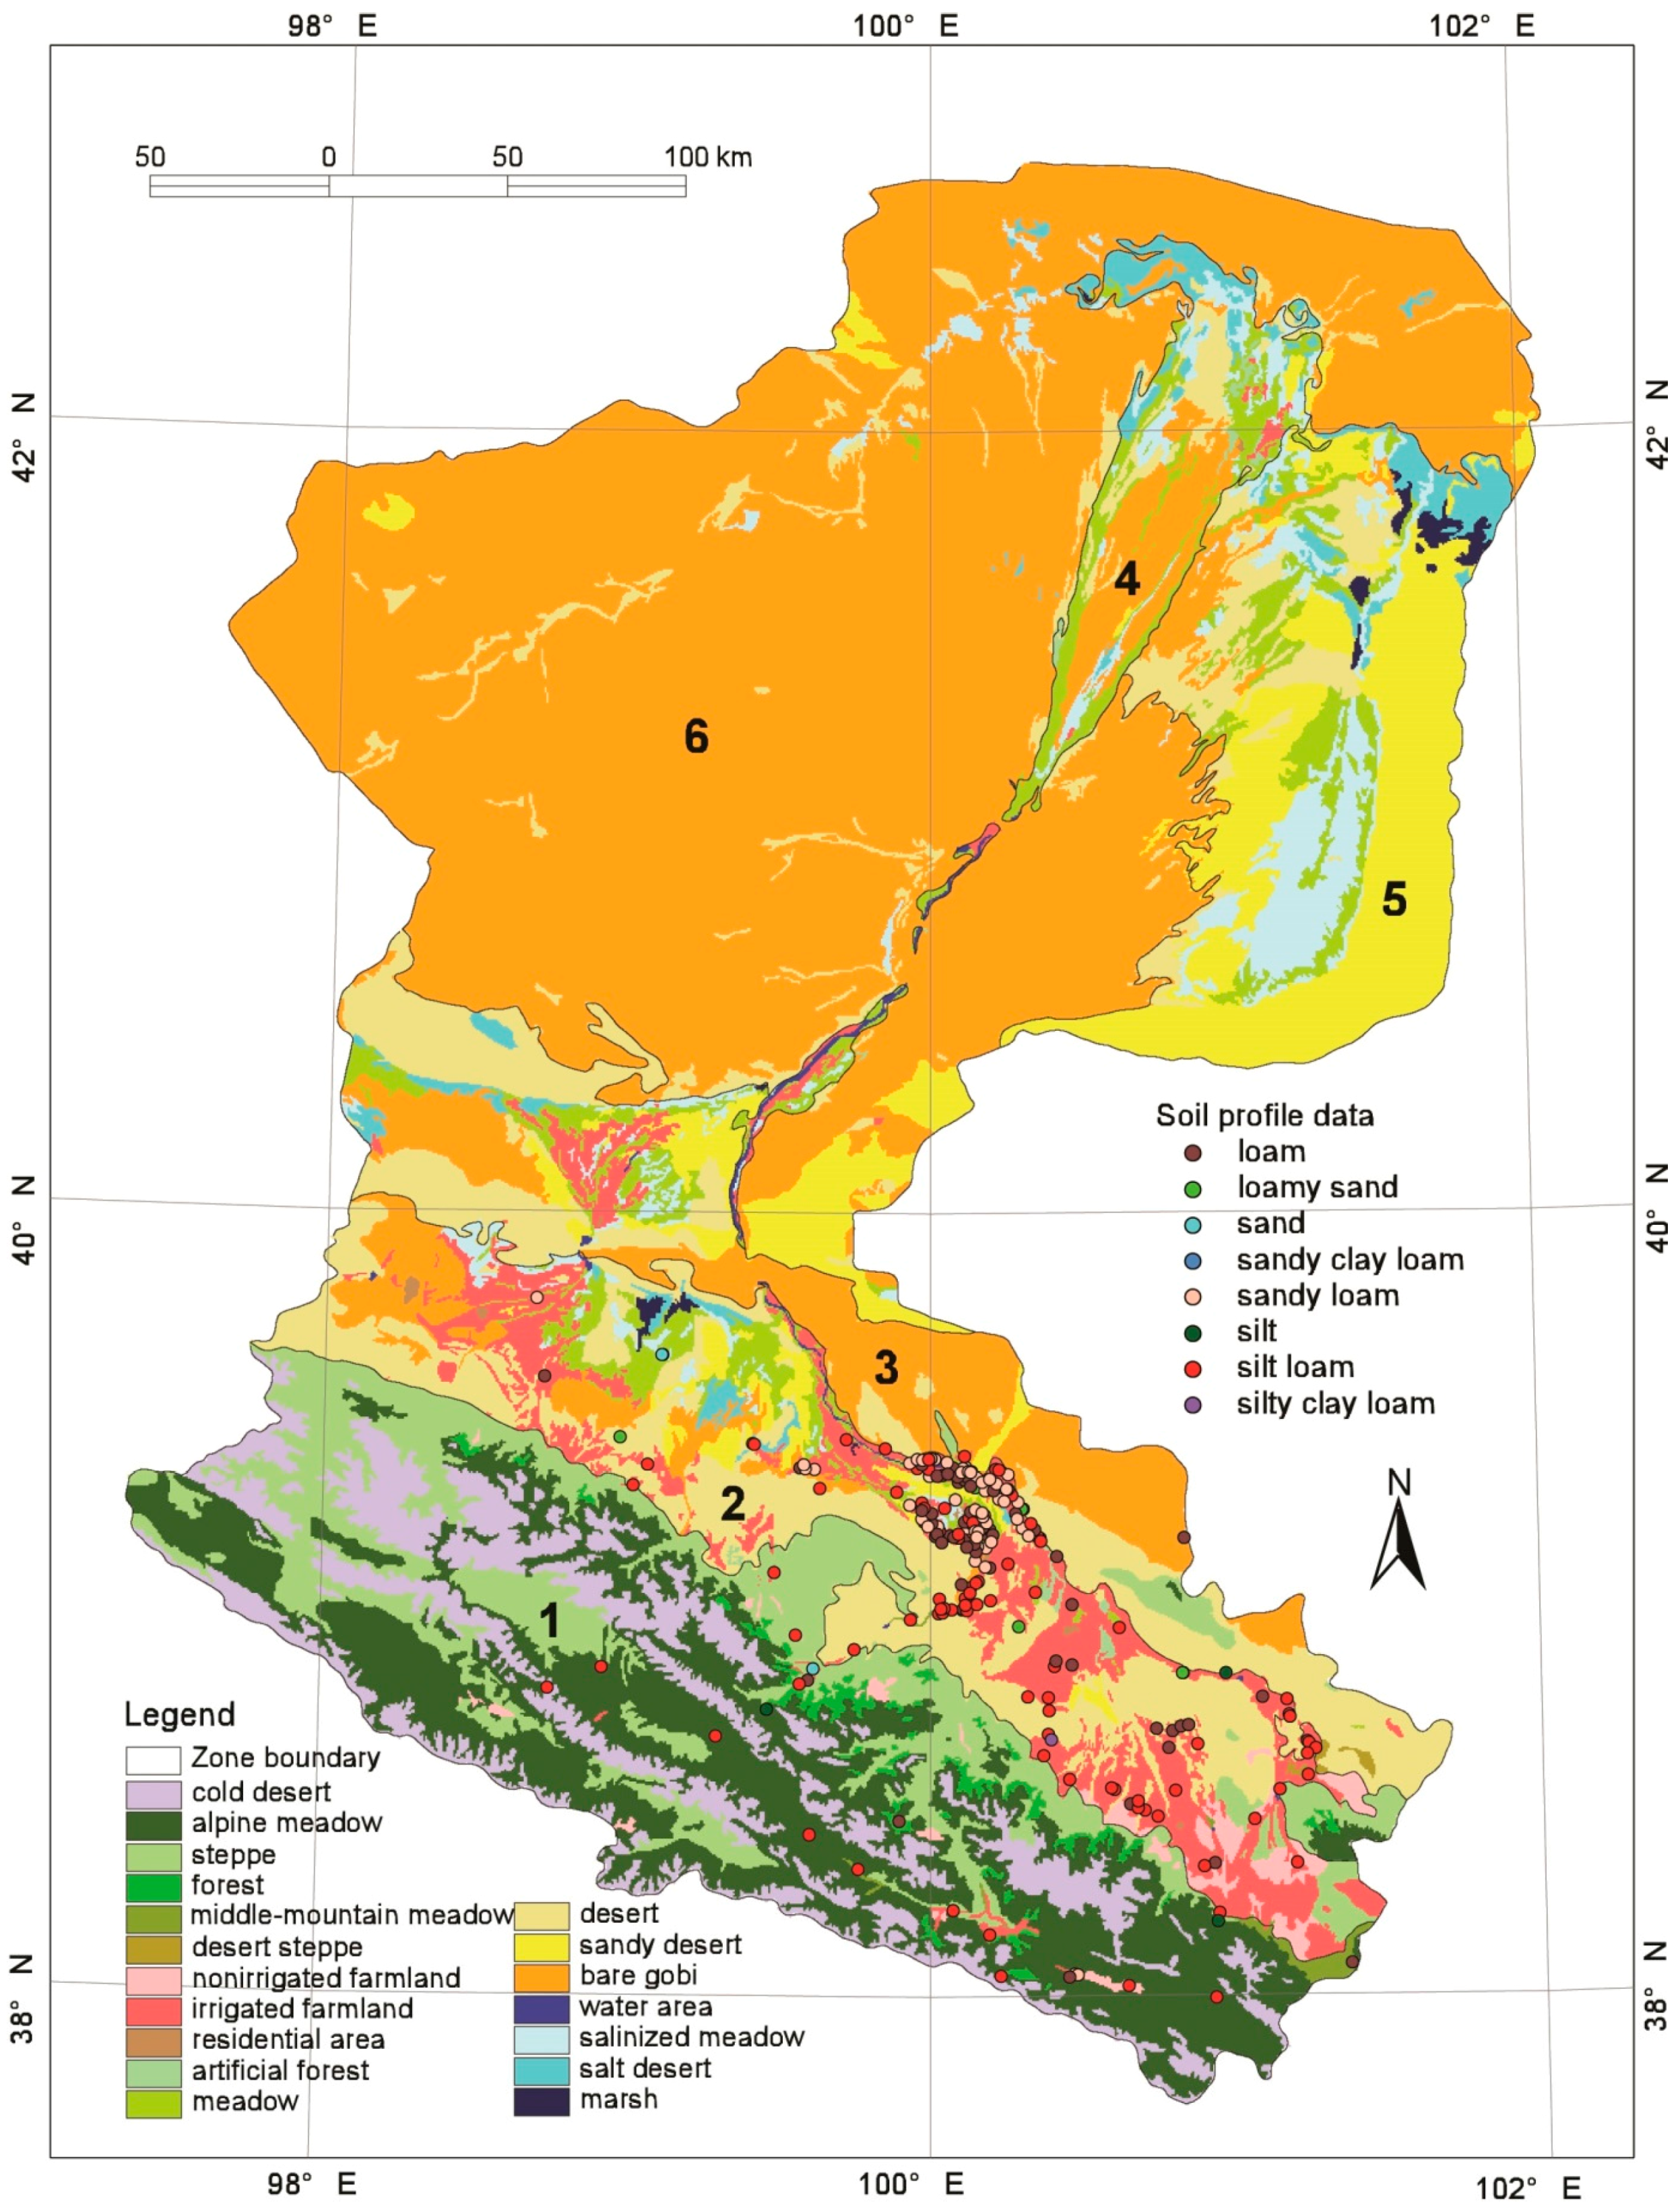
2. Heihe River Basin
3. Data and Methods
3.1. Data
3.1.1. Soil Profile Data
3.1.2. Environmental Factors
3.2. Method
3.2.1. Soil Texture Mapping for the Forest-Steppe Zone in the Qilian Mountains
3.2.2. Soil Texture Mapping of the Oasis Zone in the Hexi Corridor
3.2.3. Soil Texture Mapping in the Downstream Area
4. Validation and Results
4.1. Results
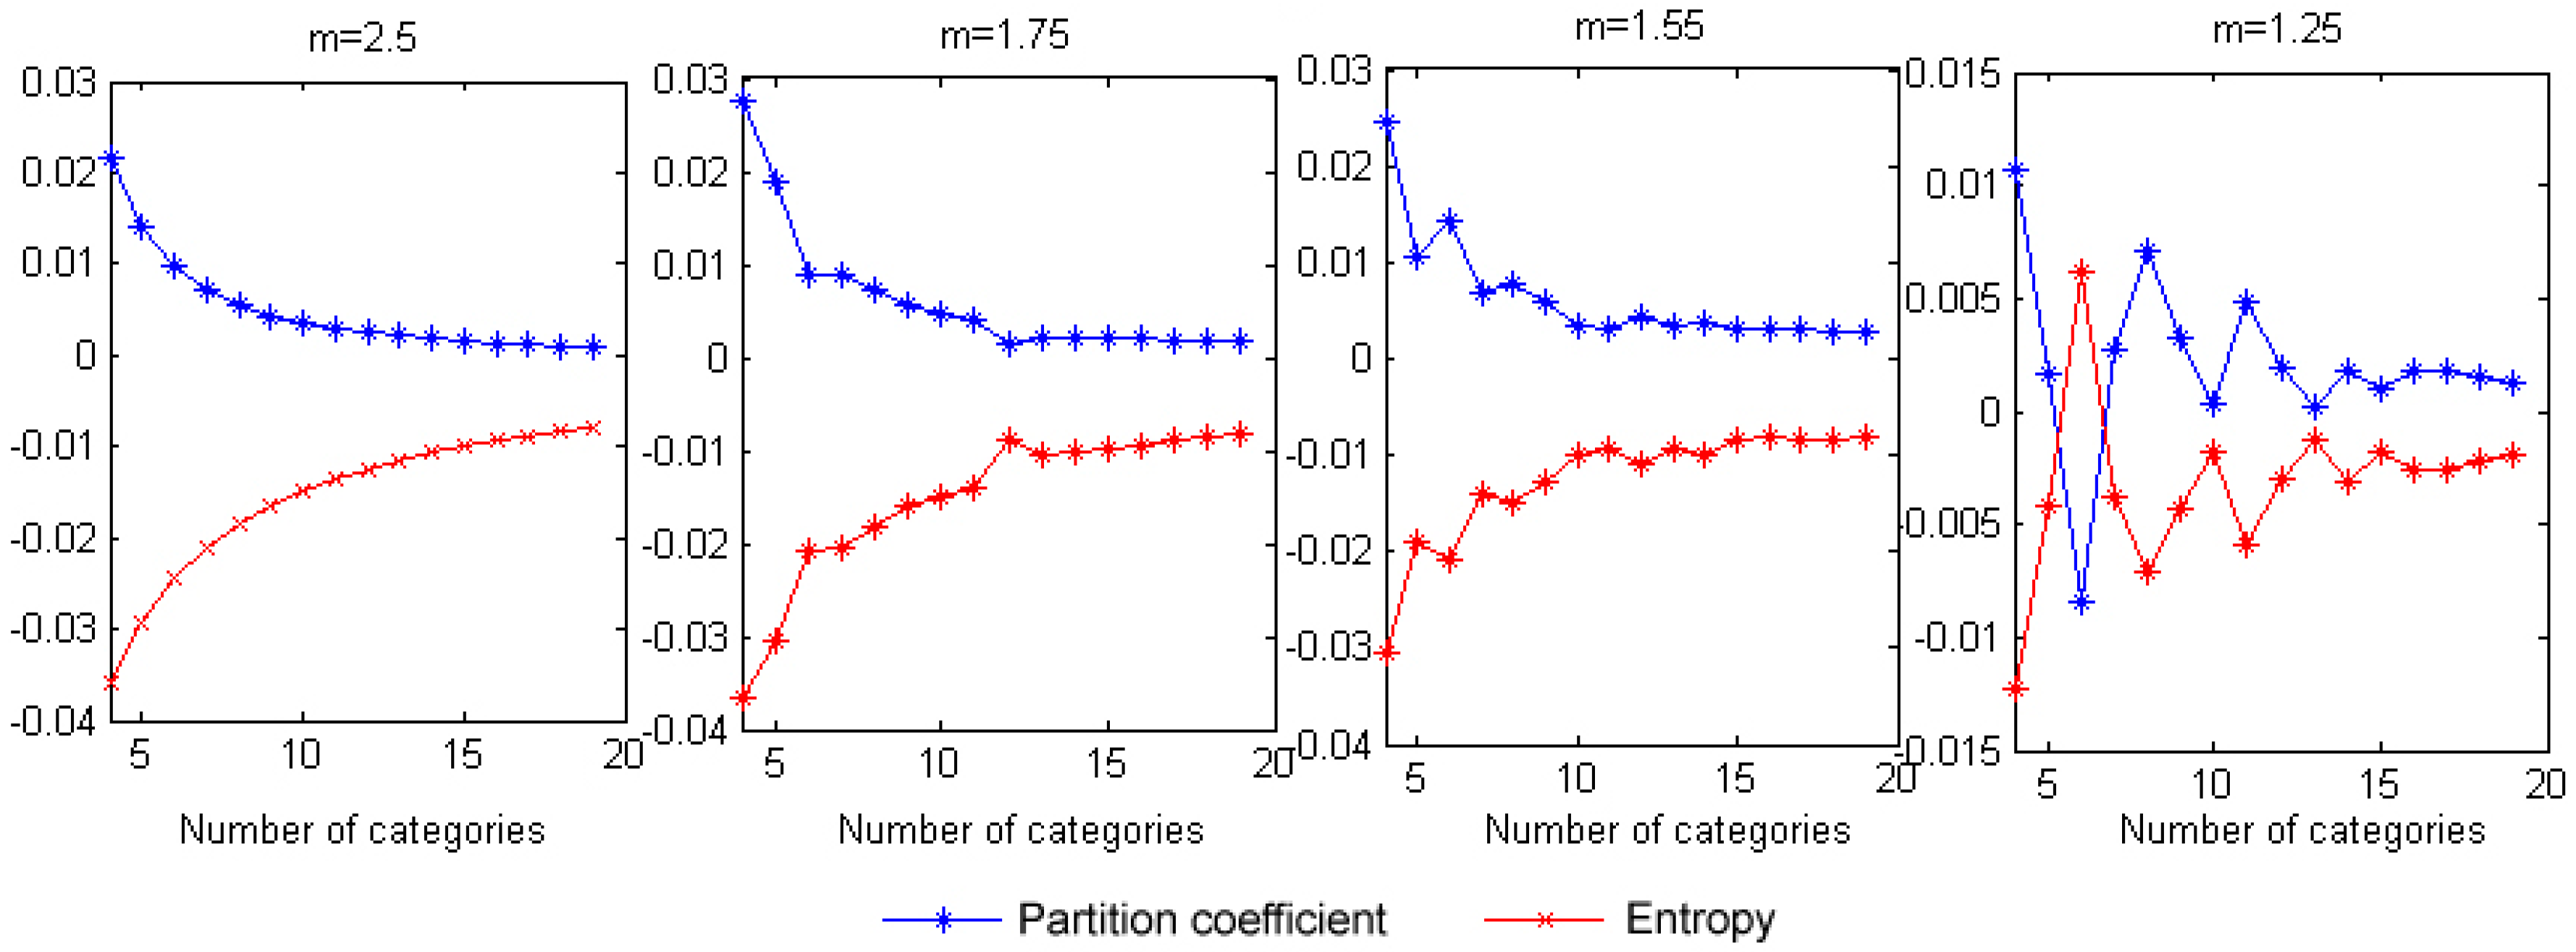
4.2. Validation
4.3. Data Availability
5. Conclusions
- (1)
- The new soil texture map produced by this study are more reliable than existing maps. This indicates that by combining the large number of soil profile data with environmental factors, we can obtain relatively good soil texture prediction results by applying the method based on the combination of a decision tree and fuzzy logic.
- (2)
- The targeted sampling method of fuzzy c-means is more applicable to regions with relatively large variations in topographic factors, when we can achieve the goal of increasing efficiency and implement soil prediction with the fewest possible sampling points; in vast areas with flat terrain, the environmental factors are the dominant controls, and the fuzzy c-means method is not applicable. In regions with flat terrain, we still require a number of sampling points to characterize the soil-landscape relationship and achieve fuzzy logic inference mapping.
- (3)
- Since the influence of the training samples is very strong in the shaping of the decision tree, the level of utilization efficiency changes significantly for the environmental factors based on the differences among the training samples and the combination of different environmental factors. Therefore, from the perspective of the level of utilization efficiency for the environmental factors in the decision tree, the influence of each environmental factor on soil formation is relative rather than absolute. We can only determine the dominant environmental factor once the combination of training samples and environmental factors is determined.
- (4)
- In the application of the SOLIM model to mapping soil texture for six landscape zones, there was no occurrence of texture plaque rupture at the boundaries of the individual zones. It is, therefore, reasonable to implement soil mapping by dividing the HRB into six zones based on ecological function. This also reflects the feasibility of using the fuzzy logic method for soil mapping.
- (5)
- Based on the fuzzy logic method, we can overcome the disadvantages of relatively low efficiency and relatively poor accuracy associated with the traditional soil mapping method. The generated soil map is expressed in raster format, which can more accurately characterize the spatial gradient features of soil. In comparison with traditional mapping methods, most processes in the mapping scheme in this study were accomplished with computers, and the mapping cycle is short. For example, we can update the current soil map by introducing new soil profiles or other soil distributions.
Acknowledgments
Author Contributions
Conflicts of Interest
References
- Gao, Y.H.; Chen, F.; Barlage, M.; Liu, W.; Cheng, G.D.; Li, X.; Yu, Y.; Ran, Y.H.; Li, H.Y.; Peng, H.C.; et al. Enhancement of land surface information and its impact on atmospheric modeling in the Heihe River Basin, northwest China. J. Geophys. Res. Atmos. 2008, 113, D20. [Google Scholar] [CrossRef]
- Jenny, H. Factors of Soil Formation: A System of Quantitative Pedology; McGraw-Hill: New York, NY, USA, 1941; p. 281. [Google Scholar]
- McBratney, A.; Santos, M.; Minasny, B. On digital soil mapping. Geoderma 2003, 117, 3–52. [Google Scholar] [CrossRef]
- McKenzie, N.J.; Austin, M.P. A quantitative Australian approach to medium and small scale surveys based on soil stratigraphy and environmental correlation. Geoderma 1993, 57, 329–355. [Google Scholar] [CrossRef]
- Sinowski, W.; Auerswald, K. Using relief parameters in a discriminant analysis to stratify geological areas with different spatial variability of soil properties. Geoderma 1999, 89, 113–128. [Google Scholar] [CrossRef]
- Henderson, B.L.; Bui, E.N.; Moran, C.J.; Simon, D.A.P. Australia-wide predictions of soil properties using decision trees. Geoderma 2005, 124, 383–398. [Google Scholar] [CrossRef]
- Odeh, I.O.; McBratney, A.B.; Chittleborough, D.J. Further results on prediction of soil properties from terrain attributes: Heterotopic cokriging and regression-kriging. Geoderma 1995, 67, 215–226. [Google Scholar] [CrossRef]
- Chang, D.; Islam, S. Estimation of Soil Physical Properties Using Remote Sensing and Artificial Neural Network. Remote Sens. Environ. 2000, 74, 534–544. [Google Scholar] [CrossRef]
- Goktepe, A.B.; Altun, S.; Sezer, A. Soil clustering by fuzzy c-means algorithm. Adv. Eng. Softw. 2005, 36, 691–698. [Google Scholar] [CrossRef]
- Zhu, A.X.; Hudson, B.; Burt, J.E.; Lubich, K. Soil mapping using GIS, expert knowledge and fuzzy logic. Soil Sci. Soc. Am. J. 2001, 65, 1463–1472. [Google Scholar] [CrossRef]
- Mckenzie, N.J.; Ryan, P.J. Spatial prediction of soil properties using environmental correlation. Geoderma 1999, 89, 67–94. [Google Scholar] [CrossRef]
- Li, X.; Cheng, G.D.; Lu, L. Comparison of spatial interpolation methods. Adv. Earth Sci. 2000, 3, 260–265. [Google Scholar]
- Zhu, A.X.; Yang, L.; Li, B.L.; Qin, C.Z.; Pei, T.; Liu, B.Y. Construction of membership function for predictive soil mapping under fuzzy logic. Geoderma 2010, 155, 164–174. [Google Scholar] [CrossRef]
- Shi, X.Z.; Yu, D.S.; Warner, E.D.; Pan, X.Z.; Petersen, G.W.; Gong, Z.G.; Weindorf, D.C. Soil Database of 1:1,000,000 Digital Soil Survey and Reference System of the Chinese Genetic Soil Classification System. Soil Surv. Horiz. 2004, 45, 129–136. [Google Scholar] [CrossRef]
- Nachtergaele, F.; Velthuized, H.V.; Verelst, L. Harmonized World Soil Database (version 1.1); FAO: Rome, Italy; IIASA: Laxenburg, Austria, 2009. [Google Scholar]
- Shi, X.Z.; Yu, D.S.; Warner, E.D.; Pan, X.Z.; Sun, X.; Petersen, G.W.; Gong, Z.G.; Lin, H. Cross Reference System for translating Between Genetic Soil Classification of China and Soil Taxonomy. Soil Sci. Soc. Am. J. 2006, 70, 78–83. [Google Scholar] [CrossRef]
- Shi, X.Z.; Yu, D.S.; Yang, G.X.; Wang, H.J.; Sun, W.X.; Du, G.H.; Gong, Z.T. Cross-reference Benchmarks for Correlating the Genetic Soil Classification of China and Chinese Soil Taxonomy. Pedosphere 2006, 16, 147–153. [Google Scholar] [CrossRef]
- Shangguan, W.; Dai, Y.J.; Liu, B.Y.; Ye, A.Z.; Yuan, H. A soil particle-size distribution dataset for regional land and climate modelling in China. Geoderma 2012, 171–172, 85–91. [Google Scholar] [CrossRef]
- Song, X.D.; Liu, F.; Zhang, G.L.; Li, D.C.; Zhao, Y.G. Estimation of Soil Texture at a Regional Scale Using Local Soil-Landscape Models. Soil Sci. 2016, 181, 435–445. [Google Scholar] [CrossRef]
- Yang, R.M.; Liu, F.; Zhang, G.; Zhao, Y.G.; Li, D.C.; Yang, J.L.; Yang, F.; Yang, F. Mapping soil texture based on field soil moisture observations at a high temporal resolution in an oasis agricultural area. Pedosphere 2016, 26, 699–708. [Google Scholar] [CrossRef]
- Li, X.; Cheng, G.D.; Liu, S.M.; Xiao, Q.; Ma, M.G.; Jin, R.; Che, T.; Liu, Q.H.; Wang, W.Z.; Qi, Y.; et al. Heihe Watershed Allied Telemetry Experimental Research (HiWATER): Scientific objectives and experimental design. Bull. Am. Meteorol. Soc. 2013, 94, 1145–1160. [Google Scholar] [CrossRef]
- Cheng, G.D.; Li, X.; Zhao, W.Z.; Xu, Z.M.; Feng, Q.; Xiao, S.C.; Xiao, H.L. Integrated study of the water-ecosystem-economy in the Heihe River Basin. Natl. Sci. Rev. 2014, 1, 413–428. [Google Scholar] [CrossRef]
- Cheng, G.D.; Li, X. Integrated research methods in watershed science. Sci. China Earth Sci. 2015, 58, 1159–1168. [Google Scholar] [CrossRef]
- Lu, L.; Li, X.; Cheng, G.D. Landscape evolution in the middle Heihe River Basin of northwest China during the last decade. J. Arid Environ. 2003, 53, 395–408. [Google Scholar] [CrossRef]
- Editorial Board of Vegetation Map of China, Chinese Academy of Sciences. Vegetation Map (1:1,000,000) in China; Science Press: Beijing, China, 2001. (In Chinese) [Google Scholar]
- Ma, M.G.; Frank, V. Reconstructing Pathfinder AVHRR Land NDVI time-series data for the Northwest of China. Adv. Space Res. 2006, 37, 835–840. [Google Scholar] [CrossRef]
- Editorial Board of Geomorphological Atlas of the People’s Republic of China. Geomorphological Atlas of the People’s Republic of China (1:1,000,000); Science Press: Beijing, China, 2009. (In Chinese) [Google Scholar]
- Editorial Group of Digital Geological Map Database of P.R. China. Digital Geological Map Database of the People’s Republic of China (1:500,000); China Geological Survey Bureau: Beijing, China, 1999. (In Chinese)
- Zhang, W.H.; Lian, C.; Chen, H.; Li, S.L. MapInfo-based 1/500,000 digital geological map database of the People’s Republic of China. Seismol. Geol. 2005, 27, 470–478, (In Chinese, English abstract). [Google Scholar]
- Liu, J.; Liu, M.; Deng, X.; Zhuang, D.; Zhang, Z.; Luo, D. The land use and land cover change database and its relative studies in China. J. Geogr. Sci. 2002, 12, 275–282. [Google Scholar]
- Li, X.; Nan, Z.T.; Cheng, G.D.; Ding, Y.J.; Wu, L.Z.; Wang, L.X.; Wang, J.; Ran, Y.H.; Li, H.X.; Pan, X.D.; et al. Toward an improved data stewardship and service for environmental and ecological science data in west China. Int. J. Digit. Earth 2011, 4, 347–359. [Google Scholar] [CrossRef]
- Zhu, A.X. Fine Diginal Soil Survey Model and Method; Science Press: Beijing, China, 2008; p. 227. [Google Scholar]
- Lu, L.; Liu, C.; Li, X.; Ran, Y.H. Soil Texture Dataset of the Heihe River Basin. Cold and Arid Regions Science Data Center at Lanzhou. 2011. Available online: http://westdc.westgis.ac.cn/data/03f0754b-8ce3-40aa-ab69-b3167154082b (accessed on 10 July 2017).


| Knowledge Type | Type 1 | Type 2 | Types 3/4/5 | Type 6 | Type 7 | Type 8 | |
|---|---|---|---|---|---|---|---|
| Elevation | Type-I knowledge | 3208–4377 | 3088–4168 | 3656–4820 | 1837–3479 | 2566–3803 | 2840–4231 |
| Type-II knowledge | 2918–4653 | 2558–4702 | 2569–s | z–5025 | 2334–4326 | 1937–4890 | |
| Vegetation Index | Type-I knowledge | 54.2–90.8 | 66.4–102.9 | 26.6–64.5 | 42.8–82.3 | 84.3–152.5 | 44–85 |
| Type-II knowledge | 31–105 | 35–128 | z–112 | 24–98 | 66–s | 24–126 | |
| Plane curvature | Type-I knowledge | −17.3–20.8 | −20.3–16.1 | −25.7–12.1 | −27.3–25.7 | −16.4–22.4 | −11–15 |
| Type-II knowledge | −287–196 | –299–169 | z–192.6 | −173–s | −179–349 | −63–164 | |
| Cross section curvature | Type-I knowledge | −11.4–13.8 | −11.6–15.3 | −28.4–13.2 | −13.8–19.4 | –8.9–20.1 | 0.5–27.9 |
| Type-II knowledge | −53–66 | −73–66 | −73.2–50.7 | z–85 | –64–83 | −86–s | |
| Radiation | Type-I knowledge | 4724.8–5152 | 4647–5228 | 4194–4997 | 4782–5658.3 | 4795.3–5431 | 4681–5317 |
| Type-II knowledge | 4376–5535 | 4156–5544 | z–5414 | 4431–s | 4309–5669 | 3617–5719 | |
| Precipitation | Type-I knowledge | 255.1–500.8 | 611–971.4 | 298.2–725 | 99.6–387.3 | 320.6–673 | 243–596 |
| Type-II knowledge | 212–720 | 404–s | 172–1247 | z–676 | 212–833 | 129–1248 | |
| Slope | Type-I knowledge | 0.2–7.1 | 4.9–13.5 | 6.9–17.2 | 0.5–10.7 | 2.1–11.6 | 11.8–19.9 |
| Type-II knowledge | z–11.6 | 0.75–28.47 | 0.91–31.9 | z–17.67 | z–19.3 | 5.58–s | |
| Air temperature | Type-I knowledge | −8.7 to −1 | −10.4 to –1 | −12.6 to –2.2 | −3.3–7.3 | −5.5–2.2 | −9.43 to −0.24 |
| Type-II knowledge | −14.6–1.11 | −14.1–0.1 | z–2.5 | −17.3–s | −14.3–4.8 | −19.8–6.5 |
| Silt Loam | Loam | Sand | Loamy Sand | Sandy Loam | Total | Producer’s Accuracy | |
|---|---|---|---|---|---|---|---|
| Silt Loam | 17 | 2 | 0 | 2 | 4 | 25 | 0.68 |
| Loam | 2 | 5 | 0 | 0 | 2 | 9 | 0.56 |
| Sand | 0 | 0 | 1 | 0 | 0 | 1 | 1 |
| Loamy Sand | 0 | 0 | 0 | 0 | 0 | 0 | 0 |
| Sandy Loam | 2 | 1 | 0 | 0 | 11 | 14 | 0.79 |
| Total | 21 | 8 | 1 | 2 | 17 | 49 | |
| User’s accuracy | 0.81 | 0.63 | 1 | 0 | 0.65 | ||
| Overall accuracy = 0.694 | |||||||
© 2017 by the authors. Licensee MDPI, Basel, Switzerland. This article is an open access article distributed under the terms and conditions of the Creative Commons Attribution (CC BY) license (http://creativecommons.org/licenses/by/4.0/).
Share and Cite
Lu, L.; Liu, C.; Li, X.; Ran, Y. Mapping the Soil Texture in the Heihe River Basin Based on Fuzzy Logic and Data Fusion. Sustainability 2017, 9, 1246. https://doi.org/10.3390/su9071246
Lu L, Liu C, Li X, Ran Y. Mapping the Soil Texture in the Heihe River Basin Based on Fuzzy Logic and Data Fusion. Sustainability. 2017; 9(7):1246. https://doi.org/10.3390/su9071246
Chicago/Turabian StyleLu, Ling, Chao Liu, Xin Li, and Youhua Ran. 2017. "Mapping the Soil Texture in the Heihe River Basin Based on Fuzzy Logic and Data Fusion" Sustainability 9, no. 7: 1246. https://doi.org/10.3390/su9071246
APA StyleLu, L., Liu, C., Li, X., & Ran, Y. (2017). Mapping the Soil Texture in the Heihe River Basin Based on Fuzzy Logic and Data Fusion. Sustainability, 9(7), 1246. https://doi.org/10.3390/su9071246