1. Introduction
Over the past decades, the increasing globalisation of markets has been reflected in a rapid and significant expansion of international trade. According to data by the World Bank [
1], the total volume of traded goods and services has grown almost twice as fast as global gross domestic product (GDP) since 1990. This phenomenon has been particularly evident in developing nations, whose volume of trade rose by a factor of five during this period, while that of advanced economies grew by a factor of three. These trends have been accompanied by a reconfiguration of the international division of labour and an associated geographical fragmentation of production and consumption [
2,
3]. Companies increasingly found that outsourcing portions of the production process offshore was profitable, thus becoming a standard practice [
4]. Materials are, in this sense, extracted from diverse regions around the planet to manufacture and assemble products in different countries, to be distributed to yet other economies for consumption. This fragmentation is revealed in the growing share of value that is added outside the country of completion along most product chains [
5,
6]. A new trade reality has thus been forged, where the rise of global value chains has intensified the interdependence of nations.
The UK is a major player in this new trade reality. It represented the world’s 9th largest economy in purchasing power parity terms in 2015, according to the World Bank [
1]. As many other developed nations, the UK has become a service economy, gradually offshoring its industry, mainly as a cost-saving strategy, and increasingly relying on foreign markets to acquire products and services that are vital to fulfil its material needs [
2,
7]. Its volume of trade represents 10.7% of the total for the European Union, having expanded by 2.8 times from 1990 to 2015 [
1]. According to Greenaway, et al. [
8], the deindustrialisation process has led to the displacement of around two million jobs in UK manufacturing between 1979 and 1991. Figures from the International Labour Organization [
9] show that a further 1.9 million jobs were displaced from 1992 to 2015. As the total amount of jobs in the country continued to grow over the period, this suggests that these jobs were absorbed into other occupations and activities, mainly in services [
10]. Industrial value added, in turn, remained relatively stable in real terms during the period according to figures from the UK Office for National Statistics (ONS) [
11], which indicates the presence of productivity gains from a territorial perspective. In turn, the share of industrial value added, as a percentage of GDP, declined from 31.6% in 1990 to 20.2% in 2015, close to the average share in high-income economies of 24.7% in 2014 [
1]. This reflects a deep restructuring of the UK industrial sector.
As expected, the complex reorganisation of the UK economy has had economic, political, social and environmental implications. In environmental terms, the offshoring of UK industries has allowed it to reduce its territorial emissions, which contributes to achieving its emissions reduction commitments [
12]. Nonetheless, the country’s reliance on imports has transformed it into a net importer not only of emissions, but also of employment. While the UK’s emissions footprint represents the pressure that UK consumption exerts on the planet’s climate, its labour footprint represents the employment that is created in different regions of the globe due to its demand for imported products and services.
This paper focuses on the UK case, for which there is sufficient data to conduct a detailed analysis over time. The UK’s greenhouse gas (GHG) emissions and employment footprints are estimated here for the period 1997 to 2012 with a two-fold objective. First, both footprints are analysed in terms of their behaviour, drivers and sectoral and regional composition. Second, the relationship between both measures is explored by estimating the elasticity between the growth of emissions and employment embodied in imports.
The attempt to address the UK’s rising reliance on imports and implement reindustrialisation strategies is a topic that has gained more interest with Brexit. Claims to protect manufacturing jobs from globalisation and reactivate certain industrial activities have become a common political discourse. Reshoring the UK industry, nonetheless, is not a straightforward task, most certainly implying limitations and high associated costs [
13]. Relying less on foreign markets could contribute to shrink the country’s emissions footprint and generate more employment domestically. But this can also imply adverse consequences for its trade partners [
14]. The results presented in this paper thus have important policy implications. Reducing UK imports involves clear trade-offs in terms of emissions and employment. It is not clear if the UK or other advanced economies could adopt reindustrialisation strategies successfully in the future. It is also difficult to determine at this point what the Brexit process could bring. What is certain is that the UK, as well as other advanced and emerging economies, should increase their efforts to avoid dangerous climate change. In this sense, the UK could contribute to curbing emissions outside its borders by offering increased support to its emission-intensive trade partners in the form of technology transfer and financial aid to help them achieve emissions reductions, while safeguarding jobs in the developing world.
The remainder of the paper is structured as follows. The next section provides some background on the nexus between trade, emissions and employment. The methodology and data used in the analysis are explained in the subsequent section. The results are presented and discussed next, highlighting some policy implications. Conclusions are offered at the end.
2. Trade, Emissions and Employment
The consequences of the trade reality that the world currently faces are manifested in various domains. Of particular interest are the implications for development and the environment, which have been amply discussed in the literature [
15,
16,
17,
18,
19].
Starting with the relationship between trade and development, the prevailing view is that more open economies register higher rates of economic growth, based on the claim that trade incentivises productivity gains and competitiveness in domestic industries [
20,
21,
22,
23,
24]. There are, nonetheless, some critical views on the matter, mainly rooted in the ideas of Prebisch [
25] and Singer [
26], who suggest that the terms of trade of developing nations tend to deteriorate over time in comparison to those of their developed counterparts. Others believe that the existent empirical evidence regarding this issue is inconclusive due either to methodological problems [
27] or the use of inadequate assumptions [
28]. Nonetheless, numerous developing countries have opened their economies and adopted export-led models of growth as a development strategy in an attempt to reap the benefits of international trade, such as poverty reduction, job creation and foreign direct investment [
29,
30,
31].
The links between trade and the environment also represent a contested matter. Those who advocate that trade is good for the environment generally base their arguments on a logic related to the Environmental Kuznets Curve (EKC) hypothesis. In simple terms, this hypothesis states that environmental conditions tend to improve as countries advance towards higher echelons of economic development and income per capita [
32]. Empirical evidence shows that the EKC only holds true for some types of local and short-lived pollutants, but is not applicable to global and long-term problems, such as GHG emissions [
33,
34]. A more predominant view, however, considers that the production of traded goods has accelerated environmental pressure and generated serious impacts, both locally and globally, in the form of pollution, resource depletion, and biodiversity loss, among others [
35,
36,
37]. According to Wiedmann [
38], at least a fifth and up to 64% of global environmental impacts can be linked to international trade, being GHG emissions the indicator that has attracted more attention.
The nexus between trade and emissions is intrinsically linked to the ongoing political debate on the allocation of responsibility among nations for reducing GHG emissions [
39]. The United Nations Framework Convention on Climate Change (UNFCCC) adopts a production-based accounting framework, whereby countries are responsible for the emissions generated within their territories to produce goods and services. Emissions, however, can be alternatively accounted for from a consumption approach, which means that countries are held responsible for the emissions associated with the goods and services they consume. The basic difference between both approaches is the treatment of emissions embodied in exports and imports [
40]. Territorial or production emissions take into account the domestic and export components, while consumption emissions exclude exports and include imports.
Previous studies have consistently shown that developed countries have become net importers of emissions, while the developing world is generally a net exporter [
41,
42]. This indicates that there has been a transfer of emissions from the latter to the former group of countries, which has grown by a factor of four from 1990 to 2008 [
43]. Some authors consider this transfer of emissions as a form of carbon leakage, which has been driven by an increasing demand for imports in advanced economies [
44]. These transfers have important climate policy implications, as reductions made so far by net-importing countries with internationally agreed mitigation commitments tend to be less significant from a consumption approach [
43,
45].
An aspect that has been attracting attention is the determination of the value that is added along global supply chains [
46]. Daudin, et al. [
47], for instance, estimated that around 32% of the world’s industrial value added is associated with foreign consumption. An important part of this value added is comprised by payments to labour, one of the factors of production. Alsamawi, et al. [
48] calculated wages and labour embodied in international trade, finding that the largest flows of labour tend to be unidirectional, originating in developing economies like China, India, Russia, Indonesia, and Mexico, to fulfil the consumption requirements of developed economies. However, many of the major flows of wages occur between developed countries. The authors indicate that the full-time equivalent work of more than 200 million labourers is embodied in exports from China and India alone.
Most of the existing studies have usually focused on examining embodied emissions and other ‘virtual’ contents on an individual basis, while little attention has been devoted to understand the more complex relationship between these footprint indicators. A handful of studies have examined the triangle formed between trade, its economic benefits and its environmental implications. Arto, et al. [
49] conducted a study in this regard, focusing on emissions and employment. The authors found that 24% of global GHGs and 20% of total employment are embodied in international trade flows. Their results also show that China exported 30% of traded emissions and hosted 37.5% of jobs generated by trade around the world. Simas, et al. [
50] measured the labour, energy, and emissions footprints of the European Union, finding that the region has tended to offshore its production to cheaper and low-skilled, labour-abundant countries, offsetting any energy efficiency gains achieved domestically. Sakai and Barrett [
51], in turn, introduced the concept of ‘labour productivity of carbon’, an efficiency indicator that specifies the amount of labour (i.e., number of jobs, wages paid, etc.) associated with every kilogram of CO
2 released during the production of export goods. They show that when it comes to unskilled labour, the most productive activity in high-income economies is services, while agricultural activities are the most productive in low-income nations.
Understanding the specificities of the trade-emissions-employment triangle is important, in order to ensure the consistency of trade, development and environmental policies. This paper seeks to address this gap in the literature and offer useful insights for both climate and development policies by undertaking a detailed analysis of the UK’s emissions and labour footprints.
3. Materials and Methods
Multi-regional input-output (MRIO) analysis has been broadly used to estimate the embodied or ‘virtual’ content of trade flows (e.g., emissions, water, value added, etc.) [
52]. In standard input-output notation, economic output (X) is given by:
where I represents an identity matrix, A is the technical coefficients matrix and Y is final demand. The term (I − A)
−1 is known as the Leontief inverse (hereafter identified as L), which indicates the extent to which output rises in each sector derived from a unit increase in final demand.
In an MRIO framework (see: Miller and Blair [
53]), the technical coefficients matrix (A) accounts for the proportion of intermediate inputs, both domestic and foreign, that a sector from country “
n” requires to produce one unit of output. In this sense, the sectoral requirements of region “
n” are decomposed into a domestic component, which represents inter-industry relationships within the region, and another one that represents imports, which shows the inter-industry relationships with other sectors located in the “
n-th” region.
Matrices X and Y include total output and final demand, respectively, of all sectors located in all regions. Regarding Y, it incorporates the components of final demand (i.e., private and public consumption, gross capital formation and change in stocks) and direct exports to final demand.
The input-output framework can be extended to incorporate emissions or other variables, as long as these are a function of total output. In the case of GHGs, a row vector of emissions disaggregated by sectors and regions is included in the model. The emissions generated by sector “
i” are divided by the corresponding output (X
i), resulting in a diagonalised vector of direct intensity multipliers (
). Post-multiplying these intensities by the
L matrix yields total intensity multipliers. The diagonalised vector
provides a set of weights to
L, so post-multiplying
L by Y allows determining the direct and indirect emissions (
G) originated from a given level of final demand.
Similarly, a diagonalised vector of employment
can also be included following the same procedure to calculate direct and indirect employment requirements (E) to fulfil a certain level of final demand.
The “i-th” row of the G and E matrices represents production-based measures; that is, the emissions or employment that are generated in country “n” in order to satisfy the domestic and foreign consumption of its goods and services. On the other hand, the “j-th” column stands for consumption-based measures, or well the emissions or employment that are created not only in country “n” but also in other countries, so as to satisfy country n’s consumption of domestic and imported goods and services.
3.1. Structural Decomposition Analysis
Structural decomposition analysis (SDA) has been widely used in the context of input-output analysis to decompose the growth observed in a certain variable into the changes in its determinants [
54]. This technique thus allows quantifying the relevant root causes of change in a wide range of variables, including economic growth, energy use, labour requirements and many other [
55,
56].
In this paper, we use an additive decomposition procedure (also called additive identity splitting, see: Rose and Casler [
55]) as described in Miller and Blair [
53]. We decompose the growth in both the emissions and labour footprints into changes in intensity (emissions or labour per unit of output), industrial structure (i.e., inter-industry requirements represented by the A matrix) and final demand. In this sense, the change in a variable, here denoted as 𝜦 (included in the MRIO model as a vector extension and which can stand for emissions or employment in this analysis), is given by the following expression:
where superscripts 0 and 1 indicate the initial and final years, respectively, and Δ indicates changes in a variable between year 0 and 1. L stands for the Leontief inverse, Y represents the final demand matrix, and
is a diagonalised vector of direct intensity multipliers (i.e., units of 𝜦 per unit of output). The first term in the right-hand side stands for the fraction of the change in 𝜦 due to improvements in emissions or labour intensity. The second term represents the portion caused by technological improvements as reflected in industrial structure, and the third term indicates the proportion of the change owed to final demand.
It is important to mention that in some cases several determinants might not be independent from each other. Dietzenbacher and Los [
57], in this regard, warn that SDA should be treated with caution, since the technique assumes that the determinants are independent. In this analysis, it cannot be expected that a change in intensities (i.e., Δ
) can occur independently of the technology matrix used to calculate L. Dietzenbacher and Los [
57] propose a solution, but it is seldom applied. In fact, only few studies highlight this matter [
58,
59]. There is not a straightforward solution to rearrange the terms so as to avoid dependency problems, and we acknowledge that this issue might affect the SDA results presented in this paper by not completely isolating the effects derived from changes in intensity and industrial structure.
3.2. Data
An environmentally-extended MRIO model requires a substantial amount of data, and this represents a greater challenge when constructing time series of input-output tables. Domestic and import tables are needed for each region, as well as bilateral trade data and environmental impact variables. The UK MRIO database, described in greater detail in Owen, et al. [
60], provides these data requirements and includes input-output time series. This database is used to produce the UK’s official consumption-based indicators (i.e., footprints) for carbon dioxide and six other main GHGs, published by the UK Department for Environment, Food & Rural Affairs (DEFRA) [
61]. Given that these are official statistics, preferably they must be constructed using available data from UK official sources. The ONS publishes supply and use tables (SUTs) for the UK economy on an annual basis, starting from 1997 [
62]. The ONS also publishes domestic analytical tables, which are used to construct import tables (see [
60] for a more detailed explanation). The UK SUTs are disaggregated at a level of 106 sectors, following the classification used in the UK’s National Accounts.
UK data is supplemented with the Eora database [
63] to form the UK MRIO. Eora provides a time series of high resolution input-output tables for 187 countries, which contains data on bilateral trade between nations, including the UK. The Eora database is mapped onto the ONS sectoral classification. Given that Eora possesses a heterogeneous sector disaggregation, we manipulate the countries’ input-output tables in order to comply with the 106 sector classification using concordance matrices. Once the ONS and Eora data are combined, the resulting MRIO table is balanced using the RAS technique [
53]. After this task has been undertaken, the data is further aggregated into regions to simplify the analysis. Since Eora comprises an extensive number of countries, we opted for selecting an appropriate regional grouping that is illustrative for UK trade. We constructed twelve regions: the UK, China, India, Japan, Russia, Africa, Asia, Europe, the Middle East, North America, Oceania, and South America.
All the input-output tables were deflated in order to transform them into constant prices [
64]. Deflator data for the UK were taken from the ONS [
11], while for the rest of the regions in the dataset, deflators were taken from the World Input-Output Database (WIOD) [
65].
Regarding the MRIO extensions, a vector of emissions and another vector for employment were constructed. The emissions vector consists of total annual GHG emissions for all the regions disaggregated into sectors. GHG data for the UK were taken from the annual statistics published by the ONS environmental accounts and the Department for Business, Energy & Industrial Strategy (BEIS). GHG data for the rest of the countries in the database were obtained from Eora. In regards to the employment vector, we constructed it using data from the ONS in the case of the UK and from Eora for the rest of the world. ONS employment data is expressed in number of employment jobs, while Eora data is expressed in full-time equivalent employment. The amount of employee jobs is not equal to the total amount of available jobs in an economy, since one person can hold more than one job (see: [
66]). Full-time equivalent employment, according to the OECD, is “
the number of full-time equivalent jobs, defined as total hours worked divided by average annual hours worked in full-time jobs” [
67]. After comparing the ONS figures with the UK data provided by Eora, we found that both datasets were aligned, thus deciding to use ONS information for the UK. For reasons of simplicity, we will hereafter refer to employment as being expressed in number of jobs.
Further information about the data and sources used in this analysis is offered in
Appendix A.
4. Results
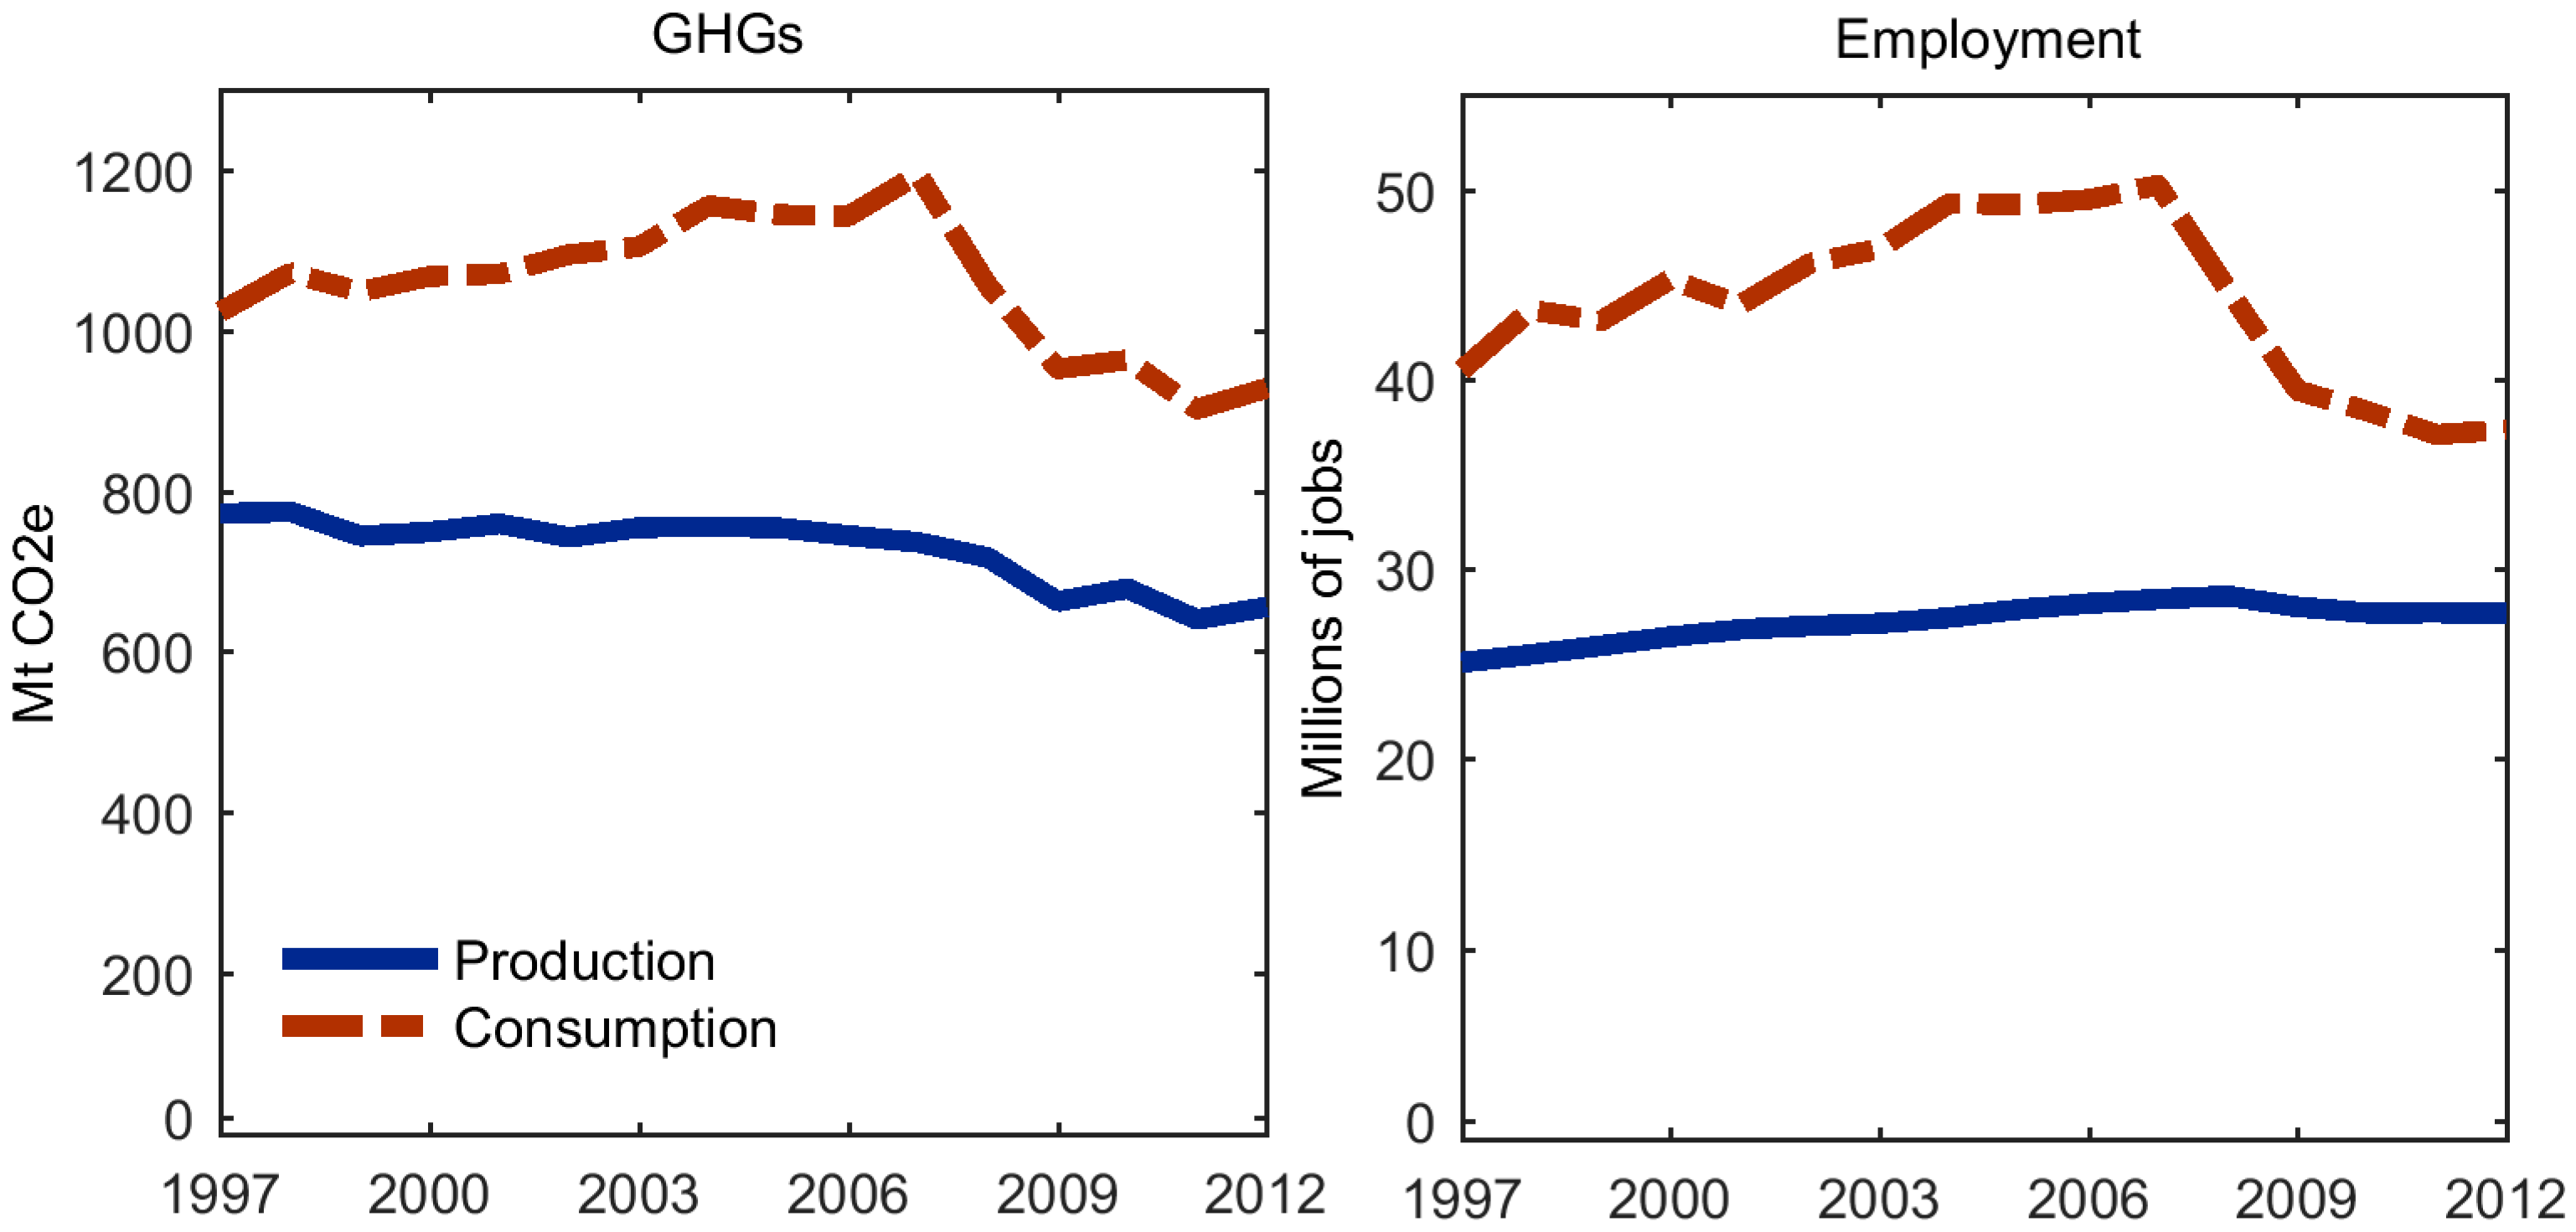
The UK is a net importer of embodied emissions, since it imports more emissions than those it exports. Similarly, the UK is a net importer of employment embodied in traded goods. Hence, the amount of employment that it creates in foreign countries via international trade is greater than the amount of employment that is generated by its local export sectors. This can be clearly appreciated in
Figure 1, in which the consumption curves (i.e., GHG and employment footprints) lie above the territorial ones (herein referred to as production). The space between both types of curves represents the net transfer of both emissions and labour embodied in trade flows.
Production emissions declined by about 1.1% per year on average during the period 1997–2012. Consumption emissions (i.e., emissions footprint), in turn, rose by 1.6% every year on average until 2008. From that point on, they showed an important annual drop of about 3.2% on average with respect to previous levels, due to a significant plunge of 9.2% in imports during the financial crisis. The trends for both types of emissions can be appreciated in
Figure 1.
Production emissions are composed of domestic and export emissions. The former represents the emissions that are associated with goods and services consumed domestically, while the latter component includes the emissions that are created within the UK to produce exports. Domestic emissions amounted to around 550 MtCO2e in 1997 and descended to about 450 MtCO2e in 2012. Emissions linked to exports waned at a similar rate, from slightly more than 200 MtCO2e in 1997 to almost 185 MtCO2e in 2012, a yearly average drop of nearly 0.9%. Consumption emissions, in turn, include the domestic component plus emissions embodied in imports. UK’s consumption was associated with the generation of approximately 525 MtCO2e on average per annum around the globe during the period of study. A more thorough examination of these emissions is presented below.
In relation to employment, the number of jobs in the UK grew constantly by a rate of 1.3% annually until 2008, when it started to drop by about 0.8% every year. The UK’s employment footprint increased before the crisis faster than domestic employment at a rate of 2.2%, but fell strongly afterwards by 4.4% per year.
Employment linked to goods and services destined for domestic consumption amounted to around 17 million persons employed in 1997, rising to 18 million in 2012. Employment associated with exports, in turn, expanded slightly faster, from nearly 8.5 million in 1997 to 9.5 million in 2012. On the other hand, the UK generated an average of 25 million jobs on a yearly basis across the world during the period. Employment linked to imports rose quickly until 2007 at an average annual pace of 2.8%, but then descended drastically after the crisis, as will be explained with more detail below.
The financial crisis caused a significant influence on both the emissions and employment footprints. In both cases, their 2012 levels were lower than at the beginning of the period. However, both footprints have started to show signs of becoming more stable.
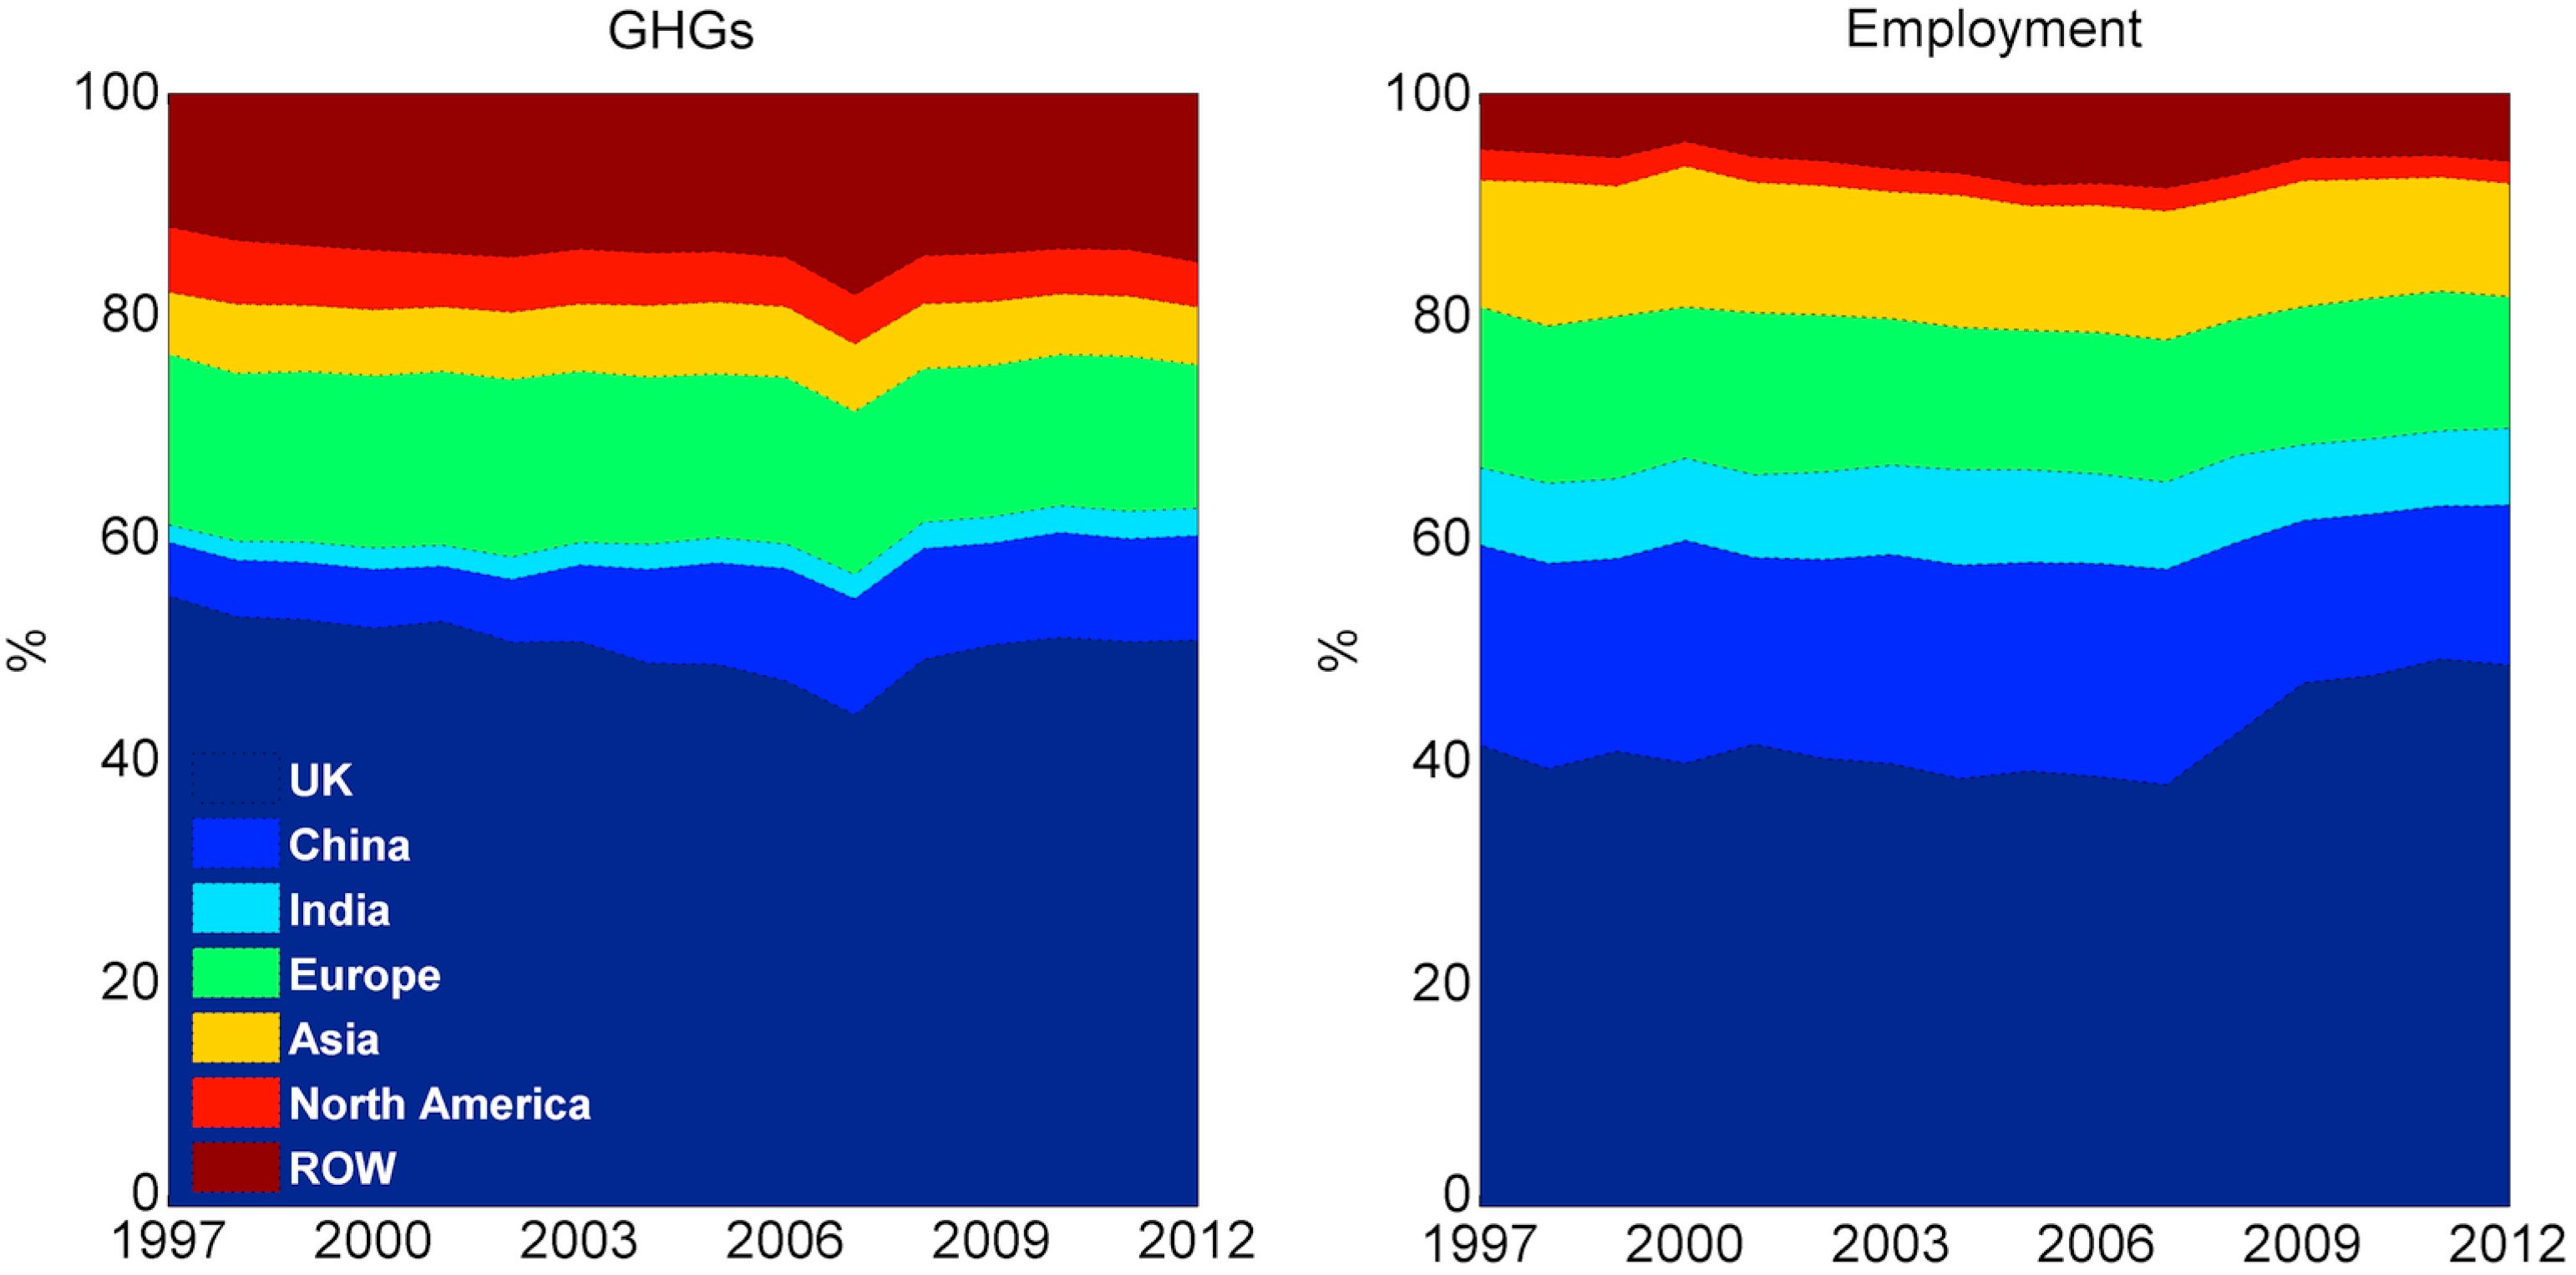
The GHG and employment footprints can be regionally decomposed with the purpose of determining the geographical areas where emissions and employment are created to satisfy the UK’s needs. In relation to GHGs, around half of the emissions were generated within the UK during the period of study, as can be seen in
Figure 2. However, domestic emissions showed a gradual decline, reflecting an increasing dependency on imports. Domestic emissions represented around 55% of the total footprint in 1997 and went down to 44% in 2007. However, given the decline in imports registered during the financial crisis, their share increased again to 51% in 2012.
China’s contribution to the emissions footprint was relatively low in 1997, amounting to about 5%, but it quickly doubled one decade later as it increased its participation in global markets. The effects of the financial crisis barely affected China’s share, which just observed a small reduction, representing around 9.5% in 2012. In relation to other regions, approximately 15% of the UK’s GHG footprint corresponds to the rest of Europe, and this share remained relatively steady, although with some slight reductions since 2009. A similar stable pattern can be appreciated in the case of the rest of Asia, whose contribution amounted to about 6% on average during the period. North America’s share, which includes the US, slowly declined from about 6% in 1997 down to 4% in 2012. The rest of the world (ROW) contributed with an average of 14%, and more specifically Russia and Africa, which are not shown in the graphs.
Regarding the employment footprint, around 40% of the jobs required to produce goods and services consumed in the UK were domestic, as can be seen in
Figure 2. Nonetheless, this share registered an increase since the financial crisis, again due to the fall in trade. The country that benefited the most by UK’s consumption is China, with an average 7.7 million jobs during the period. China’s share in the UK’s labour footprint declined slightly after the crisis, ranging from 19% in 2007 and going down to 14% in 2012. India is the second country that benefited from engaging in trade with the UK with an average of 3.3 million jobs. Its share of the total footprint remained relatively stable with an average of 7.5%. The next two most important regions were the rest of Europe and the rest of Asia, representing on average 13% and 11% of the footprint, respectively. North America held a relatively steady portion of about 2% throughout the years. The ROW represented around 8% on average.
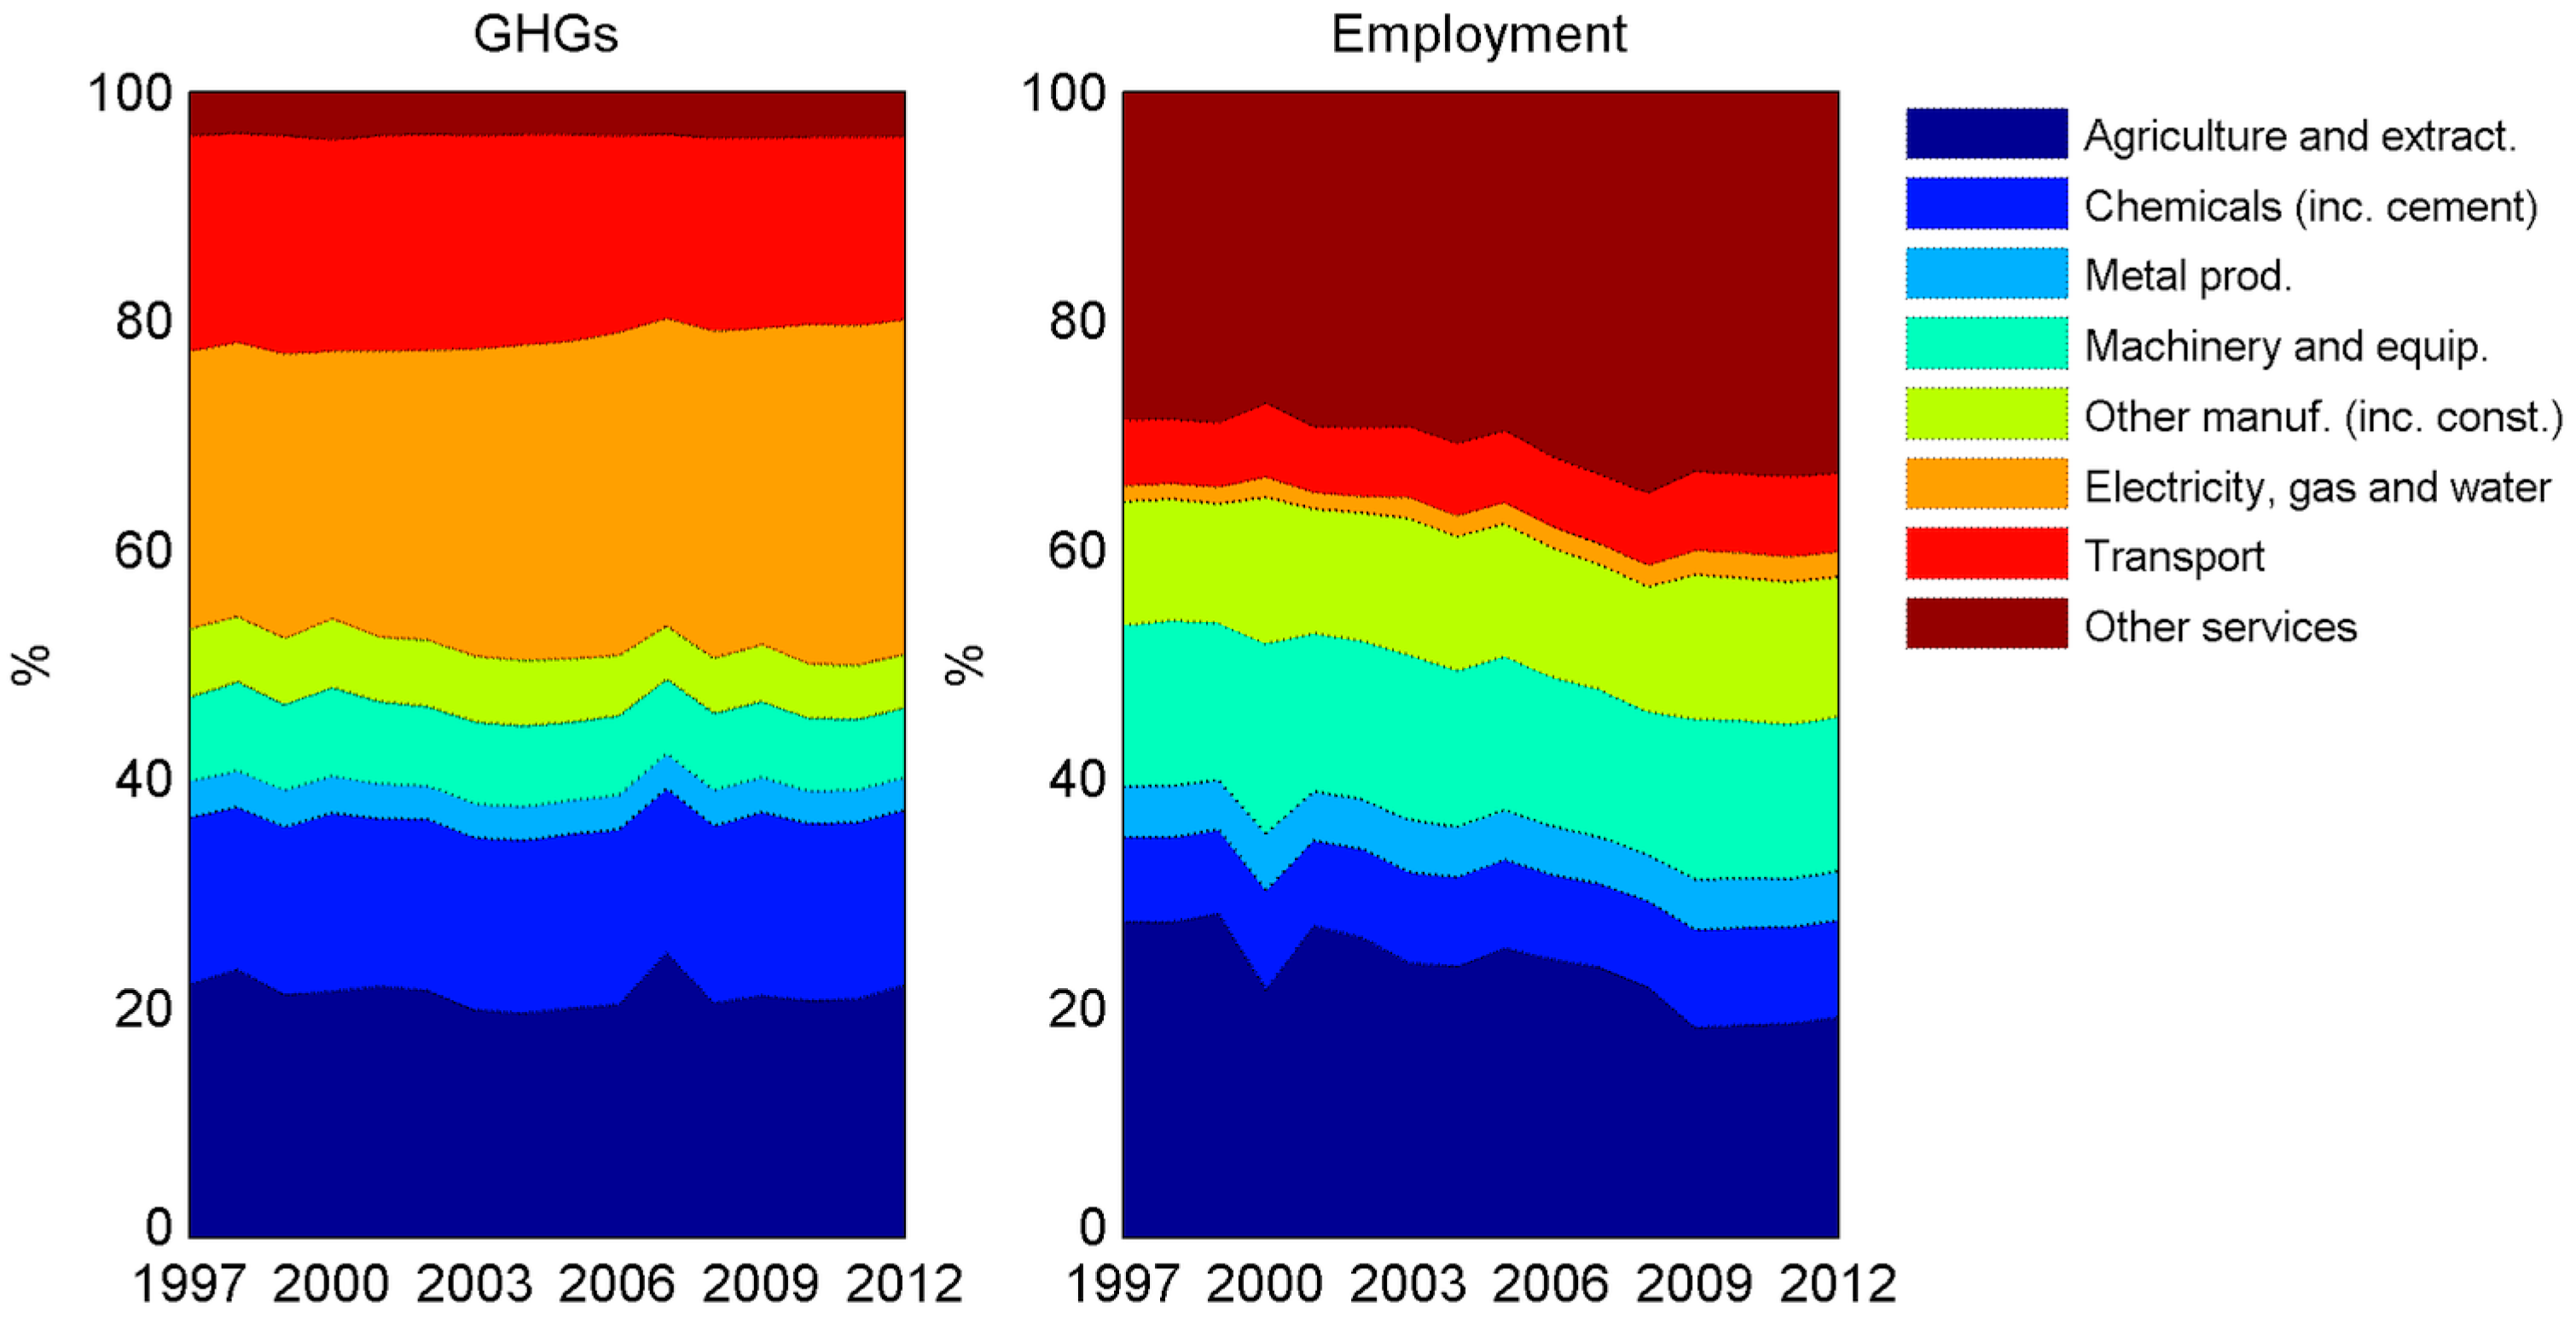
When it comes to economic sectors, around a fifth of the emissions embodied in UK’s imports were generated abroad by agricultural and material extraction activities during the period, as can be observed in
Figure 3. Around another third of emissions, in turn, were associated with industrial products, of which chemicals (e.g., coke, petrochemicals, cement, etc.) held the largest share. Electricity use by itself was accountable for the largest proportion, which increased from nearly 19% in 1997 to 25% in 2012. Transport activities (i.e., land, water and air) were related to about 18% of the total, showing a minor decline at the end of the period. Finally, other services contributed with less than 5%.
In terms of employment, approximately a fourth of the jobs that the UK contributed to create in foreign regions were related to agricultural and extraction activities, as can be seen in
Figure 3. Nevertheless, its share tended to decline, representing about 27% of the total in 1997 and dropping to 19% in 2012. The proportion of jobs in occupations belonging to the manufacturing sector remained relatively stable during the period, representing around 37% of the total. Of these, jobs related to the production of machinery and equipment, as well as other types of manufactures, held the biggest shares (14% and 12%, respectively, on average). Employment in the electricity sector was minimal with around 2%. Jobs associated with services, on the other hand, held a significant share, which increased from almost 34% in 1997 to 40% in 2012. This includes services such as transport, leisure activities and retail.
4.1. Structural Decomposition
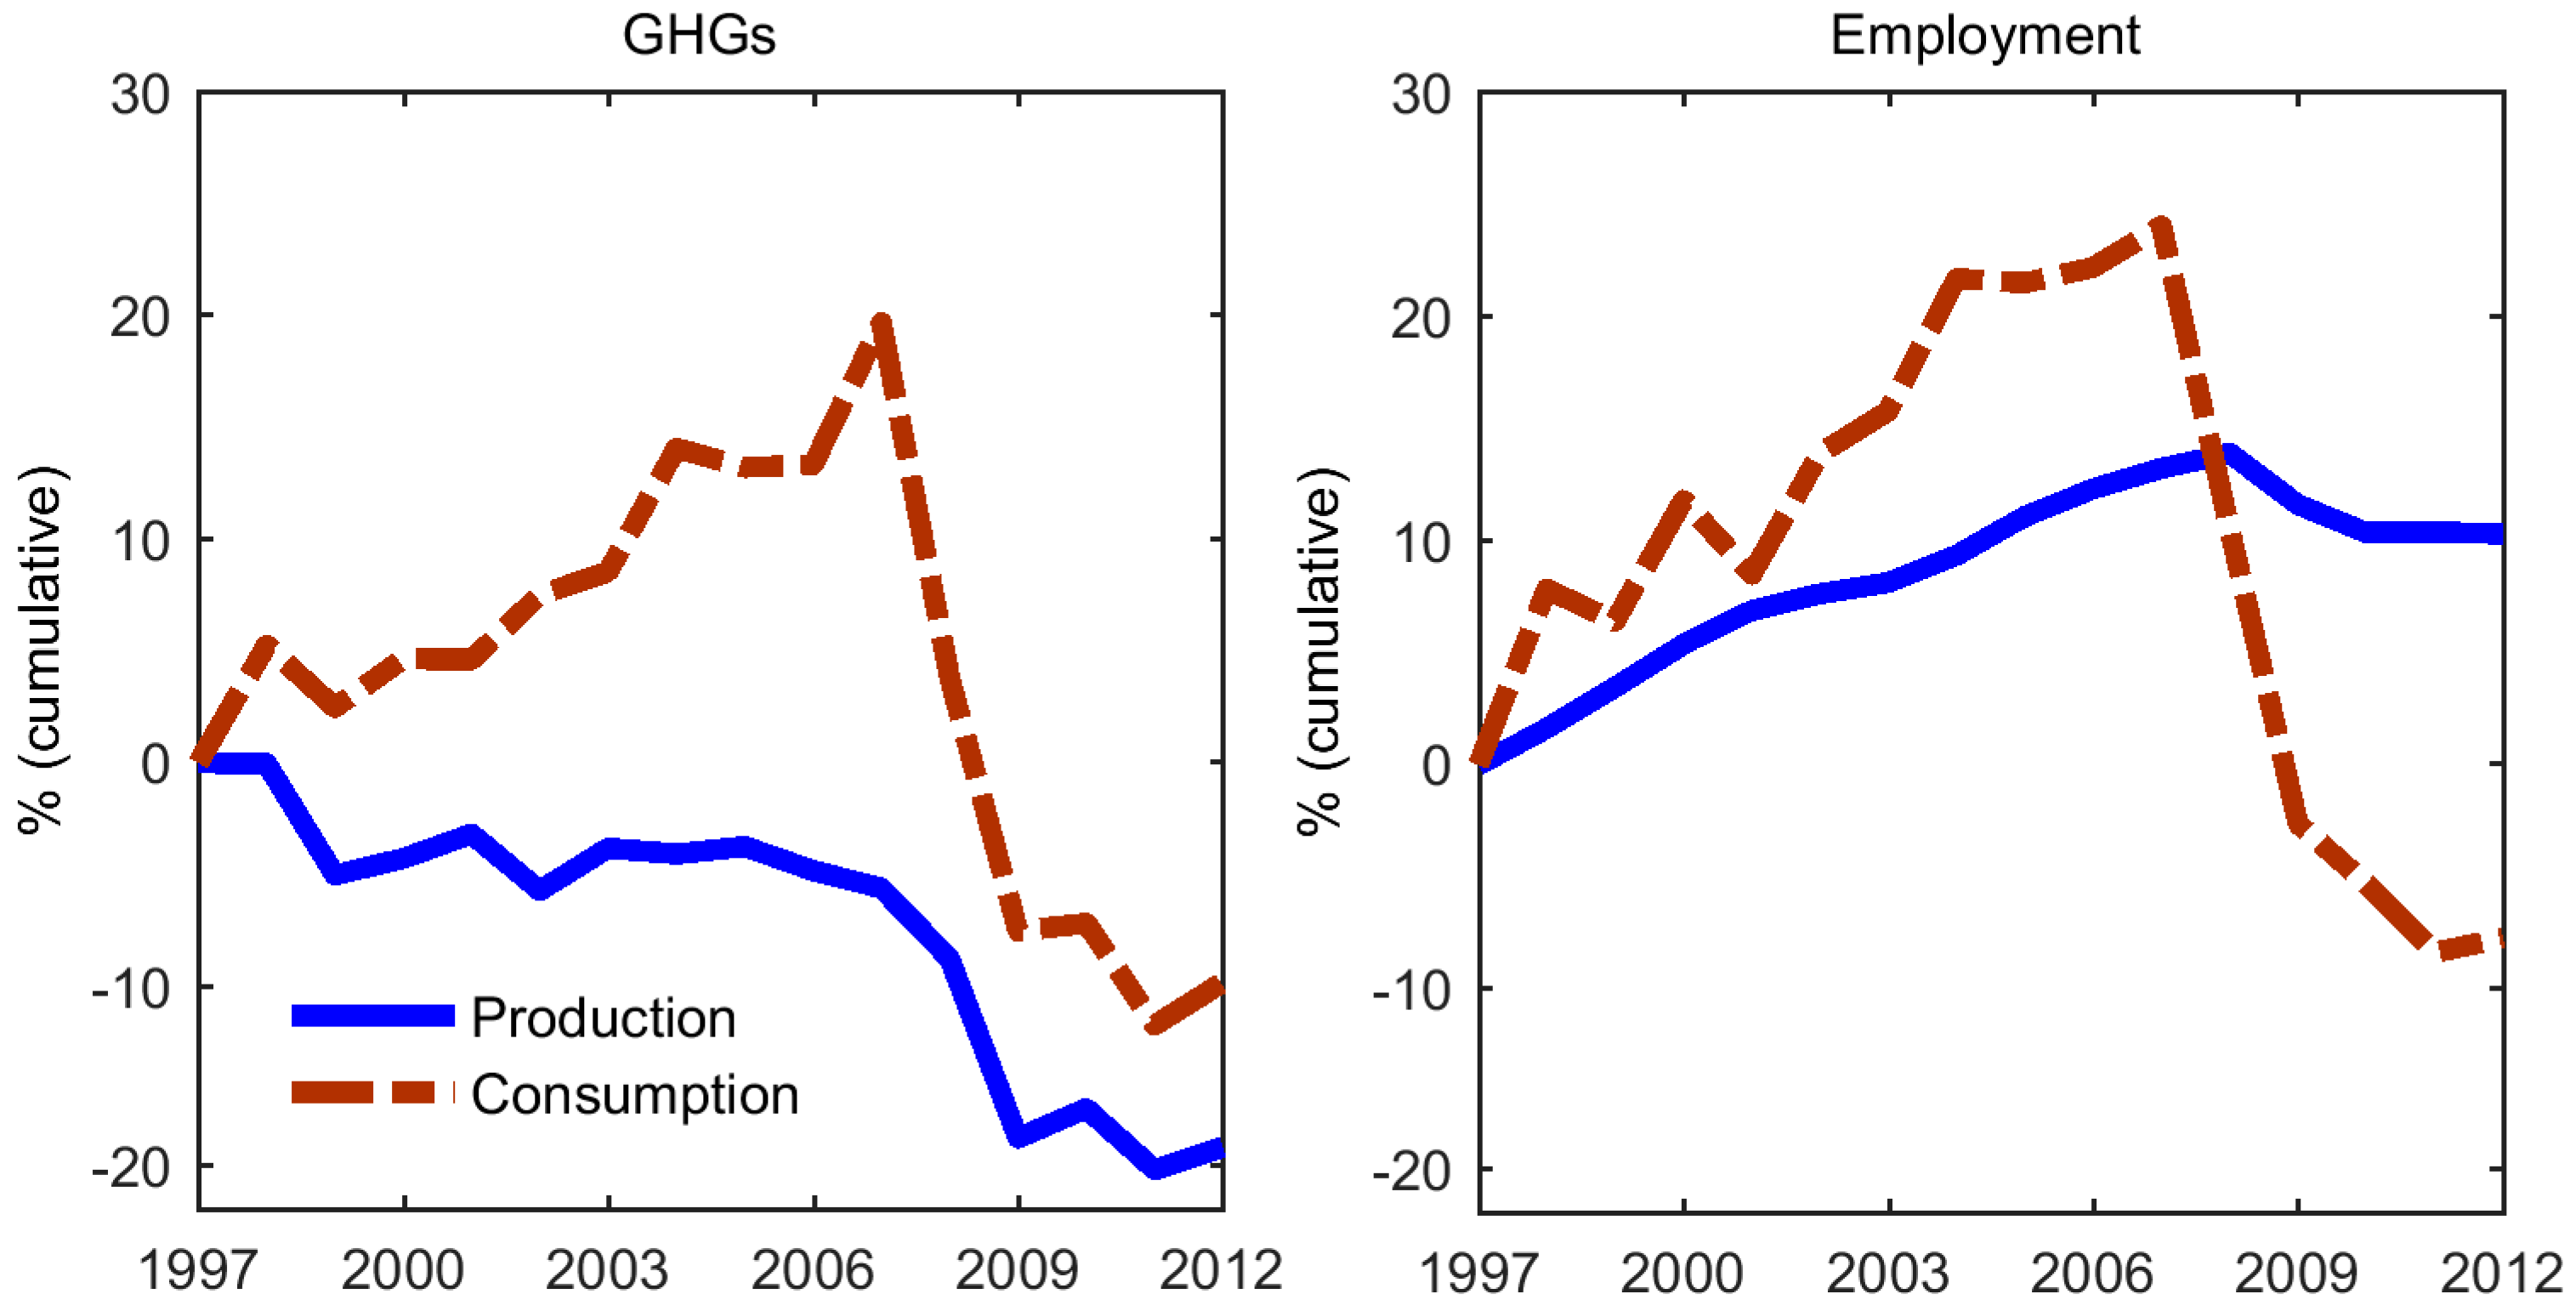
As has been already noted, production emissions registered a constant decline, achieving a reduction of nearly 17% in 2012 with respect to 1997. This is depicted in
Figure 4, which shows the cumulative change in relation to the beginning of the period. It can be clearly seen that consumption emissions showed exactly the opposite behaviour until 2009, when they became almost 20% higher than 1997 levels, but then started dropping significantly. In 2012, consumption emissions were almost 10% lower than at the base year.
The number of jobs in the UK rose constantly during the period, growing by almost 14% in 2008 with respect to 1997, as can be appreciated in
Figure 4. The crisis decelerated this trend and the quantity of new jobs started falling since 2009, stabilising a couple of years later at a level of 10%. The amount of jobs created outside the UK, however, grew much faster than domestically. In 2007, the foreign jobs associated with UK consumption were about 25% higher than in 1997. However, as has also been noted, the fall in imports during the crisis contributed to shrink the UK’s labour footprint significantly. In 2012, it became almost 8% lower than at the beginning of the period.
In order to understand better the forces that lie behind these changes, growth in emissions and employment was decomposed by means of SDA.
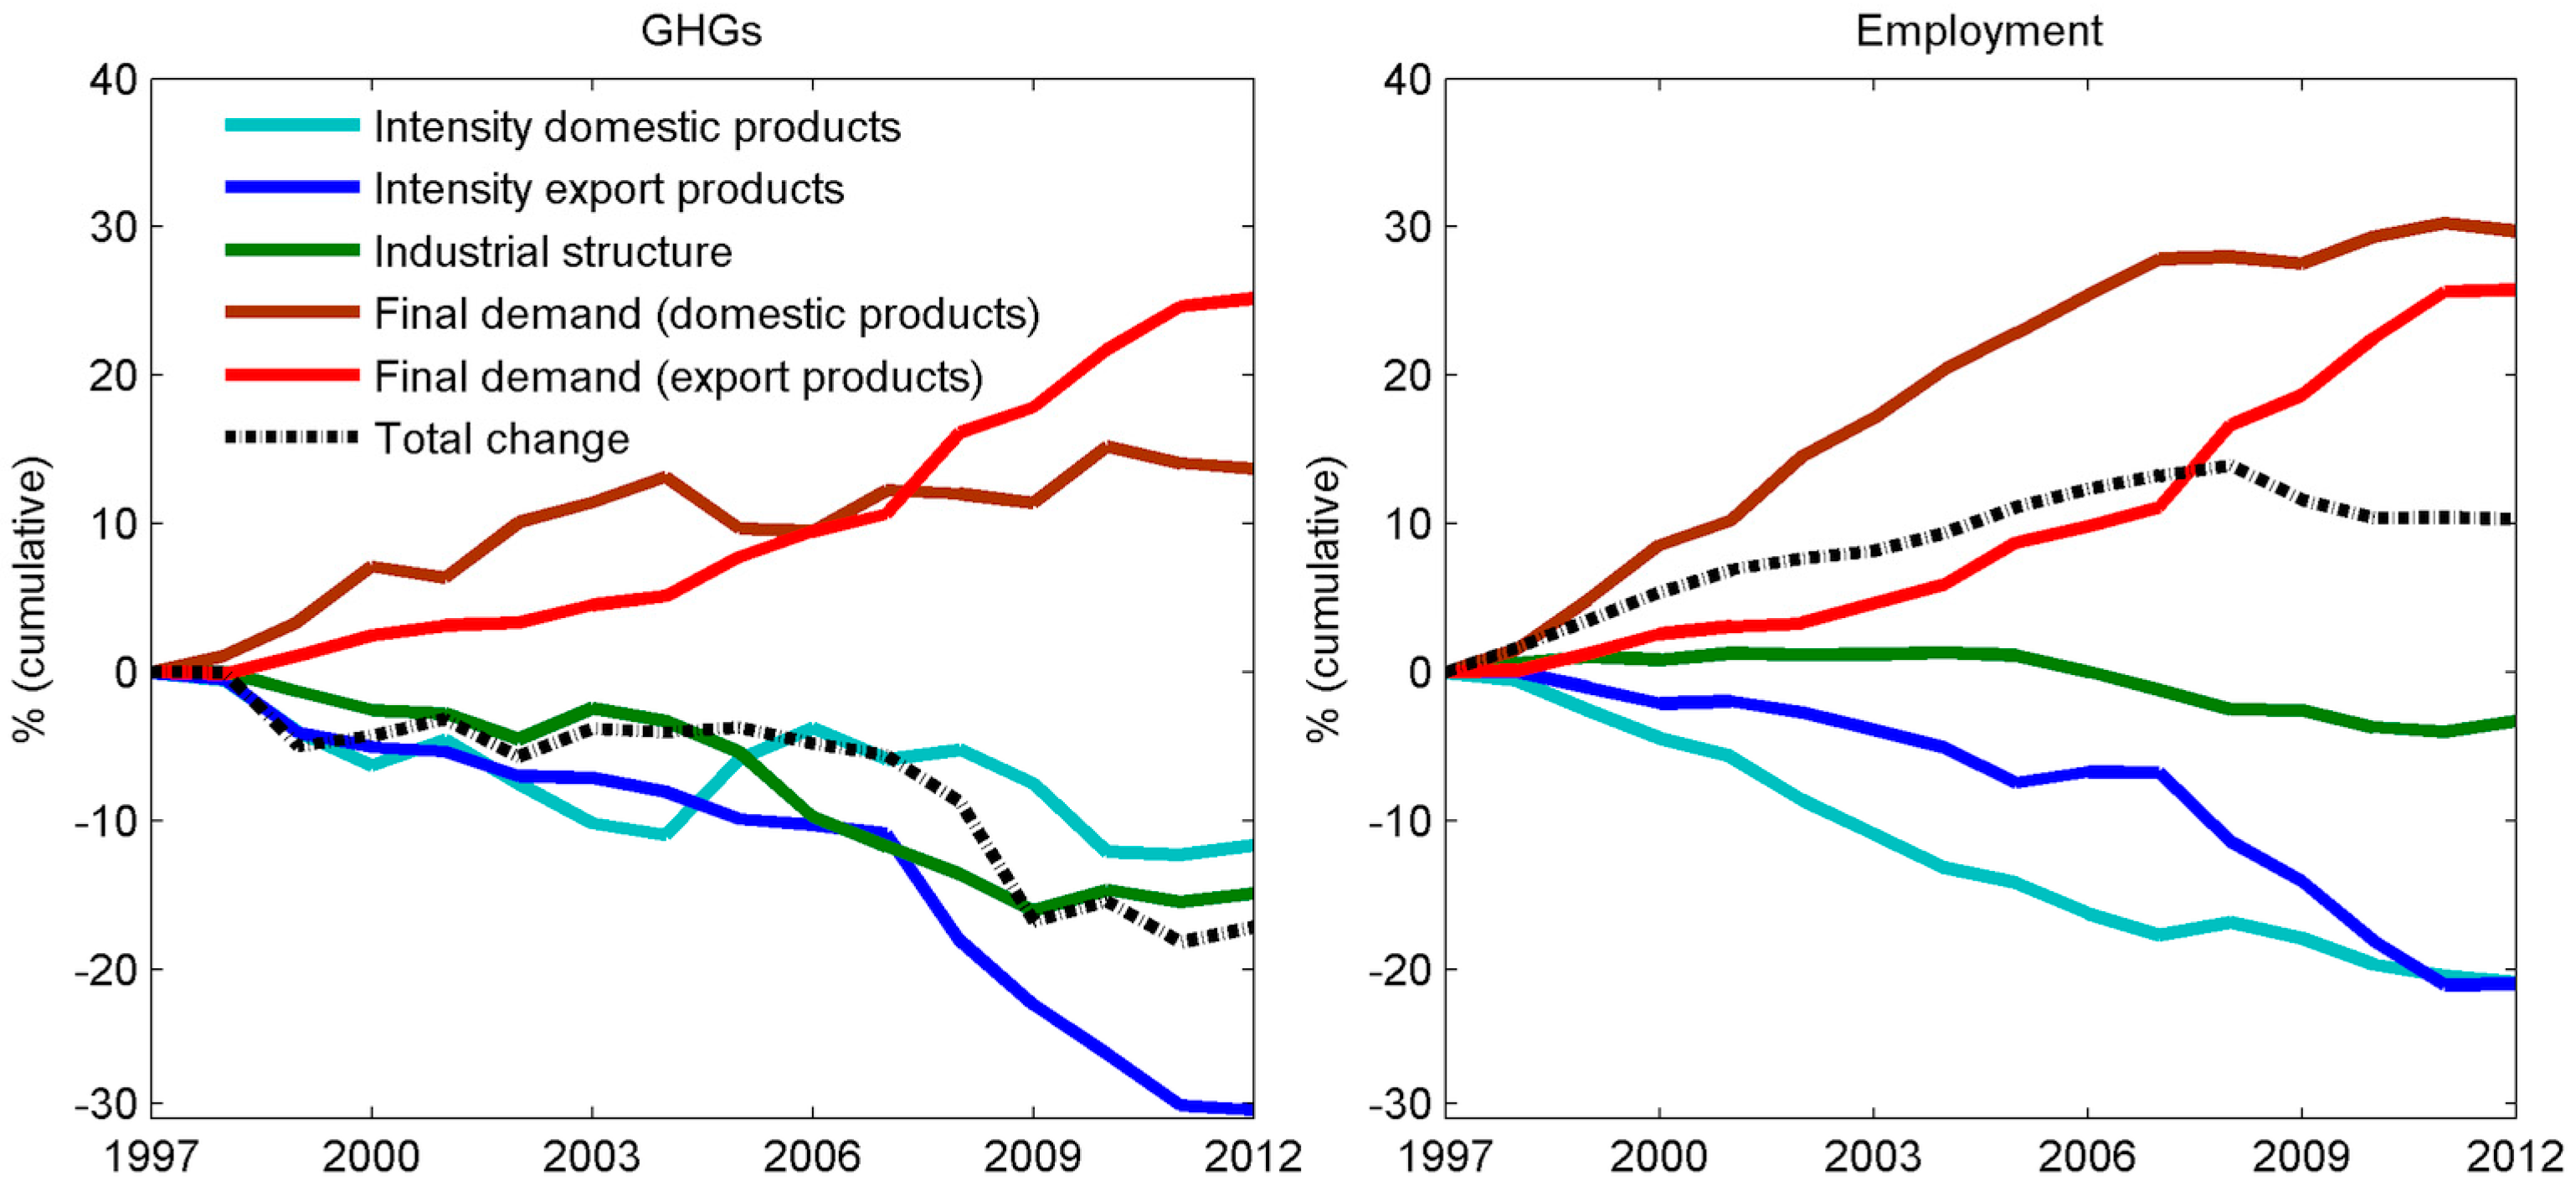
Figure 5 shows the structural decomposition of the changes in both emissions and employment from a production perspective. Regarding GHGs, the emissions intensity (emissions per unit of output) of products destined to be consumed domestically, as well as exports, contributed to drive emissions down, registering a decline of 11% and 30%, respectively. Emissions intensity of export products helped to reduce emissions, particularly during and after the crisis. Emissions embodied in exports fell 8.2% in 2009 with respect to the previous year, while output decreased in 4.9%. From 2009 to 2012, emissions embodied in exports remained almost constant (i.e., 0.3% on average), while output grew by 1.5% per year on average. Technological improvements, reflected in the industrial structure of the economy (i.e., the inter-industry requirements represented by the A matrix), also contributed to push emissions down. However, the effect of final demand offset greater reductions in emissions. The change in emissions, solely due to final demand effects, grew constantly. It is interesting to point out that foreign demand for UK exports exerted a larger pressure than domestic demand. The latter, ceteris paribus, caused an increase of around 25% in emissions, while domestic demand led to an increase of about 14%.
A fairly similar picture can be observed in the case of employment (
Figure 5). The labour intensity of both goods for domestic consumption and exports diminished throughout the period, as fewer jobs were required to generate the same amount of output. It is worth noticing that the labour intensity of export sectors did not improve as much as its domestic counterpart. The configuration of the industrial structure in this case also contributed to drive employment down, although to a much lesser extent. The force that drove employment up was final demand from domestic and foreign markets, with the former exerting a stronger influence. The change in employment caused solely by domestic final demand amounted to nearly 30% in 2012, holding other effects constant, and external demand to nearly 26%.
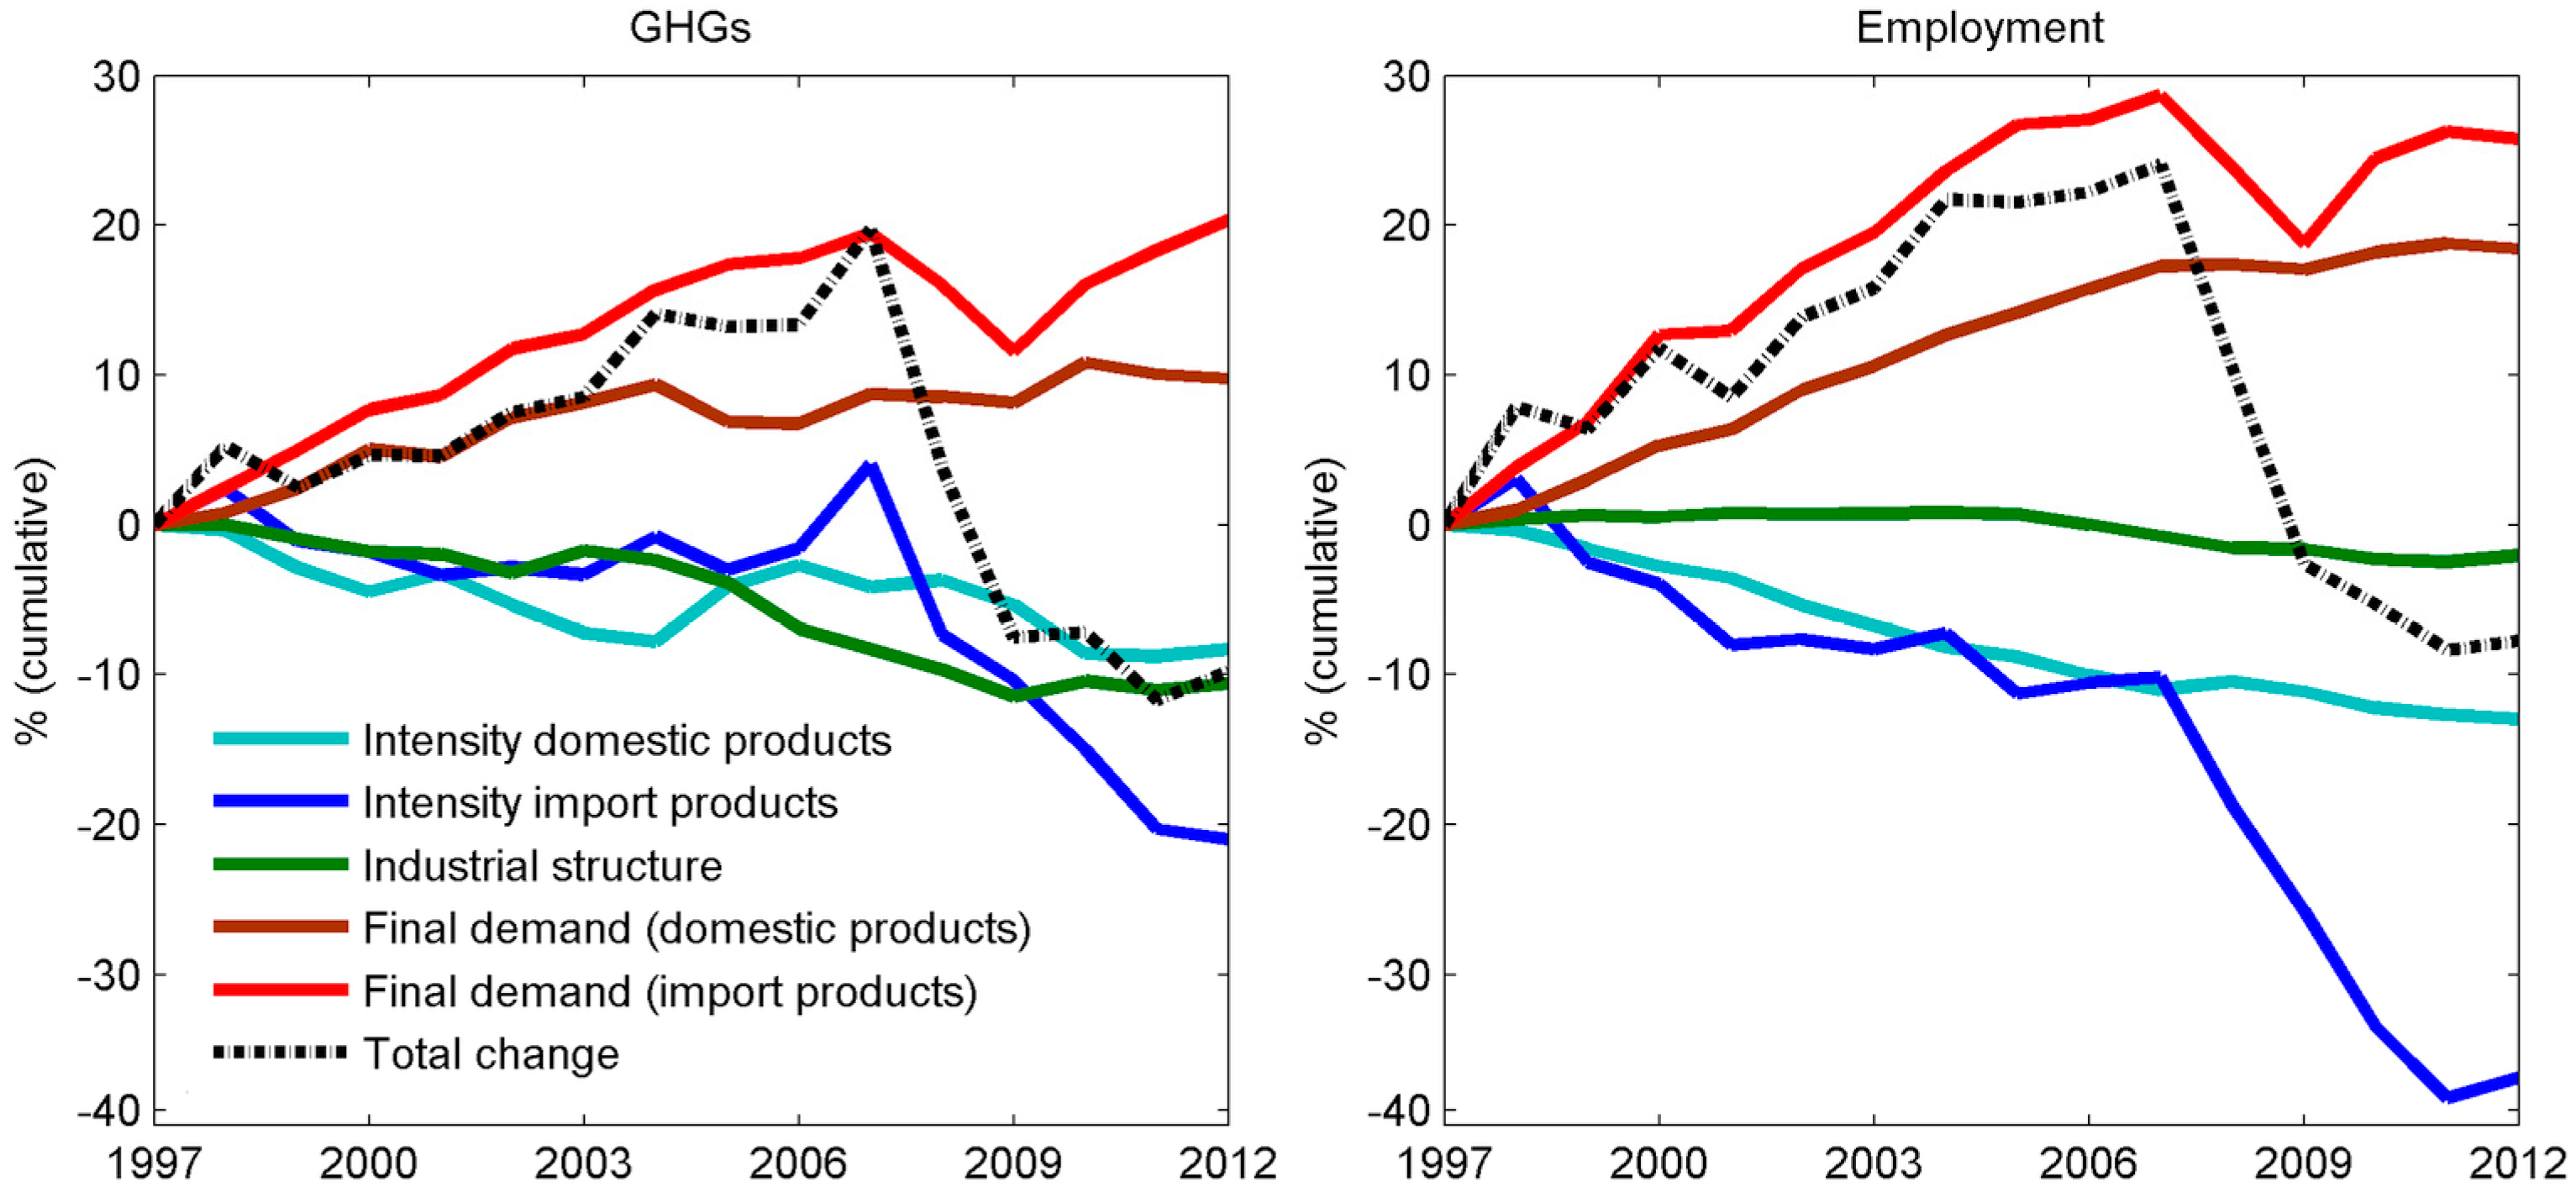
The GHG and employment footprints were also decomposed into the same driving forces, as is shown in
Figure 6. The contributions related to the domestic components are similar to those presented in
Figure 5, and any differences are due to the focus on imports rather than exports. Starting with GHGs, improvements in emissions intensity constituted the most relevant factor that contributed to reduce the footprint. The effect on emissions caused by reductions in the emissions intensity of imports, however, was much more significant compared to the domestic component. Part of this effect can be explained by the increasing use of cleaner technologies in the countries of production. Nevertheless, the big drop in emissions intensity of imports registered after the crisis could also reflect the fact that emissions embodied in imports collapsed by 19.4% in 2008 with respect to the previous year. They dropped again in 2009 by a further 12.1% and kept falling until 2012 by 1.1% per year on average. Output, as has been mentioned, decreased by 4.9% in 2009 and then gradually recovered its pre-crisis levels. Changes in the configuration of industrial structure also contributed to push the GHG footprint down, achieving a reduction of about 10% in 2012 with respect to 1997. The industrial structure factor shows the same behaviour as in the case of production emissions, since the effect was not split into domestic and import components as was done with the rest of the factors. We recognise this to be a limitation, since it is assumed that the industrial configuration of the UK’s trade partner countries has experienced transformations over time. Regarding final demand, once again, it contributed to counteract the influence of the rest of the drivers during almost the entire period. The effect on emissions from final demand for imports grew much faster than for domestic, and the effects of the global financial crisis can be clearly seen. The cumulative change of final demand for imports registered rates in 2012 of 20%.
The case of the employment footprint shows a similar pattern. In relation to the industrial structure, it caused a minor effect on the footprint (and, as in the case of emissions, this effect was not split into domestic and import components). Final demand effects, in turn, dominated over almost the entire period, with demand for imports being higher than domestic demand, representing an increase, keeping other things constant, of 26%. Once again, the consequences of the crisis on the demand for imports are evident. Reductions in labour intensity contributed to drive the footprint down and, once more, the effects derived from the import component are quite significant. As was explained, this reflects productivity gains (i.e., fewer jobs to produce the same level of goods and services), and also the fact that export sectors of economies that produce goods consumed in the UK have gradually become more capital intensive. However, the deep plunge in foreign labour intensity could also reflect the significant annual reductions in employment embodied in imports during and after the crisis. Employment associated with UK imports fell by 17.4% and 19.0% in 2008 and 2009, respectively, continuing to fall until 2012 by 2.8% per year on average. Meanwhile, output only fell in 2009, as has been noted. The sharp declines during and after the crisis in the contribution of the intensity factors to the overall changes of the employment footprint, as well as in the case of the emissions footprint, represents an issue that deserves further research in order to be verified.
4.2. The Relationship between the Emissions and Employment Footprints
After estimating the emissions and employment footprints, it is straightforward to calculate the amount of imported emissions associated with every job that is created by UK final demand in foreign regions. This is specifically done by dividing the emissions footprint by the labour footprint according to country and sector.
Table 1 presents these ratios as averages for the whole period (1997–2012). In relation to regions, it is the Middle East, Africa, Oceania and North America, in this order, where more emissions were emitted per job created. This is due to their high carbon intensity and the low number of jobs that are generated there. The value of 10.9 associated with China, viewed on its own, might be deceiving. The ratio is low given the large denominator or, in other words, the large amount of jobs that are created in that country in relation to the emissions associated with UK consumption.
Regarding sectors across all regions, it can be observed that electricity produces the largest ratios, with an average of more than 300 tonnes of emissions per job. This is expected, given the high carbon-intensity and low labour-intensity of the sector. Electricity is then followed by transport, chemical products and agriculture. Services (excluding transport) displays the smallest value, with around 2.5 tonnes per job.
4.3. The Emissions Elasticity of Labour
The ratios presented in
Table 1 might be deceiving if viewed without additional information. A more useful approach to analyse the relationship between the emissions and the labour footprints is the emissions elasticity of labour. This indicator can provide us with an initial understanding of the trade-offs between reducing imported emissions by modifying consumption and its effect on employment in foreign regions.
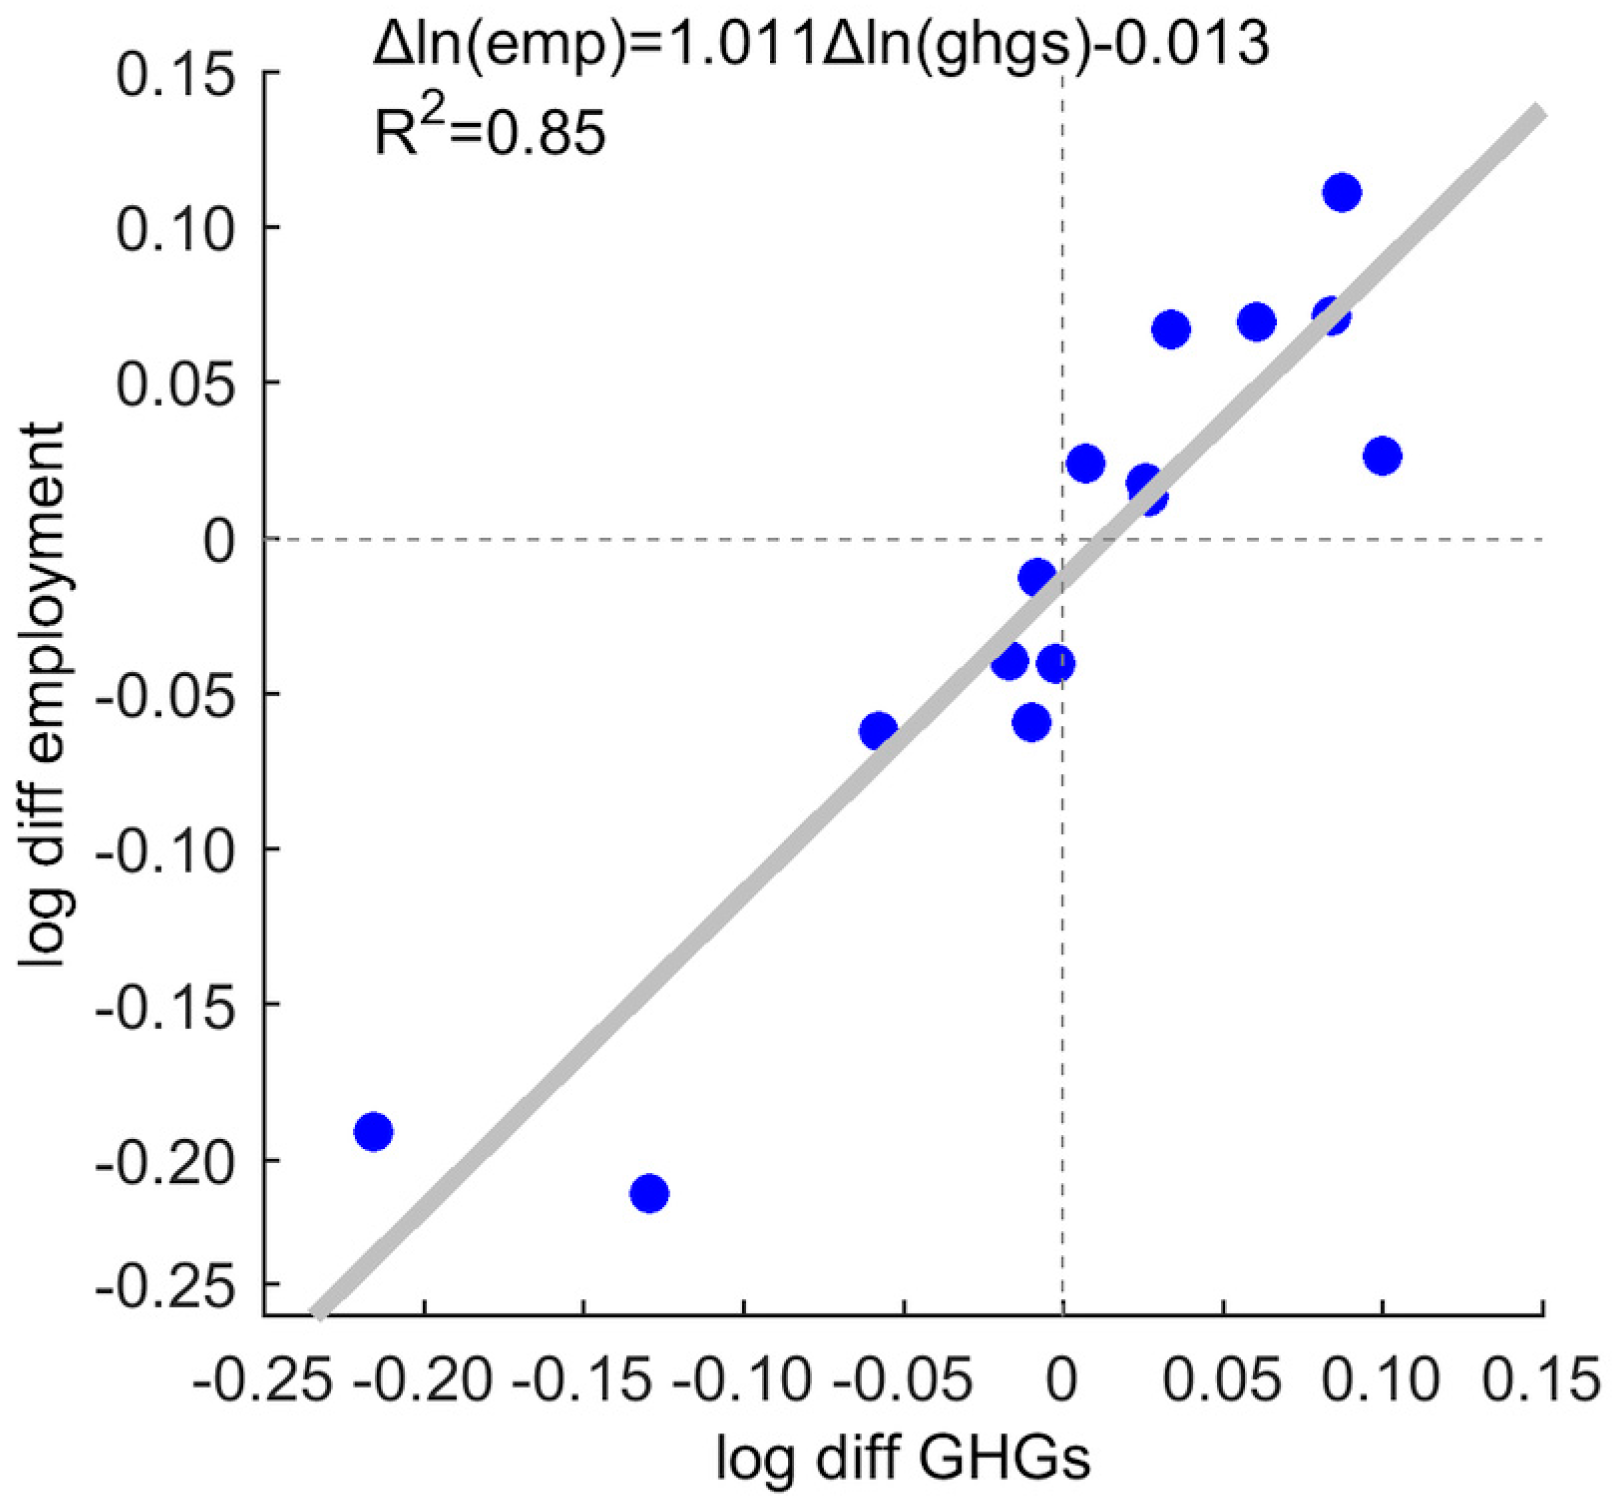
Figure 7 shows the relationship between the number of jobs and the volume of emissions, both embodied in imports. The variables are expressed in log differences, thus representing annual growth rates. In this manner, the estimated slope parameter of the regression line shown in
Figure 7 constitutes the emissions elasticity of labour, which is almost unitary. This basically means that every time emissions embodied in UK imports grew by 1%, the number of jobs created in foreign regions increased by an equal proportion. This finding is not surprising, given that both variables are driven by the same final demand. Nevertheless, it is worth mentioning that before the crisis (i.e., 1997–2007 in the period of study) the value of the coefficient was somewhat smaller (0.92,
R2 = 0.62), but the relationship became more elastic in the period that followed (1.37,
R2 = 0.93). Changes in employment became proportionally larger per unit change in emissions embodied in imports. This last result, however, has to be considered with caution as it involves a very limited number of data points (2009–2012).
The emissions elasticity of labour, however, varies depending on the country that produces the imports and on the sector. The largest elasticities according to country of production correspond to India and Russia, with a value of 1.3 each, as can be seen in
Table 2. However, the
R2 for Russia indicates a weak correlation. The lowest elasticities by region belong to North America and Africa, with values of 0.6 and 0.3, respectively, although the
R2s also show weak correlations in these cases.
Regarding sectors, the largest elasticities correspond to ‘other manufactures’ and ‘chemicals’, that produce values of the magnitude of 1.4 and 1.3, respectively. The lowest values correspond to agriculture and utilities (0.5 and 0.6, respectively), but the correlations in these cases are also low.
5. Discussion
The UK economy has shown a strong dependency on imports during the last two decades in order to obtain the products and services that it requires to fulfil its consumption needs. By consuming imported goods and services, it contributes to create employment as well as emissions in other regions of the planet. The UK helped to generate an annual average of 25 million jobs worldwide during the period 1997 to 2012, the majority of them in the rest of Europe, China, India and the rest of Asia. Meanwhile, over half of the emissions associated with UK consumption were generated abroad, and half of these occurred mainly in the rest of Europe and China.
The rise of China as one of the UK’s most important trade partners is clearly reflected in both footprints. China’s share of total UK imports amounted to around 1.5% in 1999, expanding quickly to account for nearly 8.0% in 2012, becoming the UK’s second largest import partner behind Germany [
11]. The implications for embodied emissions is substantial. While China’s contribution to total UK import emissions was about 10.5% in 1997, it almost doubled in 2012, reaching 19.1%. In terms of employment, China has been the country that has benefited the most by UK consumption, helping to generate an average of 7.7 million jobs during the period under study. China is expected to remain a strong UK trade partner in the future, continuing to provide goods and services that are essential to the UK’s consumption requirements. It is thus expected that the UK will continue to fuel job creation in that country. However, China’s intentions to decarbonise its economy and pursue efforts to peak its emissions by 2030, as expressed in its Nationally Determined Contribution (NDC) submitted to the UNFCCC ahead of the Paris Agreement, could mean that its share of the UK’s emissions footprint, as well as those of other nations, would decline over time. The same logic applies to other emerging economies that trade with the UK, such as India, South Africa, Indonesia, and so on. Given that the Paris Agreement has broaden the mitigation scope to include the developing world, this could mean a gradual decrease of the emissions intensity of UK’s imports. Accordingly, as the SDA results suggest, this would contribute to reduce the country’s emissions footprint.
The level of both footprints was lower in 2012 compared to the level they presented in the beginning of the period. However, until 2009 both footprints increased significantly faster than their territorial counterparts before registering an important fall. The impact of the global financial crisis on both indicators was profound. This clearly illustrates a vital point. As was shown by the results derived from the SDA, final demand is the most influential factor driving both footprints, offsetting most of the time the gains achieved by technological improvements. Therefore, the most effective way to attain rapid and drastic reductions in emissions, both from a production and a consumption perspective, is to decrease the levels of consumption. Nevertheless, the economic implications can be serious and job creation can be especially jeopardised. According to this paper’s results, around 580 thousand jobs were lost from 2008 to 2009 domestically, as well as almost 5 million jobs associated with UK consumption during the same years in other regions of the globe. There is, in this sense, a clear trade-off between reducing the emissions footprint via a decline of consumption and the creation of economic and development opportunities not only within the UK, but also in the rest of the world.
The emissions elasticity of labour presented in this paper is thus useful to obtain an initial understanding of the trade-offs between reducing imported emissions by changing consumption and the corresponding employment effects in foreign regions. Clearly, China, India, Russia, as well as advanced economies in the rest of Europe and the US, benefit from UK consumption. Consequently, they would resent a fall of UK imports in relation to, among other things, job creation. According to this paper’s analysis, it is the big emerging economies, which function as ‘factories of the world’, that are more exposed and are vulnerable to changes in UK consumption. When it comes to economic sectors, it is manufacturing and heavy industry which would feel the largest impacts. A deeper analysis, however, would be helpful, exploring with greater detail at the country and sectoral levels any opportunities that might arise to reduce UK imports while minimising impacts on employment in the economies that trade with the UK.
In recent years, and more specifically in the aftermath of the global financial crisis, the argument of reindustrialising the UK economy has received a renewed impetus [
68]. Reshoring manufacturing would contribute to diminish the UK’s increasing reliance on imports, while helping to create more employment domestically and reduce its emissions footprint. Arguably, such a move could equally drive a rise in production emissions, although this might not necessarily be the case if low-carbon or renewable-energy technologies are in place. Nonetheless, the actual possibilities of achieving this reshoring are uncertain and some studies have suggested that there are limits as to how far it can occur, at least in some sectors, mainly due to the availability of required skills and finance along the supply chain [
13]. A more realistic view, at least in the near-to-medium term, is that the UK will continue to depend heavily on imports, while focusing more on high-value activities and services.
Given the inherent difficulties of reducing the consumption of imported goods and services, the UK should look for other alternatives to diminish its emissions footprint, while contributing to enhance global development. This could be done by offering increased support to emission-intensive trade partners in the form of technology transfer and financial aid to help them achieve emissions reductions and safeguard jobs in export sectors. For instance, the Clean Development Mechanism (CDM), despite its limitations [
69], could be an appropriate vehicle to target carbon-intensive sectors in producing countries and reduce the UK footprint [
70].
Finally, the issue of Brexit has raised paramount concerns regarding its implications on trade. These are still uncertain and will ultimately depend on the type of agreement that is achieved at the end of the negotiating process between the UK government and the EU. A ‘hard’ Brexit, that is, a complete exclusion of the UK from the European single market, could signify the adoption of a trade regime under the rules of the World Trade Organisation (WTO) and the potential implementation of tariffs by both parties. In this scenario, it is expected that trade with the EU could diminish, although it is unclear to what degree. If this was the case, then it is expected that jobs in the UK to produce exports to the EU would be lost, with a corresponding effect in the opposite direction (i.e., removal of European jobs due to lower UK imports and an associated reduction of the UK’s labour footprint). However, the final consequences for the UK’s emissions and labour footprints would depend on a number of factors (e.g., exchange rate movements, trade balance, etc.), and among others, the possibility of materialising free-trade agreements with alternative partners. Expanding trade flows with China and India, for example, could lead to an increase of the UK’s emissions footprint. However, it is difficult at this stage to move beyond these assumptions. More research is clearly required in this area to provide more robust answers.
6. Conclusions
The UK is a major player in an ever more globalised world. Similarly to many other industrialised nations, the UK has become a high-value service-oriented economy, experiencing complex structural changes featuring an offshoring process of domestic industries to other regions of the planet. In this sense, the UK has increasingly relied on foreign markets to acquire products and services that are vital to fulfil its material needs. This has had both economic and environmental implications, as the country has become a net importer of emissions and employment.
In this paper, the UK’s GHG emissions and labour footprints were estimated to analyse their behaviour, drivers and sectoral and regional composition, as well as to understand the relationship between both measures. The results showed that both footprints have tended to grow substantially faster than their production counterparts, except during the aftermath of the global financial crisis. Given the significant influence of final demand as a prevailing driver of both footprints, it can be expected that UK consumption will continue to fuel the growth of both indicators in the upcoming years. Consequently, addressing the UK’s reliance on imports and, more importantly, its elevated levels of consumption, should be a priority to reduce its adverse effects on the global environment. However, it can be concluded that unilateral actions to modify the country’s consumption patterns can have unintended consequences in other regions of the world in terms of job creation and development opportunities. More efforts should thus be focused on supporting the UK’s trade partners to lower their emissions intensity and helping them to attain their intended emissions reductions as expressed by their NDCs.
In this sense, this paper offers useful insights into the complex relationship between the emissions and employment footprints. It also opens new research pathways that are vital to understand the intricate links between trade, development and the environment.


