Article

Support Phosphorus Recycling Policy with Social Life Cycle Assessment: A Case of Japan

Graduate Program in Sustainability Science—Global Leadership Initiative (GPSS-GLI), Division of Environmental Studies, Graduate School of Frontier Sciences, The University of Tokyo, 332 Building of Environmental Studies, 5-1-5 Kashiwanoha, Kashiwa City, Chiba 277-8563, Japan
*
Author to whom correspondence should be addressed.
Sustainability 2017, 9(7), 1223; https://doi.org/10.3390/su9071223
Submission received: 1 June 2017 / Revised: 4 July 2017 / Accepted: 10 July 2017 / Published: 12 July 2017

Abstract

:
Producing phosphorus (P) fertilizers with recycled P is desirable for efficient use of P resource. However, the current cost of P recycling facilities in Japan strongly discourages the government from adopting this practice. To expand consideration for a P recycling policy, the concept of social externality was introduced. Social issues, such as the violation of human rights in P mining in the Western Sahara, have been identified in recent studies; nevertheless, a systematic approach towards accountability was lacking. Therefore, the purpose of this study was to support a P recycling policy with a social life cycle assessment (SLCA) by contrasting the social impacts associated with mineral and recycled P fertilizers using the case study of Japan. We developed a framework based on the UNEP-SETAC SLCA Guidelines with a supplementary set of P-specific social indicators. The results showed that the marginal social impact associated with recycled P was much less relative to mineral P; however, even if we factored in the maximum recycling capacity, a mandate of P recycling policy in Japan would not mitigate the impacts significantly relative to the current situation because only 15% of P rocks could be substituted. In short, we showed that a semi-quantitative SLCA framework would be useful to communicate the wide spectrum of social impacts to policymakers.

1. Introduction

Efficient use of phosphorus (P) is critical to meet the growing demand of P fertilizers in modern agriculture as P is a scarce resource [1]. Technically, P can be removed and recovered from municipal wastewater treatment plants (WWTP) through struvite precipitation [2] and sludge ash leaching processes [3]; however, producing recycled P fertilizers costs more than conventional mineral P fertilizers due to the investment in infrastructure and maintenance, which discourages most municipal governments from adopting these practices. To consider the externality, previous studies have assessed the environmental impacts of mineral and recycled P fertilizers production from a life cycle perspective [4,5,6,7]. As the concentration of P in wastewater is much lower than mineral P deposits, the energy demand to produce recycled P fertilizers is often higher, or equivalent to that of mineral P fertilizers, depending on various technological choices and accounting methods [4]. Another important externality, the social impact of fertilizer application, was raised by Martinez-Blanco et al. [8]. They assessed nitrogen fertilizers from a compost and a mineral fertilizer and showed that the social impacts of fertilizer production were affected by the practices in each country, sector, and company [8]. Although the assessment was not conclusive, a brief outline and research needs on social impact assessment were highlighted in their study.
Several social issues associated with the life cycle of P fertilizers have been identified, and some are known as the “hidden cost” in recent literature [9]. These include:
  • Human rights: Not all P is mined rightfully. Morocco, the largest P reserve country, for example, is illegally occupying the Western Sahara to acquire a large deposit of high-quality P ores [9,10]. Consequently, the indigenous Saharawi people have been forced out and resettled in refugee camps in Algeria [11].
  • Health and safety: P contains naturally occurring radioactive materials (NORM) [12,13]. NORMs are especially concentrated in the by-product or waste of fertilizer production [14]. A lack of effective waste management and monitoring systems poses radioactive health risks to the local and associated communities [15,16].
  • Livelihood: P price fluctuations in the international market affects the farmer’s livelihood. In 2008, the P rock price spiked to as high as 800% of the price of the previous year, according to the World Bank. Thus, many farmers’ quality of life were affected and contributed to extreme events such as farmer riots and suicides [9].
  • Resource security: P rocks are defined as critical resources based on the supply risk and economic importance under the EU framework [17]. As P mineral supply is concentrated only in a few countries, the P import-dependent countries are vulnerable to their foreign policy. In the 2008 event, the global P supply was disrupted due to the sudden tariff increase of P rock exports imposed by the Chinese Government [9].
  • Equity: Nykvist et al. and UN Food and Agriculture Organization statistics [18] showed that countries around the world varied greatly in the use of P in terms of per capita in the nation, and in per hectare farmland input. Considering the scarcity of P, we risk the long-term availability of the resource, and equal rights to accessing P for less advantaged communities.
To systematically assess the social impact of a production system, a social life cycle assessment (SLCA) framework is recommended by the UNEP-SETAC [19]. A SLCA assesses the social and socio-economic aspects of products and their potential impacts along their life cycle to improve the well-being of the stakeholders. The concept of SLCA has been widely discussed, but the methodology in practice is still premature, despite the growing number of SLCA publications on theoretical discussion and case studies in recent years [20,21,22,23,24]. Based on the milestone works, the UNEP-SETAC Guidelines for Social Life Cycle Assessment of Products (referred to as the Guidelines hereafter) and the Social Hotspots Database (SHDB), and Product Social Impact Life Cycle Assessment database (PSILCA), a three-stage-development was observed. Before the Guidelines, most studies focused on constructing the theoretical concepts to define the study scope, stakeholder selection, and category of social impacts [25,26,27]. In 2009, the Guidelines were published by leading SLCA researchers who set the tone for future study by providing key concepts, elements, and research needs. After the Guidelines, most studies shifted their attention to proposing specific indicators, inventory datasets, and weighting options for different cases [28,29,30]. The SHDB was launched in 2009 and made publicly available in 2013. Developed by New Earth, the SHDB collects inventory data on the impacts of global supply chains based on reputable third-party reports and literature, and characterizes the social risks accordingly. Similar, to the SHDB is the PSILCA, later published by GreenDelta in 2016 [31,32]. These databases eased the intensive data collection process, which resulted in more streamlined SLCA case studies being produced [8,33].
This study aimed to assess the social externality associated with the production of P fertilizers and its consumption at the national level using the SLCA methodology as such considerations are often neglected in the decision-making process of P recycling policy [34]. Here, the case of study of Japan was studied as it has no mineral P reserve [35]. For mineral P, P fertilizers are imported from two main pathways: imported P rocks from China, South Africa, Jordan, Morocco, and other countries for fertilizer production in Japan; or through the direct import of P fertilizers from the United States, China, and other countries [36]. As the total demand of fertilizers has been decreasing, there has been a reduction in importing P rocks in the past 15 years; nevertheless, the sources of import were about the same, according to statistics from the Ministry of Finance. For recycled P, there are five WWTPs that implement full-scale P recycling. P is recovered in the form of struvite (MAP) or hydroxyapatite (HAP) and is transferred to a fertilizer factory for further processing [37]. One limitation of this study was that other recycled P sources such as manure, iron and steelmaking slag [35], and sludge from nickel plating and the surface treatment industry [38] were excluded from our scope.
This was the first SLCA study that assessed the social impacts associated with P fertilizers. New specific indicators were proposed to show the most relevant issues related to P, in addition to generic indicators. Despite the young methodology and limited SLCA data, we conducted a rather comprehensive case study that encompassed multiple unit processes, and multiple stakeholder and impact categories, which was not commonly undertaken in previous studies [22,39]. We showed that weighting issues were yet to be well-treated in the current SLCA, i.e., issues dealing with relative importance between unit processes, and stakeholder-impact categories, thus, further study is necessary.

2. Materials and Methods

The SLCA in this study followed the basic technical framework recommended by the UNEP-SETAC [19], which included defining the goal and scope of the study (Section 2.1), conducting the inventory of data (Section 2.2) and performing the social impact assessment (Section 2.3). To achieve the objective of the study, improvements and changes were made. In Section 2.2, we supplemented the inventory with additional P-related social indicators and proposed an alternative estimation of the activity coefficient to weight the processes. In Section 2.3, we designed a systematic social impact assessment framework to effectively evaluate and compare the supply options of P fertilizers in Japan.

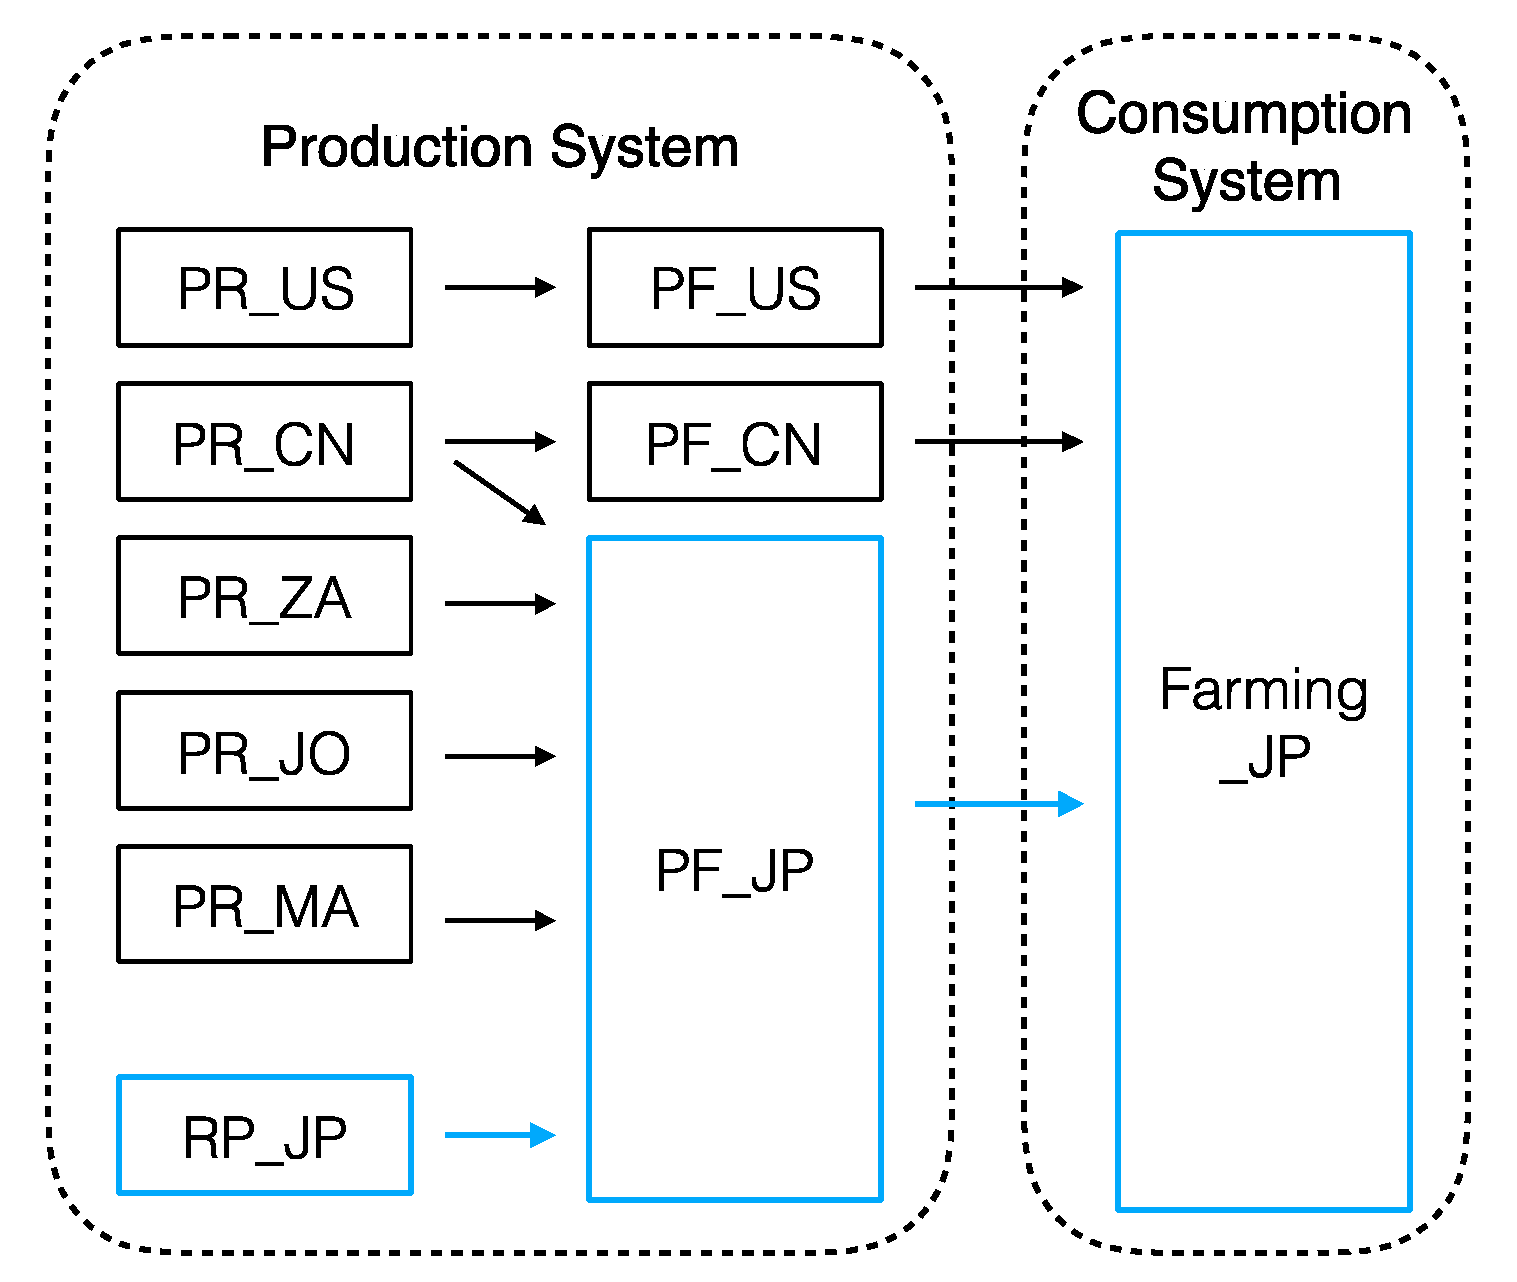
2.1. Goal and Scope Definition

The goal of this study was to support the P recycling policy by contrasting the social impacts associated with the consumption of mineral based P fertilizers and recycled-based P fertilizers in Japan. Based on the Guidelines, we developed a systematic social impact assessment framework for mineral P fertilizer and recycled P fertilizer from WWTP to support the future debate on the inclusion of social externalities. The functional unit defined was 1 kg of mineral or recycled P fertilizer supplied to a farmer in Japan. Due to the semi-quantitative treatment of the social impact inventory indicators, the functional unit was only scalable based on the activity coefficient (introduced in Section 2.2.2), and comparisons of two sets of scenarios were discussed in Section 2.3.2. From a life cycle perspective, the scope of the study consisted of a production system where P rocks were mined and P fertilizers were produced; and a consumption system where P fertilizers were applied to farmland (Figure 1). In the production system, three main pathways of P fertilizers production were identified: direct import of P fertilizers from the United States and China, import of P rocks from China, South Africa, Jordan and Morocco with local fertilizer production, and recycling of P nutrient with local fertilizer production. In the consumption system, only farming activity in Japan was considered.
The aim of the SLCA was to evaluate the impact of activities on the relevant stakeholders. We selected the workers and local communities in respective countries for the production activities, and individual farmers and society for the consumption activities in the assessment. Each stakeholder category was paired with a set of social impact categories that potentially affected their well-being such as labor rights and decent work in the case of workers. The categorization of the stakeholders and social impacts were based on the Guidelines [19]. Table 1 summarizes the stakeholders and social impact categories in this study. The details of how each stakeholder in the P supply chain may be impacted were reviewed in References [9,40].
The system boundary of this study included only three simplified life cycle stages: raw P acquisition (i.e., P rock mining and recycled P production); the production of P fertilizers; and farming, with specific activity sites. Background processes such as transport and electricity production were excluded to focus the discussion on P-specific social impacts. As shown in Reference [8], even though the inventory for the background processes was possible, the linkages to foreground processes or the methodology for weighting were weak, especially when dealing with multiple stakeholder and impact categories.

2.2. Inventory

Two types of inventories were conducted: the social impact indicators that characterized the impacts on stakeholders (Section 2.2.1), and the activity coefficient that weighted the attribution of each production activity for producing one functional unit (Section 2.2.2).

2.2.1. Social Impact Indicators

An indicator approach was applied to evaluate the social impacts [41]. The model was structured in three layers: social impact categories, social themes, and data indicators (or characterized issues). Each social impact category had multiple social themes, and each social theme was characterized by one or more data indicators.
A total of 24 data indicators were selected, and consisted of 15 general descriptive indicators and nine specific descriptive indicators. The categorization of indicators was based on the study conducted by Kruse et al. [42].
General descriptive indicators, which characterize the social impacts related to generally recognized societal value, were directly collected from the SHDB. Most of these data were originally collected from the databases of reputable organizations, e.g., the percentage of total child labor in a country was taken from the International Labor Organization. These quantitative and qualitative data were classified into four risk levels: low, medium, high, or very high by the SHDB. The rules for classification were primarily based on a quartiles approach or the expert judgement from the New Earth’s advisory board. For example, one country’s data like “percentage of child labor in China” was compared with the global distribution of the data. The country’s data were categorized as low risk if the data fell within the first quartile, which was lower than 4% in this case [39,43]. The resolution of the data was constrained by data availability [44], so the highest resolution was at a country-specific sectors scale.
Specific descriptive indicators, which characterize the social impacts related to P industry-specific issues as described in the introduction, were collected from various literature and supporting documents in P studies. Initially, we selected a set of indicators based on the concept of P security [40]. The selection was then improved based on the input from P experts (including Dana Cordell and Eiji Yamasue) at two recent academic conferences, the 5th P Summit in Kunming and the 12th Ecobalance Conference in Kyoto, and a P mining site visit in Kunming. We summarized the selected specific descriptive indicators and the reasons for inclusion in Table 2.
The full list of indicators, characterized issues, resolution of data, rules of characterization, and sources were summarized in Table S1 (in the Supplementary Materials).

2.2.2. Activity Coefficient

As P fertilizers in Japan are supplied from various countries (Figure 1), we designed a set of activity coefficients to weight the production processes. The activity coefficient was defined as a weighting variable that gives a relative importance to different unit processes and different countries involved in the system [29,39].
Two steps of weighting processes were involved in this assessment. First, the unit processes, i.e., P mining and P fertilizer production, were given an equal weight. This was to avoid giving preferential and discriminating treatment to any stakeholder and any social impact category associated with the two processes. Second, the site-specific processes were weighted based on the share of the import of P rocks and P fertilizers from each country. For P rocks, we collected the import data of 2012. Indirect use of P rock was also considered; in the case of USA and China where P was imported as P fertilizers, we assumed an equivalent amount of P rocks was required. Although we realized that the concentration of P was different in P rocks and P fertilizers, this assumption was made due to a lack of detailed data. For P fertilizers, we collected the import data of ammonium P fertilizers, which included monoammonium and diammonium P fertilizers, in 2012. We assumed P fertilizer production in Japan was equivalent to the import amount of P rocks for the same reason. The data for P rock imports and P fertilizer production were cut-off at 8.26% and 5.21%, respectively. Some imports from the rest of the world were not included as these amounts were relatively small and were not stable sources to Japan. The results of the inventory are shown in Table 3.
For recycled P fertilizers production, the activity coefficients of WWTP operation and P fertilizers production were assigned as 0.5 and 0.5, respectively to avoid preferential treatment. The same social indicators were considered for MAP and HAP types of recycled P fertilizers, although the inputs to WWTP for producing MAP and HAP were different as background processes were not considered in this study (as mentioned in Section 2.1).

2.3. Impact Assessment and Interpretation

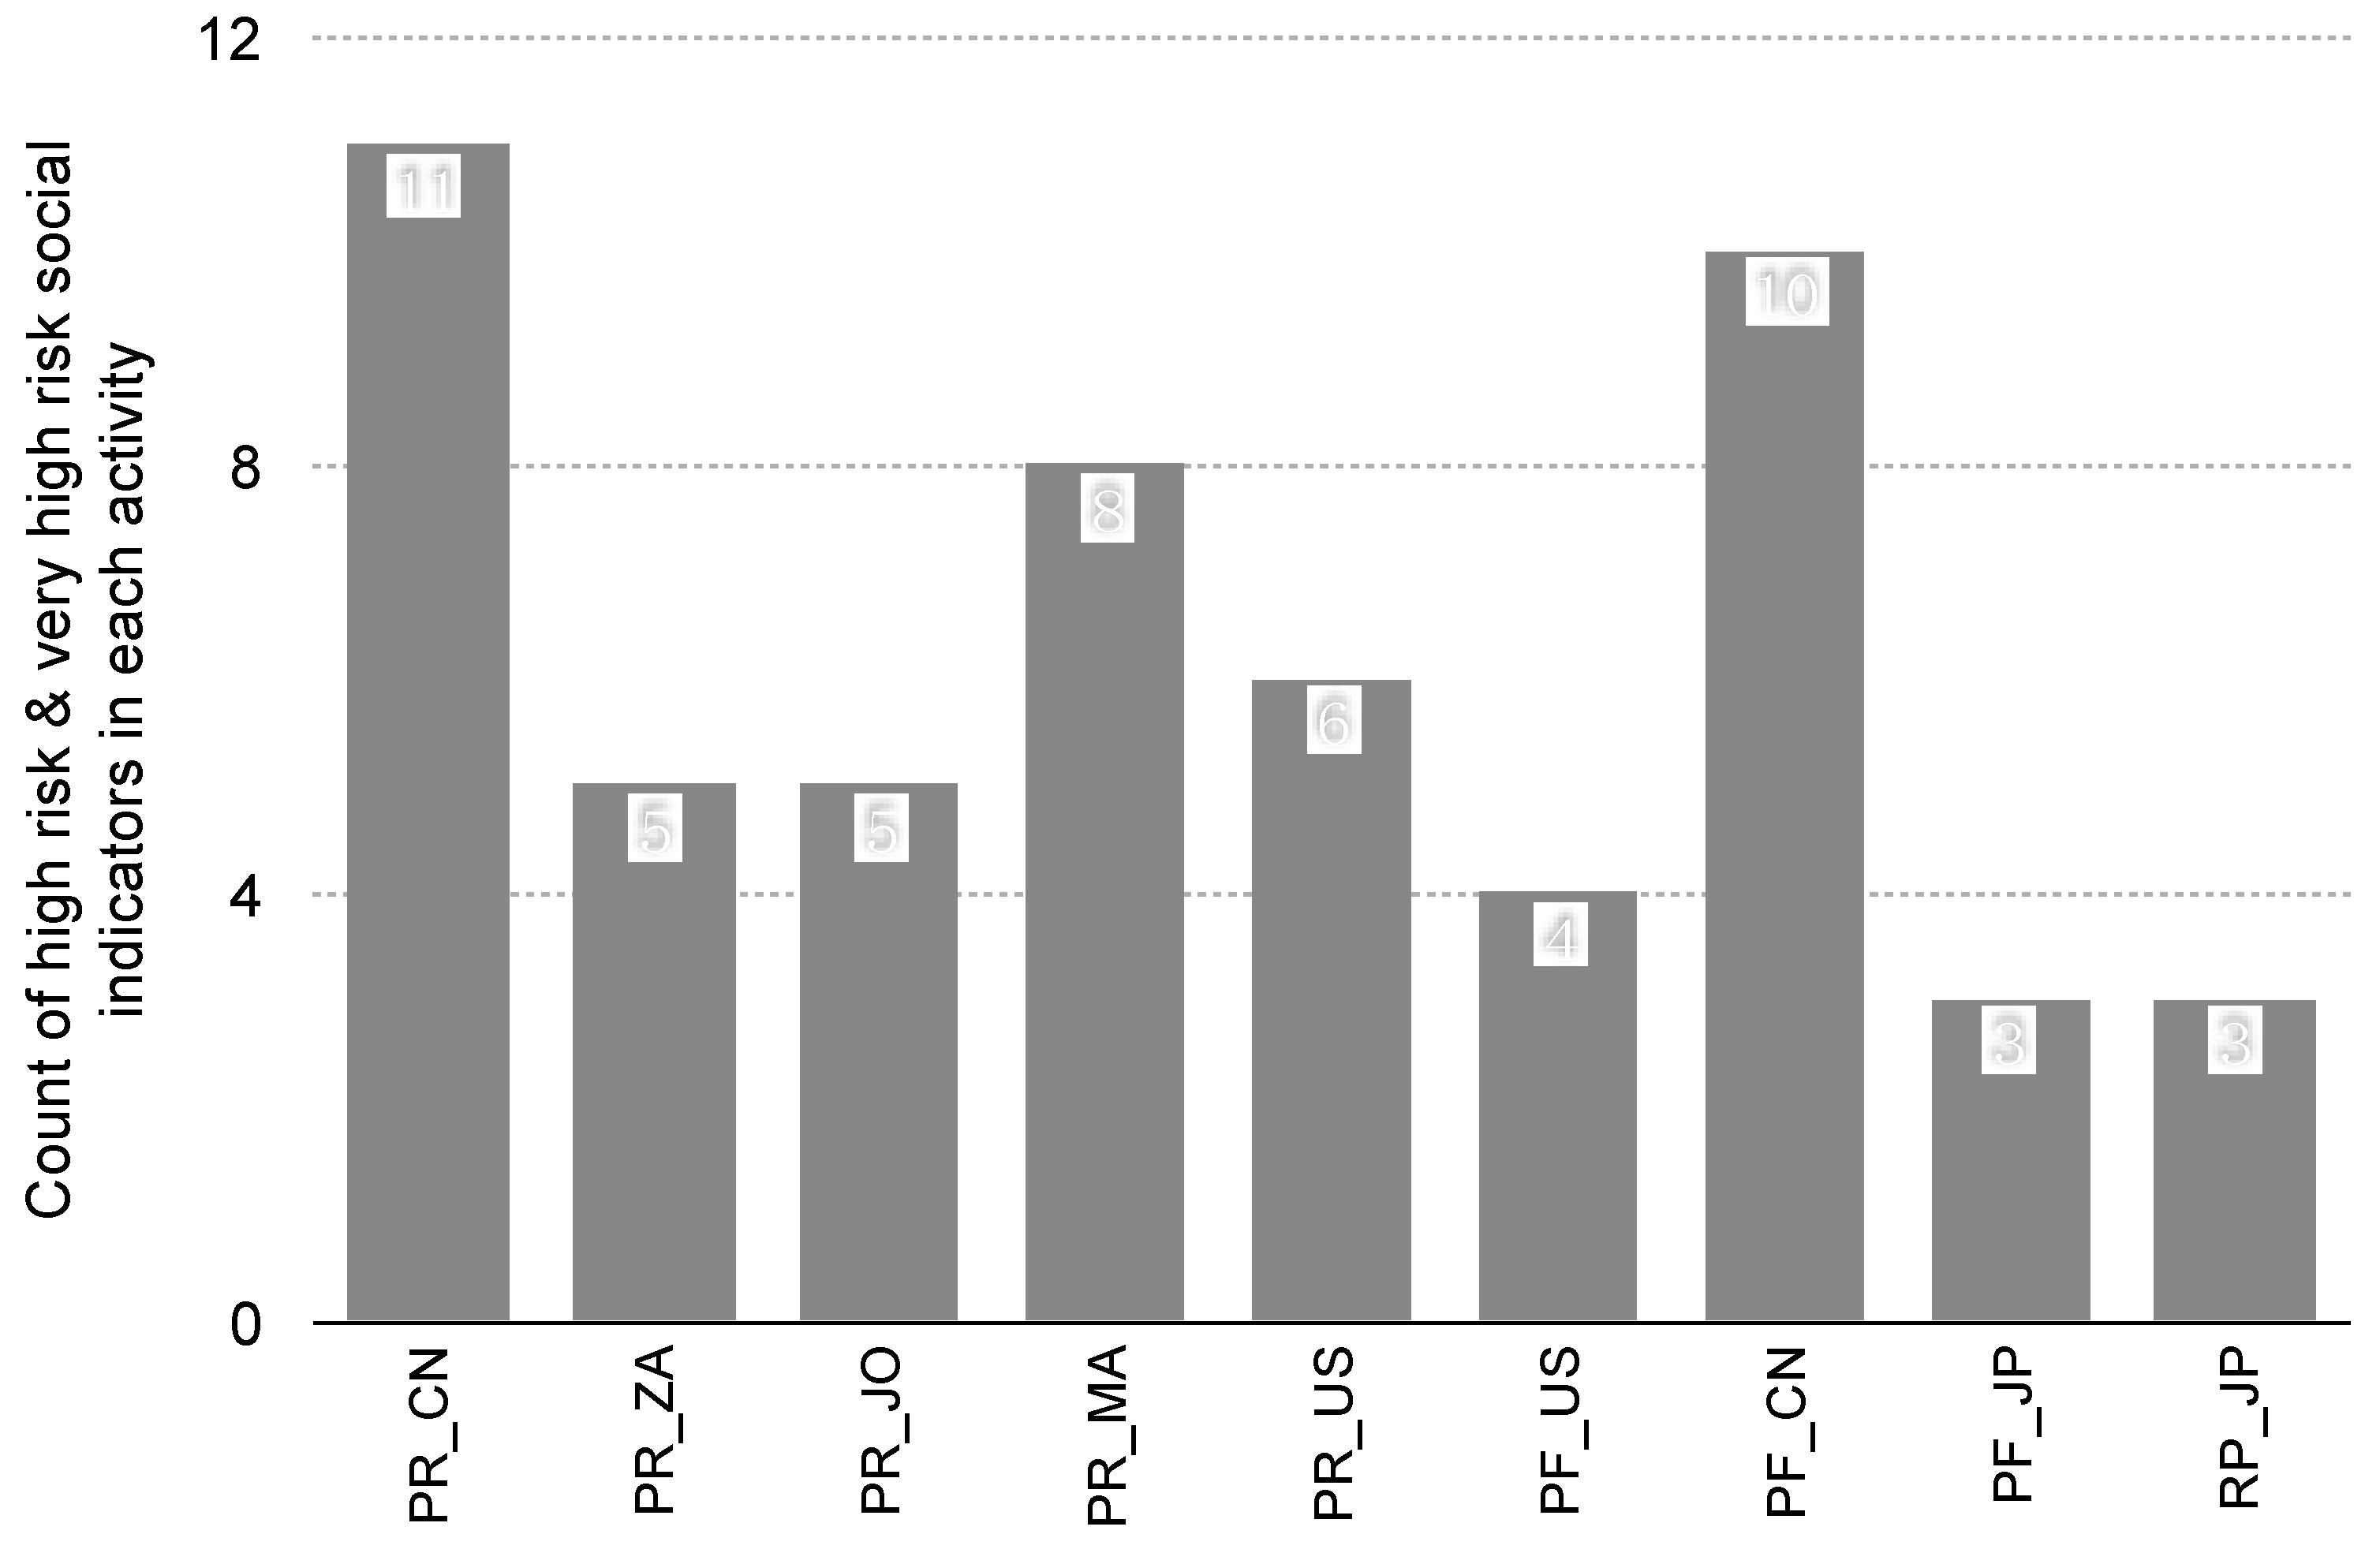
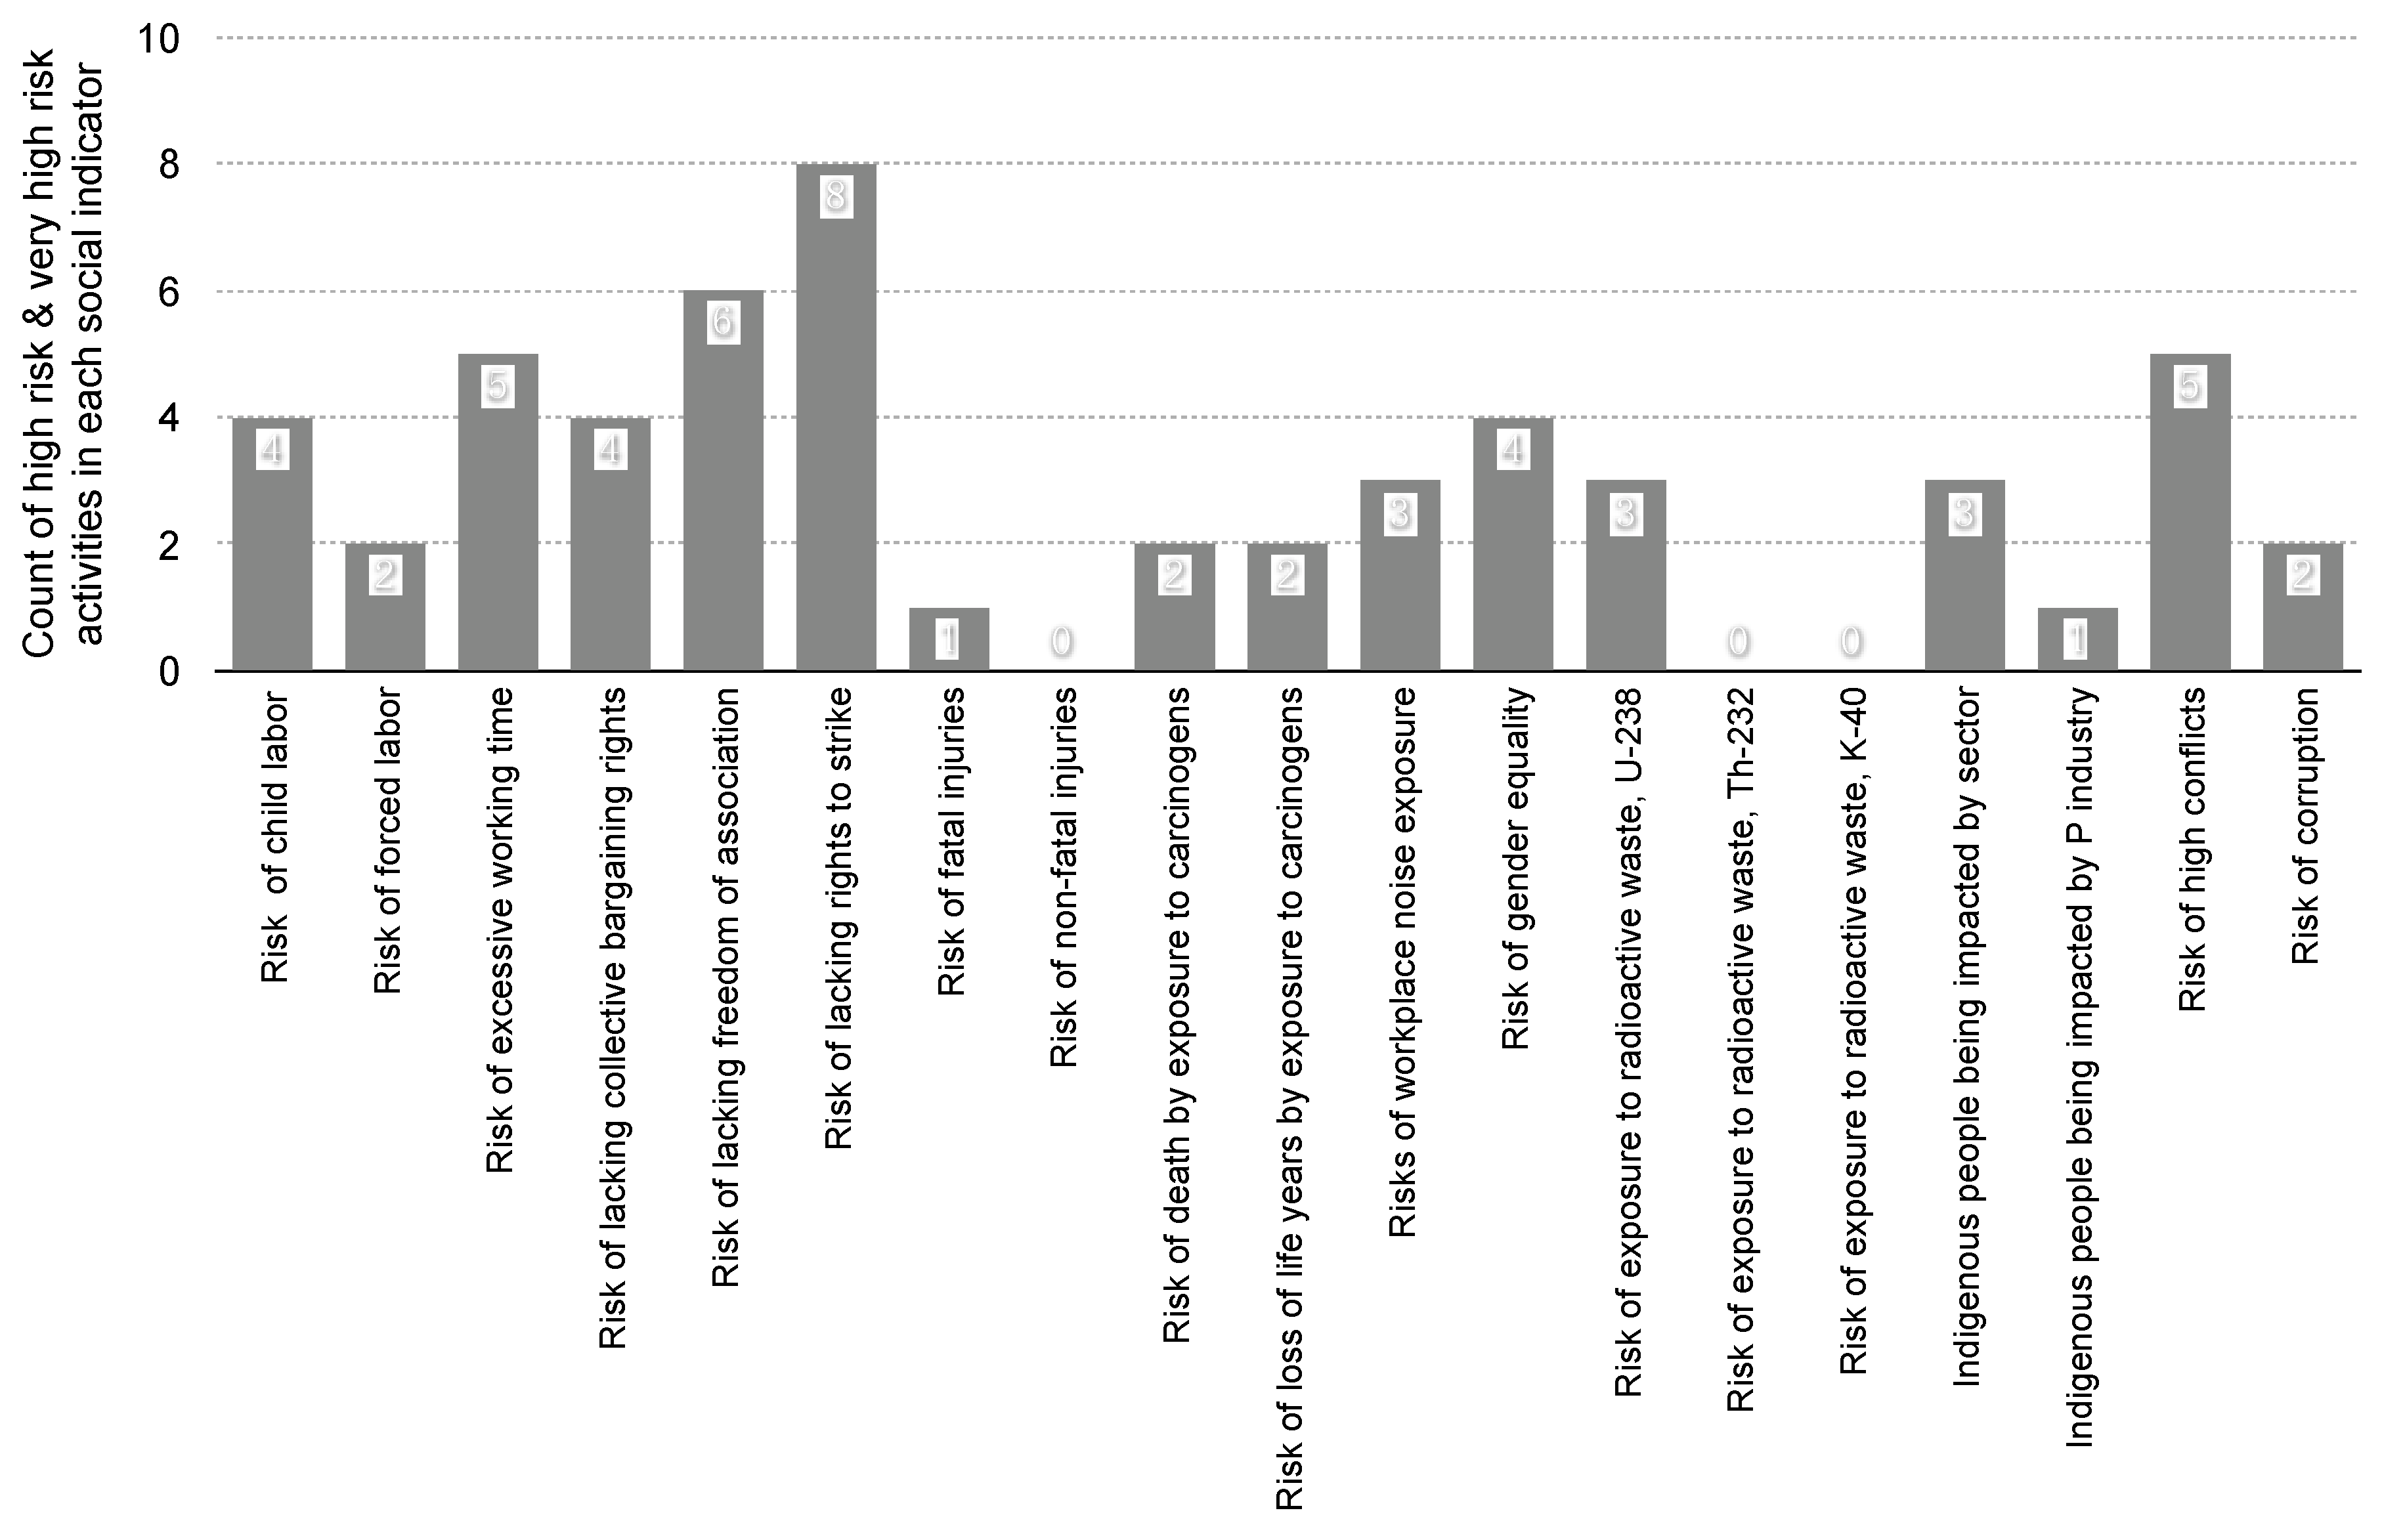
2.3.1. Social Impacts Hotspots

Before any advanced treatment of the data, we identified the social hotspots within the life cycle of P fertilizers consumed in Japan as aggregating the social impacts across different stakeholders or social categories might lead to information loss, thus affecting the interpretation. Hotspots of production activities were identified based on the count of high risk and very high risk social indicators involved in each activity [33], and showed the production activities that were having the most impacts on society, and thus should be avoided. In contrast, hotspots of social indicators were identified based on the count of high risk and very high risk activity shown in each indicator and showed the impact categories that were most concerned in the supply chain of P.

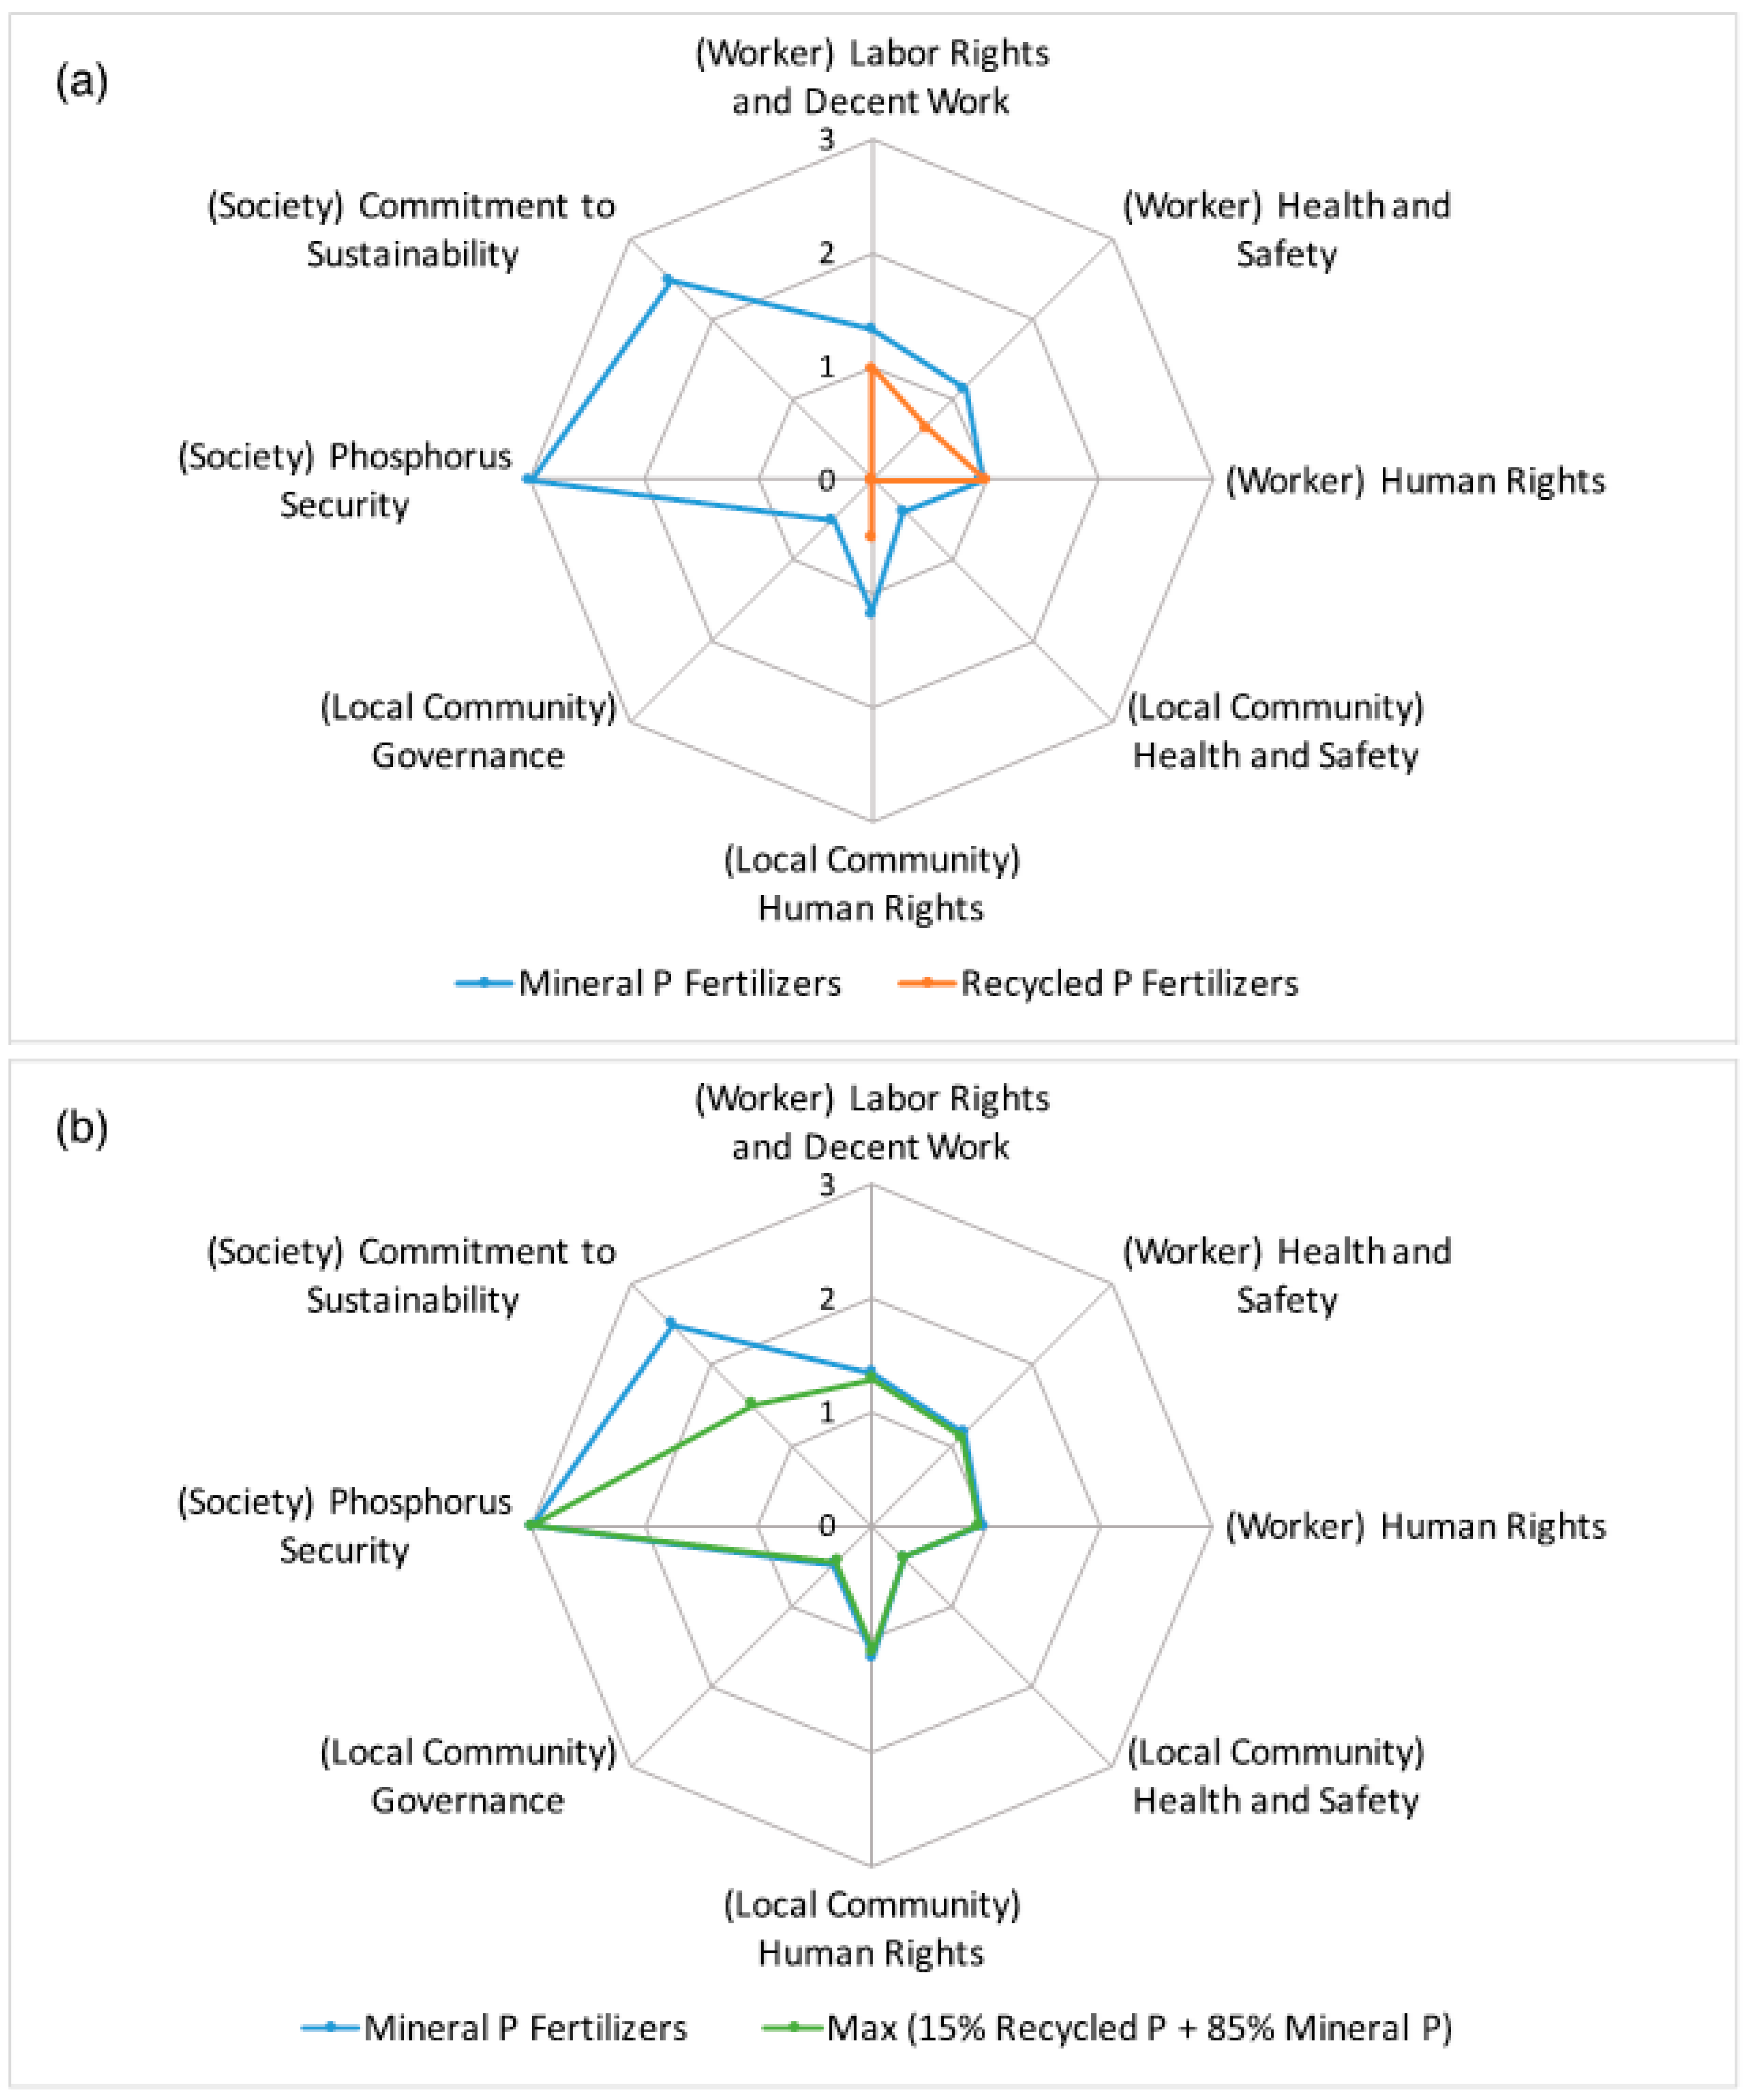
2.3.2. Comparisons of Mineral and Recycled-Based P Fertilizers

A systematic social impact assessment framework was developed to communicate the overall social impacts effectively. First, we harmonized the inventory data by assigning a score to represent the social risk level of each activity: 0 as low risk, 1 as medium risk, 2 as high risk, and 3 as very high risk. All quantitative or qualitative inventory data were therefore converted to a simple score. Then, we multiplied the score of each activity to the corresponding activity coefficient. For example, the child labor in P rock mining in China (score 3) was multiplied by its corresponding activity coefficient (0.18) and yielded a score of 0.54. Aggregating the score of all site-specific production processes resulted in a score that showed the performance of a social indicator of P fertilizer consumption based on current consumption choice in Japan. Next, we performed a series of aggregation by the weighted average risk level of the data indicators, social themes, social impact categories, and stakeholder’s groups accordingly, to obtain the final social impact score for the fertilizer choice. For example, the final score of “worker’s labor rights and decent work”, was based on the average score of “child labor”, “forced labor”, “excessive working time”, and “freedom of association, collective bargaining, and rights to strike”; and the score of “freedom of association, collective bargaining, and rights to strike” was based on the average score of the three indicators.
Two sets of comparisons were made in this assessment.
(a)
We compared the social impacts on stakeholders while consuming mineral and recycled-based P fertilizers in general. We assumed that the impacts for mineral P fertilizers were based on the average of import sources and production processes, and recycled P fertilizers were based on a single source and production process only, which was Japan. Therefore, the assessment showed the marginal social impact that could be mitigated by changing the choices of P fertilizers for individual farmers in Japan.
(b)
We conducted another comparison to show the social impact mitigation potential if Japan maximized the local P recycling from WWTP and substituted the P rock imports accordingly. The capacity of recycled P fertilizer production was constrained by the total available P collected in the WWTP. We based the assessment on a P material flow analysis study in 2009 [35]. The estimation for P in the wastewater sector was based on population, and since the population of Japan has been mostly stagnant for the past 20 years, we estimated a total of 52,750 metric tons of recycled P was available without considering the losses in the production processes, which could substitute 15% of P rock imports. We assumed that total P fertilizer consumption was the same, and the maximum recycled P substituted the P rock imports from the highest social impacts source, i.e., China in this case. Furthermore, the activity coefficient was adjusted accordingly. This second comparison showed the maximum achievable social impact mitigation from implementing a compulsory P recycling policy at the nation (or country) scale by the Japanese Government.

3. Results

3.1. Inventory Results

The SLCA inventory results are shown in Table 4, Table 5 and Table 6. The risk level of individual activity, i.e., P rock mining, P fertilizer production, and P recycling in respective countries are represented through color coding.
For the production system, overall, the potential impacts on workers (Table 4) were higher than on local communities (Table 5). For the consumption system, the potential impacts on farmers and societies (Table 6) were higher when consuming mineral P than recycled P fertilizers. The impacts on the farmers’ livelihoods were negligible as currently, the costs for recycled P fertilizers are subsidized by various governments to match the price of mineral P fertilizers.

3.2. Social Impacts Hotspots

Figure 2 showed the activity hotspots involved in supplying the P fertilizers in Japan, which were mining in China and Morocco, and fertilizer production in China. In 2012, direct P rock imported from China and Morocco accounted for 44% and 16%, respectively; the direct importation of P fertilizers from China accounted for 30%. This assessment raised concerns regarding the working conditions in China (i.e., labor rights and health and safety issues), and in protecting the human rights of indigenous communities in Morocco. It should be noted that the results were based on sectoral data, which could not distinguish between P mining and the mining of other minerals. A visit to the Yuntianhua Group in China, one of the world’s leading P fertilizer production companies [47], showed that the working conditions in this country may be less severe than estimated. Therefore, the results must be used carefully. Nevertheless, it is acknowledged that the SHDB provided us with a reasonable estimation of social indicators, when collecting field data was not practical.
The social impact hotspots were identified as the risk of lacking the right to strike, to freedom of association, of excessive working hours, and the high risk of conflicts (Figure 3). The rights to strike and freedom of association were based on the universal human values first stated in the Universal Declaration of Human Rights in UN General Assembly back in 1948, where “everyone has the right to freedom of peaceful assembly and association and that no one may be compelled to belong to an association”. These had been qualitatively evaluated by the International Trade Union Confederation Survey [48], along with the right to have reasonable working hours where “everyone has the right to rest and leisure, including limitation of working hours and periodic holidays with pay”. However, many countries did not have data for excessive working hours. The data used were an estimation made by the SHDB based on alternative sources [41]. The risk of high conflict was defined as the clashing of interests over national values of some duration and magnitude between at least two parties determined to pursue their interests and achieve their goals based on the Heidelberg Institute for International Conflict Research [49]. In addition, the human rights of the local communities may also be violated due to conflicts in the producing countries.

3.3. Comparisons of Mineral and Recycled-Based P Fertilizers

The results of the comparison of the social impacts of consumed mineral and recycled-based P fertilizers in Japan are presented in Figure 4. Figure 4a shows the comparison of fertilizers without considering the production capacity of recycled P. We showed that choosing recycled P over mineral P notably mitigated impacts on society from a consumption perspective, i.e., improving P security and commitment to sustainability. Furthermore, on the production side, the risk of social impacts on workers and local communities could be mitigated by shifting foreign-based production to domestic-based production. An exception was the worker’s human rights category, which was characterized by gender equality at a workplace. Japan scored worse than the average of the foreign P producing countries.
Figure 4b shows the comparison between the current P consumption situation and the scenario of mandating P recycled from Japan, which was constrained by the maximum recycling capacity in this country. Even though switching to recycled P seemed to be promising in mitigating the social impacts (Figure 4a), the potential was less significant at the national level (Figure 4b). The differences between each social impact score were between 3–7%, except for the commitment to sustainability of society which was because the maximum recycling capacity could only substitute 15% of imported P rocks, or 7% of total P consumption. Despite the limited capacity, the nationwide implementation of P recycling would help realize a vision of a circular society in a Japanese context. Therefore, the social impact score for commitment to sustainability was much lower.
By comparing Figure 4a,b, we showed that the predominant factors for a social impact score shifted from the choice of P fertilizers to the total usage of P fertilizers. In other words, to effectively achieve lower social impacts, Japan must simultaneously promote P recycling policy and reduce the total P fertilizer consumption across the country.

4. Discussion

4.1. Limitations

The processes included in the system boundary were limited to top-tier processes, i.e., P mining, P fertilizer production, and P recycling; and were weighted equivalently. This was done due to the lack of data to support the assessment at a national scale. For example, the resolution of data acquired from the SHDB was either at a country or sector scale, which only represented the overall situation of the whole industry, despite different types of P fertilizers. In the input-output based SLCA of fertilizers by Martinez-Blanco et al. [8], they attempted to include the second-tier process, or background processes, by using the working time weighting method based on the GaBi 5.0 database. However, they found that the available working time inventories were incomplete and insufficient to support a current detailed assessment.
Next, not all stakeholders were included in the assessment. For example, the local or central government would have to increase their spending in the case of recycled P, so such impacts were treated as a choice of public policy instead of a negative social impact. In terms of industry players, we prioritized the basic rights of workers and ignored the profitability of investors or the survivability of the companies. Some potential conflicts of interests were expected between the stakeholders. Furthermore, research and development firms were not included despite being of importance to the success of the P recycling industry.
Unlike the environmental impacts in an LCA study, social impacts may be referred to as both positive and negative. In this study, positive impacts were not included. An example of a positive impact would be the creation of further job opportunities, where the promotion of P recycling would potentially create domestic employment. In the WWTP, the recycling process was most likely to be managed by existing operators. In research and development firms, job creation could be expected. On the other hand, consuming mineral P would indirectly support jobs in foreign P producing countries.
The SLCA was sensitive to the practices in each country [33]. The supply of P rocks and P fertilizers in Japan were based on multiple import sources that varied across different years. In this study, we used 2012 import data and considered the data for the past 15 years. As demand for P rocks and P fertilizers has decreased, the sources for P rock imports were mostly stable in terms of import ratio, and the P fertilizer imports changed with increasing trends in products from China. This assessment used the import ratio to define the activity coefficient of each production process; therefore, the assessment could be effectively updated according to the interested scenario.

4.2. Alternative Frameworks for Supporting P Recycling Policy

Apart from the proposed SLCA framework, other alternative frameworks applicable to support the P recycling policy have been discussed in recent publications [9,34,40,50], e.g., P vulnerability, P security, and the sustainability cost of P. Initially, the debates of P addressed concerns of the long-term sustainability of P, or peak production of the mineral P [51]. However, Cordell et al. [40,50] expanded the view by introducing P vulnerability and P security to include the geopolitical risk of P supply, the socio-economic impacts on food and the farming system, and other P issues from the perspective of a nation. These frameworks highlighted the qualitative evaluation of short and long-term risks associated with P fertilizer supply, and outlined potential quantitative indicators. Since the frameworks focused on the impacts directly related to P fertilizers, causal relationships among the activities and stressors could be depicted. For example, the impact on farmer livelihood was affected by the sensitivity to internal factors such as country dependency on P imports, and the exposure to external factors such as the international price of P rocks [50]. However, the empirical relationships between the stressors and responses are yet to be quantitatively shown.
In comparison, the social impacts evaluated in the SLCA were more generic and may not be a direct cause of P activities. For example, the presence of decent working conditions of a miner was most likely based on the culture of the mining company instead of the demand for P. The SLCA treated the indicators independently, therefore avoiding the treatment of causal linkage. However, results are considered sufficient for a consequential SLCA [52] that aimed to choose between recycled P and mineral P fertilizers. To comprehensively support a P recycling policy, the evaluation of a national P vulnerability or P security based on alternative frameworks could be complemented with the SLCA.

5. Conclusions

In conclusion, this study developed and examined an original SLCA framework to support a P recycling policy. The framework was based on the Guidelines with supplemented specific P-related indicators. Hotspots activities were identified in specific countries and impact categories. A comparison of P fertilizers in Japan showed that a marginal production of recycled P had less negative social impacts than mineral P. However, due to recycling capacity, launching a nationwide P recycling policy could only substitute a fraction of mineral P. Thus, the effect of mitigating social impacts could be much less after all. This study did not deal with the interpretation of social impacts as external cost, such as the potential economic costs due to damage on stakeholders. The practical mean to include social impact into policy making remains open for discussion. A main limitation of the SLCA was the lack of on-site data. Although the SHDB streamlined most of the general descriptive indicators, the resolution of data impaired a detailed analysis. More research at local levels to obtain more on-site data would improve the assessment, particularly in countries such as China and Morocco that have a high risk of social impacts in P mining activities. This would also help to expand the existing global databases. Nevertheless, the SLCA approach was effective in semi-quantifying the social impacts of stakeholders associated with P fertilizers across the life cycle stages.

Supplementary Materials

The following are available online at www.mdpi.com/2071-1050/9/7/1223/s1.

Acknowledgments

The publication fee was sponsored by the Japan Society for the Promotion of Science. We also appreciate the anonymous reviewers for their constructive input.

Author Contributions

Heng Yi Teah and Motoharu Onuki conceived and designed the research; Heng Yi Teah collected and analyzed the data; Heng Yi Teah wrote the paper.

Conflict of Interest

The founding sponsors had no role in the design of the study; in the collection, analyses, or interpretation of data; in the writing of the manuscript, and in the decision to publish the results.

Abbreviation

PPhosphorus
WWTPWastewater treatment plant
SLCASocial Life Cycle Assessment
UNEP-SETACUnited Nations Environment Program & Society of Environmental Toxicology and Chemistry
NORMNaturally occurring radioactive materials
SHDBSocial Hotspots Database
MAPMagnesium ammonium phosphate, or struvite
HAPHydroxyapatite

References

  1. Cordell, D.; Drangert, J.O.; White, S. The story of phosphorus: Global food security and food for thought. Glob. Environ. Chang. 2009, 19, 292–305. [Google Scholar] [CrossRef]
  2. Le Corre, K.S.; Valsami-Jones, E.; Hobbs, P.; Parsons, S.A. Phosphorus recovery from wastewater by struvite crystallization: A review. Crit. Rev. Environ. Sci. Technol. 2009, 39, 433–477. [Google Scholar] [CrossRef]
  3. Adam, C.; Peplinski, B.; Michaelis, M.; Kley, G.; Simon, F.-G. Thermochemical treatment of sewage sludge ashes for phosphorus recovery. Waste Manag. 2009, 29, 1122–1128. [Google Scholar] [CrossRef] [PubMed]
  4. Linderholm, K.; Tillman, A.-M.; Mattsson, J.E. Life cycle assessment of phosphorus alternatives for Swedish agriculture. Resour. Conser. Recycl. 2012, 66, 27–39. [Google Scholar] [CrossRef]
  5. Hong, J.; Hong, J.; Otaki, M.; Jolliet, O. Environmental and economic life cycle assessment for sewage sludge treatment processes in Japan. Waste Manag. 2009, 29, 696–703. [Google Scholar] [CrossRef] [PubMed]
  6. Johansson, K.; Perzon, M.; Froling, M.; Mossakowska, A.; Svanstrom, M. Sewage sludge handling with phosphorus utilization—Life cycle assessment of four alternatives. J. Clean. Prod. 2008, 16, 135–151. [Google Scholar] [CrossRef]
  7. Kalmykova, Y.; Karlfeldt Fedje, K. Phosphorus recovery from municipal solid waste incineration fly ash. Waste Manag. 2013, 33, 1403–1410. [Google Scholar] [CrossRef] [PubMed]
  8. Martínez-Blanco, J.; Lehmann, A.; Muñoz, P.; Antón, A.; Traverso, M.; Rieradevall, J.; Finkbeiner, M. Application challenges for the social Life Cycle Assessment of fertilizers within life cycle sustainability assessment. J. Clean. Prod. 2014, 69, 34–48. [Google Scholar] [CrossRef]
  9. Cordell, D.; Turner, A.; Chong, J. The hidden cost of phosphate fertilizers: mapping multi-stakeholder supply chain risks and impacts from mine to fork. Glob. Chang. Peace Secur. 2015, 27, 323–343. [Google Scholar] [CrossRef]
  10. Smith, J.J. The taking of the Sahara: the role of natural resources in the continuing occupation of Western Sahara. Glob. Chang. Peace Secur. 2015, 27, 263–284. [Google Scholar] [CrossRef]
  11. Hagen, E. Saharawi conflict phosphates and the Australian dinner table. Glob. Chang. Peace Secur. 2015, 27, 377–393. [Google Scholar] [CrossRef]
  12. Azouazi, M.; Ouahidi, Y.; Fakhi, S.; Andres, Y.; Abbe, J.C.; Benmansour, M. Natural radioactivity in phosphates, phosphogypsum and natural waters in Morocco. J. Environ. Radioactiv. 2001, 54, 231–242. [Google Scholar] [CrossRef]
  13. Fávaro, D. Natural radioactivity in phosphate rock, phosphogypsum and phosphate fertilizers in Brazil. J. Radioanal. Nucl. Chem. 2005, 264, 445–448. [Google Scholar] [CrossRef]
  14. United Nations Environment Programme (UNEP); International Fertilizer Industry Association. Environmental Aspects of Phosphate and Potash Mining; United Nations Environment Programme (UNEP); International Fertilizer Industry Association: Paris, France, 2001. [Google Scholar]
  15. Papastefanou, C.; Stoulos, S.; Ioannidou, A.; Manolopoulou, M. The application of phosphogypsum in agriculture and the radiological impact. J. Environ. Radioactiv. 2006, 89, 188–198. [Google Scholar] [CrossRef] [PubMed]
  16. Tayibi, H.; Choura, M.; López, F.A.; Alguacil, F.J.; López-Delgado, A. Environmental impact and management of phosphogypsum. J. Environ. Manag. 2009, 90, 2377–2386. [Google Scholar] [CrossRef] [PubMed]
  17. EU Ad-Hoc Working Group on Raw Materials. Report on Critical Raw Materials for the EU; European Commission: Brussels, Belgium, 2014. [Google Scholar]
  18. Nykvist, B.; Persson, A.; Moberg, F.; Persson, L.; Cornell, S.; Rockström, J. National Environmental Performance on Planetary Boundaries; Swedish Environmental Protection Agency: Stockholm, Sweden, 2013. [Google Scholar]
  19. United Nations Environment Programme (UNEP); Society for Environmental Toxicology and Chemistry (SETAC). Guidelines for Social Life Cycle Assessment of Products; United Nations Environment Programme (UNEP); Society for Environmental Toxicology and Chemistry (SETAC): Nairobi, Kenya, 2009. [Google Scholar]
  20. Fan, Y.; Wu, R.Q.; Chen, J.Q.; Apul, D. A Review of Social Life Cycle Assessment Methodologies. In Social Life Cycle Assessment; Springer: Singapore, 2015; pp. 1–23. [Google Scholar]
  21. Chhipi-Shrestha, G.K.; Hewage, K.; Sadiq, R. ‘Socializing’ sustainability: A critical review on current development status of social life cycle impact assessment method. Clean. Technol. Environ. 2015, 17, 579–596. [Google Scholar] [CrossRef]
  22. Wu, R.Q.; Yang, D.; Chen, J.Q. Social Life Cycle Assessment Revisited. Sustainability 2014, 6, 4200–4226. [Google Scholar] [CrossRef]
  23. Parent, J.; Cucuzzella, C.; Revéret, J.-P. Impact assessment in SLCA: Sorting the sLCIA methods according to their outcomes. Int. J. LCA 2010, 15, 164–171. [Google Scholar] [CrossRef]
  24. Jorgensen, A.; Le Bocq, A.; Nazarkina, L.; Hauschild, M. Methodologies for social life cycle assessment. Int. J. Life Cycle Ass. 2008, 13, 96–103. [Google Scholar] [CrossRef]
  25. Weidema, B.P. The integration of economic and social aspects in life cycle impact assessment. Int. J. LCA 2006, 11, 89–96. [Google Scholar] [CrossRef]
  26. Norris, G.A. Social impacts in product life cycles-Towards life cycle attribute assessment. Int. J. LCA 2006, 11, 97–104. [Google Scholar] [CrossRef]
  27. Dreyer, L.; Hauschild, M.; Schierbeck, J. A Framework for Social Life Cycle Impact Assessment (10 pp). Int. J. LCA 2006, 11, 88–97. [Google Scholar] [CrossRef]
  28. Ekener-Petersen, E.; Moberg, Å. Potential hotspots identified by social LCA–Part 2: Reflections on a study of a complex product. Int. J. LCA 2013, 18, 144–154. [Google Scholar] [CrossRef]
  29. Ekener-Petersen, E.; Finnveden, G. Potential hotspots identified by social LCA—Part 1: A case study of a laptop computer. Int. J. LCA 2013, 18, 127–143. [Google Scholar] [CrossRef]
  30. Manik, Y.; Leahy, J.; Halog, A. Social life cycle assessment of palm oil biodiesel: A case study in Jambi Province of Indonesia. Int. J. LCA 2013, 18, 1386–1392. [Google Scholar] [CrossRef]
  31. GreenDelta PSILCA: Understanding Social Impact. Available online: http://www.psilca.net/ (accessed on 13 June 2017).
  32. Sala, S.; Vasta, A.; Mancini, L.; Dewulf, J.; Rosenbaum, E. Social Life Cycle Assessment: State of the Art and Challenges for Supporting Product Policies; European Commission: Brussels, Belgium, 2015. [Google Scholar]
  33. Ekener-Petersen, E.; Höglund, J.; Finnveden, G. Screening potential social impacts of fossil fuels and biofuels for vehicles. Energy Policy 2014, 73, 416–426. [Google Scholar] [CrossRef]
  34. Cordell, D.; Rosemarin, A.; Schroder, J.J.; Smit, A.L. Towards global phosphorus security: A systems framework for phosphorus recovery and reuse options. Chemosphere 2011, 84, 747–758. [Google Scholar] [CrossRef] [PubMed]
  35. Matsubae-Yokoyama, K.; Kubo, H.; Nakajima, K.; Nagasaka, T. A Material Flow Analysis of Phosphorus in Japan. J. Ind. Ecol. 2009, 13, 687–705. [Google Scholar] [CrossRef]
  36. Matsubae, K.; Kajiyama, J.; Hiraki, T.; Nagasaka, T. Virtual phosphorus ore requirement of Japanese economy. Chemosphere 2011, 84, 767–772. [Google Scholar] [CrossRef] [PubMed]
  37. Ohtake, H.; Okano, K. Development and Implementation of Technologies for Recycling Phosphorus in Secondary Resources in Japan. Glob. Environ. Res. 2015, 19, 49–65. [Google Scholar]
  38. Matsubae, K.; Webeck, E.; Nansai, K.; Nakajima, K.; Tanaka, M.; Nagasaka, T. Hidden phosphorus flows related with non-agriculture industrial activities: A focus on steelmaking and metal surface treatment. Resour. Conser. Recycl. 2015, 105, 360–367. [Google Scholar] [CrossRef]
  39. A Literature Review of Type I SLCA—Making the Logic Underlying Methodological Choices Explicit. Available online : https://link.springer.com/article/10.1007/s11367-016-1067-z (accessed on 12 July 2017).
  40. Cordell, D.; White, S. Tracking phosphorus security: indicators of phosphorus vulnerability in the global food system. Food Sec. 2015, 7, 337–350. [Google Scholar] [CrossRef]
  41. Benoit-Norris, C.; Cavan, D.A.; Norris, G. Identifying Social Impacts in Product Supply Chains: Overview and Application of the Social Hotspot Database. Sustainability 2012, 4, 1946–1965. [Google Scholar] [CrossRef]
  42. Kruse, S.A.; Flysjö, A.; Kasperczyk, N.; Scholz, A.J. Socioeconomic indicators as a complement to life cycle assessment—An application to salmon production systems. Int. J. LCA 2009, 14, 8–18. [Google Scholar] [CrossRef]
  43. Benoít Norris, C.; Norris, G.A.; Aulisio Caven, D. Socil Hotspots Database—Supporting Documentation; European Commission: Brussels, Belgium, 2015. [Google Scholar]
  44. Benoit, C.; Norris, G.A.; Valdivia, S.; Ciroth, A.; Moberg, A.; Bos, U.; Prakash, S.; Ugaya, C.; Beck, T. The guidelines for social life cycle assessment of products: Just in time! Int. J. Life Cycle Assess. 2010, 15, 156–163. [Google Scholar] [CrossRef]
  45. National Instutute of Radiological Sciences. NORM Database. Available online: http://www.nirs.qst.go.jp/db/anzendb/NORMDB/ENG/1_bussitunokensaku.php (accessed on 31 May 2017).
  46. Ministry of the Environment (Japan), Sound Material-Cycle Society. Available online: http://www.env.go.jp/en/recycle/smcs/index.html (accessed on 4 July 2017).
  47. Geissler, B.; Mew, M.C.; Weber, O.; Steiner, G. Efficiency performance of the world’s leading corporations in phosphate rock mining. Resour. Conser. Recycl. 2015, 105, 246–258. [Google Scholar] [CrossRef]
  48. International Trade Union Confederation. Annual Survey of Violations of Trande Union Rights. Available online: https://www.ituc-csi.org/annual-survey-of-violations-of,271 (accessed on 5 May 2017).
  49. Heidelberg Institute for International Conflict Research, Conflict Barometer. 2016. Available online: https://www.hiik.de/en/konfliktbarometer/ (accessed on 31 May 2017).
  50. Cordell, D.; Neset, T.-S.S. Phosphorus vulnerability: A qualitative framework for assessing the vulnerability of national and regional food systems to the multi-dimensional stressors of phosphorus scarcity. Glob. Environ. Chang. 2014, 24, 108–122. [Google Scholar] [CrossRef]
  51. Cordell, D.; White, S. Peak phosphorus: clarifying the key issues of a vigorous debate about long-term phosphorus security. Sustainability 2011, 3, 2027–2049. [Google Scholar] [CrossRef]
  52. Jorgensen, A.; Dreyer, L.C.; Wangel, A. Addressing the effect of social life cycle assessments. Int. J. Life Cycle Assess. 2012, 17, 828–839. [Google Scholar] [CrossRef]
Figure 1. A simplified cradle-to-gate phosphorus (P) fertilizer production and consumption system in Japan. Processes that take place in Japan are shown in blue lines. (PR: P rock mining, RP: recycled P production, PF: P fertilizers production, US: United States, CN: China, ZA: South Africa, JO: Jordan, MA: Morocco, JP: Japan).
Sustainability 09 01223 g001
Figure 2. The count of high risk and very high risk social indicators in each activity that represents the hotspot activities (PR: P rock mining, PF: P fertilizer production, RP: P recycling).
Sustainability 09 01223 g002
Figure 3. The count of high risk and very high risk activities in each social indicator representing the social indicator hotspots.
Sustainability 09 01223 g003
Figure 4. The comparisons of social impact scores of (a) the consumption of mineral P and recycled P fertilizers in Japan; and (b) the current consumption of P fertilizers (mineral P) and a scenario of maximum P recycling (recycled P substitutes 15% imported P rocks). The risk levels are indicated by the scores, 0 as low risk and 3 as very high risk.
Sustainability 09 01223 g004
Table 1. The summary of stakeholders and social impact categories in the Social Life Cycle Assessment.
ActivitiesStakeholders (in Respective Countries)Social Impact Categories
Production System: Mining, fertilizer production, WWTP operationWorkersLabor rights and decent work, health and safety, human rights
Local communitiesHealth and safety, human rights, governance
Consumption System: FarmingFarmersLivelihood
SocietyP security, commitment to sustainability issues
Table 2. The selected descriptive specific indicators and the reasons for inclusion.
CategoriesSocial ThemesSelected Descriptive Specific IndicatorsReasons for Inclusion
Health and safety of local communitiesExposure to NORMsBq/kg U-238 series in P rockU-238 series, Th-232 series, and K-40 are the types of naturally occurring radionuclide [45]. Natural P rocks in normal condition include them that vary among locations. They are concentrated in the waste of P industry, thus may pose health risk to the community.
Bq/kg Th-232 series in P rock
Bq/kg K-40 in P rock
Human rights of local communitiesIndigenous rightsIdentified indigenous issues related to P industryP rocks is a tradable commodity that potentially causes conflicts in a community or a country. Current unresolved conflicts in the Western Sahara and Syria are most likely threatening the basic human rights of local communities [9].
Livelihood of individual farmersIncomeRatio of income spending on P fertilizerFarmers’ affordability of fertilizers can be indicated by their income spending [40]. High spending on fertilizers will undermine the livelihood of farmers.
Farm-gate cost of P fertilizers relative to market priceFarm-gate cost of P fertilizers are highly variable, depending on transportation and retail cost [9]. Lack of accessibility to P resources will increase the cost and thus undermining the livelihood of farmers.
P security of societyP import dependencyRatio of import P and total P consumptionNatural P deposits are concentrated in a few countries. Countries depending on foreign P will be vulnerable to the price fluctuation in international market and changes in international politics [40].
Commitment to sustainability issue of societyMineral P depletionNational mineral P consumption relative to global consumption (per ha farmland input)P fertilizers application on farmland are highly variable [18], depending on the soil condition, farmer’s economic status, and habits. Excessive use of P on farmland lead to a waste of resource.
Education and responsibilityEffort in promoting circular society 1Resource recycling is the key concept of circular society in Japanese context. Recycling P from WWTP enhances the effort for sustainable lifestyle.
1 Circular Society is an environmental conservation concept based on promoting reduced use, reuse, and recycle of materials in Japan. The concept is based on the Fundamental Law for Establishing a Sound Material-Cycle Society, enacted since May 2000 [46].
Table 3. The activity coefficient was estimated based on the share of import from each country except for P fertilizers, which are partially produced domestically.
ActivityP Rock Import (metric tons in 2012)Activity CoefficientActivityP Fertilizers Import/Production (metric tons in 2012)Activity Coefficient
PR_US275,7290.19PF_US275,7290.19
PR_CN153,7900.18PF_CN120,0060.08
PR_ZA78,0510.05PF_JP349,2100.23
PR_JO60,0000.04
PR_MA57,3690.04
P rock mining and P fertilizer production were given an equivalent weight, a total of 0.5 in each column. (PR: P rock mining, PF: P fertilizers production, US: United States, CN: China, ZA: South Africa, JO: Jordan, MA: Morocco, JP: Japan).
Table 4. The social impacts on workers in P rock mining (PR), P fertilizer production (PF), and P recycling (RP) in respective countries.
Social ThemeCharacterized IssueSocial Impact Risk Level (0: Low Risk, 1: Medium Risk, 2: High Risk, 3: Very High Risk)
PR_CNPR_ZAPR_JOPR_MAPR_USPF_USPF_CNPF_JPRP_JP
Labor Rights and Decent Work
Child LaborRisk of child labor in country333100300
Forced LaborRisk of forced labor in country121200100
Excessive Working TimeRisk of excessive working time by sector202111322
Freedom of Association, Collective Bargaining, Right to StrikeRisk that a country lacks or does not enforce collective bargaining rights311133311
Risk that a country lacks or does not enforce freedom of association rights211122222
Risk that a country lacks or does not enforce the right to strike312222333
Health and Safety
Occupational Injuries & DeathsRisk of fatal injuries by sector110131111
Risk of non-fatal injuries by sector110111111
Occupational Toxics & HazardsOverall risk of death by exposure to carcinogens in occupation310111300
Overall risk of loss of life years by exposure to carcinogens in occupation310111300
Overall risks of workplace noise exposure, both genders211200211
Human Rights
Gender EquityOverall risk of gender inequality in country212200211
The risk levels of low, medium, high, and very high risk are indicated in green, yellow, orange, and red, respectively.
Table 5. The social impacts on local communities in P rock mining (PR), P fertilizer production (PF), and P recycling (RP) in respective countries.
Social ThemeCharacterized IssueSocial Impact Risk Level (0: Low Risk, 1: Medium Risk, 2: High Risk, 3: Very High Risk)
PR_CNPR_ZAPR_JOPR_MAPR_USPF_USPF_CNPF_JPRP_JP
Health and Safety
Exposure to Radioactive WasteRisk of exposure to radioactive waste, U-238001322010
Risk of exposure to radioactive waste, Th-232010000000
Risk of exposure to radioactive waste, K-40000000000
Human Rights
Indigenous RightsRisk that indigenous people are negatively impacted at sector level220030000
Risk that indigenous people are negatively impacted by P industries000300000
High Conflict ZonesOverall risk for high conflict in country332311311
Governance
CorruptionOverall risk of corruption in country121200100
The risk levels of low, medium, high, and very high risk are indicated in green, yellow, orange, and red, respectively.
Table 6. The social impacts inventory for farmers and societies when consuming mineral and recycled P fertilizers in Japan.
Social ThemeCharacterized IssueSocial Impact Risk Level (0: Low Risk, 1: Medium Risk, 2: High Risk, 3: Very High Risk)
Mineral PRecycled P
Farmers’ Livelihood
IncomeRisk of unaffordable of P fertilizers00
Risk of overpriced of P fertilizers00
P Security
P Import dependencyDependency on foreign P30
Commitment to sustainability issues
Mineral P depletionRisk of over consumption of P fertilizer30
Education and responsibilityHinder the promotion of circular society20
The risk levels of low, medium, high, and very high risk are indicated in green, yellow, orange, and red, respectively).

