Article

Tourist Satisfaction Enhancement Using Mobile QR Code Payment: An Empirical Investigation

1
College of Business Administration, Chonnam National University, 77 Yongbong-Ro, Buk-Gu, Kwang-Ju 61186, Korea
2
Henan University of Animal Husbandry and Economy, No. 2, Yingcai Street, Huiji District, Zhengzhou 450044, China
*
Author to whom correspondence should be addressed.
Sustainability 2017, 9(7), 1186; https://doi.org/10.3390/su9071186
Submission received: 4 June 2017 / Revised: 3 July 2017 / Accepted: 4 July 2017 / Published: 6 July 2017
(This article belongs to the Special Issue Mobile Technology and Smart Tourism Development)

Abstract

:
Innovative technologies have greatly changed people’s lives, including their travel experiences. This study investigates the antecedents and outcomes of the quick response (QR) code payment technology used in tourism to provide empirical evidence that mobile technologies can be used to enhance tourist satisfaction. An empirical analysis using 247 field survey responses reveals that relative advantage, compatibility, and observability innovation attributes significantly affect tourists’ attitudes positively toward QR code payment services, which results in their use of the technology while traveling. However, image—the subjective norm in innovation diffusion—has no effect on such use. Furthermore, the study confirms that the use of the QR code payment technology in tourism influences an individual’s transaction satisfaction and travel satisfaction, suggesting that this technology can be used to advance the tourism industry. Theoretical and practical implications of the findings and future research directions are also discussed.

1. Introduction

Innovative technologies such as smart phones and quick response (QR) codes have greatly changed our daily lives. One such innovation is the QR code, a two-dimensional digital image that can be used in conjunction with smart phones, which allows high-speed access to mobile services [1,2]. With the development of mobile banking, QR codes have been designed to work with mobile payment applications (apps), creating a process which is called mobile QR code payments. Mobile (QR) code payment services, including Alipay and WeChat Pay, have been launched recently, enabling cash-free transactions in China. According to eMarketer [3], China has the largest and fastest-growing mobile payment market—with 247.9 million users in 2017 alone, a result of the widespread use of smartphones.
QR code payment services are characterized by speed, convenience, and security and are a preferred and widely accepted technological innovation in China. To accomplish payment through QR code payment technology, consumers simply need to scan a QR code sticker using their smartphone app. QR code payments overcome problems inherent with the use of cash, such as lack of change, hygiene, and counterfeit currency, and the demand for this type of payment has been steadily increasing. Furthermore, product or service providers utilize these payment services to attract more customers, eliminate costs related to point of sale (POS) terminals, save time, and increase the efficiency of front-line employees and satisfaction of customers by allowing quick completion of transactions.
The emphasis on mobile technologies integrated with the tourism and hospitality industry is relatively new. Since people can use QR code payment technology to make payments while traveling, we suggest that it affects their travel experience. Several studies have proposed that mobile technologies used in tourism can heavily influence the travel experience [4,5,6,7,8,9,10]. Furthermore, according to Quan and Wang [11], tourist experiences encompass a peak experience and supporting experiences. A peak experience refers to a planned travel experience that is something different from an individual’s daily life, while supporting experiences capture daily experiences such as eating, transportation, playing, shopping, and sleeping during the trip [11]. Most prior research on tourism has excluded supporting experiences from tourism, which limits its ability to provide insights into tourism development [11]. Through these supporting experiences, tourists build commercial exchange relationships with tourism goods or services suppliers. Thus, no matter what their supporting experiences are, tourists need to frequently make payments, suggesting that QR code payments have the potential to lead to high quality tourist experiences. Therefore, the goal of this study is to reveal whether this technology is effective in facilitating tourism.
The QR code payment service is a type of technology innovation, which refers to an idea, practice, or object that is perceived as new by an individual or organization [12]. The perceived characteristics of an innovation, that is, the innovation’s attributes, determine people’s acceptance and use of the technology [12,13,14,15,16]. Thus, to reveal whether QR payments could enhance an individual’s travel experience, it is necessary to first examine the effects of the innovation attributes of QR code payment technology adoption in the tourism context.
The contribution of this study is threefold: First, we adopt innovation attributes from Rogers’ [12] diffusion of innovation to explain why individuals (tourists) accept and use QR code payment services. We integrate it with the theory of reasoned action (TRA). Second, few studies have discussed the impact of technology use on tourism experiences [17]. This study focuses on QR payments in tourism, presenting empirical evidence that new technologies enhance tourist satisfaction. Finally, since tourist satisfaction is one of the core indicators for assessing travel destinations [18], this study further contributes to a better understanding of the use of technology innovations to advance tourism.

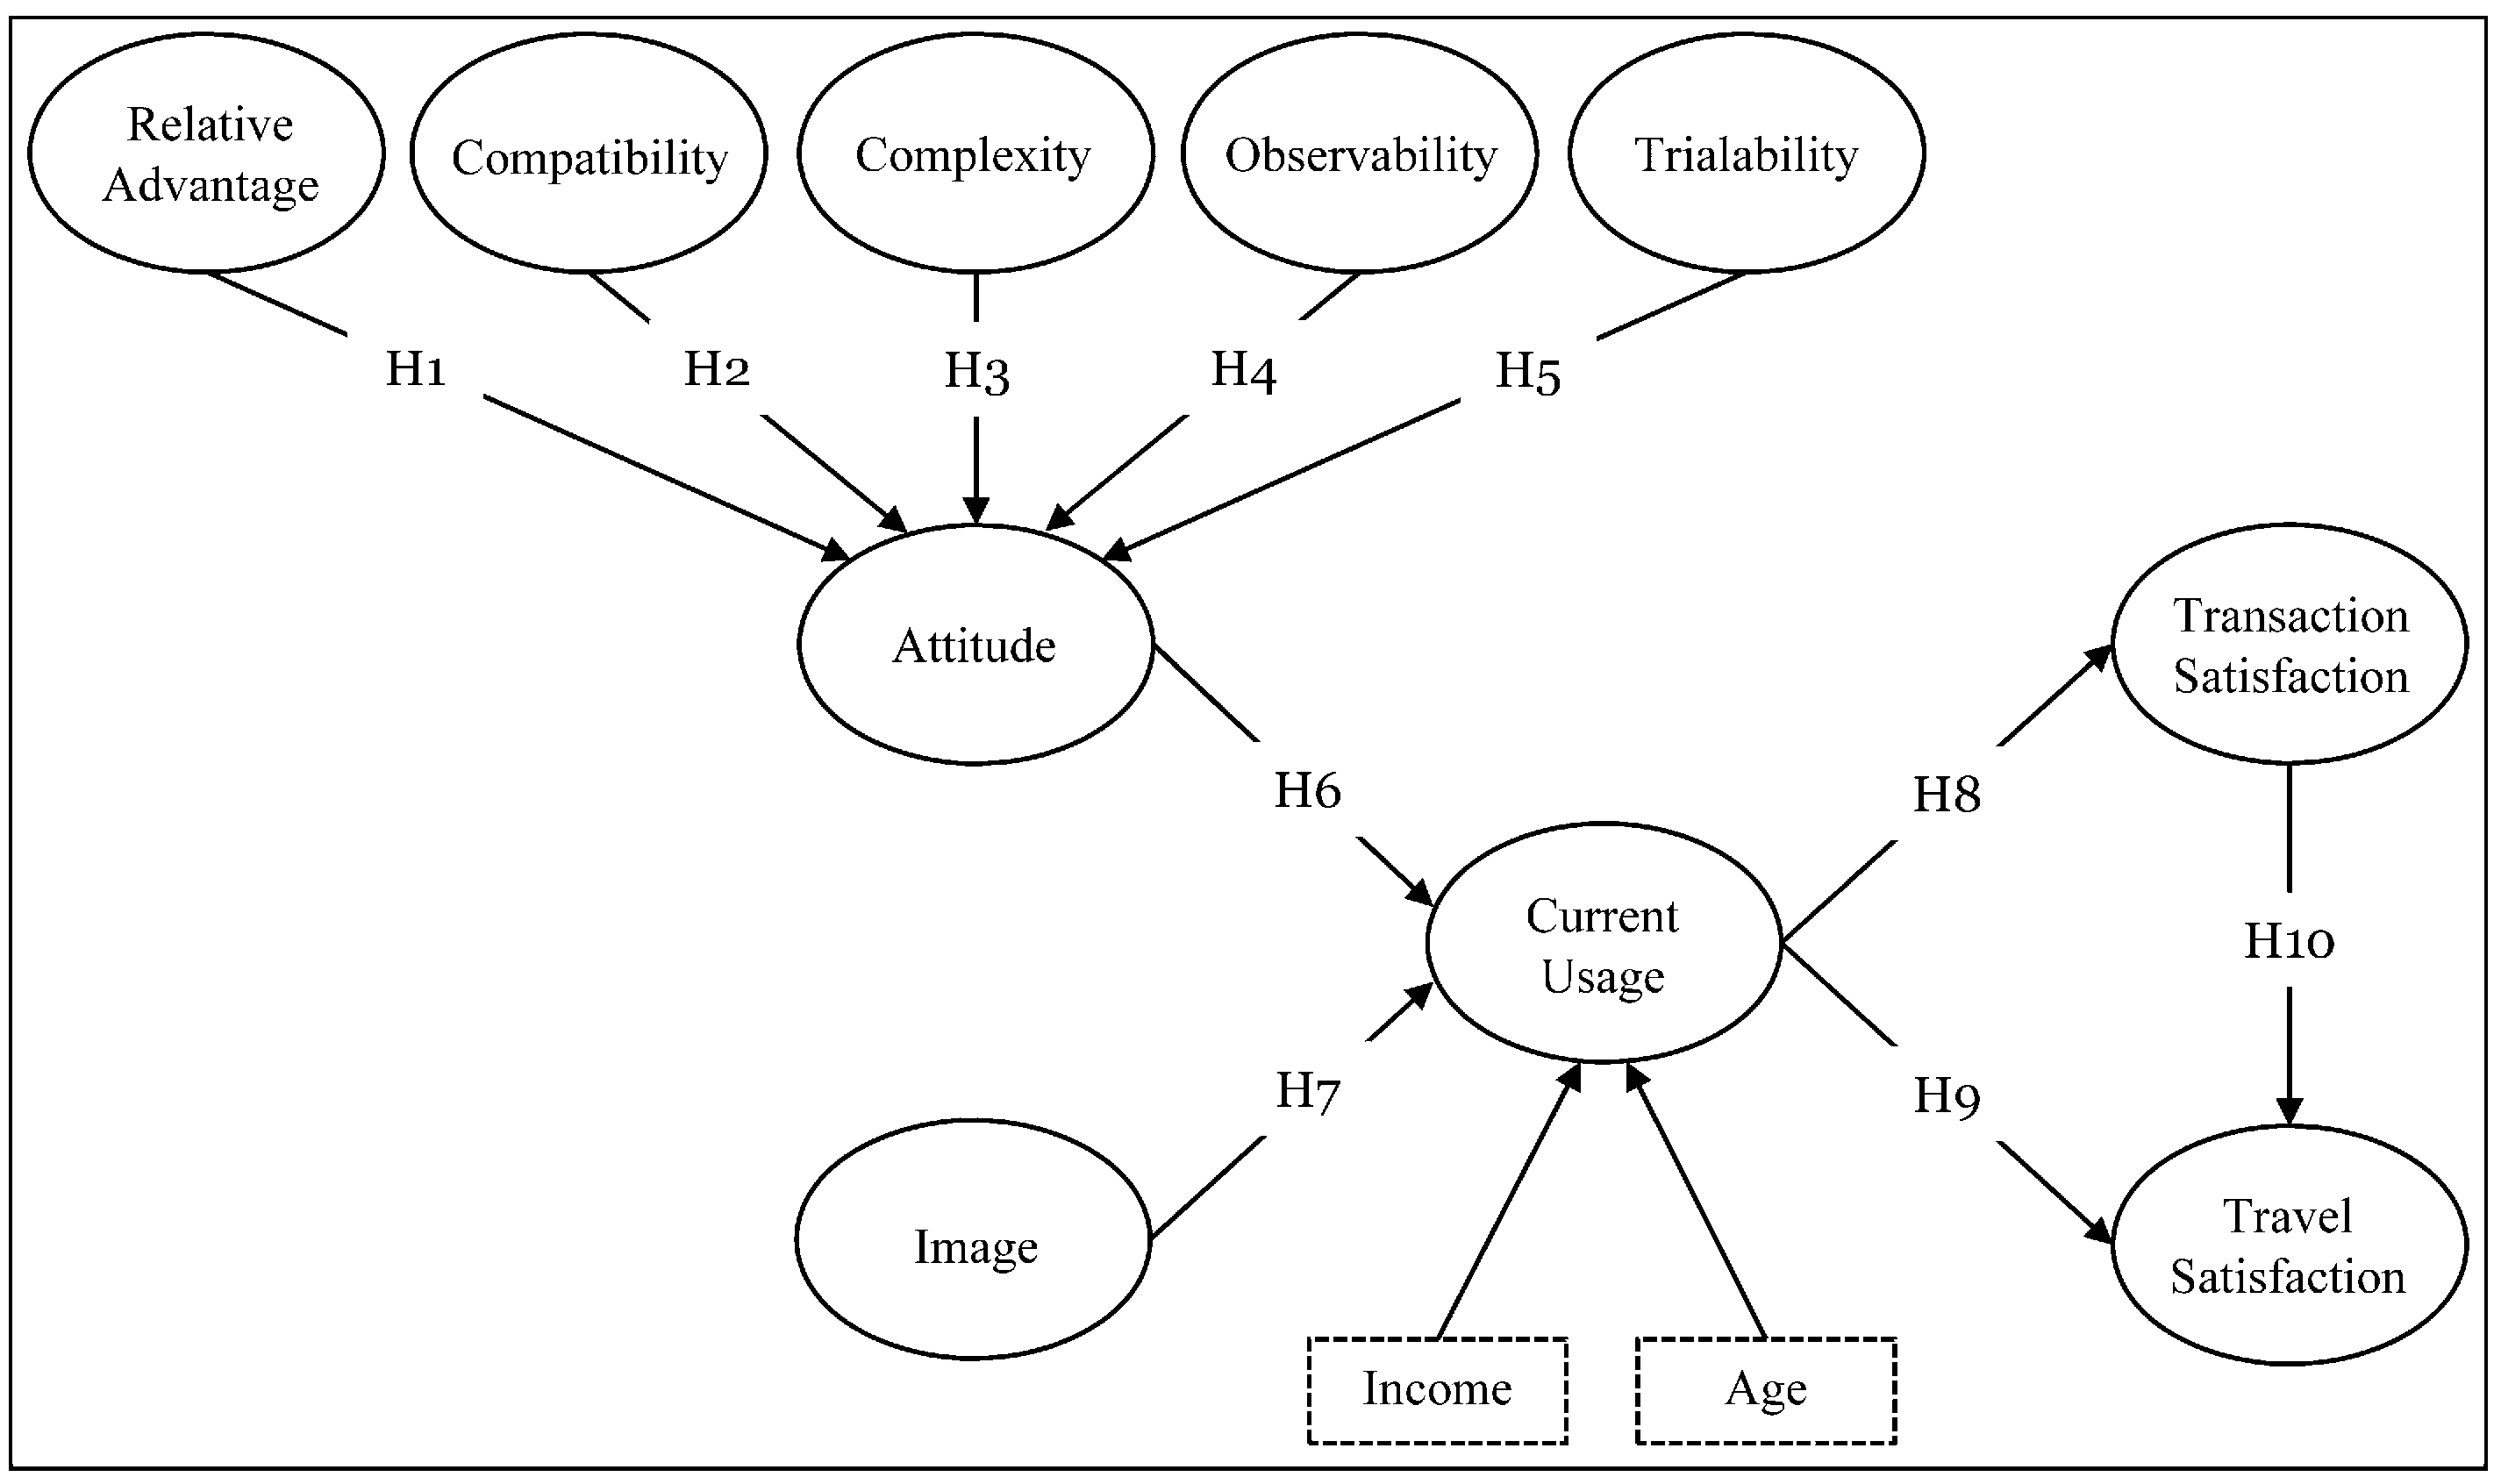
2. Theoretical Framework

2.1. Determinants of QR Code Payment Use

Diffusion of innovation theory proposes that rapid adoption of an innovation leads to its success. Consequently, the characteristics of an innovation become important determinants in its rate of adoption [12]. Rogers [12] suggested five important attributes of innovation that affect innovation diffusion. An innovation that is perceived by receivers as having greater relative advantage, compatibility, observability, and trialability, and less complexity, will be adopted more rapidly than other innovations. Rogers’ [12] definitions of these five innovation attributes are summarized in Table 1.
Moore and Benbasat [19] developed a set of general scale items to measure each primary attribute of an innovation, which substantially contributed to developing future research. Agarwal and Prasad [13] adopted Ajzen and Fishbein’s [20] TRA to posit that innovation attributes affect individuals’ acceptance of information technologies. Further, Karahanna et al. [14] confirmed that the effects of innovation attributes on information technology use greatly varied between the potential adopter group and the user group.
These innovation attributes could generally be used to explain the adoption/use of technology [12]. Therefore, this study argues that these five innovation attributes, as beliefs about outcomes of using QR payments, affect a tourist’s attitude toward using it during a trip. Relative advantage and complexity are similar to perceived usefulness and perceived ease of use, respectively, in Davis’ [21] technology acceptance model (TAM) [19]. Ryu and Murdock [22] proposed that perceived ease of use and perceived usefulness have positive effects on attitude toward using QR codes. Further, Liébana-Cabanillas et al. [23] adopted the TAM and suggested that perceived usefulness, perceived ease of use, and compatibility were important antecedents of users’ acceptance of QR code payment services. In addition, observability and trialability can affect tourists’ usage of QR code payments. According to Moore and Benbasat [19], observability refers to the idea that the results of using QR code payments can be measured, observed, and communicated to others. Thus, the observability attribute of QR code payments can lead to greater willingness to use it. The trialability attribute of innovation is helpful for reducing risk and uncertainty about using innovative technologies [14]. Since QR codes are used to conduct payments, users tend to pay more attention to financial risk. Therefore, trialability is also assumed to influence attitudes toward usage of the technology.
This study aligns with the existing literature on technology adoption to investigate whether these widely studied innovation characteristics can explain attitudes toward QR payments. That is, relative advantage, compatibility, complexity, observability, and trialability impact users’ beliefs about the outcome of using QR code payments while traveling, and lead to a positive attitude toward the technology. We hypothesize the relationships between innovation attributes and attitude as follows:
Hypothesis 1. (H1).
Relative advantage has a positive effect on attitude toward usage of QR code payments.
Hypothesis 2. (H2).
Compatibility has a positive effect on attitude toward usage of QR code payments.
Hypothesis 3. (H3).
Complexity has a positive effect on attitude toward usage of QR code payments.
Hypothesis 4. (H4).
Observability has a positive effect on attitude toward usage of QR code payments.
Hypothesis 5. (H5).
Trialability has a positive effect on attitude toward usage of QR code payments.
The TRA suggests that attitude toward behavior and subjective norms determine how an individual intends to behave, as well as actual behavior [20]. Following Ajzen and Fishbein [20], a tourist’s attitude toward QR payment use refers to the degree of his or her positive feelings about using such a service during a trip. Several studies have provided strong empirical support for the direct relationship between attitude and behavior [21,24,25]. Accordingly, based on the TRA framework, we make the following hypothesis.
Hypothesis 6. (H6).
Attitude has a positive effect on current usage of QR code payments.
Subjective norms are another antecedent of behavior (intention) [20]. In the context of technology innovation use, Moore and Benbasat [19] defined image as “the degree to which use of an innovation is perceived to enhance one’s image or status in one’s social system” (p. 195). Image describes the desire of people to acquire social approval by using new technologies, which is a separate factor influencing innovation adoption [19,26]. Carter and Bélanger [27] proposed that image could play the role of subjective norms to strengthen the use of e-government services. Furthermore, No and Kim [28] posited that social influence, which played the same role as image in innovation diffusion theory (IDT), could influence individuals’ smartphone use in travel activities. Therefore, we assume that a tourist who decides to use QR payments—the innovation—may do so to improve his or her image. Consequently, we propose the following hypothesis.
Hypothesis 7. (H7).
Image has a positive effect on current usage of QR code payments.

2.2. Outcomes of QR Code Payment Use

In the marketing field, customer satisfaction is the culmination of a series of customer experiences [29]. Marketers consistently utilize technologies to improve customers’ shopping experiences. This allows customers to obtain emotional satisfaction from their transaction [30]. For instance, self-service technologies used in supermarkets help suppliers improve their service quality, which in turn enhances customer satisfaction [31]. Buhalis and Law [18] also argued that information technology can assist in the improvement of service quality and contribute to higher tourist satisfaction.
As tourist satisfaction has a great likelihood of increasing loyalty and other relevant positive behaviors [32,33], we investigate whether technology use in tourism can enhance tourist satisfaction. Based on Olsen and Johnson [34], customer satisfaction can be divided into transaction-specific and cumulative satisfaction. Transaction-specific satisfaction refers to one’s positive evaluation of his or her experience with, and in reaction to, a product, transaction, or service encounter. Cumulative satisfaction refers to one’s overall positive evaluation of a product or service provider resulting from his or her entire experience with the provider over time. Thus, the former is also called encounter satisfaction, and the latter is interchangeable with overall satisfaction, with transaction-specific satisfaction proposed as an antecedent to overall satisfaction [35].
Following these two different conceptualizations of customer satisfaction, Gao and Lai [33] revealed that tourist satisfaction is more appropriately divided into transaction-specific and overall satisfaction, because a travel destination is comprised of complex providers of a range of services and products. Based on prior studies, in this study we refer to transaction-specific satisfaction as transaction satisfaction that captures a traveler’s evaluation of his or her positive experiences with every product or service transaction fulfilled using QR payments. Furthermore, travel satisfaction is defined as the overall satisfaction capturing a traveler’s overall evaluation of his or her entire travel experience.
According to transaction cost theory [36], consumers encounter two major problems when they make purchase decisions: budget and time constraints. Furthermore, consumers tend to maximize transaction utility and avoid further costs in terms of money and time [36]. Thus, decision support systems (DSS) that enable consumers to make an ideal purchasing decision, while optimizing costs and time, have the potential to improve customer satisfaction [36,37,38]. The consumer decision-making process includes problem recognition, information search, alternative evaluation, purchase, and post-purchase stages [39]. QR payments that help travelers quickly accomplish payments play a role in the purchase stage. Thus, based on Kohli et al. [36], QR code payment services can help save time, which in turn enhances tourist satisfaction. Accordingly, we first suggest that QR payments could enhance a tourist’s transaction satisfaction.
Hypothesis 8. (H8).
Current usage of QR code payments has a positive effect on transaction satisfaction.
Furthermore, technologies help organizations improve their service quality, which enhances overall customer satisfaction [18,31,40]. In addition, since QR payments allow people to avoid additional inconvenience, they can help optimize tourist travel experiences. Thus, we further anticipate that use of such payments can improve overall travel satisfaction.
Hypothesis 9. (H9).
Current usage of QR code payments has a positive effect on travel satisfaction.
In the tourism industry, a famous destination provides multi-dimensional tourism attractions, and, therefore, transaction-specific satisfaction captures the satisfaction with food and beverage services, hotels, casinos, and shopping malls. Therefore, a specific transaction experience, such as hotel booking, is a part of the overall travel experience that contributes to overall travel satisfaction [33]. Essentially, all occurrences of transaction-specific satisfaction consequently influence overall travel satisfaction. Hence, we arrive at our final hypothesis.
Hypothesis 10. (H10).
Transaction satisfaction has a positive effect on travel satisfaction.
This study investigates the effects of the innovation attributes of QR code payment services on individuals’ adoptions in the context of tourism, which consequently enhances their transaction and travel satisfaction. Figure 1 depicts the research model. Since previous research has suggested that individual factors are likely to influence innovation diffusion [12,15], this study implements controls for them. Furthermore, Shankar and Balasubramanian [41] posited that mobile technologies-integrated marketing appears to work better for some customer demographics (e.g., young adults and individuals with higher incomes) than for others. Therefore, income and age factors are included in our research model.

3. Methodology

3.1. Measurement

We adopted and modified previously validated measures for research variables with multiple items based on a seven-point Likert scale (1 = strongly disagree, 7 = strongly agree). Appendix A shows the detailed items for each of the constructs and the related sources of measurements. The statistics of mean and standard deviation of each construct are also displayed in Appendix A.

3.2. Data Collection

We conducted a field study in May 2017, where the unit of analysis was the individual (tourist) who used QR payments during his or her trip. For data collection, we visited famous destinations in Tianjin and Henan Provinces of China. Questionnaires were distributed in the destinations at locations like hotels, restaurants, resting houses, and cafés. We identified tourists with time to spare and a history of QR payment use. Once we introduced our research purpose, we asked them to participate in our survey in return for rewards, such as chocolates and ballpoint pens. In total, 249 field surveys were collected in approximately one month. Two responses were incomplete; hence, 247 fully answered responses were used for the final analysis. The demographic information of the samples is shown in Table 2.

4. Results

The partial least squares (PLS) method was used for the analysis in this study. PLS path modeling is a component-based approach to estimation. Thus, this technique places minimal demands on sample size to validate a complex research model [42]. Therefore, this study utilized the PLS structural equation modeling to estimate the measurement and the structural model.

4.1. Reliability and Validity

We ran Smart PLS 3.0 to conduct confirmatory factor analysis (CFA) for the examination of reliability and validity. The reliability and convergent validity results are shown in Table 3. Regarding reliability, the values of Cronbach’s alpha and composite reliability (CR) for all constructs were higher than the threshold value of 0.7, which indicates highly acceptable internal consistency and scale reliability [43,44]. Regarding convergent validity, the standardized factor loadings of indicators for each construct were significant and greater than 0.7. Meanwhile, the values of CR were higher than 0.7, and the values of average variance extracted (AVE) for all the constructs exceeded the recommended minimum of 0.5, which shows a strong convergent validity [43,44].
To check discriminant validity, we compared the square root of AVE for each construct with the inter-construct correlation estimates by referring to Fornell and Larcker’s [43] study. Table 4 shows the square roots of AVE (the diagonal elements in bold) for constructs and construct correlation estimates. Each square root of AVE was found to be greater than its corresponding row and column elements, indicating strong discriminant validity.
In addition, since some independent variables show relatively high correlations, potential multicollinearity needs to be checked. According to Tabachnick and Fidell [45], we checked the variable inflation factor (VIF) values for antecedent variables, and the results showed that VIF values did not exceed the threshold value of 10.0, indicating no problem in multicollinearity.

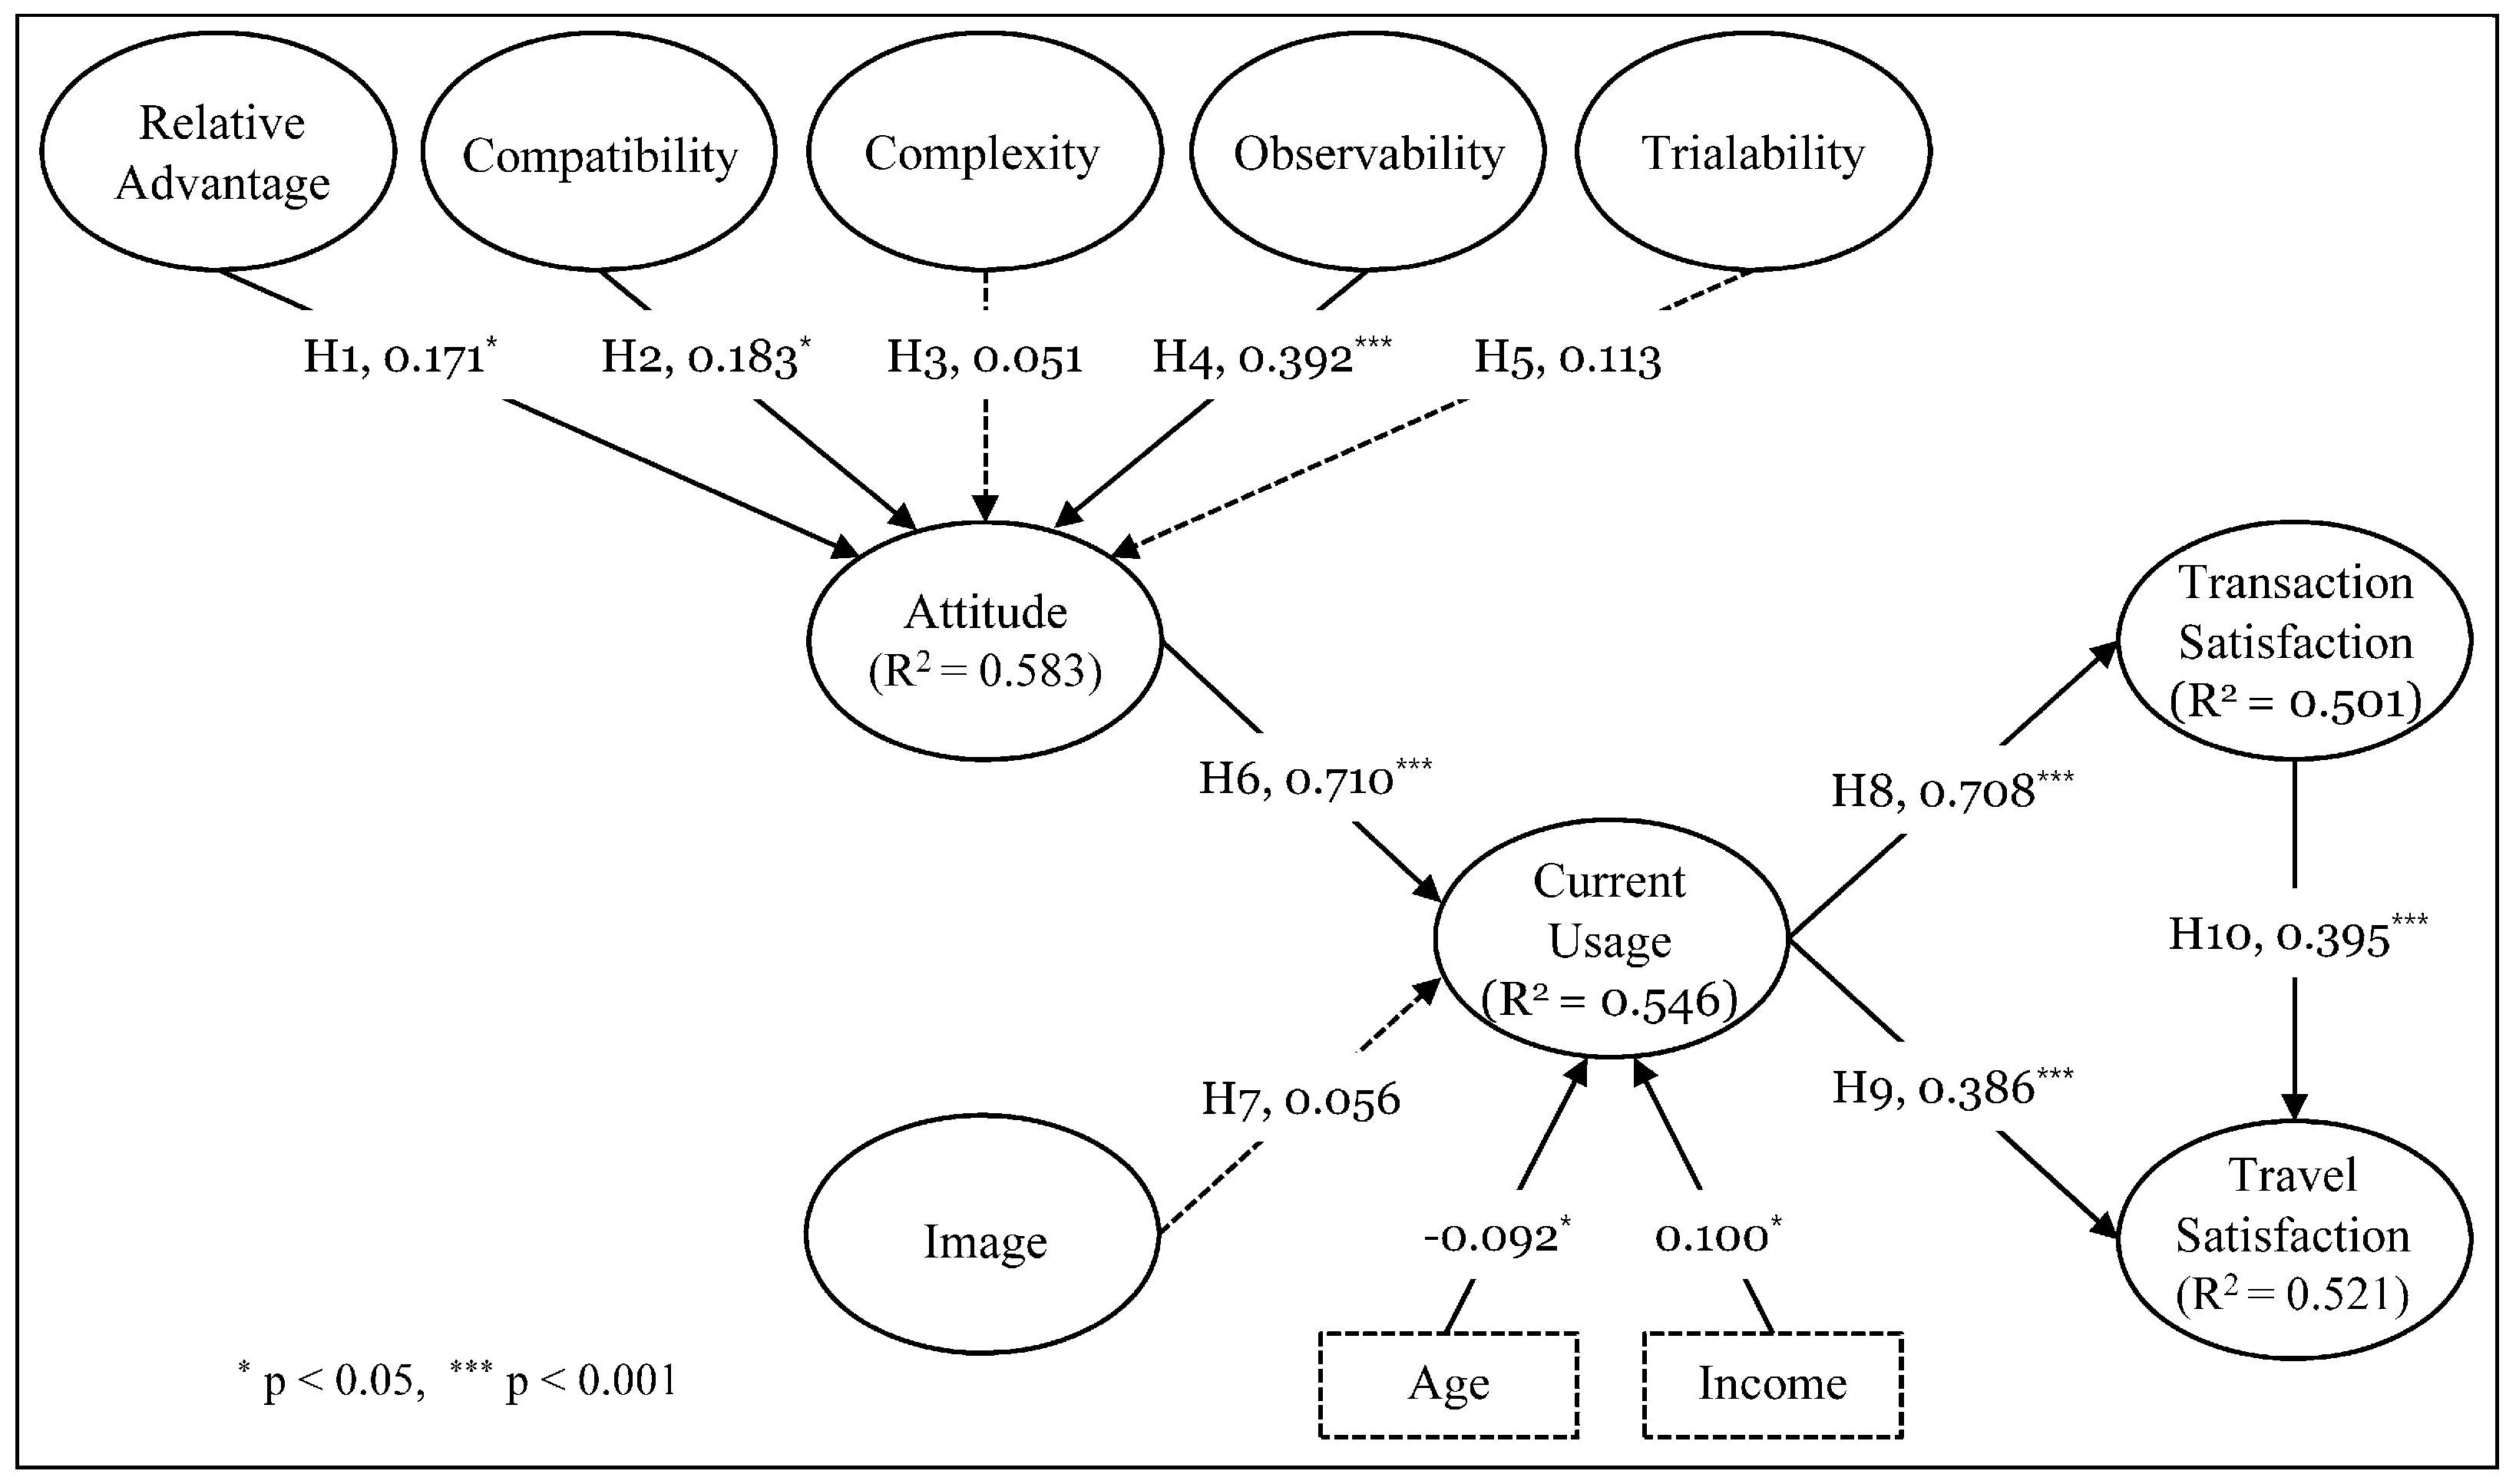
4.2. Hypotheses Test

We used Smart PLS 3.0 to perform a path analysis and test the research hypotheses. Figure 2 depicts the hypotheses test results. First, among five innovation attributes, relative advantage, compatibility, and observability had positive effects on attitude toward QR payments (β = 0.171, p < 0.05; β = 0.183, p < 0.05; β = 0.392, p < 0.001, respectively). This supports H1, H2, and H4. However, complexity and trialability attributes had no effect on attitude (β = 0.051, p > 0.05; β = 0.113, p > 0.05, respectively). Thus, H3 and H5 were not supported.
Second, attitude toward QR payments had a positive effect on current usage (β = 0.710, p < 0.001), whereas image had no effect on current usage (β = 0.056, p > 0.05). Therefore, H6 was supported and H7 was not supported. In addition, control variables—namely, age, and income—were confirmed to have significant effects on current usage of such payments. That is, the age of the user had a negative effect on usage, while income had a positive effect on usage.
Finally, current usage of QR payments had a positive effect on transaction satisfaction and travel satisfaction (β = 0.708, p < 0.001; β = 0.386, p < 0.001, respectively). This suggests both H8 and H9 are supported. Furthermore, transaction satisfaction had a positive effect on travel satisfaction (β = 0.395, p < 0.001), which supports H10.

5. Discussion

Mobile QR payment technology is an innovation that allows quick payment compared with other payment solutions. This study emphasized its efficacy in the context of tourism. The results show that relative advantage, compatibility, and observability lead to users’ positive attitudes toward using QR code payments in tourism, compared with factors—complexity and trialability—that did not have an effect. These findings are somewhat consistent with existing literature on innovation diffusion and technology acceptance, in that not all innovation attributes were significant determinants of technology acceptance/usage [14,23,27]. Although technology adoption is primarily determined by innovation attributes [12,19], such effects may vary depending on the individual and contextual factors. Thus, in addition to the significant relationships, the unexpected results are interesting to assess for their valuable implications. Further, regarding the outcome of using QR code payments in the context of tourism, the results indicate that current usage of QR code payments can not only increase transaction satisfaction but also enhance travel satisfaction as a whole, confirming that technologies integrated with tourism could affect tourist satisfaction in terms of transaction-specific satisfaction and integrated satisfaction [33].
Based on the findings of this study, we have both academic and practical implications for understanding and developing innovative technologies integrated with tourism.

5.1. Implications for Research

On the academic side, first, we applied Rogers’ [12] diffusion of innovation theory to explain the effects of innovation characteristics on an individual’s QR payments use, using the TRA to provide the theoretical foundation. Among these characteristics, complexity (i.e., ease of use), and trialability are confirmed to have no effect on attitude toward use. These interesting findings are the same as the Karahanna et al. [14] study, in which ease of use and trialability did not affect attitude toward technology usage in the technology user group, whereas they had significant effects on attitude toward technology use in the potential adopter group. In terms of complexity, based on Karahanna et al. [14], ease of use issues are resolved and displaced by other instruments, since QR payment users have sufficient experience of this innovation after adoption. On the other hand, trialability of QR payments played a role in reducing risk and uncertainty of expected outcomes only in the pre-adoption condition rather than in the current and continued use conditions [14]. In other words, factors such as perceived risk may not affect QR code payments use in the context of tourism, since the trust-building process has already taken place through users frequently interacting with QR code payments. These findings imply that Rogers’ [12] five innovation attributes may work differently across time or cultures.
Second, we proposed that tourist satisfaction included both transaction-specific satisfaction and overall travel satisfaction, based on existing customer satisfaction research [33,34]. Research findings indicate that QR payments can enhance both types of tourist satisfaction by influencing the action stage of tourists’ decision-making processes, acting as a type of decision support system. In other words, the findings of this study imply that consumer-technology interactions can affect customer satisfaction even in the context of tourism.
Third, advanced technologies used in tourism ultimately aim for facilitating an enjoyable travel experience [5,46]. This study used empirical evidence to reveal that QR code payment solutions play a role in enhancing tourists’ supporting experiences, namely, daily experiences that enhance the entire tourist experience [11]. Thus, this study extends the existing research on tourist experiences in two aspects. First, this study confirmed the importance of supporting experiences that have been relatively rarely examined in prior research. Second, this study further revealed that the usage of innovative technologies could enhance supporting experiences (i.e., transaction satisfaction).
Finally, the analysis of control variables (i.e., age and income) provides evidence that, although the TRA provides the underlying structure for the theoretical model that evaluates which components of the innovation determine its diffusion, we need to also consider important individual and demographical factors to predict individuals’ technology use behavior.

5.2. Implications for Practice

This study also has important practical implications for tourism management. First, product or service providers embrace mobile technologies as effective and efficient marketing channels to influence consumers’ decision-making [41]. This study implies that the tourism and hospitality industry can utilize mobile payment technology to facilitate the consumption process and increase customer reach and long-term revenue by enhancing tourist satisfaction. To promote business performance, these industries must implement business strategies that are integrated with mobile technologies. For example, tourism product and service providers should keep up with the diffusion of innovation by actively adopting and utilizing Alipay and WeChat Pay to increase tourist satisfaction, which creates a loyal customer base, encouraging positive word-of-mouth regarding travel destinations.
Second, the adoption and integration of technology is a precondition for technology-enhanced tourism experiences [9,10,17]. This study indicates that observability, compatibility, and relative advantage determine a traveler’s usage of QR code payment technology. Thus, mobile payment service providers (i.e., Alibaba and Tencent) could collaborate with destination marketing organizations, firms, and tourism service suppliers to emphasize the relevant attributes and introduce well-designed mobile payment solutions to customers. More importantly, following Garau [47], as users and QR code payment service providers are well-connected via virtual communities, Alibaba and Tencent have the opportunity to build and develop a strong bond with users. The feedback obtained from users can help them continuously improve solutions.
Finally, a successful innovation is also a consumer-centric innovation that should achieve both productivity and accuracy of innovation [48]. This study reveals that QR code payment services that emphasize consumer-centric thinking could enhance transaction and travel satisfaction, which could then attract more tourists and accelerate the regional tourism economy. In sum, emerging information technologies, such as new mobile tools and services, could promote and boost the development and quality of the tourism industry.

5.3. Limitations and Future Research Directions

This study has some limitations. First, the sample size used for this study is relatively small due to time and economic limitations involved in conducting field surveys. Furthermore, since data collection is restricted to one country, the findings cannot be generalized to other regions. Thus, future research should endeavor to collect more data and conduct cross-cultural examinations to enable such generalization.
Meanwhile, regarding innovation diffusion, as Claudy et al. [49] argued, consumer behavior frameworks have largely failed to distinctly account for reasons against adoption. Our study only emphasized the effects of positive aspects of innovation—innovation attributes toward consumers’ QR payment use. Negative aspects of information and communication technology-related factors—for example, technostress and privacy invasion—must also be considered to provide solutions for the development of new technology-enabled tourism.
Third, in the information systems (IS) research domain, there are many well-known theories—such as the TAM [21] or IS success model [50]—that can explain the use of technology. Therefore, future research that applies these models to predict innovative technologies in tourism and compares it with the IDT, used in this study, would be beneficial for researchers and practitioners.
Finally, Gretzel et al. [5] proposed that smart technologies generally refer to advanced technologies that are utilized to optimize resources and promote performance with respect to developing tourism. This study focused the use QR code payments in tourism, and tested their ability to enhance tourist satisfaction. We argue that, because we employed a kind of mobile technology to reveal how advanced technologies might be used to promote tourism, this study cannot easily be generalized. For future research direction, we suggest two ways to improve generalization. One way is to examine the effect of QR code payments on outcomes and performance in other industries (i.e., retailing), which would be an extension of the application of the technology. The other way is to investigate the roles of other innovative technologies, such as near field communications (NFC) technology, in tourism.

6. Conclusions

Tourism has become one of the fastest growing sectors with the potential in most countries to promote economic growth. Undoubtedly, modern tourism is highly dependent on information and communication technologies (ICTs). To understand the impacts of new technologies on tourism development, this study investigated how the innovation attributes of QR code payment services (i.e., relative advantage, compatibility, complexity, observability, and trialability) influenced individuals’ adoptions of the services, and whether such adoptions could enhance their transaction-specific and travel satisfaction in the tourism context. An empirical analysis of 247 tourists found that relative advantage, compatibility, and observability had positive effects on users’ attitudes toward using QR code payments, which resulted in their use of the technology while traveling. Further, we validated that current usage of QR code payments could increase both transaction-specific satisfaction and travel satisfaction of tourists. By providing empirical evidence regarding the effects of a type of new technology, namely, mobile QR code payments, on tourist satisfaction, the current study contributes to a richer understanding of how innovative technology solutions promote tourism. The tourism and hospitality industry should leverage these technologies to attract and satisfy travelers, which consequently facilitates sustainable development.
Tourism has become more widespread in China, where consumers need to make frequent payments while traveling. Given this phenomenon, this study highlights the importance of QR code payments in tourism, being the first empirical research on the performance of mobile quick payment systems feasible for travel. It is noteworthy that this study indicates that the popular QR code payments can serve as a type of decision support system for tourists.
We put forward some suggestions for future work. In the real world, there are many useful ICTs integrated with tourism, such as smart phones, block chains, social networking services, location-based services, NFC technologies, and even artificial intelligence. Considering these different technologies can play a role in supporting tourists during different phases of their decision-making processes [51], future research can classify technologies used in tourism based on their applications. Moreover, it would be worth exploring how these technologies can be utilized during each stage of tourists’ decision-making to enhance their performance while traveling. Through these studies, academic researchers and practitioners can get a broader view of tourism management, which would contribute to a richer understanding of how ICTs can satisfy tourists, advancing the tourism and hospitality industry.

Author Contributions

Liguo Lou and Joon Koh conceived and designed the survey; Zilu Tian collected the data for the survey; Liguo Lou analyzed the data; and Liguo Lou and Joon Koh wrote the paper.

Conflicts of Interest

The authors declare no conflicts of interest.

Appendix A. Questionnaire Items

Relative advantage measurements were adapted from Karahanna et al. [14], Lin [16], and Moore and Benbasat [19]. (Mean = 6.507, S.D. = 1.057)
  • Using a QR code payment enables me to accomplish payment more quickly.
  • Using a QR code payment allows me to conduct payment more efficiently.
  • Using a QR code payment makes it easier to conduct payment.
  • Using a QR code payment is more useful for conducting payment.
Compatibility measurements were adapted from Karahanna et al. [14], Lin [16], and Moore and Benbasat [19]. (Mean = 6.150, S.D. = 1.224)
  • QR code payment is compatible with my lifestyle.
  • Using QR code payments fits well with the way I like to conduct payments.
  • Using a QR code payment to conduct payment fits into my consumption style.
Complexity (ease of use) measurements were adapted from Karahanna et al. [14], Lin [16], and Moore and Benbasat [19]. (Mean = 6.444, S.D. = 1.147)
  • It is easy to get a QR code payment to accomplish payment.
  • Overall, I think that a QR code payment is easy to use.
  • Learning to operate a QR code payment is easy for me.
Observability measurements were adapted from Karahanna et al. [14] and Moore and Benbasat [19]. (Mean = 6.054, S.D. = 1.287)
  • I have no difficulty telling others about the results of using a QR code payment.
  • I could communicate to others the consequences of using a QR code payment.
  • The results of using a QR code payment are apparent to me.
Trialability measurements were adapted from Karahanna et al. [14] and Moore and Benbasat [19]. (Mean = 5.474, S.D. = 1.526)
  • Before deciding on whether or not to adopt a QR code payment, I would be able to use it on a trial basis.
  • Before deciding on whether or not to adopt a QR code payment, I would be able to properly try it out.
  • I would be permitted to use a QR code payment on a trial basis long enough to see what it can do.
Attitude toward using a QR code payment measurements were adapted from Karahanna et al. [14]. (Mean = 6.049, S.D. = 1.207)
All things considered, using the QR code payment during my trip is
  • extremely negative … extremely positive
  • extremely bad … extremely good
  • extremely harmful … extremely beneficial
Image measurements were adapted from Karahanna et al. [14] and Moore and Benbasat [19]. (Mean = 4.149, S.D. = 1.895)
  • Using a QR code payment improves my image.
  • Using a QR code payment gives me high status.
  • Using a QR code payment makes me have more prestige than those who do not.
  • Having a QR payment is a status symbol.
Current usage of QR code payment measurements were adapted from Agarwal and Prasad [13]. (Mean = 5.998, S.D. = 1.348)
  • I use QR code payments a lot during my trip.
  • I use QR code payments whenever possible during my trip.
  • I use QR code payments frequently during my trip.
  • I use QR code payments whenever appropriate to conduct payment during my trip.
Transaction satisfaction measurements were adapted from Zhao et al. [40]. (Mean = 5.825, S.D. = 1.357)
  • I feel satisfied with consumption experiences when using QR code payments during my trip.
  • I have good consumption experiences when using QR code payments during my trip.
  • I am satisfied with my decision to use QR code payments to pay during my trip.
Travel satisfaction measurements were adapted from Kim et al. [52]. (Mean = 6.119, S.D. = 1.172)
  • My overall evaluation on this trip experience is positive.
  • My overall evaluation on this trip experience is favorable.
  • I am satisfied with this tourism experience.
  • I am pleased with this tourism experience.

References

  1. Canadi, M.; Höpken, W.; Fuchs, M. Application of QR codes in online travel distribution. Inf. Commun. Technol. Tour. 2010, 137–148. [Google Scholar]
  2. Aktaş, C. The Evolution and Emergence of QR Codes; Cambridge Scholars Publishing: Newcastle, UK, 2017. [Google Scholar]
  3. eMarketer. China Boasts World’s Largest Proximity Mobile Payments Market. 7 June 2016. Available online: https://www.emarketer.com/article/china-boasts-worlds-largest-proximity-mobile-payments-market/1014053 (accessed on 1 May 2017).
  4. Wang, D.; Xiang, Z.; Fesenmaier, D.R. Adapting to the mobile world: A model of smartphone use. Ann. Tour. Res. 2014, 48, 11–26. [Google Scholar] [CrossRef]
  5. Gretzel, U.; Sigala, M.; Xiang, Z.; Koo, C. Smart tourism: Foundations and developments. Electron. Mark. 2015, 25, 179–188. [Google Scholar] [CrossRef]
  6. Neuhofer, B.; Buhalis, D.; Ladkin, A. Smart technologies for personalized experiences: A case study in the hospitality domain. Electron. Mark. 2015, 25, 243–254. [Google Scholar] [CrossRef]
  7. Chung, N.; Tyan, I.; Han, H. Enhancing the smart tourism experience through geotag. Inf. Syst. Front. 2016, 14, 1–12. [Google Scholar] [CrossRef]
  8. Zheng, W.; Huang, X.; Li, Y. Understanding the tourist mobility using GPS: Where is the next place? Tour. Manag. 2017, 59, 267–280. [Google Scholar] [CrossRef]
  9. Gretzel, U.; Werthner, H.; Koo, C.; Lamsfus, C. Conceptual foundations for understanding smart tourism ecosystems. Comput. Hum. Behav. 2015, 50, 558–563. [Google Scholar] [CrossRef]
  10. Hunter, W.C.; Chung, N.; Gretzel, U.; Koo, C. Constructivist research in smart tourism. Asia Pac. J. Inf. Syst. 2015, 25, 105–120. [Google Scholar]
  11. Quan, S.; Wang, N. Towards a structural model of the tourist experience: An illustration from food experiences in tourism. Tour. Manag. 2004, 25, 297–305. [Google Scholar] [CrossRef]
  12. Rogers, E.M. Diffusion of Innovations; The Free Press: New York, NY, USA, 1983. [Google Scholar]
  13. Agarwal, R.; Prasad, J. The role of innovation characteristics and perceived voluntariness in the acceptance of information technologies. Decis. Sci. 1997, 28, 557–582. [Google Scholar] [CrossRef]
  14. Karahanna, E.; Straub, D.W.; Chervany, N.L. Information technology adoption across time: A cross-sectional comparison of pre-adoption and post-adoption beliefs. MIS Q. 1999, 23, 183–213. [Google Scholar] [CrossRef]
  15. Mustonen-Ollila, E.; Lyytinen, K. Why organizations adopt information system process innovations: A longitudinal study using diffusion of innovation theory. Inf. Syst. J. 2003, 13, 275–297. [Google Scholar] [CrossRef]
  16. Lin, H.-F. An empirical investigation of mobile banking adoption: The effect of innovation attributes and knowledge-based trust. Int. J. Inf. Manag. 2011, 31, 252–260. [Google Scholar] [CrossRef]
  17. Neuhofer, B.; Buhalis, D.; Ladkin, A. A typology of technology-enhanced tourism experiences. Int. J. Tour. Res. 2014, 16, 340–350. [Google Scholar] [CrossRef]
  18. Buhalis, D.; Law, R. Progress in information technology and tourism management: 20 years on and 10 years after the internet—The state of etourism research. Tour. Manag. 2008, 29, 609–623. [Google Scholar] [CrossRef]
  19. Moore, G.C.; Benbasat, I. Development of an instrument to measure the perceptions of adopting an information technology innovation. Inf. Syst. Res. 1991, 2, 192–222. [Google Scholar] [CrossRef]
  20. Ajzen, I.; Fishbein, M. Understanding Attitudes and Predicting Social Behaviour; Prentice-Hall: Englewood Cliffs, NJ, USA, 1980. [Google Scholar]
  21. Davis, F.D. Perceived usefulness, perceived ease of use, and user acceptance of information technology. MIS Q. 1989, 13, 319–340. [Google Scholar] [CrossRef]
  22. Ryu, J.S.; Murdock, K. Consumer acceptance of mobile marketing communications using the QR code. J. Direct Data Digit. Mark. Pract. 2013, 15, 111–124. [Google Scholar]
  23. Liébana-Cabanillas, F.; Ramos de Luna, I.; Montoro-Ríos, F.J. User behaviour in QR mobile payment system: The QR payment acceptance model. Technol. Anal. Strateg. Manag. 2015, 27, 1031–1049. [Google Scholar] [CrossRef]
  24. Beatty, S.E.; Kahle, L.R. Alternative hierarchies of the attitude-behavior relationship: The impact of brand commitment and habit. J. Acad. Mark. Sci. 1988, 16, 1–10. [Google Scholar] [CrossRef]
  25. Bhattacherjee, A.; Sanford, C. Influence processes for information technology acceptance: An elaboration likelihood model. MIS Q. 2006, 30, 805–825. [Google Scholar]
  26. Tornatzky, L.G.; Klein, K.J. Innovation characteristics and innovation adoption-implementation: A meta-analysis of findings. IEEE Trans. Eng. Manag. 1982, 29, 28–45. [Google Scholar] [CrossRef]
  27. Carter, L.; Bélanger, F. The utilization of e-government services: Citizen trust, innovation and acceptance factors. Inf. Syst. J. 2005, 15, 5–25. [Google Scholar] [CrossRef]
  28. No, E.; Kim, J.K. Determinants of the adoption for travel information on smartphone. Int. J. Tour. Res. 2014, 16, 534–545. [Google Scholar] [CrossRef]
  29. Meyer, C.; Schwager, A. Understanding customer experience. Harv. Bus. Rev. 2007, 85, 116–126. [Google Scholar] [PubMed]
  30. Holbrook, M.B.; Hirschman, E.C. The experiential aspects of consumption: Consumer fantasies, feelings, and fun. J. Consum. Res. 1982, 9, 132–140. [Google Scholar] [CrossRef]
  31. Orel, F.D.; Kara, A. Supermarket self-checkout service quality, customer satisfaction, and loyalty: Empirical evidence from an emerging market. J. Retail. Consum. Serv. 2014, 21, 118–129. [Google Scholar] [CrossRef]
  32. Chi, C.G.-Q.; Qu, H. Examining the structural relationships of destination image, tourist satisfaction and destination loyalty: An integrated approach. Tour. Manag. 2008, 29, 624–636. [Google Scholar] [CrossRef]
  33. Gao, B.W.; Lai, I.K.W. The effects of transaction-specific satisfactions and integrated satisfaction on customer loyalty. Int. J. Hosp. Manag. 2015, 44, 38–47. [Google Scholar]
  34. Olsen, L.L.; Johnson, M.D. Service equity, satisfaction, and loyalty: From transaction-specific to cumulative evaluations. J. Serv. Res. 2003, 5, 184–195. [Google Scholar] [CrossRef]
  35. Jones, M.A.; Suh, J. Transaction-specific satisfaction and overall satisfaction: An empirical analysis. J. Serv. Mark. 2000, 14, 147–159. [Google Scholar] [CrossRef]
  36. Kohli, R.; Devaraj, S.; Mahmood, M.A. Understanding determinants of online consumer satisfaction: A decision process perspective. J. Manag. Inf. Syst. 2004, 21, 115–136. [Google Scholar] [CrossRef]
  37. Sharda, R.; Barr, S.H.; McDonnell, J.C. Decision support system effectiveness: A review and an empirical test. Manag. Sci. 1988, 34, 139–159. [Google Scholar] [CrossRef]
  38. Forgionne, G.A.; Kohli, R. HMSS: A management support system for concurrent hospital decision making. Decis. Support Syst. 1996, 16, 209–229. [Google Scholar] [CrossRef]
  39. Engel, J.; Kollat, D.T.; Blackwell, R.D. Consumer Behavior; Dryden Press: New York, NY, USA, 1978. [Google Scholar]
  40. Zhao, L.; Lu, Y.; Zhang, L.; Chau, P.Y.K. Assessing the effects of service quality and justice on customer satisfaction and the continuance intention of mobile value-added services: An empirical test of a multidimensional model. Decis. Support Syst. 2012, 52, 645–656. [Google Scholar] [CrossRef]
  41. Shankar, V.; Balasubramanian, S. Mobile marketing: A synthesis and prognosis. J. Interact. Mark. 2009, 23, 118–129. [Google Scholar] [CrossRef]
  42. Chin, W.W.; Peterson, R.A.; Brown, S.P. Structural equation modeling in marketing: Some practical reminders. J. Market. Theory Pract. 2008, 16, 287–298. [Google Scholar] [CrossRef]
  43. Fornell, C.; Larcker, D.F. Structural equation models with unobservable variables and measurement error: Algebra and statistics. J. Mark. Res. 1981, 18, 382–388. [Google Scholar] [CrossRef]
  44. Gefen, D.; Straub, D.; Boudreau, M.-C. Structural equation modeling and regression: Guidelines for research practice. Commun. AIS 2000, 4, 2–76. [Google Scholar]
  45. Tabachnick, B.G.; Fidell, L.S. Using Multivariate Statistics; Harper Collins: New York, NY, USA, 1996. [Google Scholar]
  46. Gretzel, U. Intelligent systems in tourism: A social science perspective. Ann. Tour. Res. 2011, 38, 757–779. [Google Scholar] [CrossRef]
  47. Garau, C. Smart paths for advanced management of cultural heritage. Reg. Stud. Reg. Sci. 2014, 1, 286–293. [Google Scholar] [CrossRef]
  48. Choy, M.; Park, G. Sustaining innovative success: A case study on consumer-centric innovation in the ict industry. Sustainability 2016, 8, 986. [Google Scholar] [CrossRef]
  49. Claudy, M.C.; Garcia, R.; O’Driscoll, A. consumer resistance to innovation—a behavioral reasoning perspective. J. Acad. Mark. Sci. 2015, 43, 528–544. [Google Scholar] [CrossRef]
  50. DeLone, W.H.; McLean, E.R. Information systems success: The quest for the dependent variable. Inf. Syst. Res. 1992, 3, 60–95. [Google Scholar] [CrossRef]
  51. Koo, C.; Yoo, K.-H.; Lee, J.-N.; Zanker, M. Special section on generative smart tourism systems and management: Man–machine interaction. Int. J. Inf. Manag. 2016, 6, 1301–1305. [Google Scholar] [CrossRef]
  52. Kim, H.; Woo, E.; Uysal, M. Tourism experience and quality of life among elderly tourists. Tour. Manag. 2015, 46, 465–476. [Google Scholar] [CrossRef]
Figure 1. Research model.
Sustainability 09 01186 g001
Figure 2. Hypotheses test results.
Sustainability 09 01186 g002
Table 1. Definitions of each innovation attribute.
AttributesDefinitions
Relative advantageThe degree to which an innovation is perceived as being better than the idea it supersedes.
CompatibilityThe degree to which an innovation is perceived as being consistent with existing values, past experiences, and needs of potential adopters.
Complexity aThe degree to which an innovation is perceived as being difficult to understand and use.
ObservabilityThe degree to which the results of using an innovation are observable and communicable to others.
TrialabilityThe degree to which an innovation may be experimented with on a limited basis before adoption.
Note: a Complexity was also termed ease of use in follow-up studies.
Table 2. Demographics of respondents (n = 247).
CategoryItemFrequencyPercentage
GenderMale12048.6
Female12751.4
Age<2083.2
20–2913755.5
30–399438.1
>3983.2
Education<Undergraduate114.5
Undergraduate14659.1
Postgraduate or higher9036.4
Income per month<5000 CNY b11546.6
5000–10,000 CNY9940.1
10,001–15,000 CNY114.5
15,001–20,000 CNY104.0
>20,000 CNY124.9
Total-247100
Note: b 1 USD = approximately 6.87 CNY.
Table 3. Results of reliability and convergent validity tests.
ConstructIndicatorStandardized LoadingCRAVECronbach’s Alpha
Relative AdvantageRA10.9580.9750.9060.965
RA20.948
RA30.941
RA40.960
CompatibilityCompa10.8720.9360.8300.897
Compa20.947
Compa30.912
ComplexityCompl10.9450.9590.8850.935
Compl20.958
Compl30.920
ObservabilityOb10.9470.9530.8700.925
Ob20.951
Ob30.899
TrialabilityTr10.9070.9390.8370.903
Tr20.893
Tr30.944
AttitudeAt10.9390.9600.8900.938
At20.959
At30.932
ImageIm10.9430.9760.9100.967
Im20.960
Im30.971
Im40.941
Current UsageCU10.9340.9630.8680.949
CU20.923
CU30.954
CU40.915
Transaction SatisfactionTranS10.9600.9660.9060.948
TranS20.963
TranS30.931
Travel SatisfactionTravS10.9600.9820.9300.975
TravS20.975
TravS30.949
TravS40.973
Table 4. Construct correlations and discriminant validity.
Construct123456789101112
1. RA0.952
2. Compa0.7560.911
3. Compl0.7040.6690.941
4. Ob0.5810.5800.6330.933
5. Tr0.4790.5180.3880.5470.915
6. At0.6270.6320.5850.6910.5240.943
7. Im0.1680.2510.1740.2830.5240.3730.954
8. CU0.6650.7040.5760.6110.5350.7280.3170.931
9. TranS0.5630.5370.4630.5500.5240.7420.4360.7080.952
10. TravS0.6350.5870.5550.5610.4900.7380.2920.6660.6680.964
11. Age0.086−0.0380.0290.096−0.0780.172−0.0730.0530.1550.082-
12.Income0.1470.1410.1030.1420.0290.136−0.1040.1640.0560.0780.279-
Notes: RA, Relative Advantage; Compa, Compatibility; Compl, Complexity; Ob, Observability; Tr, Trialability; At, Attitude Im, Image; CU, Current Usage; TranS, Transaction Satisfaction; TravS, Travel Satisfaction. The bold numbers in the diagonal row are the square roots of the AVE.

