Article

Modeling of Turbidity Variation in Two Reservoirs Connected by a Water Transfer Tunnel in South Korea

1
Andong Regional Office, K-water, Andong-si, Gyeongsangbuk-do 36611, Korea
2
Department of Civil and Environmental Engineering, Yonsei University, Seoul 03722, Korea
3
Division of Climate Change and Interdisciplinary Research, Korea Environment Institute, Sejong 30147, Korea
4
Human Planet Corporation, Daejeon 34077, Korea
5
Department of Civil Engineering, Shingu University, Seongnam-si, Gyeonggi-do 13174, Korea
6
Department of Civil, Environmental and Plant Engineering, Konkuk University, Seoul 05029, Korea
*
Author to whom correspondence should be addressed.
Sustainability 2017, 9(6), 993; https://doi.org/10.3390/su9060993
Submission received: 27 December 2016 / Revised: 12 May 2017 / Accepted: 6 June 2017 / Published: 9 June 2017
(This article belongs to the Special Issue Sustainable Water Resources Management)

Abstract

:
The Andong and Imha reservoirs in South Korea are connected by a water transfer tunnel. The turbidity of the Imha reservoir is much higher than that of the Andong reservoir. Thus, it is necessary to examine the movement of turbidity between the two reservoirs via the water transfer tunnel. The aim of this study was to investigate the effect of the water transfer tunnel on the turbidity behavior of the two connecting reservoirs and to further understand the effect of reservoir turbidity distribution as a function of the selective withdrawal depth. This study applied the CE-QUAL-W2, a water quality and 2-dimensional hydrodynamic model, for simulating the hydrodynamic processes of the two reservoirs. Results indicate that, in the Andong reservoir, the turbidity of the released water with the water transfer tunnel was similar to that without the tunnel. However, in the Imha reservoir, the turbidity of the released water with the water transfer tunnel was lower than that without the tunnel. This can be attributed to the higher capacity of the Andong reservoir, which has double the storage of the Imha reservoir. Withdrawal turbidity in the Imha reservoir was investigated using the water transfer tunnel. This study applied three withdrawal selections as elevation (EL.) 141.0 m, 146.5 m, and 152.0 m. The highest withdrawal turbidity resulted in EL. 141.0 m, which indicates that the high turbidity current is located at a vertical depth of about 20–30 m because of the density difference. These results will be helpful for understanding the release and selective withdrawal turbidity behaviors for a water transfer tunnel between two reservoirs.

1. Introduction

Turbidity is one of the most important water quality parameters for reservoirs that supply drinking water [1,2,3]. The location of an intake station with low turbidity from which drinking water can be sourced is determined by the characteristics and transport of the turbidity plume. In general, reservoir turbidity is a result of the concentration of the suspended solids from watershed runoff and creates water quality issues for sustainable operation of reservoirs that are used for water supplies, aquatic habitats, and recreation [4,5,6]. Many reservoirs in South Korea, including the case study reservoir, have issues with high turbid density inflow [7,8,9,10].
Considering that most reservoirs store water during rainy season for the subsequent dry seasons, turbidity problems can endure long past flood events that fill reservoirs with turbid material. This material can subsequently settle and undergo subsequent resuspension, often numerous times without leaving at off-takes. Moreover, the Korean peninsula experiences monsoon weather during the summer season, which leads to turbid density flows [11,12].
In South Korea, there have been many studies that analyze the turbidity of existing reservoirs. Kim and Kim [7] and Ryu et al. [10] applied the CE-QUAL-W2, a water quality and 2-dimensional hydrodynamic model, to the Soyang reservoir, which is a deep reservoir in South Korea, to investigate the turbidity interflow. Kim and Kim [7] found that the major factors influencing the movement of density currents in Soyang reservoir included water body temperature, inflow water temperature, outlet height, and change in discharge rate. Using the CE-QUAL-W2, Park et al. [13] explored the turbid water distribution in Yeongju Dam, South Korea, in relation to withdrawal depth, which was classified into surface (depth 5–10 m), middle (depth 15–20 m), and lowest zones (depth 25–30 m). The results showed that surface layer withdrawal was a better extraction source than the other two withdrawal locations for restricting turbidity explosion in the reservoir. Additionally, Ryu et al. [10] investigated turbidity current performance according to the selective withdrawal structure operation and found that the total reservoir storage and depth were the most effective variables for operating the selected withdrawal structure. Choi et al. [8] studied thermal hydrodynamic and turbid current prediction of massive water bodies for reservoir reconstruction. The researchers used the CE-QUAL-W2 model for the Obong reservoir in South Korea. Results showed that thermal stratification would increase during summer and persist after reservoir reconstruction. Further results showed that suspended solids would slowly settle to the bottom before reservoir reconstruction. However, results showed that vertical circulation near the surface also limits density plumes at the depth of hypolimnetic water after reservoir reconstruction. Turbidity density current in Imha reservoir has been studied because Imha reservoir has frequently experienced a turbidity current propagating along the thermocline [14,15,16]. Yi et al. [14] and Lee et al. [15] applied CE-QUAL-W2 to analyze turbid density currents caused by typhoons during summer stratification in 2002 and 2006. An and Julien [16] provided a detailed analysis of the dynamics of turbid density currents in the summer of 2006 using the FLOW-3D, a 3D nonhydrostatic computational fluid dynamics (CFD) code. They suggested that sediment sizes between 10 and 40 μm and sediment concentrations between 2000 and 3000 mg/L are expected to be a concern at the Imha reservoir.
Recently, a water transfer tunnel between the Andong and Imha reservoirs for efficient water supply was developed and its multiple impacts were investigated. Park and Chung [17] suggested that the change in the water transportation and stratification would be caused by the water transfer tunnel. They applied CE-QUAL-W2 for a water temperature simulation according to the elevation and found that stratification changes as water moves through the connecting tunnel from the Imha reservoir to the Andong reservoir. Furthermore, Park et al. [18] investigated the environmental, social, and economic benefits of the water transfer tunnel by comparing it with reservoir construction in the Nakdong River. The research concluded that water transfer tunnels provide benefits of water storage through operations transfers, ecosystem preservation, and reductions in construction costs in comparison with the aspects of other reservoirs. However, previous studies did not account for turbidity current performance in a water transfer tunnel between two reservoirs. The main study objective was to investigate the turbidity behavior effect of the water transfer tunnel as a water transfer tunnel is operated. The water transfer tunnel was developed in 2015. To explore the turbidity change effects between two reservoirs to meet the objective of this study, it is necessary to apply a reasonable simulation model to obtain results of the effects of water transfer tunnel operation. The multiple results in this study were shown by the simulation models because the observed information for a particular case after the water transfer tunnel is not enough. It is necessary to simulate hydrodynamic and water quality movements in both reservoirs as water is transferred by a tunnel. In particular, this study explores the variation of released water turbidity, vertical turbidity profile, and withdrawal turbidity by selected withdrawal depth on the connecting reservoir condition. We expect the results of this study to be helpful in conducting sustainable turbidity management in the released and withdrawal waters of the connected reservoir condition. We adopted the CE-QUAL-W2 model to simulate hydrodynamic and water quality processes including inflows, outflows, surface heat fluxes, oxygen dissolution, and sedimentation. CE-QUAL-W2 has already successfully been implemented to investigate hydrodynamics, sediment flux, and turbidity of lakes and reservoirs in the past [7,8,17,19,20,21]. Additionally, the model’s ability to reproduce the dynamics of reservoirs affected by turbidity currents between two connected reservoirs has already been verified. Thus, CE-QUAL-W2 have been widely applied and verified to simulate stratification and water quality concentration profiles in a reservoir [7,10]. CE-QUAL-W2 is useful in analyzing longitudinal and vertical movements of density currents over a long period with less runtime because the model employs lateral homogeneity and hydrostatic pressure assumptions. 3-D models have limited effectiveness in simulating high turbidity currents in a reservoir. The efficiency of engineering approaches like selective withdrawal, flushing, blocking curtains or de-stratification for simulating high turbidity issues in a reservoir cannot be assessed with 3-D models like the hydrostatic assumption. Because the engineering methods probably include a significant vertical acceleration, the 3-D models using a hydrostatic assumption cannot provide accurate simulation for the complex movement of engineering approaches that produce a significant vertical acceleration [22,23,24]. Therefore, we concluded that CE-QUAL-W2 was more suitable than 3-D models for this study. Boundary conditions from data in 2006 (e.g., inflow water temperature and turbidity), were used for calibration purposes in this study. We did not have observation data for 2002. Therefore, we estimated values by using a multiple regression equation, which we used to correct abnormal data measured using an automated measuring device. The water transport data between two reservoirs in 2002 and 2006 were obtained from simulation operation data based on data from K-water [19] over the past 30 years (1979–2008).

2. Materials and Methods
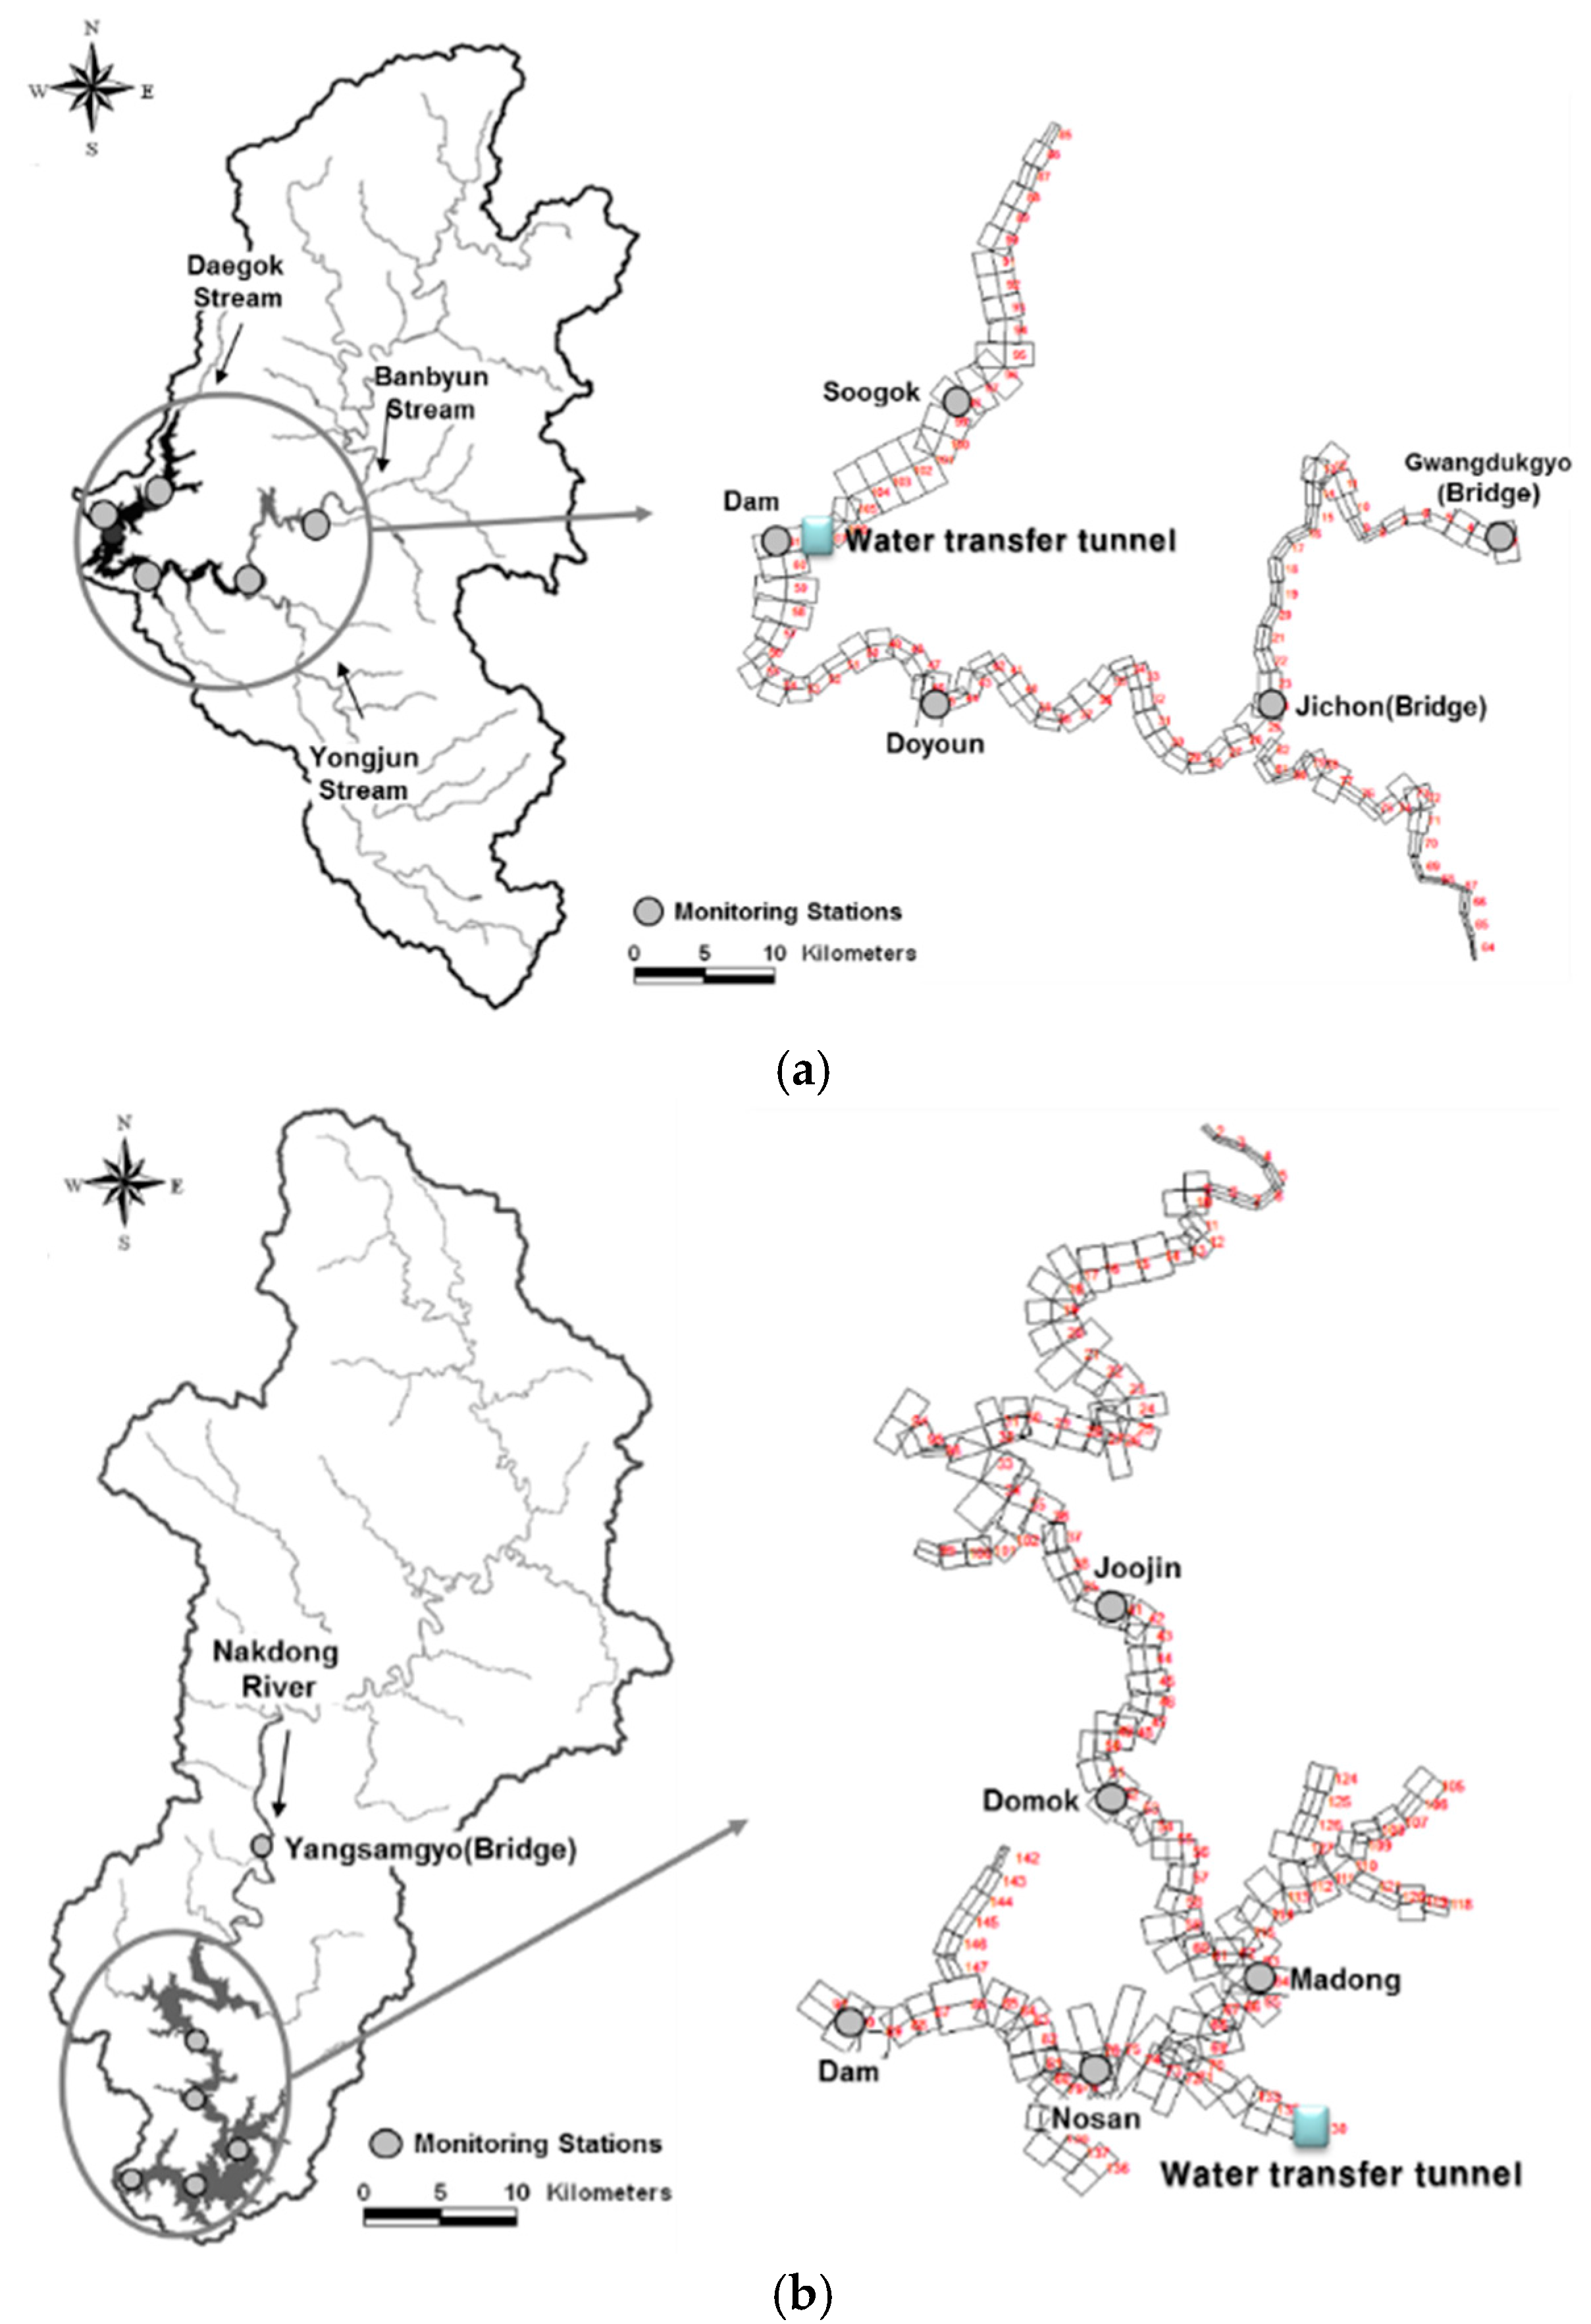
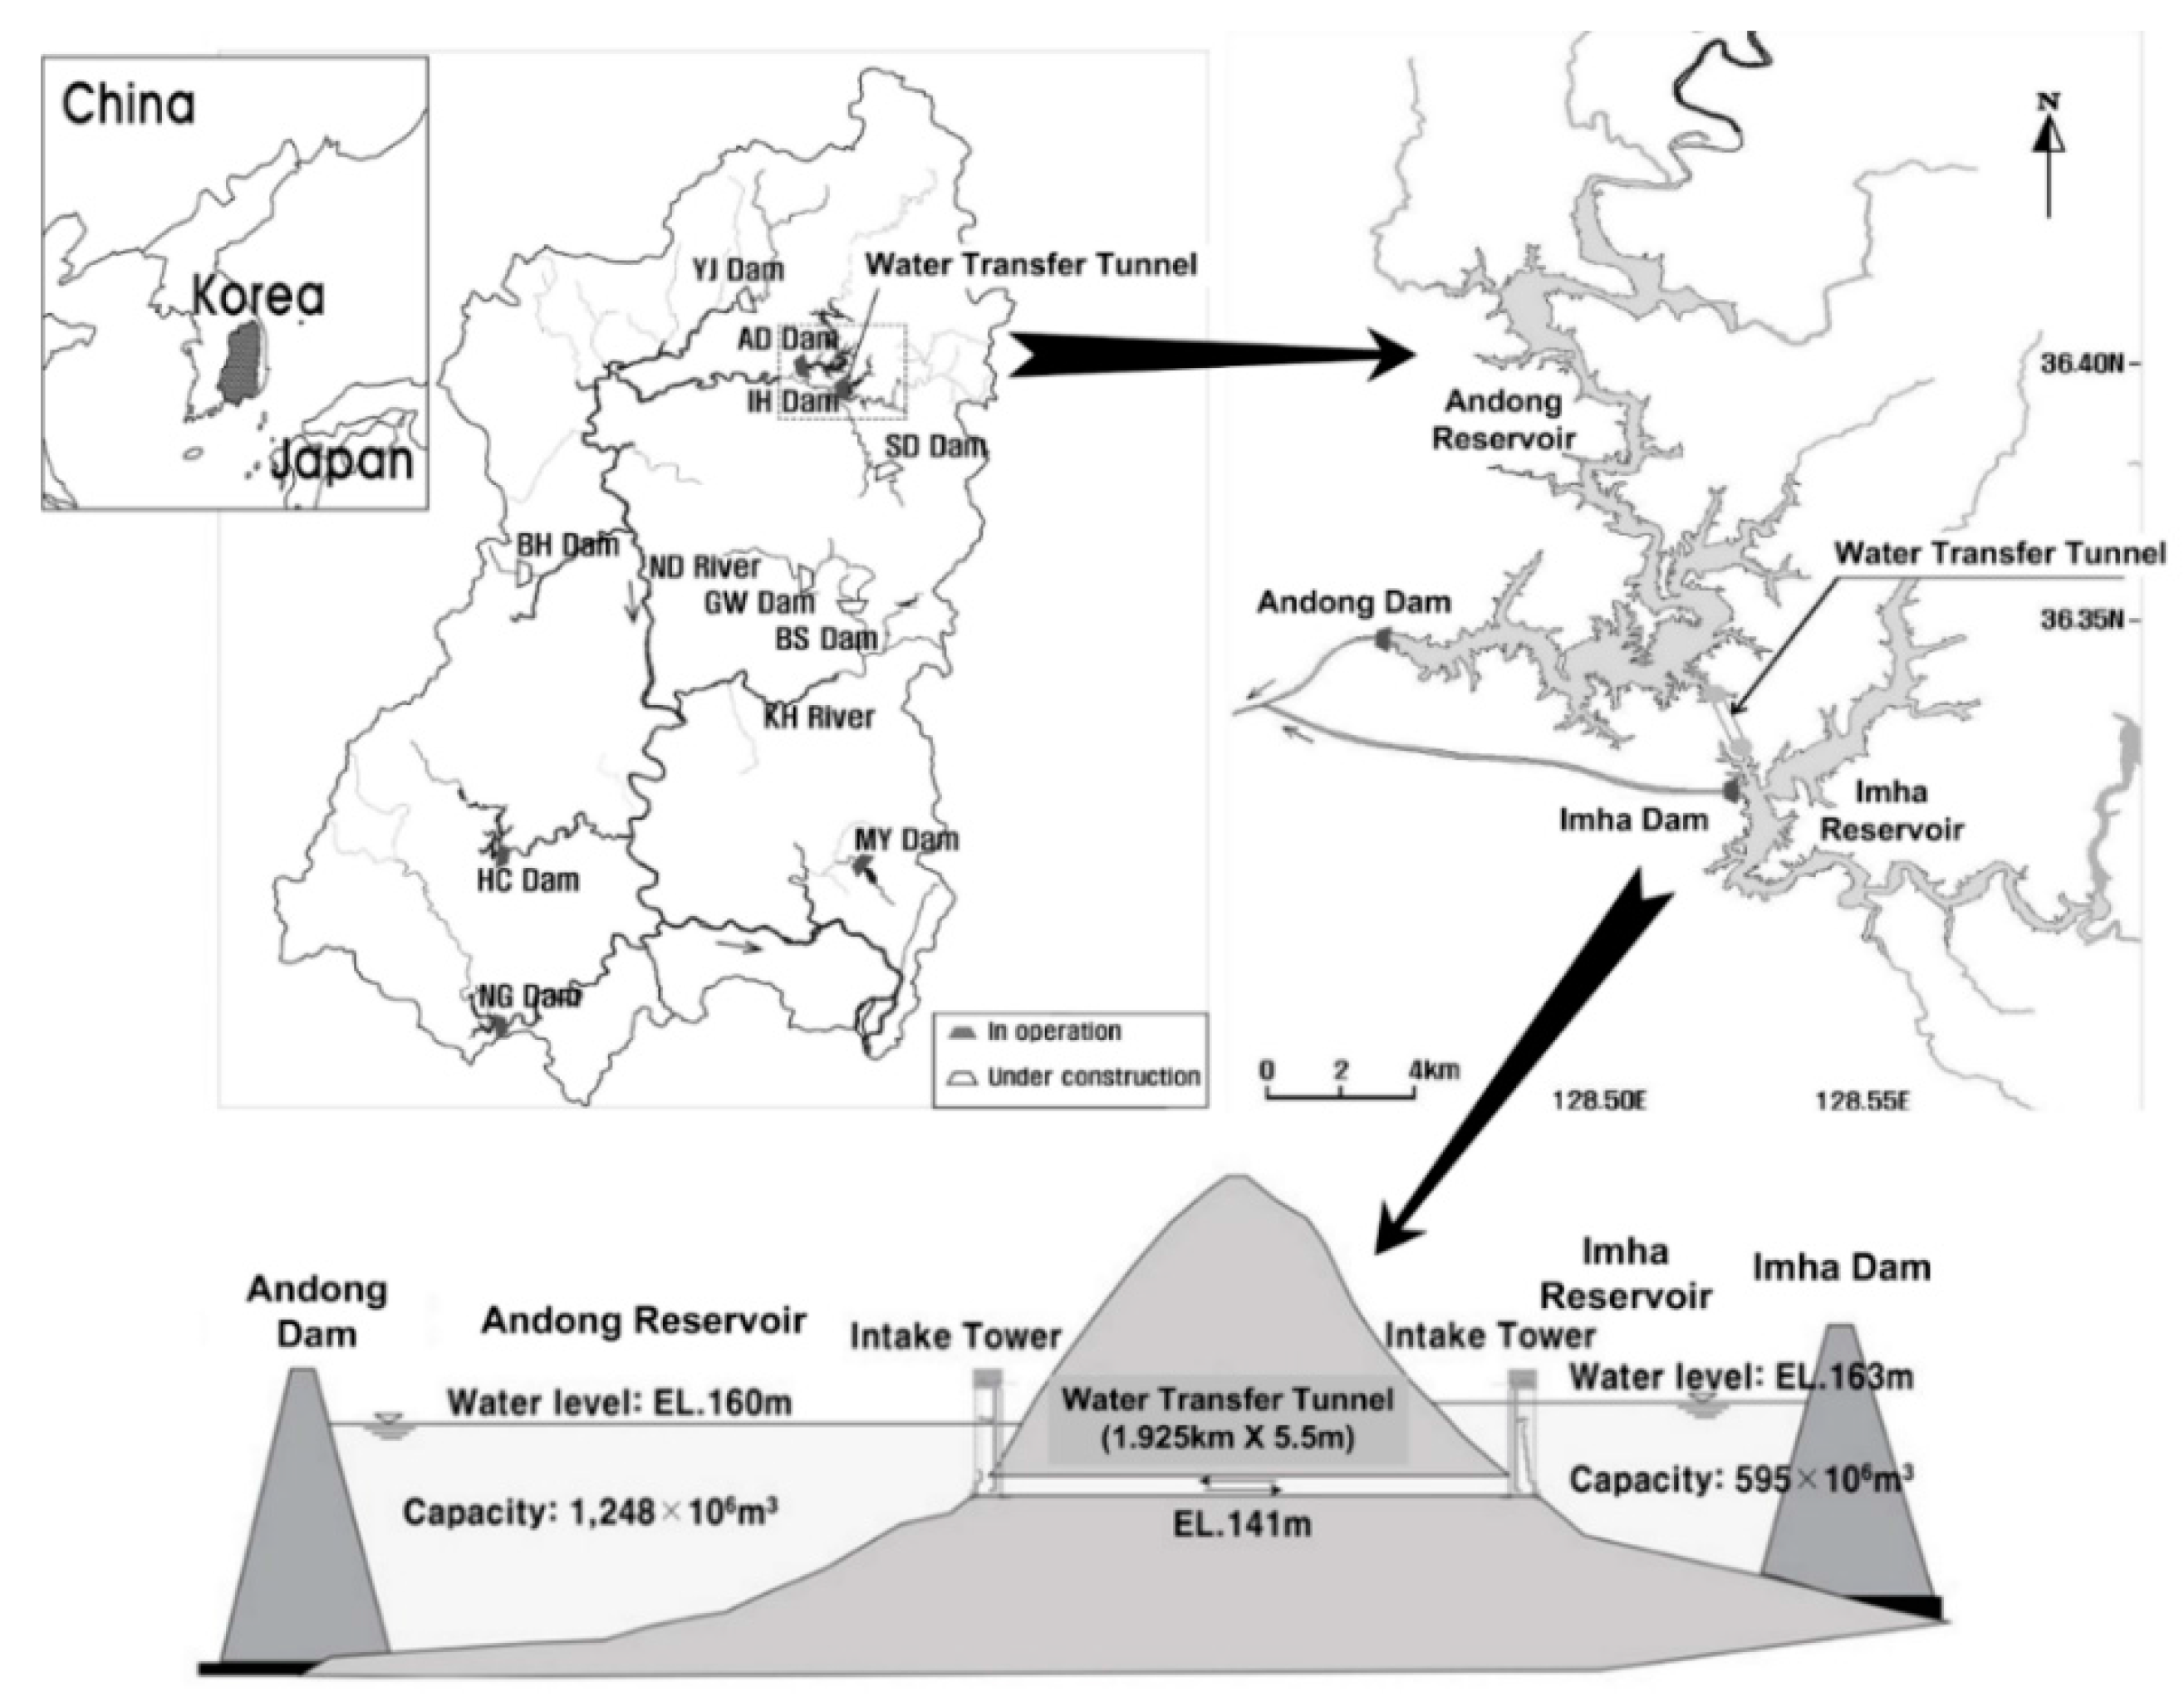
2.1. Study Area

The Andong and Imha reservoirs are located high upstream along the Nakdong River in South Korea. Figure 1 shows the geometric characteristics of the Andong reservoir, the Imha reservoir, and the water transfer tunnel. The water transfer tunnel had been developed in 2015 and its multiple results in this study were shown by the simulation models because the observed information after the water transfer tunnel is not enough. The Imha reservoir watershed has an area of 1361 km2 (0.9 times larger than the catchment area of the Andong reservoir), its storage volume is 595 million m3 (47% the storage capacity of the Andong reservoir), and its normal water level is attained at elevation (EL.) 163 m. The Andong reservoir is approximately 2 km from the Imha reservoir. The Andong reservoir watershed area is 1584 km2 and its storage volume is 1.248 billion m3, see Table 1. The Imha reservoir discharges summer floodwaters downstream through water gates. In 2006, the Imha reservoir’s annual spillway drift measured 289 million m3 [18,19]. The normal water level for the Andong reservoir is EL. 160 m, which is 3 m lower than that of the Imha reservoir, see Table 1 and Figure 1 [17,18].

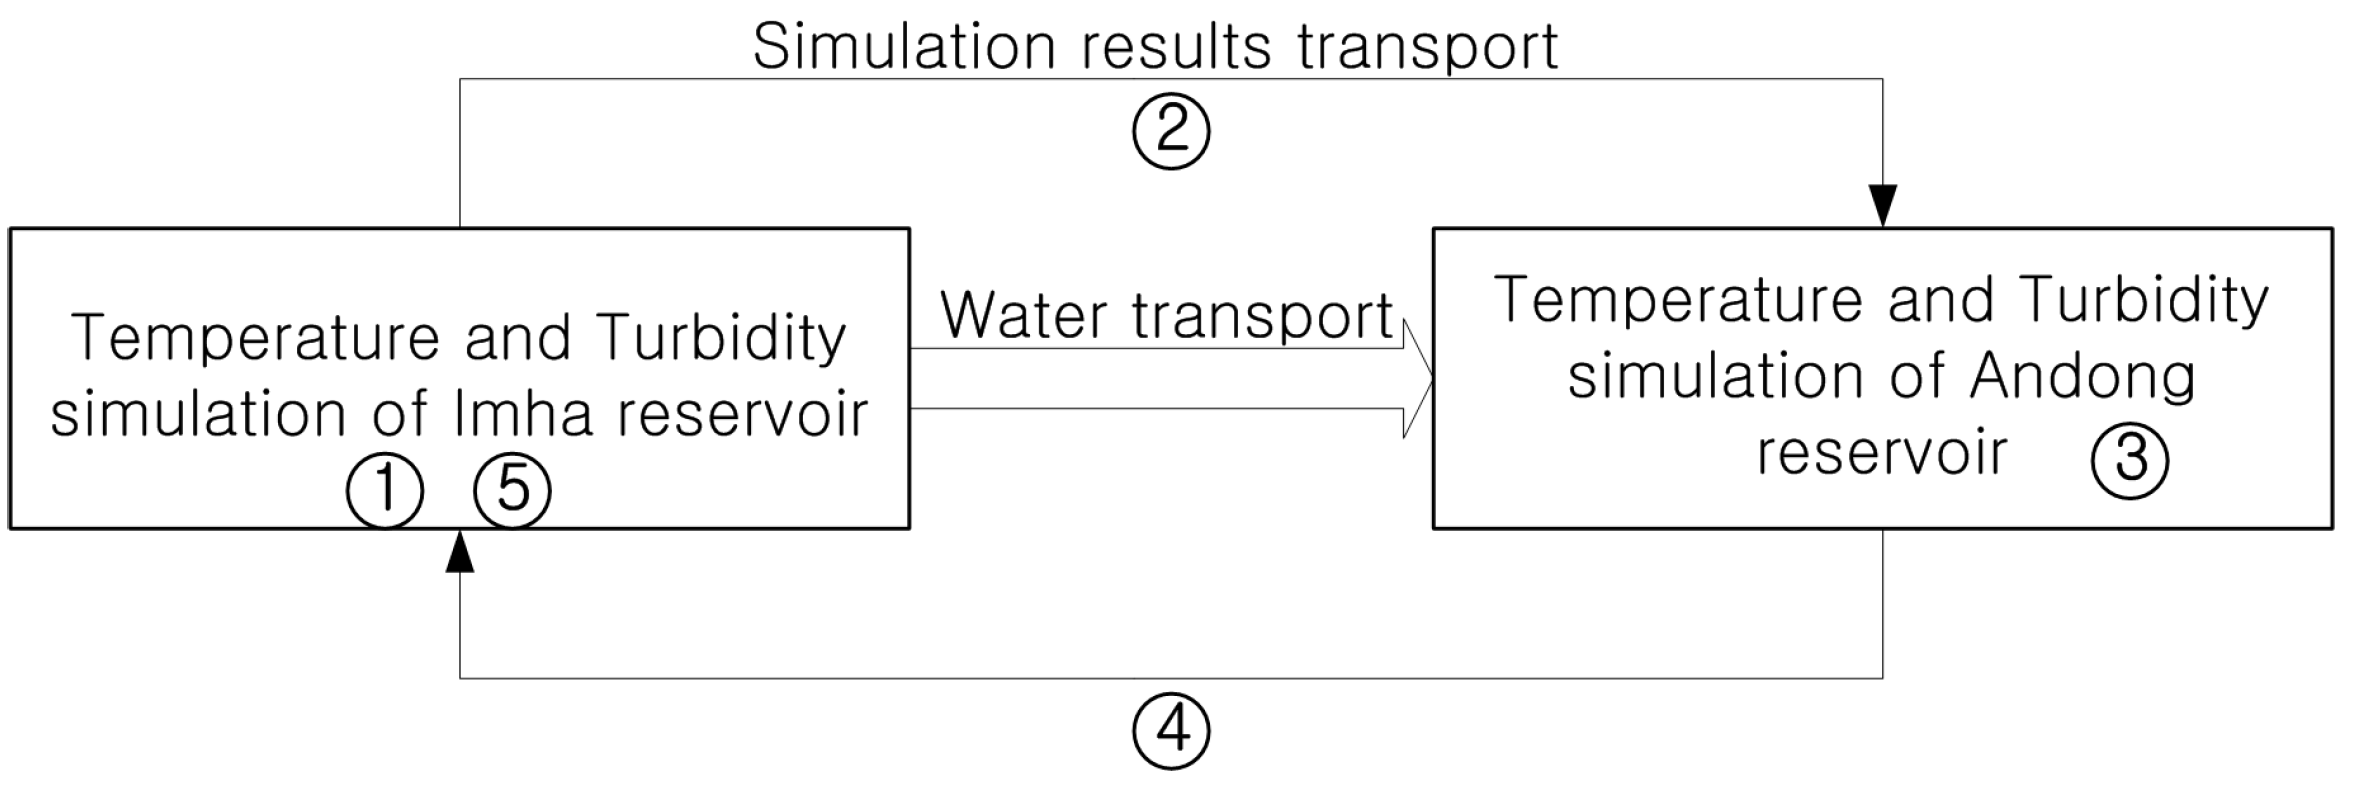
2.2. Model Selection and Description

To validate the impacts of the water transfer tunnel on turbidity of the reservoirs, the CE-QUAL-W2 model was used. Although CE-QUAL-W2 is limited by the average assumption of lateral variation in velocities, temperatures, and constituents and may not provide accurate results where there is significant vertical acceleration, it is a very efficient model for reservoirs that are typically longer than they are wide and show clear stratification phenomena during summer flooding seasons due to extensive water depths [22]. Particularly, the CE-QUAL-W2 model was determined to be the most suitable model for analyzing the turbidity current because it was necessary to analyze the dynamics of sinking, floating, and resurfacing particles. In addition, the model can accurately simulate stratification phenomena, density current flow, vertical mixing around the water body to accurately analyze the movement of a turbidity current inflow of a reservoir [7,20,21,22,23,24]. The application of a 2-dimensional model is advantageous for analyzing the effectiveness of selective intake facilities because this is required for analyzing changes in movement caused by turbidity current. The turbidity current is created by changes in water circulation of a whole reservoir and stratification structure depending on various hydrologic events and water withdrawal location scenarios. Moreover, most large Korean reservoirs, created by multi-purpose dams, are characterized by large water level changes throughout the year with the highest inflow occurring during the rainy season. The CE-QUAL-W2 model can easily analyze spatial alterations of upstream boundary conditions in accordance with water level change. Moreover, CE-QUAL-W2 can automatically adjust the calculating interval depending on the flux scale; thus, this model was suitable for numerical analysis reliability and efficiency.

2.3. Model Input Data Adjustment

In this study, all meteorological input data for 2002 and 2006 were obtained from the Andong weather station. We adopted temperature, wind direction, and wind speed data with hourly time step and dew point temperature, and cloud cover data based on three hourly intervals. Topographic data of the Andong and Imha reservoirs were constructed using the HEC-RAS file from K-water [25]. The numerical grid of the Andong and Imha reservoirs with the flow direction were divided into 148 and 107 segments, respectively, with about 500 m intervals on average as shown in Figure 2. The interval for the vertical direction grids of the Andong and Imha reservoirs were composed of 70 and 60 layers, respectively, at 1 m intervals based on the bottom elevation of topographic map. The numerical grids for both of the reservoirs were verified by comparing estimated stage-storage curves with measured stage-storage curves [17,19].
The hourly inflow and release data for the Andong and Imha reservoirs were obtained from DIIS (Dam Integration Information System) data in K-water. The observed water temperature and turbidity of inflow were collected from automatic measurement devices installed in major inflow rivers, see Figure 2. When data collected from an automatic measurement device was abnormal (e.g., water temperature was below 0 °C), this abnormal data was adjusted with the inflow water temperature estimation equation for the Imha reservoir according to Yi et al. [26].
WTBB = 0.27Tair + 0.39Tdew + 10.89 (Banbyun Stream, flux ≤ 20 m3/s)
WTBB = −0.18Tair + 0.58Tdew + 12.15 (Banbyun Stream, flux > 20 m3/s)
where WTBB indicates water temperature at Gwangdukgyo (Bridge) of Banbyun Stream and Tair and Tdew indicate temperature and dew point measured at the Andong weather station, respectively.
Abnormal inflow turbidity data was corrected by using the multi-regression equation between the rate of inflow and the inflow turbidity at the Jichongyo (Bridge) (Imha reservoir) and Yangsamgyo (Bridge) (Andong reservoir), which are the inflow locations for each reservoir. Correlation between the inflow discharge and the inflow turbidity were analyzed by using the observed data at the inflow location of each reservoir as shown in Figure 3. The Imha reservoir showed a considerable increase in inflow turbidity with a higher inflow discharge. However, the inflow turbidity of the Andong reservoir did not significantly increase even when the inflow discharge increased. Thus, the regression equations in Figure 3 are suitable to describe the catchment characteristics of the inflow and turbidity relationship. This study investigated the simulation results of released water turbidity, withdrawal turbidity, and the vertical turbidity profiles of reservoirs based on the water transfer tunnel operation when a high turbidity current enters the Imha reservoir. Furthermore, high turbidity entered the Imha reservoir when the Typhoon Ewiniar struck in 2006.

2.4. Turbidity Estimation

This study also applied the regression method between turbidity and suspended solids (SS) because the CE-QUAL-W2 model is not able to directly simulate turbidity and only simulates SS. The regression equations between turbidity and SS for the Imha and Andong reservoirs from K-water [25] were as follows:
Turbidity = 3.33 × SS for Imha reservoir
Turbidity = 1.43 × SS for Andong reservoir
where SS indicates suspended solids (mg/L) and the unit of turbidity is the nephelometric turbidity unit (NTU). Therefore, this study applied these correlation equations between turbidity and SS for the Andong and Imha reservoirs.

2.5. Model Application

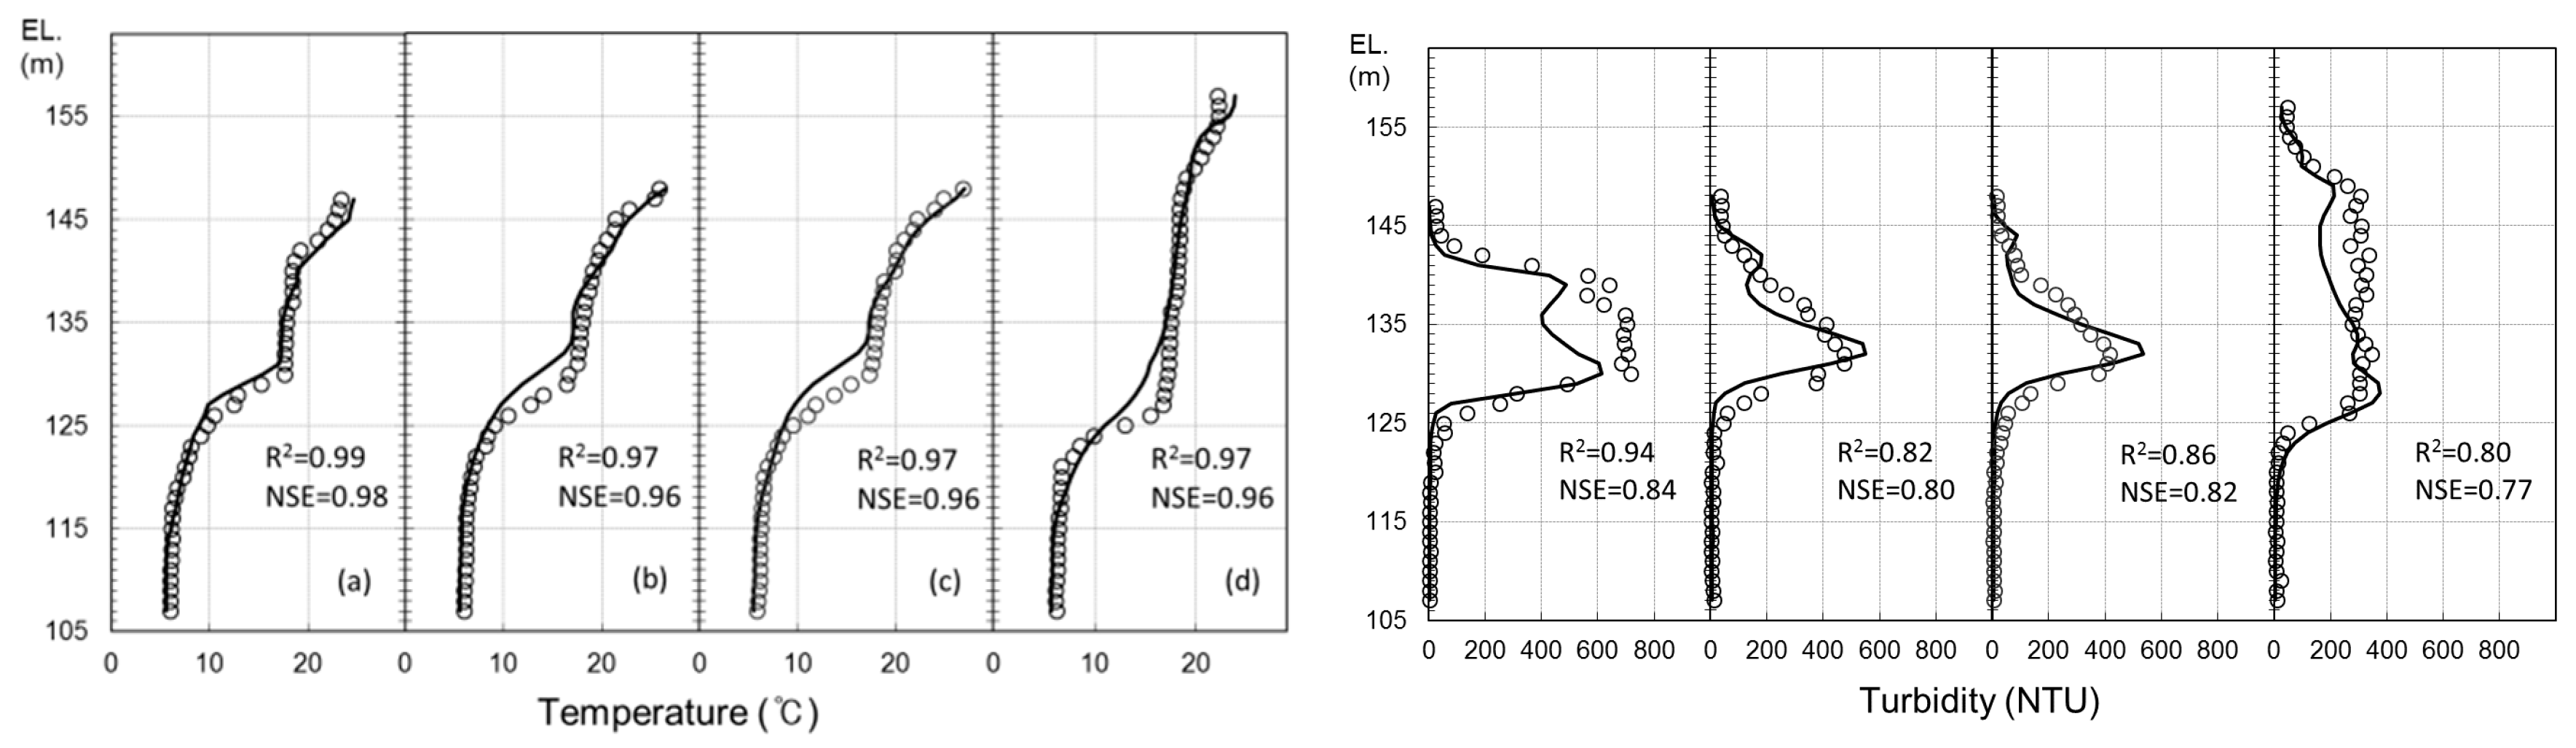
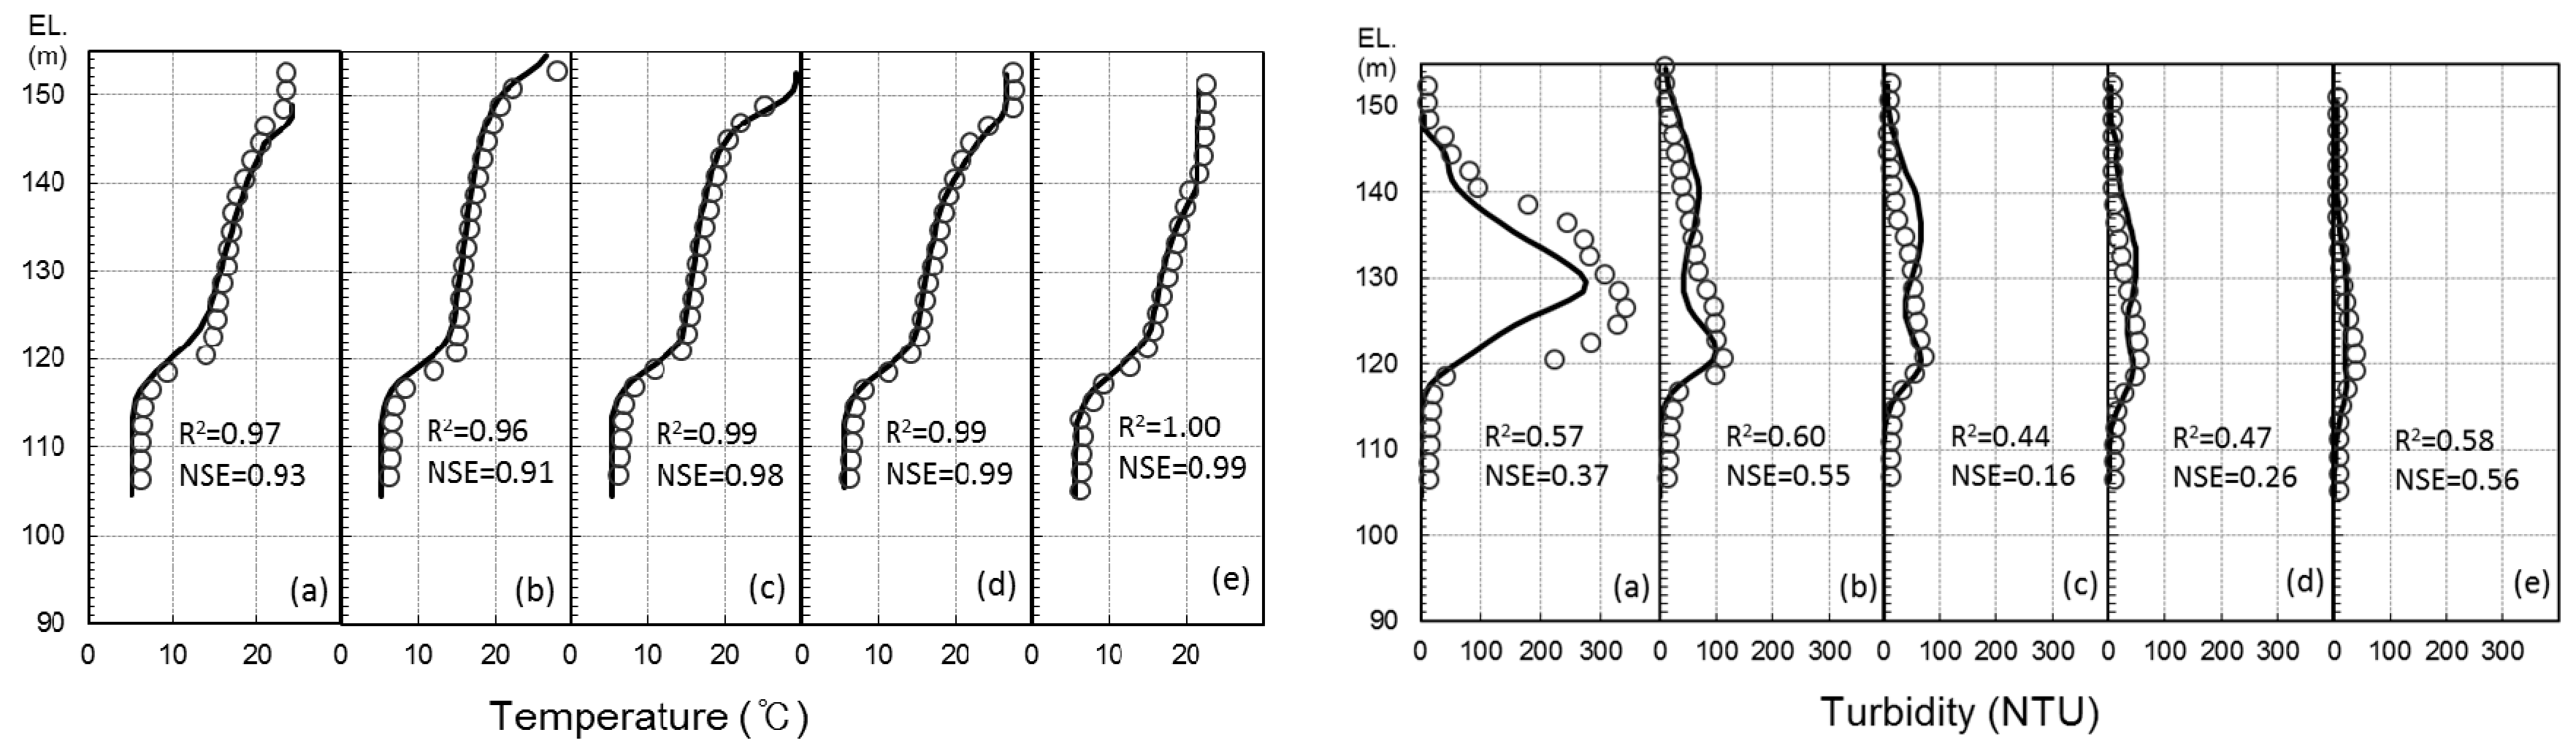
2.5.1. Model Validation/Verification

This study adopted the input parameters of the CE-QUAL-W2 model from Park and Chung [17] and K-water [19]. They represented the model calibration using 2006 data. Boundary condition data and observed data were established together and presented the changes in water level calibration using the input data as shown in Figure S1. To calibrate the water temperature and turbidity of the model, observed data was compared with simulation results. All simulation results and observed data are daily time step. Analysis by water depth showed that simulation on the overall turbidity trend and the maximum turbidity layer prediction correlated well with the observed data [17].
Hydraulic parameters to simulate turbidity behavior as proposed by Cole and Buchak [27] were used in the CE-QUAL-W2 model, as shown in Table 2. These parameters were used in simulations of various Korean reservoirs and are known to reproduce relatively good simulations of water temperature stratification phenomena. Based on previous studies [28,29], this study adjusted these parameter values to simulate the turbidity current in the Imha and Andong reservoirs, as shown in Table 2. The performance of the calibrated models was assessed by comparing model simulation data from 2006 with observed data for the same period in both the Andong and Imha reservoirs. The model performance was evaluated by the Nash-Sutcliffe Efficiency (NSE) and coefficient of determination (R2). NSE and R2 are defined by:
NSE = 1 i = 1 N ( X o i X s i ) 2 i = 1 N ( X o i X o ¯ ) 2
R 2 = { 1 N i = 1 N ( X o i X o ¯ ) ( X s i X s ¯ ) σ X o σ X s } 2
where X o is the observed variable, X s is the simulated variable, X o i is the observed variable at depth t, X o ¯ is the average of observed variable, X s i is the simulated variable at depth t, X s ¯ is the average of the simulated variable,   σ X o is the standard deviation of the observed variable, σ X s is the standard deviation of the simulated variable, and N is the amount of data. NSE can range from −∞ to 1. NSE becomes smaller as the model and observed values diverge, with an NSE of 1.0 indicating a perfect calibration. For R 2 , 1.0 indicates a perfect calibration and 0 shows no correlation between the model and observed values.
Stratification and turbidity distribution in a reservoir are affected by upstream turbidity current behaviors. It is necessary to adjust and verify vertical stratification and turbidity profiles in upstream stations for CE-QUAL-W2. To set up the boundary conditions for the CE-QUAL-W2 model, the total suspended solid concentration was converted into turbidity using regression analysis of the turbidity and the suspended solid relationship from Equations (3) and (4). This study is focused on the dam site in the Imha reservoir in Figure 4 and the model and observed data are well matched with R 2 (0.8–0.99) and NSE (0.77–0.98) in both temperature and turbidity calibrations. Also, the constant parameters for all spatial and temporal conditions of the CE-QUAL-W2 model are applied to the calibration because of the limited time. Although model turbidity is not matched with observed turbidity at EL 135 on July 12 and at EL 140 on July 17, model turbidity is similar or slightly greater than observed turbidity on July 14, July 15, and July 17. This indicates that we calibrated the model parameters as well as possible and the selected parameters show the best results overall with the observed turbidity. This study, particularly related to the dam site in the Imha reservoir and the model and observed data, are well matched with R 2 (0.8–0.99) and NSE (0.77–0.98) in the overall duration. These results indicate that the model calibrations of this study are reasonable. Likewise, for the Andong reservoir calibration, as seen in Figure 5, the R 2 and NSE values for the temperature calibration were 0.96–1.0 and 0.91–0.99, respectively, at Nosan station. Turbidity calibration had lower calibration results than temperature calibration: 0.44–0.6 for R 2 and 0.16–0.56 for NSE. Overall, turbidity calibration shows higher errors than temperature calibration because turbidity is estimated from SS using Equations (3) and (4). This conversion process from SS to turbidity contains potential errors. Also, CE-QUAL-W2 model simulation contains the potential error because the constant parameter set is applied to all spatial and temporal grids.

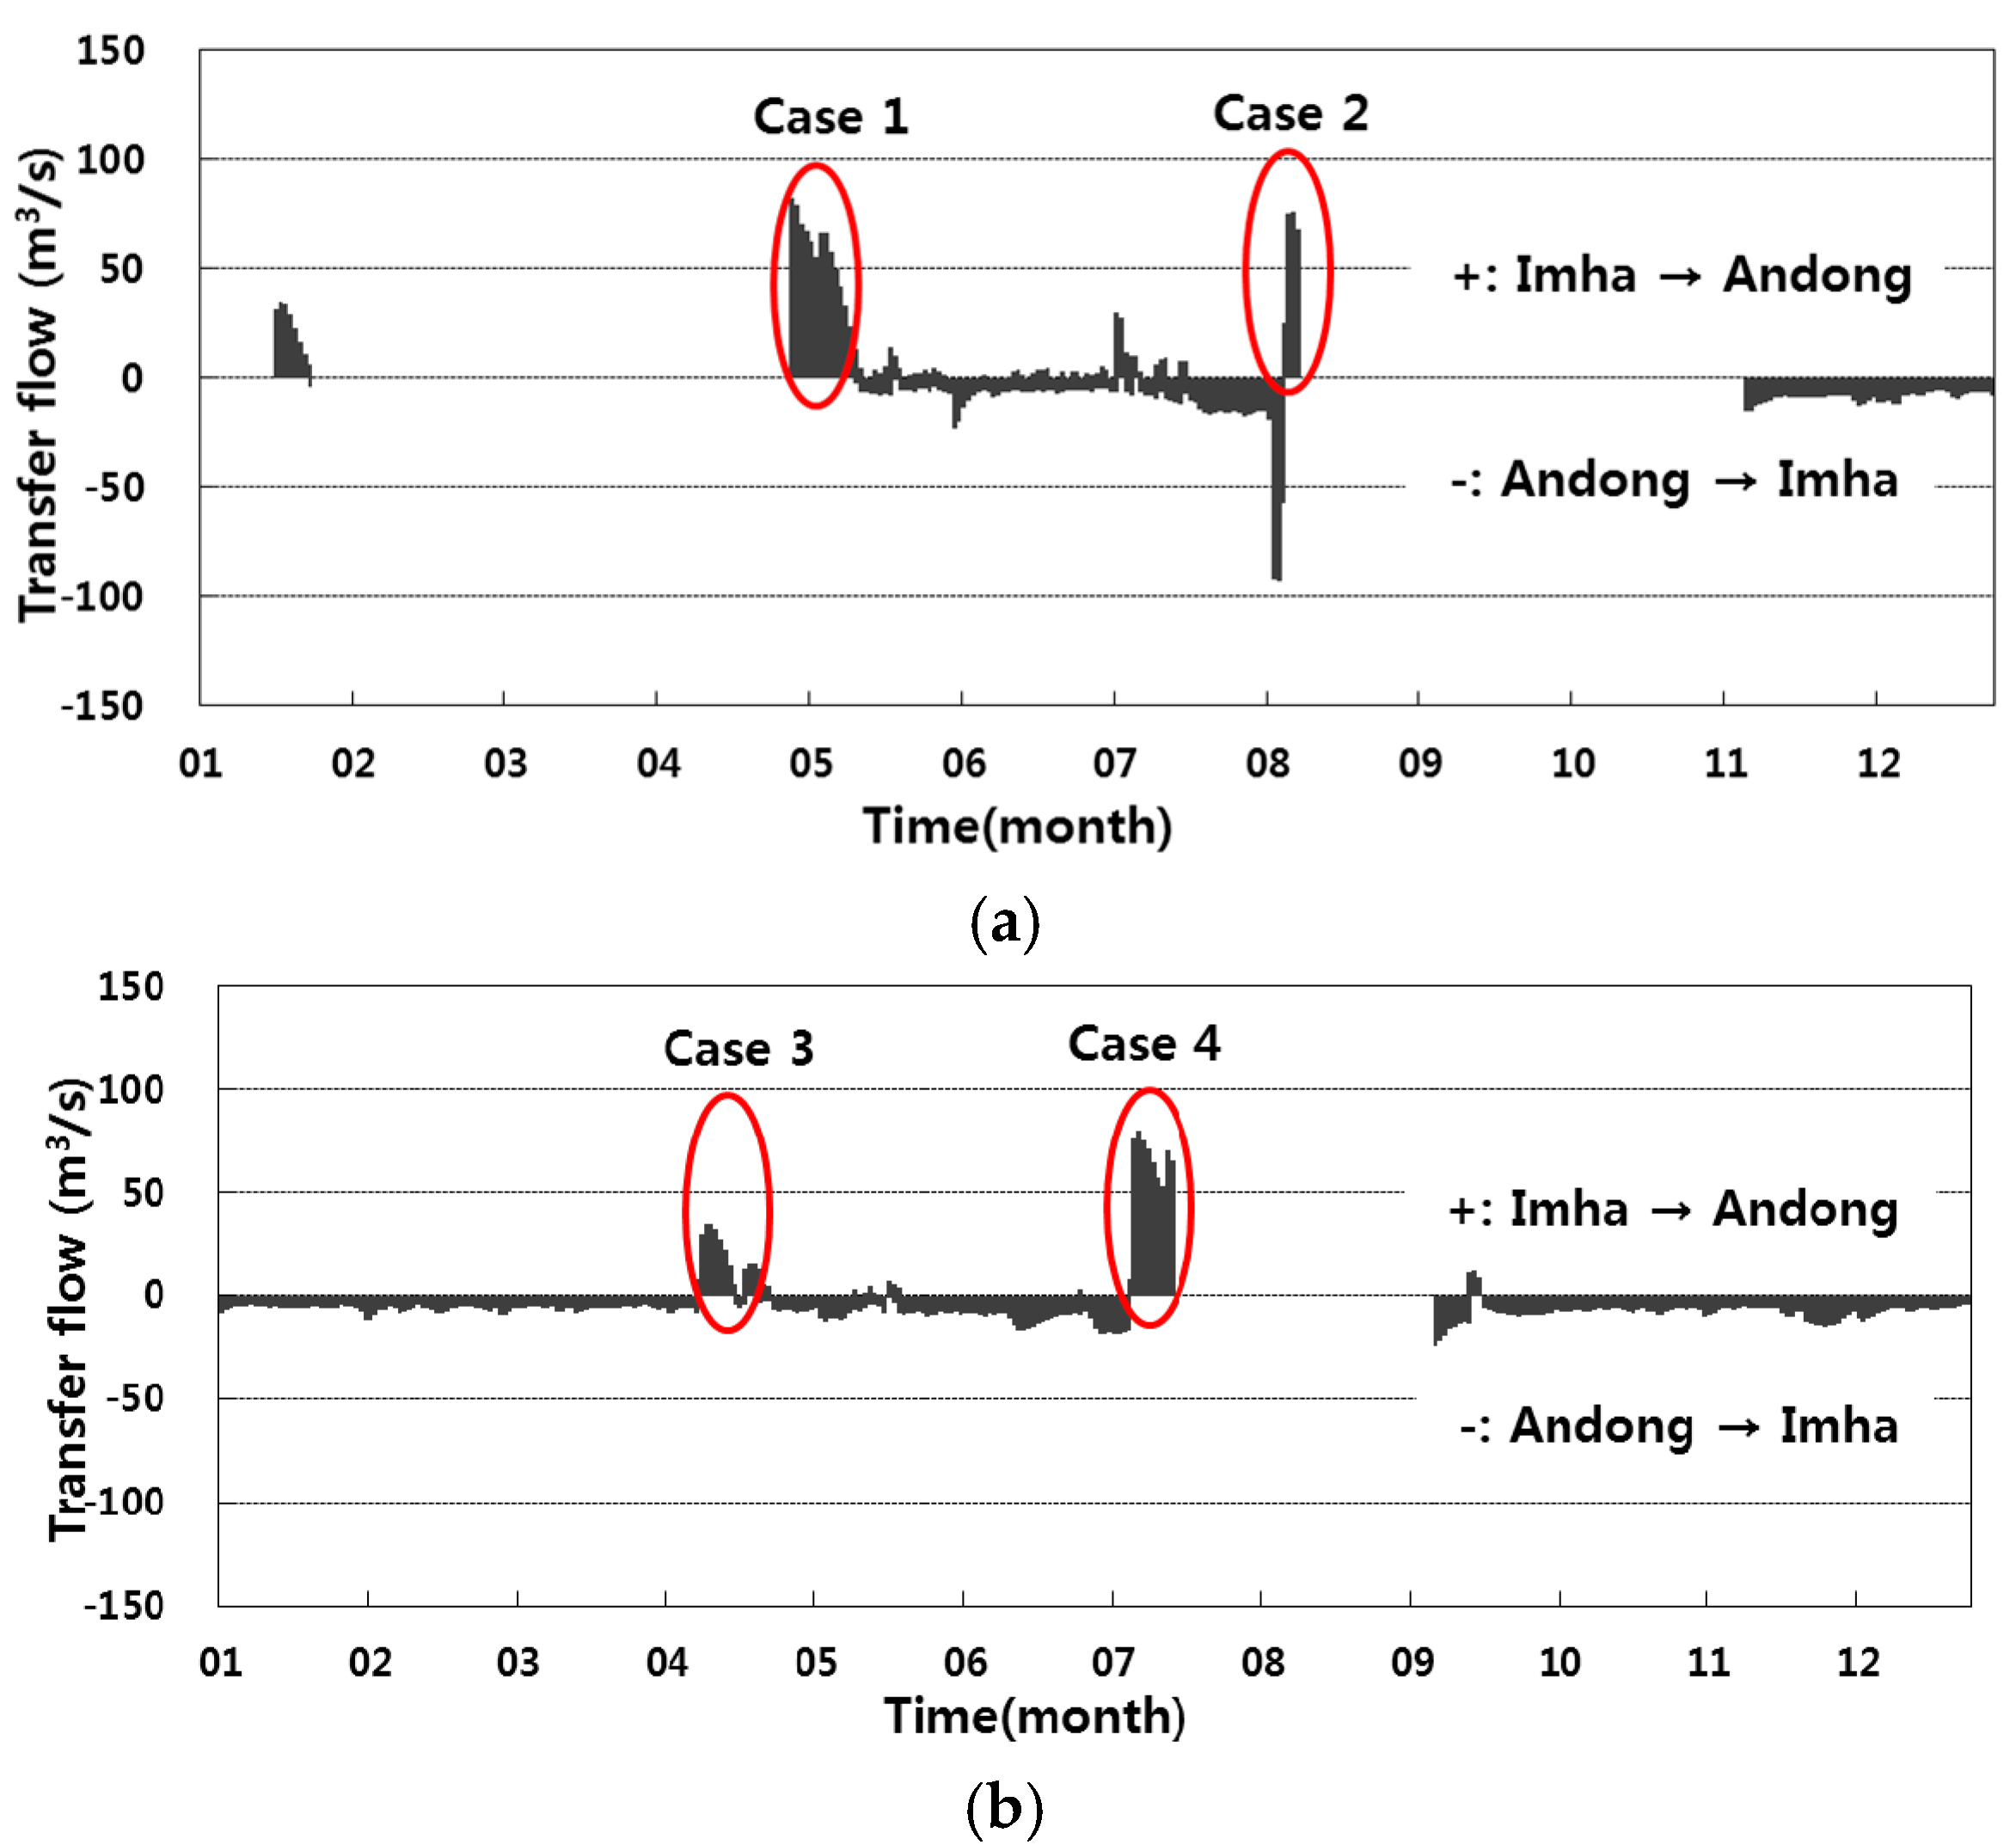
2.5.2. Simulation Scenarios

Because the Andong reservoir and Imha reservoir are connected, it is possible that high turbidity of the Imha reservoir can be dispersed to the Andong reservoir because the Imha reservoir represents high turbidity production, as shown in Figure 4. Therefore, multiple simulations should be conducted in the case of a water transfer tunnel connection between the two reservoirs. In general, a reservoir shows very different water movement characteristics depending on the time of the turbidity current timing, stratification phenomena, and conduction phenomena. Consequently, reservoirs tend to have high variance in turbidity current distribution. However, as it was not feasible to simulate all possible scenarios, we selected the most representative timing for simulating turbidity current based on existing available data measurements. We selected the year 2006 for the simulation of turbidity currents and included turbidity data at the inflow location, turbidity current layer distribution, and the water movement through a connection tunnel. Also, the year 2002 was selected because it showed high concentration turbidity current distribution at all depths of the Imha reservoir and this high concentration of water turbidity could be dispersed to the Andong reservoir. In particular, this study focused on turbidity movement based on water transfer from the Imha to the Andong reservoir because turbidity from the Imha reservoir is much higher than that of the Andong reservoir. We selected four water transfer periods in 2002 and 2006, as shown in Figure 6 and represented turbidity simulation results for each of these cases.
In the model, the input data for the intake tower for the Imha reservoir with the connecting tunnel was simulated by changing the location of 5.5 m interval withdrawal depth depending on three intake scenarios (EL. 141.0 m, EL. 146.5 m, and EL. 152.0 m) in both 2002 and 2006. These three elevations are arbitrarily selected from near the surface elevation to 5.5 m depth interval. In addition, the no connection tunnel scenarios in 2002 and 2006 were simulated and compared with the effects of a connection tunnel. All in all, turbidity current behavior was predicted and analyzed by simulating eight scenarios, as seen in Table 3. To apply the movement of water temperature and turbidity current through a tunnel (with connecting a tunnel) to a model, we simulated the Imha reservoir first (① in Figure 7), then applied the simulated water temperature and turbidity results to the tunnel inflow area of the Andong reservoir as input data (② in Figure 7). Andong reservoir was simulated using this data (③ in Figure 7). The water temperature and turbidity simulation results at the tunnel inflow location were then used as input data for the Imha reservoir simulation (④ and ⑤ in Figure 7). Thus, a turbidity current behavior analysis was conducted in the order of Imha to Andong to Imha to show similar results with actual joint operations, see Figure 7.

3. Results and Discussion

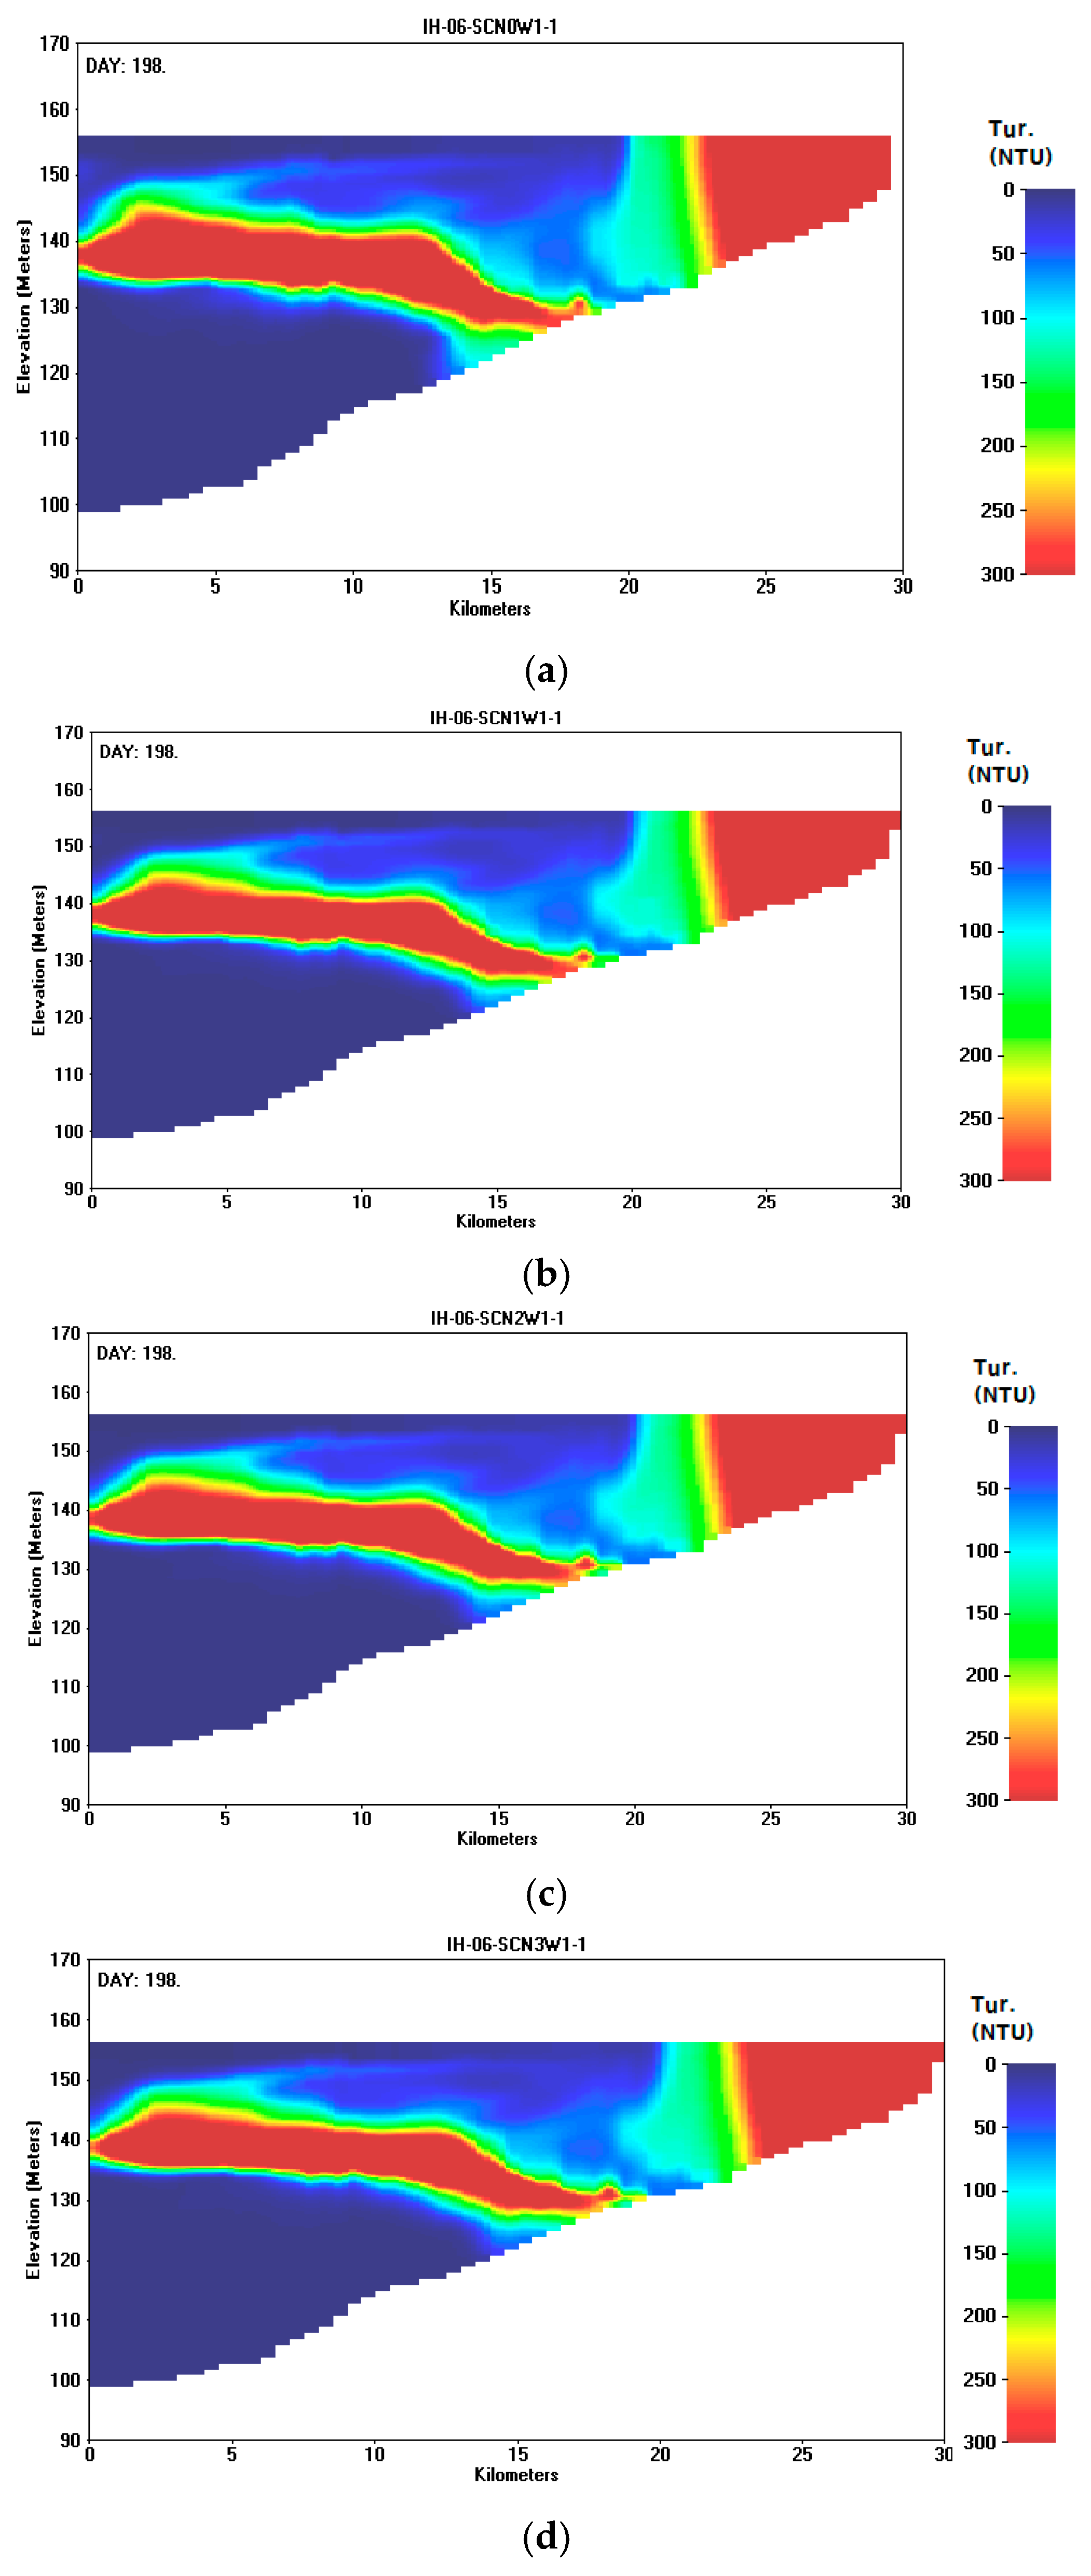
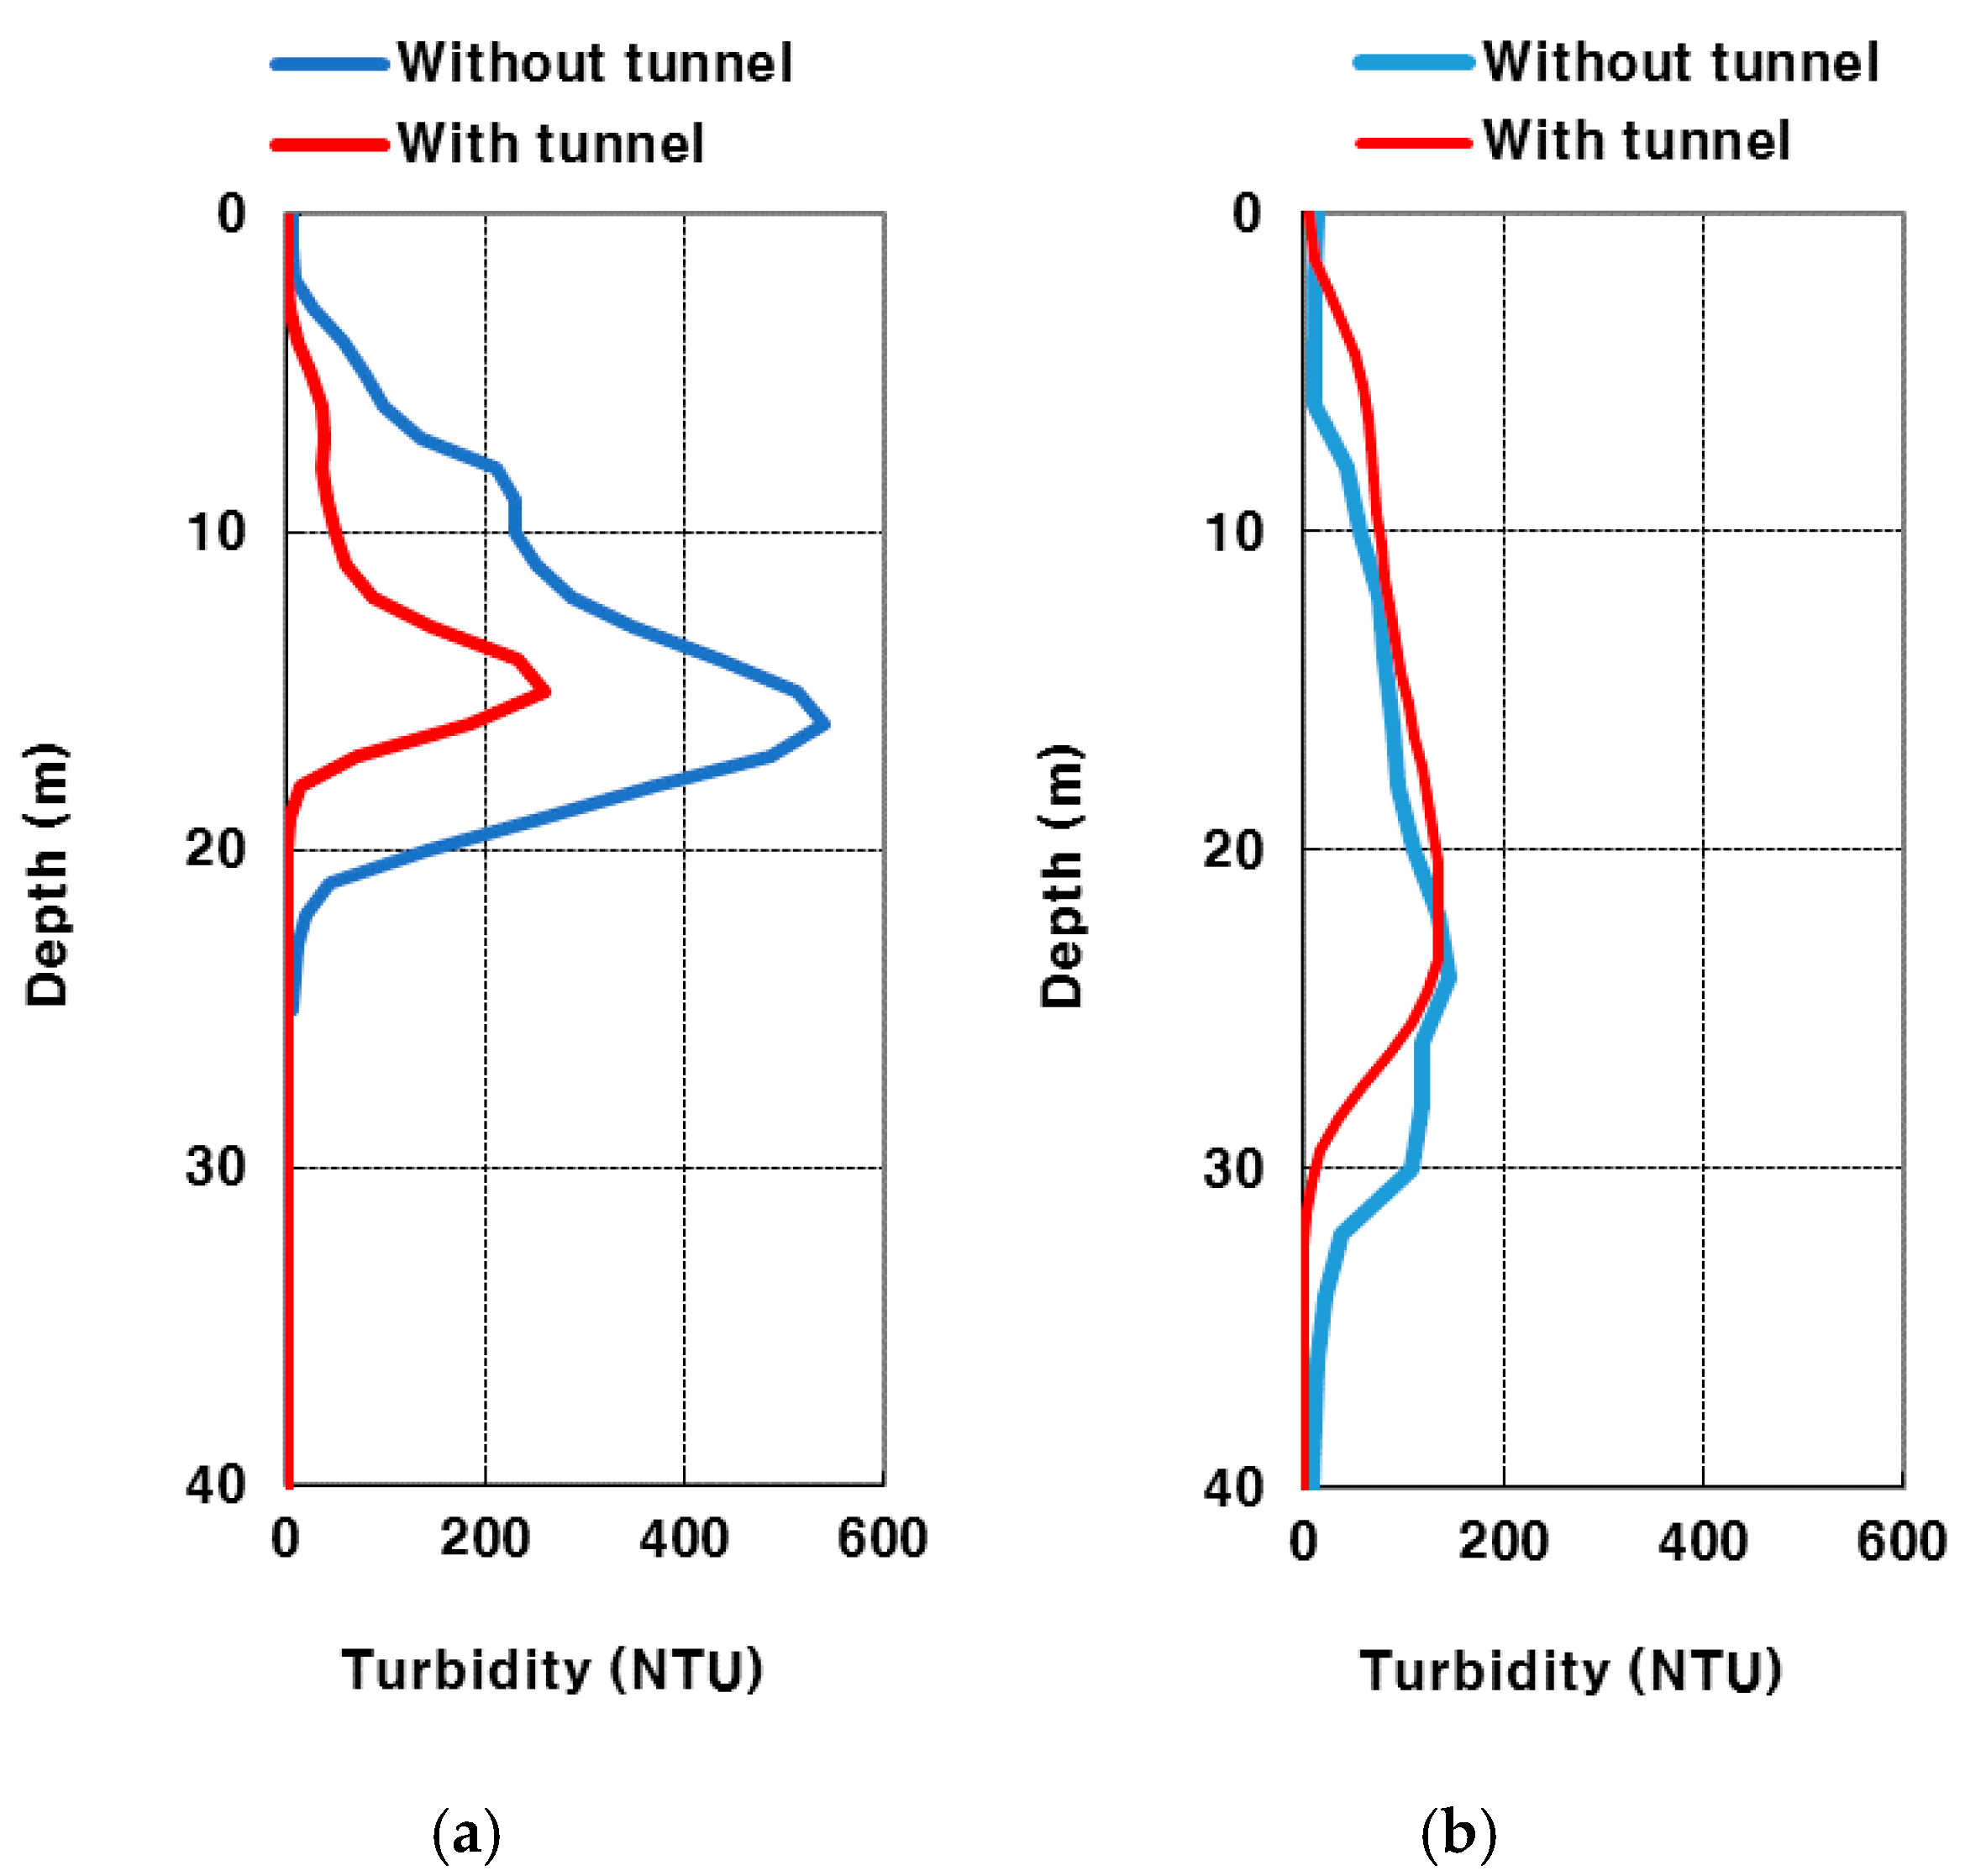
3.1. The Turbidity Distribution Based on Water Transfer Tunnel

Figure 8 shows simulation results of the vertical turbidity distribution based on the water transfer tunnel operation in the 2006 turbidity condition. The water transfer tunnel was developed in 2015. To explore the turbidity change effects between two reservoirs by the water transfer tunnel, it is necessary to apply a reasonable simulation model to have the results when a water transfer tunnel is operated. This study selected four cases to show the impact of the water transfer tunnel. Turbidity without water transfer condition was obtained from the observed data and turbidity with water transfer condition was simulated by the model calibrated, as seen in Figure 4 and Figure 5. As shown in Figure 8, turbidity without water transfer at the Imha reservoir is greater than that with water transfer and turbidity without water transfer at the Andong reservoir is similar to turbidity with water transfer. It indicates that high turbidity current moves from the Imha reservoir to the Andong reservoir with the water transfer, but the turbidity current at the Andong reservoir is not changed as much as the Imha reservoir because the volume of the Andong reservoir is over two times greater than that of the Imha reservoir and the turbidity at Andong reservoir is more mixed and dispersed. Consequently, Figure 8 shows that the calibrated model cogently simulates turbidity movements from the Imha reservoir to the Andong reservoir with water transfer through the tunnel.

3.2. Released Water Turbidity Current Effect Due to a Tunnel Connection

The released flow turbidity was analyzed with and without tunnel connection, as seen in Figure 9. Both the Andong and the Imha reservoirs released flow individually (August–October 2002) due to flood water inflow caused during the rainy season and Typhoon Rusa in 2002 in Figure 6a. Depending on the scenarios, the results showed that the Andong and Imha reservoirs had almost no change in released flow turbidity caused by the tunnel connection in 2002. In 2006, the maximum released flow turbidity from the Imha reservoir was 233.3 NTU without the connection tunnel installation. With the installation of the connecting tunnel, it decreased to 179.9 NTU (Withdrawal 1), 183.4 NTU (Withdrawal 2), and 185.1 NTU (Withdrawal 3)—showing a 20.7–22.9% decrease in rate in Figure 9c. Figure 9c showed that some turbidity in the Imha reservoirs transported to Andong reservoirs through the connecting tunnel.

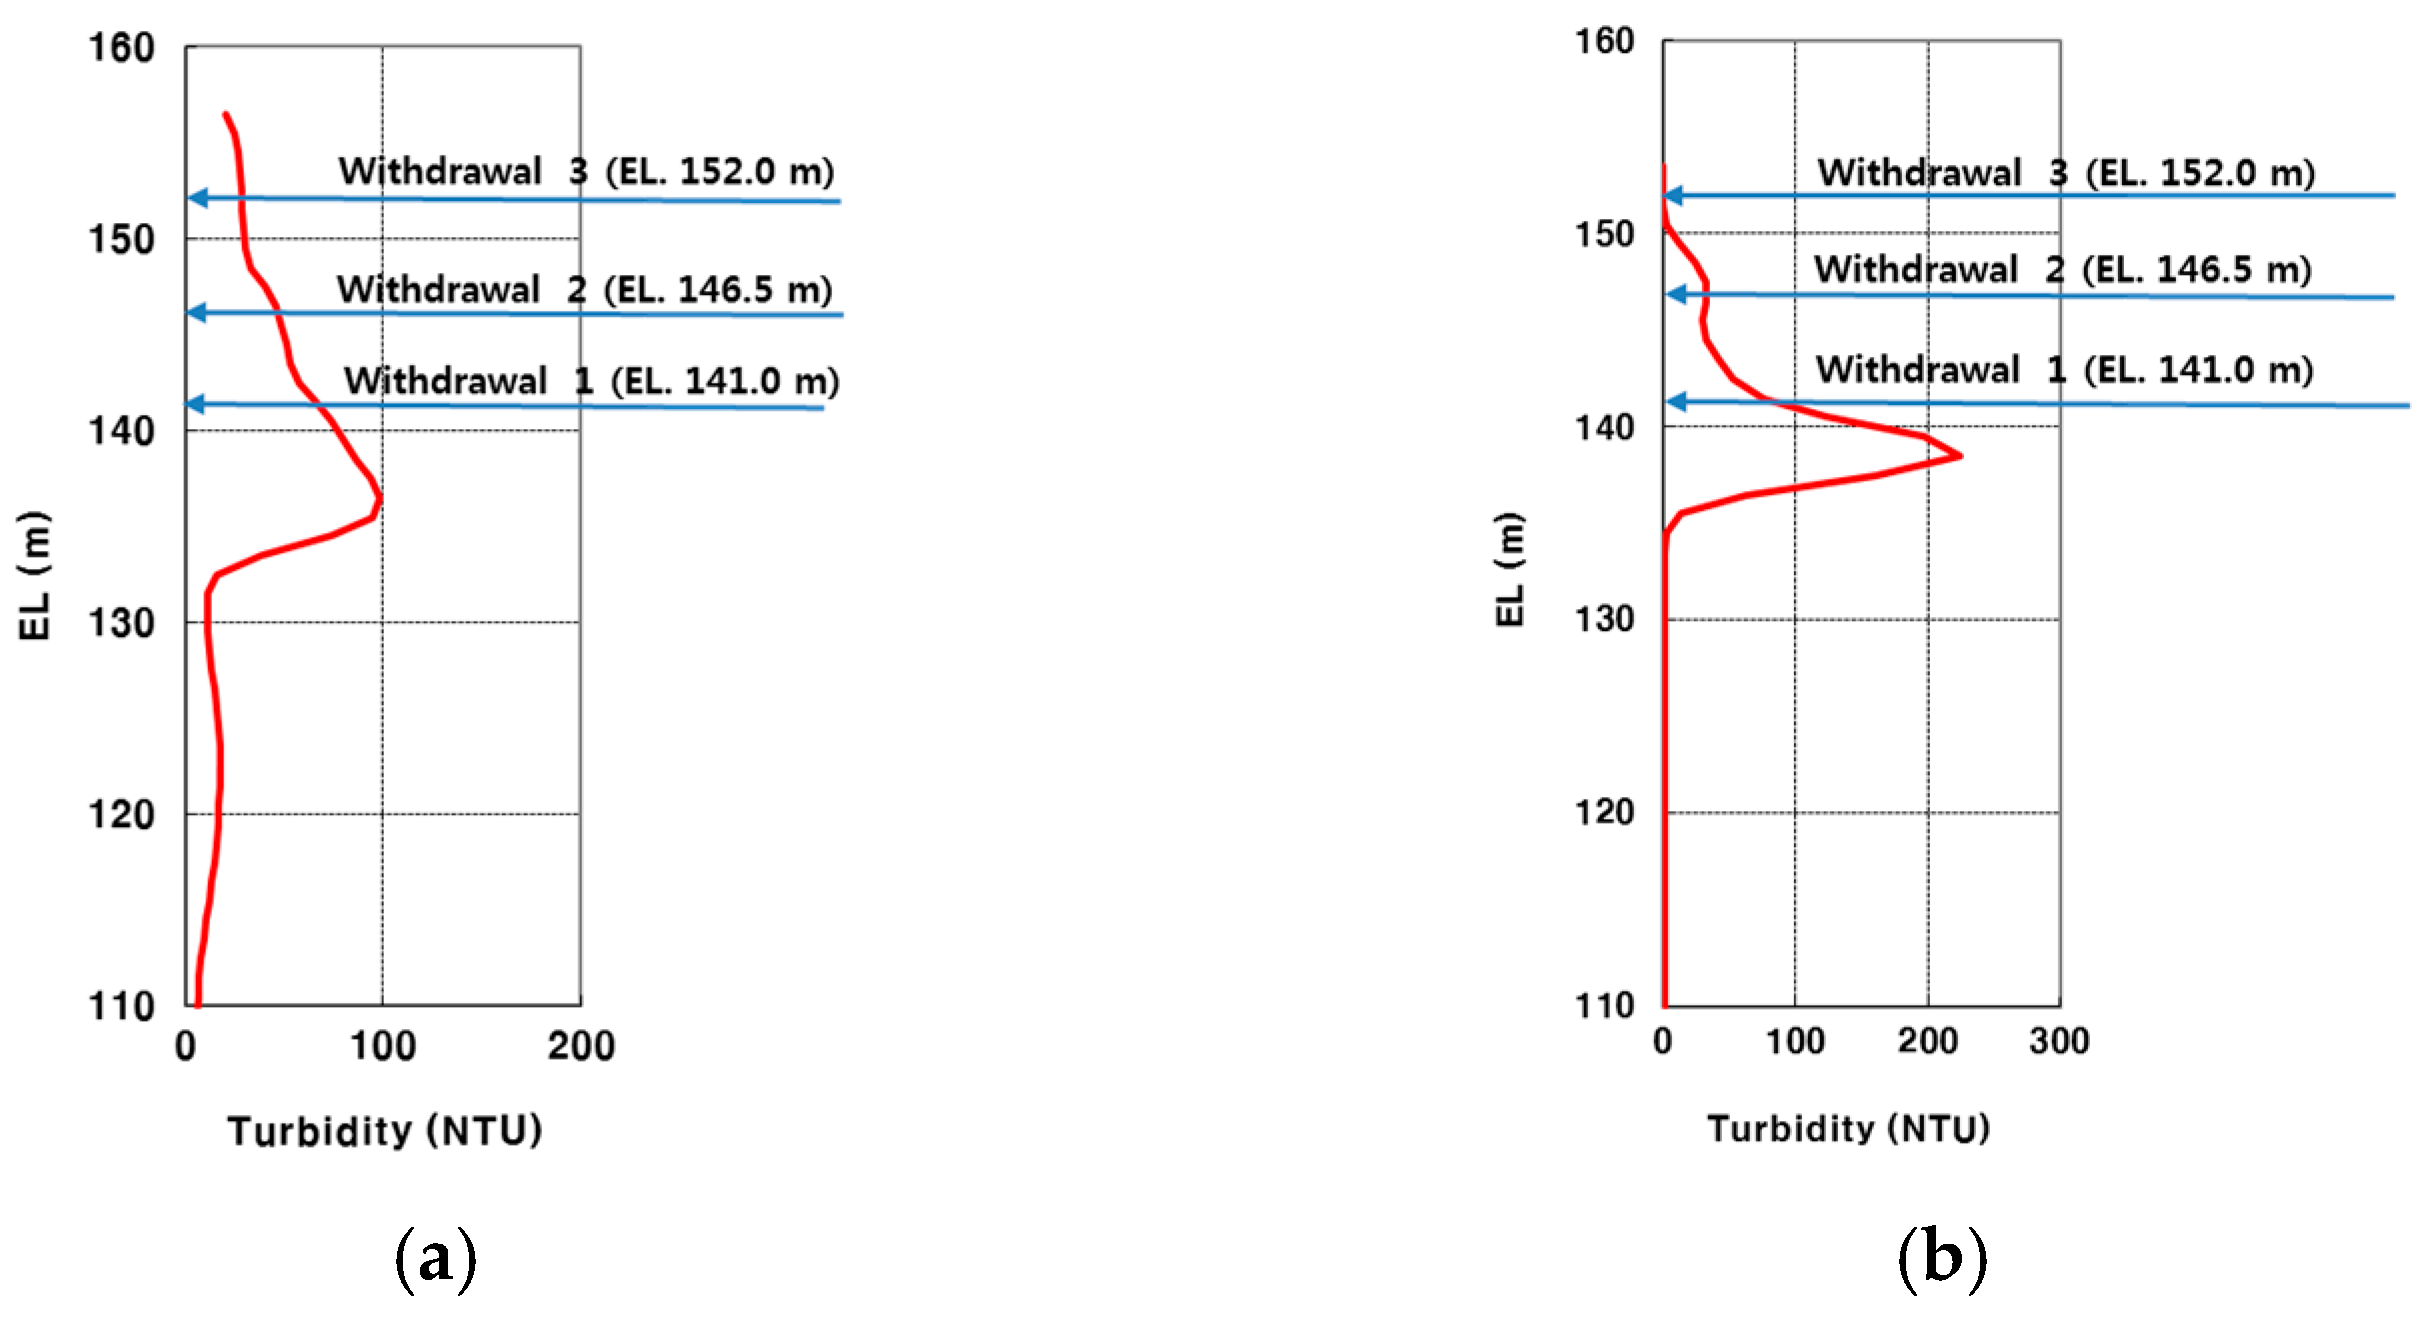
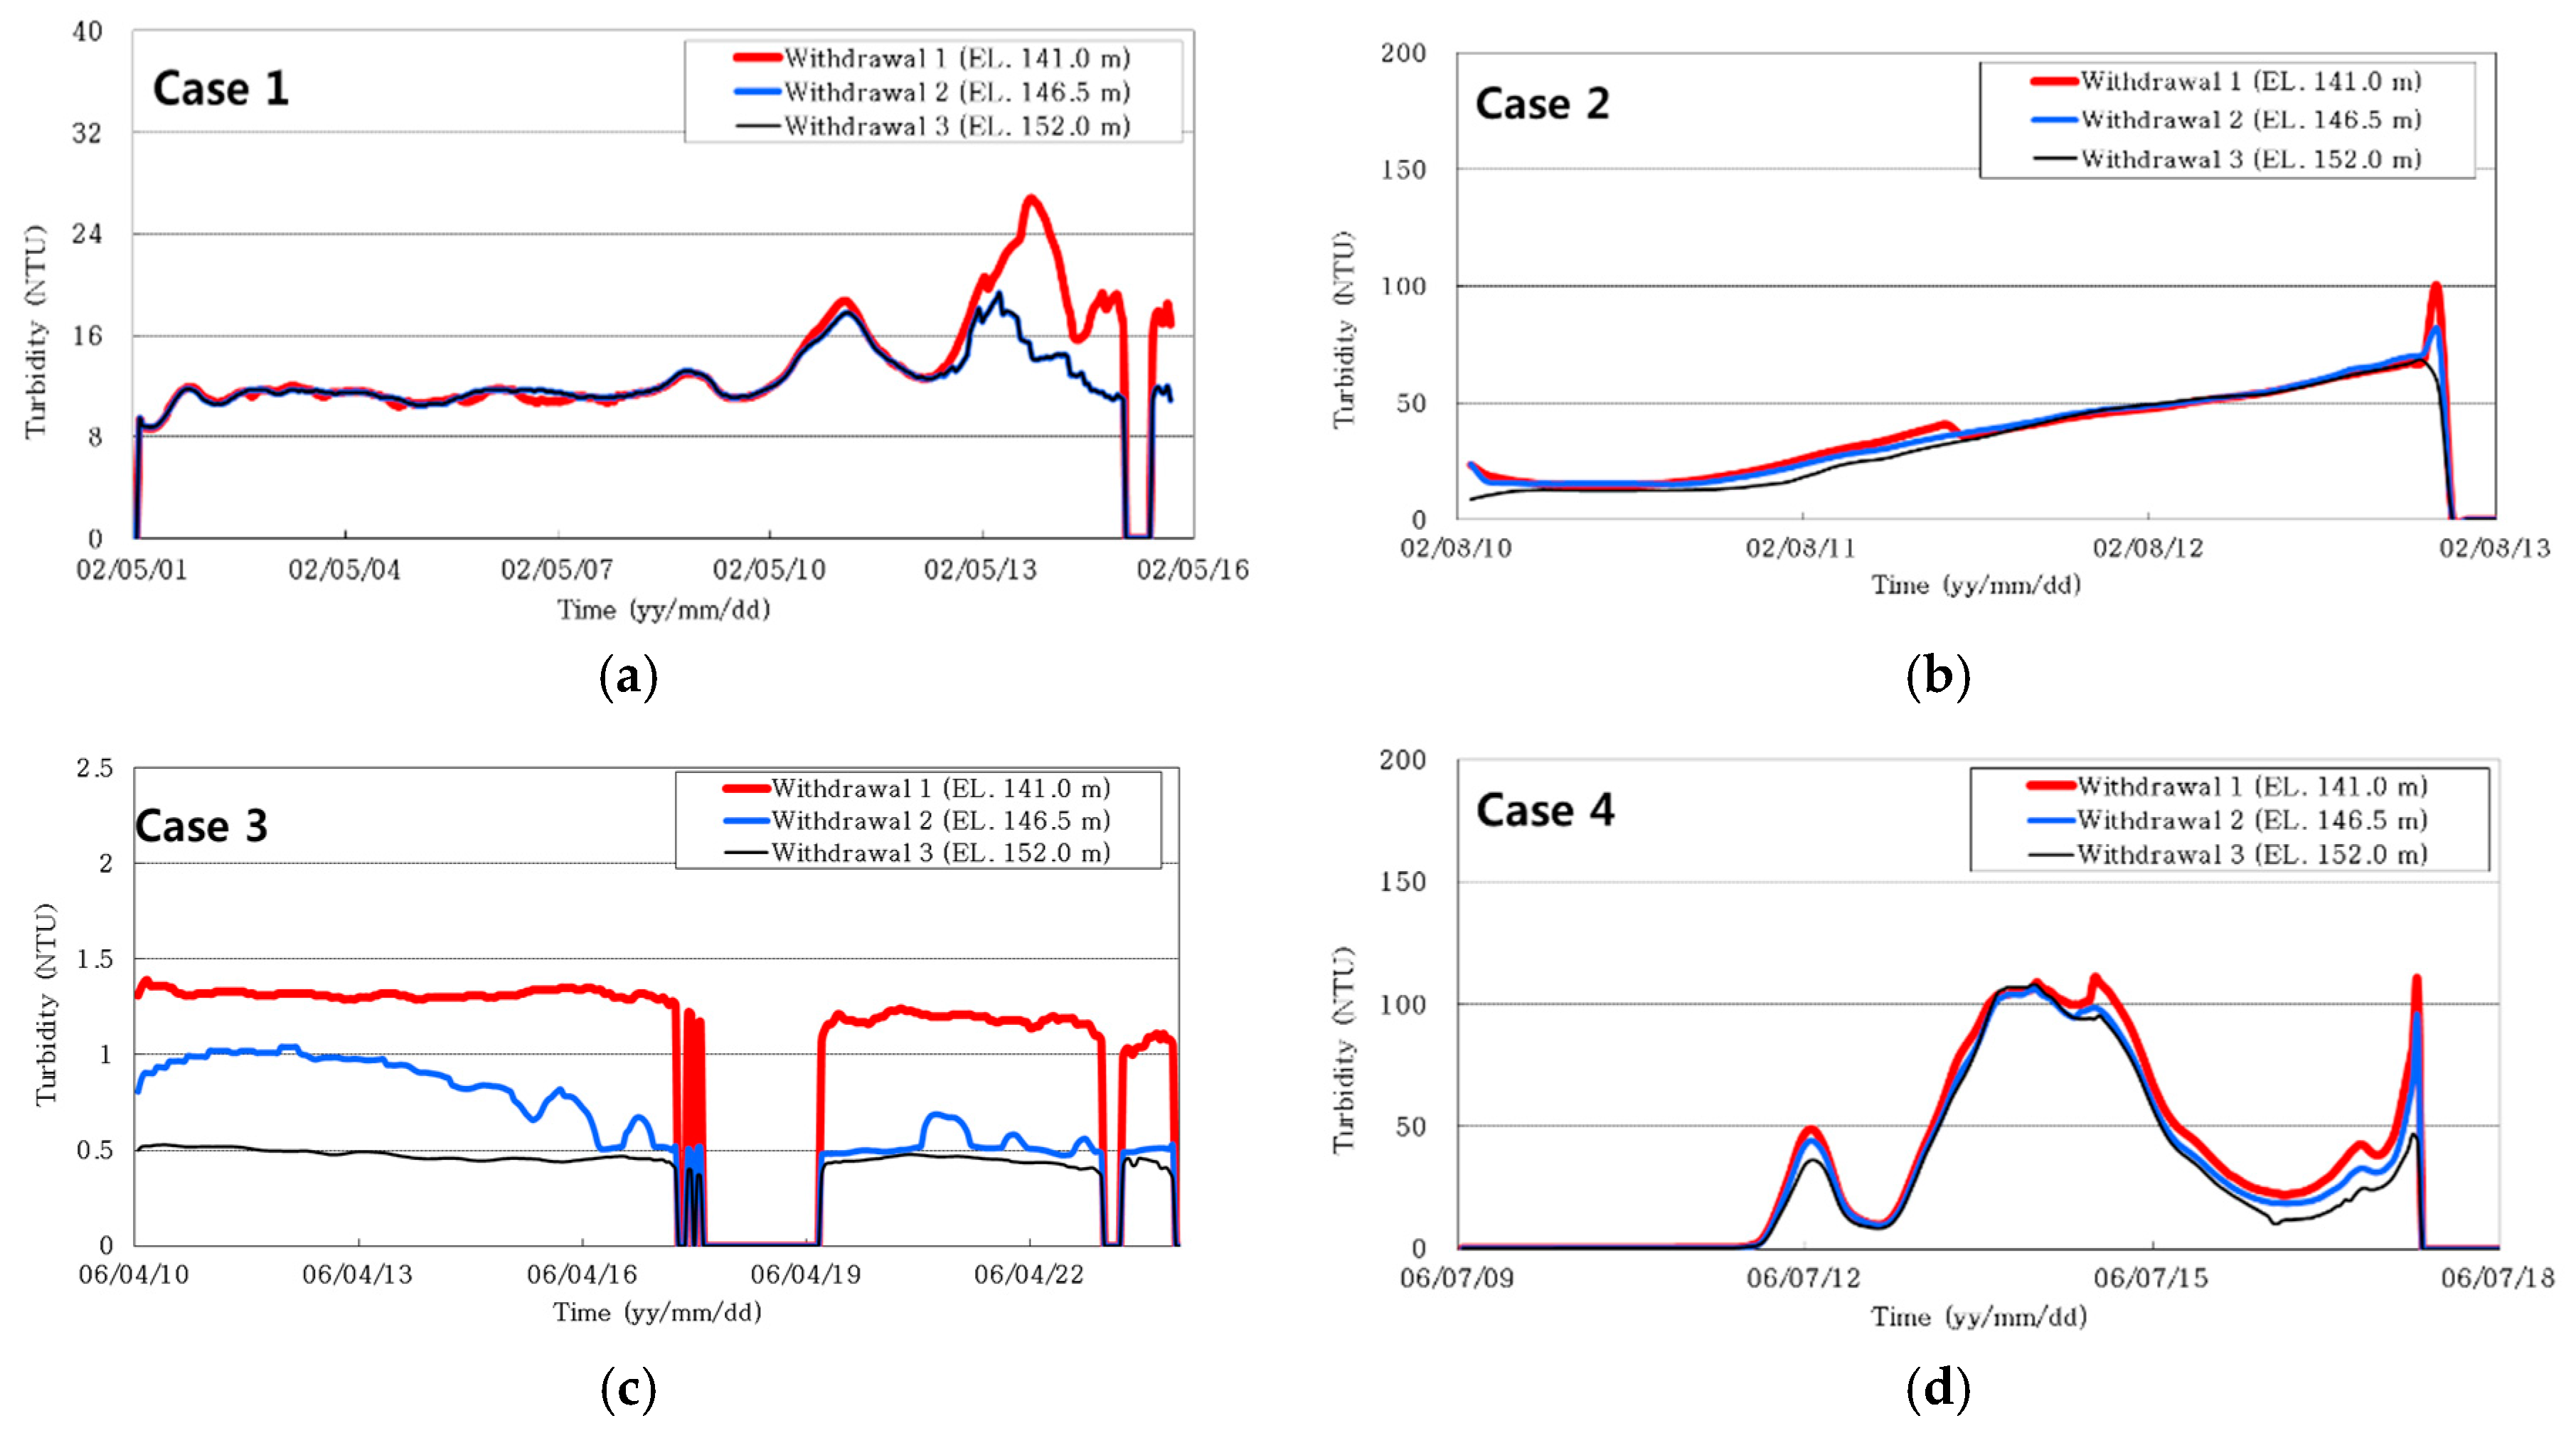
3.3. The Effects of Selective Withdrawal

We investigated the results of reservoir simulation operation as large surplus water moved from the Imha reservoir to the Andong reservoir for three time periods in 2002 and two time periods in 2006 in Figure 6. Figure 10 shows that withdrawal turbidity results depend on different withdrawal depths at the Imha reservoir. All four periods show that withdrawal 1 (EL. 141.0 m) represented higher turbidity than the other two selective withdrawals. It indicates that high turbidity is located around EL. 141 m. Figure 10b,d (Case 2 and Case 4) represents high turbidity because those cases occur in July and August, the rainy season in South Korea. Maximum turbidities in Figure 10b are represented as 98.4, 80.9, and 57.2 NTU for withdrawals at EL. 141.0 m, 146.5 m, and 152.0 m, respectively. In Figure 10d, maximum turbidities were 108.0, 93.3, and 43.8 NTU for withdrawals at EL. 141.0 m, 146.5 m, and 152.0 m, respectively. Average vertical turbidity current profiles by depth were demonstrated in the turbidity current of the Imha reservoir for Case 2 and Case 4, as shown in Figure 11.
Figure 11 shows the averaged vertical turbidity current profiles by depth in the Imha reservoir for Case 2 and Case 4. A simulation of turbidity current layer distribution in depth direction in 2002 and 2006 showed that the connection tunnel location of the Imha reservoir had 10–505 NTU turbidity current layers on a daily basis. The turbidity current distribution at the intake location in the Imha reservoir was simulated as 87.0, 52.0, and 24.0 NTU for selective withdrawal 1, 2, and 3 scenarios, respectively, in Case 2 and 97.0, 21.0, and 1.3 NTU for selective withdrawal 1, 2, and 3 scenarios, respectively, in Case 4. These results matched with Figure 10b,d, demonstrating that high withdrawal turbidity follows the order: withdrawal 1 > withdrawal 2 > withdrawal 3. Figure 12 and Figures S1–S3 show the two-dimensional distribution of the turbidity current at the Imha and Andong reservoirs in Case 2 and Case 4. In 2002, turbidity current at the Imha reservoir is remarkably changed depending on whether or not the tunnel is present, withdrawal 1, withdrawal 2 and withdrawal 3 scenarios in Figure 12 because the reservoir capacity at the Imha reservoir is small enough to show the impact of the water transfer, and withdrawal depth. Figure 12 and Figures S1–S3 show that high turbidity current formed at EL. 130–145 m and turbidity current at the Andong reservoir is generally lower than turbidity current at the Imha reservoir as turbidity current is observed. Understandably, the high turbidity current layer depth in Figure 11 matched with Figure 12.

4. Conclusions

In this study, we investigated the turbidity variations in the connected reservoirs by the model simulation. Especially, we focused on the turbidity current changes of released water and different withdrawal depths in two reservoirs connected by a water transfer tunnel. We applied the CE-QUAL-W2 model to simulate a two-dimensional turbidity current in the connected reservoirs, which are the Andong and Imha reservoirs in the Nakdong River basin, South Korea. We built two different modeling setups depending on reservoirs for 2002 and 2006. Through the simulations for the Andong and Imha reservoirs, we obtained the following specific findings.
(1)
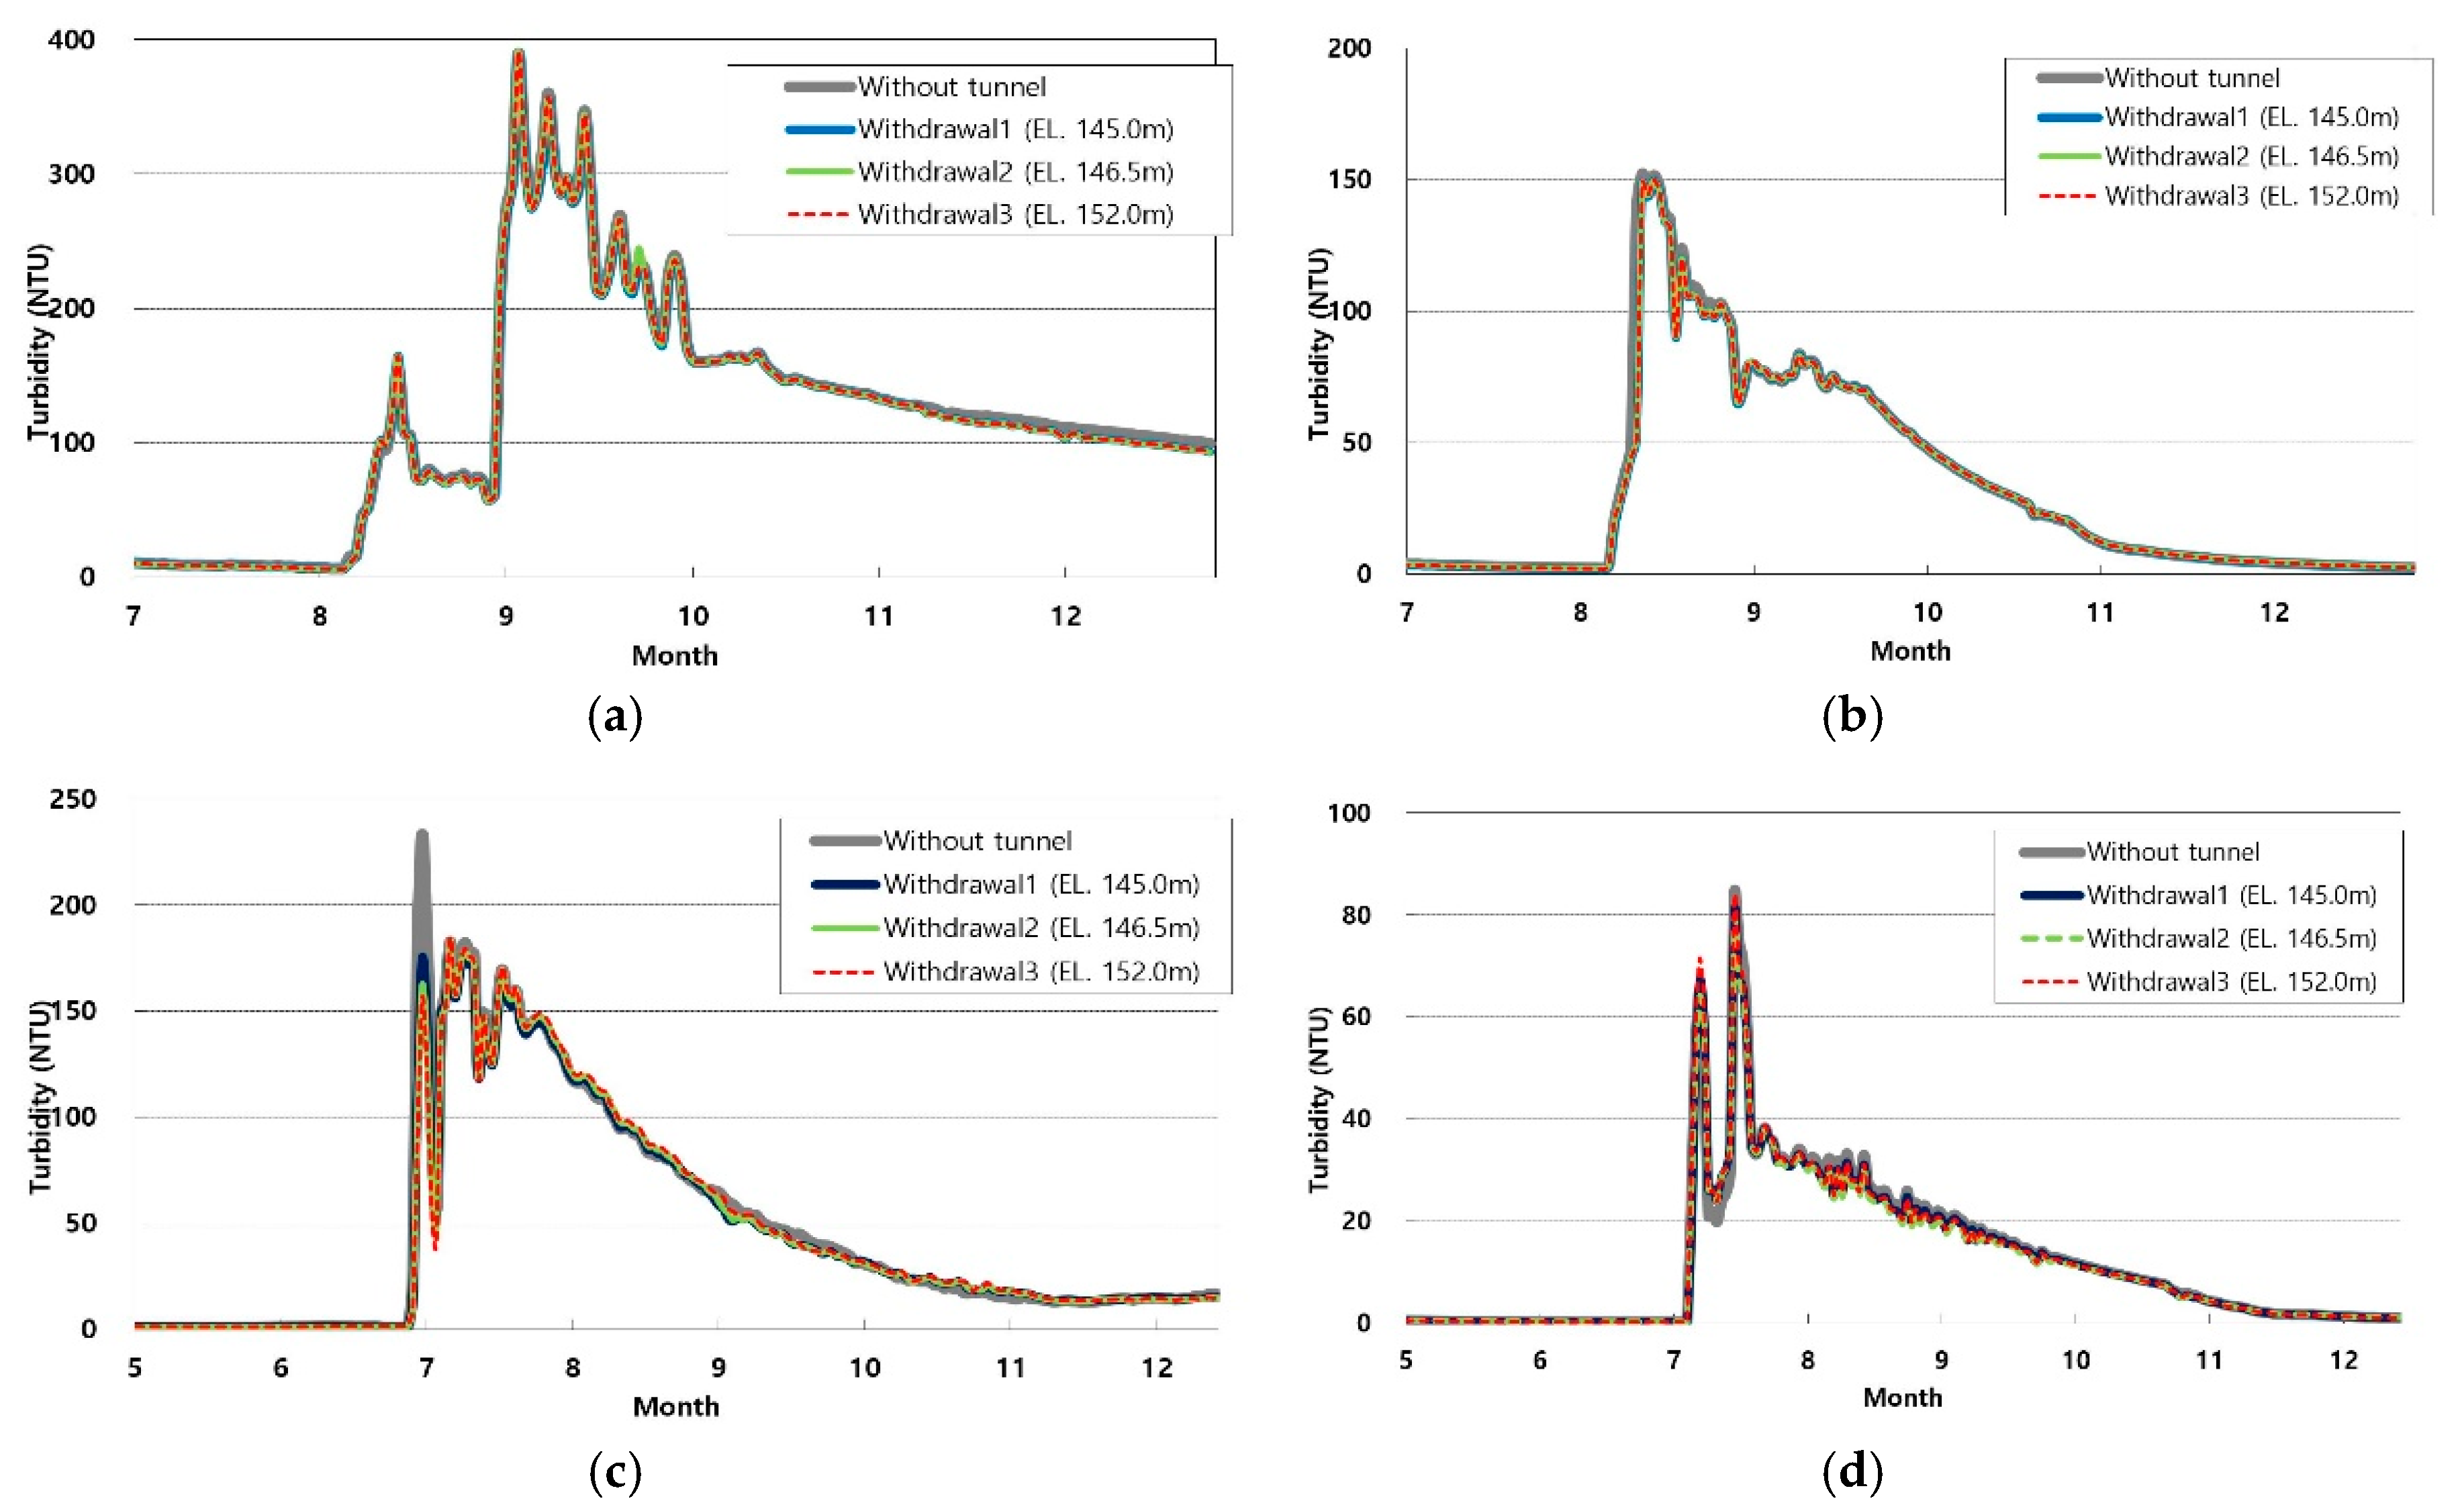
When the water transfer tunnel is constructed, the released water turbidity at Imha reservoir decreased by 22%, compared with the released water turbidity in 2006. However, the released water turbidities at Andong reservoir are similar to those in 2006 whether the water transfer tunnel was operated or not, although Park and Chung [17] were concerned about the large turbidity transport problem at Andong reservoir due to the water transfer tunnel.
(2)
The three withdrawal depths (EL. 141.0 m, EL. 146.5 m, and EL. 152.0 m) are considered and applied to the two water transfer periods (2002 and 2006) from the Imha to Andong reservoirs. The turbidity profiles of the Imha reservoir decreased significantly, but the turbidity profiles of the Andong reservoir only increased slightly because the storage volume of the Andong reservoir is more than twice that of the Imha reservoir. The withdrawal water turbidity in EL 152.0 m shows the lowest turbidity among the three scenarios because turbidity currents mostly occur at about EL. 130–145 m (20–30 m below the water surface) in the Imha reservoir and water density depending on depth in summer season are different due to stratification of reservoirs.
(3)
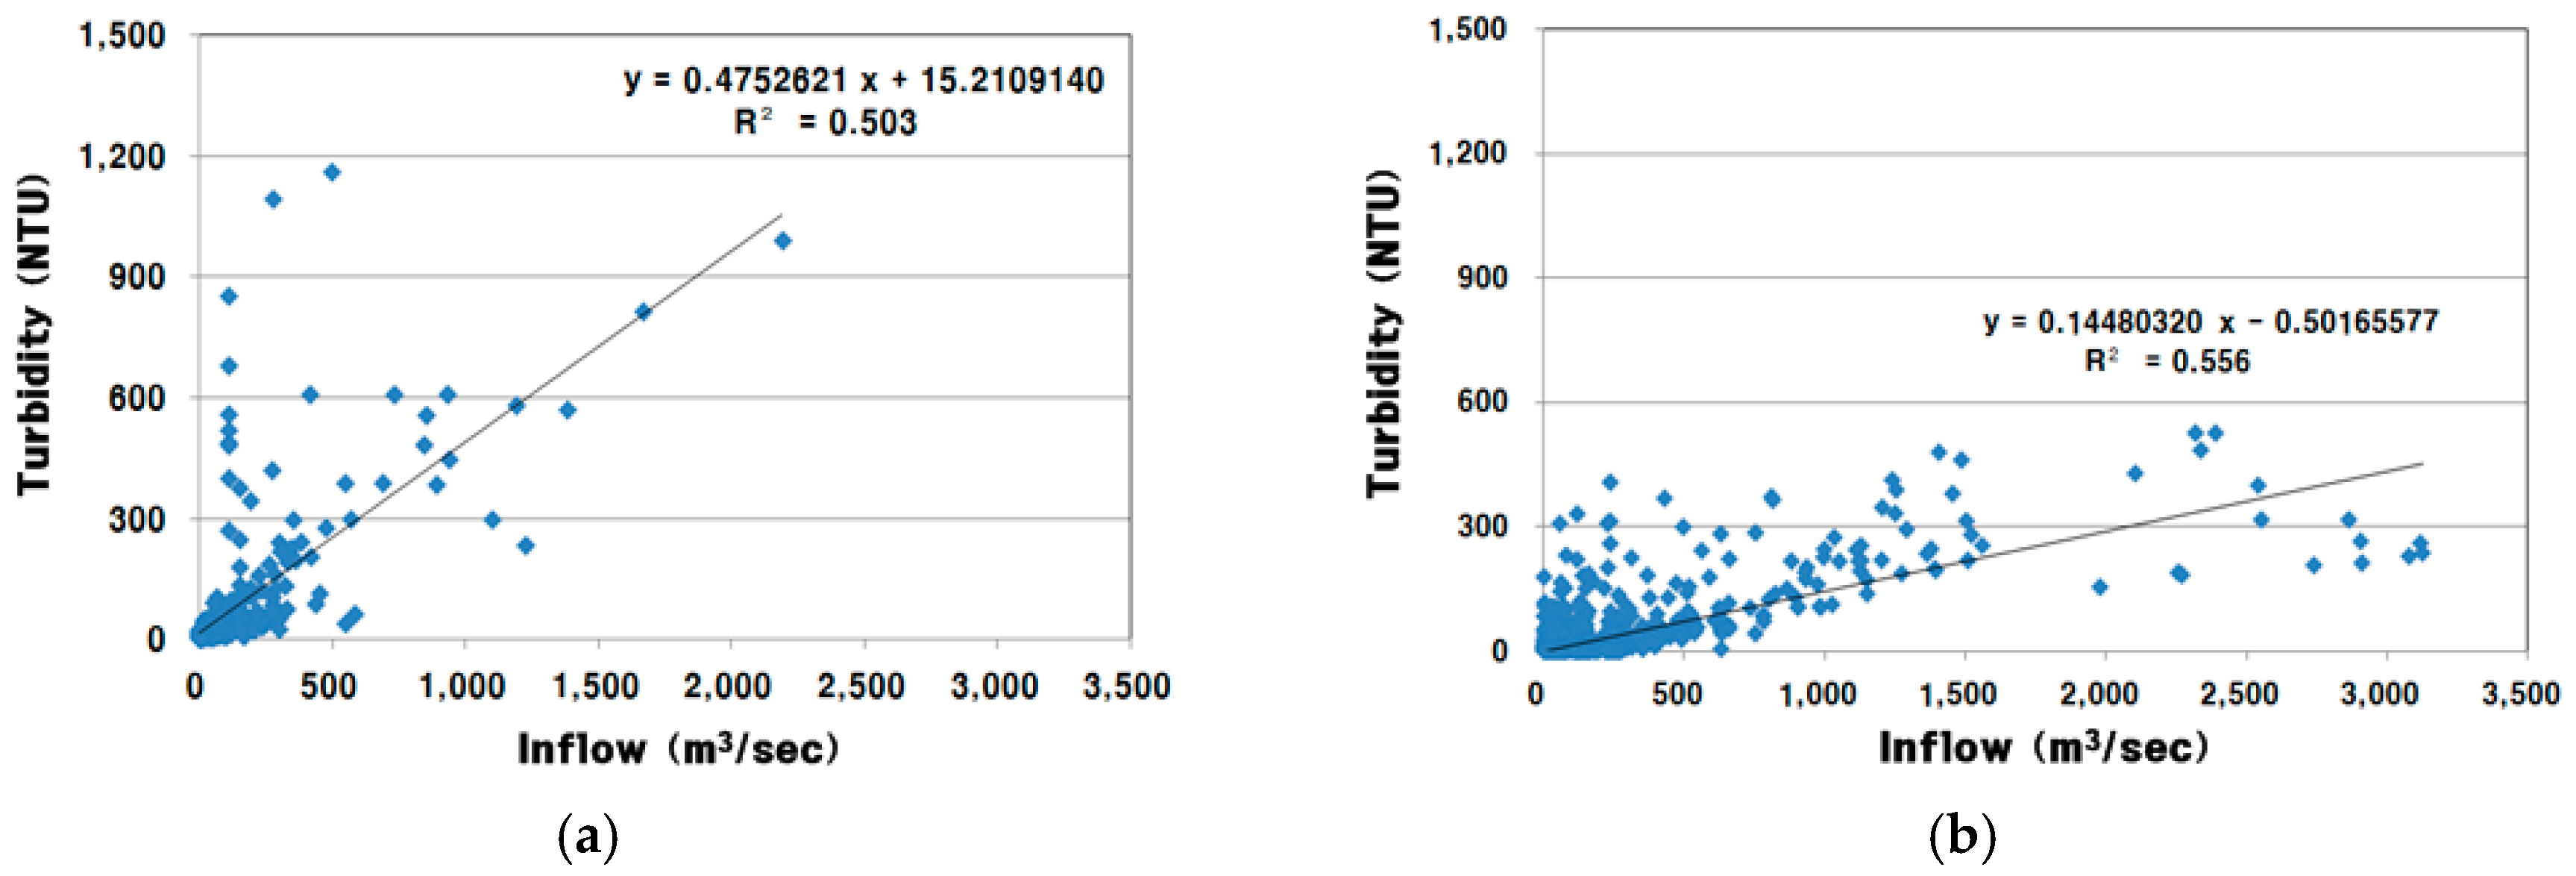
Based on K-water [32], median particle size ds ≅ 20 μm and the ratio of SS (mg/L)/NTU is 0.7 in the Imha reservoir. An and Julien [16] estimated the particle size of turbid density currents at the Imha reservoir to be between 10 and 40 μm, because the settling is not significantly below 10 μm of particle size, and settling occurs predominantly over 40 μm. Also, concentration of turbidity density current, regarded as transitional regime, is expected to be between 2000 and 3000 mg/L at Imha reservoir because the concentration of interflow is represented when below 2000 mg/L and the concentration of underflow is shown when over 3000 mg/L.
Consequently, our results suggest that extracting water from the surface layer is a better withdrawal strategy than withdrawing water from the middle or lower layers in a deep reservoir, particularly in the summer season. However, this study is limited by the fact that the results are simulation values because the observed data are only available since 2015 and high turbidity still has not occurred yet during the operation of the water transfer tunnel. Therefore, in future studies, these calibration model results must be compared and confirmed with the observed turbidity transferred data in the water transfer tunnel operation.

Supplementary Materials

The following are available online at www.mdpi.com/2071-1050/9/6/993/s1, Figure S1: Two-dimensional turbidity distribution on 2002/08/12 (Case 2) at Imha reservoir; (a) Without tunnel; (b) Withdrawal 1 (EL. 141.0 m); (c) Withdrawal 2 (EL. 146.5 m); (d) Withdrawal 3 (EL. 152.0 m); Figure S2: Two-dimensional turbidity distribution on 2002/08/12 (Case 2) at Andong reservoir; (a) Without tunnel; (b) Withdrawal 1 (EL. 141.0 m); (c) Withdrawal 2 (EL. 146.5 m); (d) Withdrawal 3 (EL. 152.0 m); Figure S3: Two-dimensional turbidity distribution on 2006/07/17 (Case 4) at Andong reservoir; (a) Without tunnel; (b) Withdrawal 1 (EL. 141.0 m); (c) Withdrawal 2 (EL. 146.5 m); (d) Withdrawal 3 (EL. 152.0 m).

Acknowledgments

This research was supported by the Basic Science Research Program through the National Research Foundation of Korea (NRF) funded by the Ministry of Science, ICT & Future Planning (2016R1C1B1013711) and by the Korea Agency for Infrastructure Technology Advancement (KAIA) grant funded by the Ministry of Land, Infrastructure and Transport (Grant 17AWMP-B083066-04).

Author Contributions

Jae Chung Park conceived and designed the research; Daeryong Park made a substantial contribution to the interpretation of the results; Myoung-Jin Um and Young-Il Song wrote the manuscript and the analyzed the data; Hyun-Dong Hwang and Mun Mo Kim performed the model simulations and analyzed the data. All authors read and approved the final manuscript.

Conflicts of Interest

The authors declare no conflict of interest.

References

  1. Gökbulak, F.; Serengil, Y.; Özhan, S.; Özyuvacı, N.; Balcı, A.N. Effect of timber harvest on physical water quality characteristics. Water Resour. Manag. 2008, 22, 635–649. [Google Scholar] [CrossRef]
  2. Iglesias, C.; Martínez Torres, J.; García Nieto, P.J.; Alonso Fernández, J.R.; Díaz Muñiz, C.; Piñeiro, J.I.; Taboada, J. Turbidity prediction in a river basin by using artificial neural networks: A case study in Northern Spain. Water Resour. Manag. 2014, 28, 319–331. [Google Scholar] [CrossRef]
  3. Michaud, J.P. A Citizen’s Guide to Understanding and Monitoring Lakes and Streams; Publ. #94-149; Washington State Department of Ecology, Publications Office: Olympia, WA, USA, 1991.
  4. Davies-Colley, R.J.; Smith, D.G. Turbidity, suspended sediment, and water clarity: a review. J. Am. Water Resour. Assoc. 2001, 37, 1085–1101. [Google Scholar] [CrossRef]
  5. Lawler, D.M.; Petts, G.E.; Foster, I.D.L.; Harper, S. Turbidity dynamics during spring storm events in an urban headwater river system: the upper Tame, West Midlands, UK. Sci. Total Environ. 2006, 360, 109–126. [Google Scholar] [CrossRef] [PubMed]
  6. Moore, M.L. NALMS Management Guide for Lakes and Reservoirs. North American Lake Management Society, 1989. Available online: http://www.nalms.org/ (accessed on 1 December 2016).
  7. Kim, Y.; Kim, B. Application of a 2-Dimensional Water Quality Model (CE-QUAL-W2) to the Turbidity Interflow in a Deep Reservoir (Lake Soyang, Korea). Lake Reserv. Manag. 2006, 22, 213–222. [Google Scholar] [CrossRef]
  8. Choi, J.H.; Jeong, S.A.; Park, S.S. Longitudinal-Vertical Hydrodynamic and Turbidity Simulations for Prediction of Dam Reconstruction Effects in Asian Monsoon Area1. J. Am. Water Resour. Assoc. 2007, 43, 1444–1454. [Google Scholar] [CrossRef]
  9. Chung, S.W.; Hipsey, M.R.; Imberger, J. Modelling the propagation of turbid density inflows into a stratified lake: Daecheong Reservoir, Korea. Environ. Model. Softw. 2009, 24, 1467–1482. [Google Scholar] [CrossRef]
  10. Ryu, I.G.; Chung, S.W.; Yoon, S.W. Modelling a turbidity current in Soyang reservoir (Korea) and its control using a selective withdrawal facility. Water Sci. Technol. 2011, 63, 1864–1872. [Google Scholar] [CrossRef] [PubMed]
  11. Kim, B.S.; Kim, B.K.; Kwon, H.H. Assessment of the impact of climate change on the flow regime of the Han River basin using indicators of hydrologic alteration. Hydrol. Process. 2011, 25, 691–704. [Google Scholar] [CrossRef]
  12. Chung, S.W. Density flow regime of turbidity current into a stratified reservoir and vertical two-dimensional modelling. J. Korea Soc. Environ. Eng. 2004, 26, 970–978. (In Korean) [Google Scholar]
  13. Park, J.-C.; Choi, J.-H.; Song, Y.-I.; Yu, K.-M.; Kang, B.-S.; Song, S.-J. Simulation of Turbid Water According to Watershed Runoff and Withdrawal Type in a Constructing Reservoir. J. Environ. Impact Assess. 2010, 19, 247–257. (In Korean) [Google Scholar]
  14. Yi, Y.; Kim, Y.D.; Park, K.; Kim, W. Two dimensional numerical modeling of turbidity variation in Imha reservoir. J. Korea Soc. Civ. Eng. 2005, 25, 237–334. (In Korean) [Google Scholar]
  15. Lee, S.; Kim, J.; Noh, J.; Ko, I.H. Assessment of selective withdrawal facility in the Imha reservoir using CE-QUAL-W2 model. J. Korean Soc. Water Environ. 2007, 23, 228–235. (In Korean) [Google Scholar]
  16. An, S.; Julien, P.Y. Three-dimensional modeling of turbid density currents in Imha Reservoir, South Korea. J. Hydraul. Eng. 2014, 140, 05014004. [Google Scholar] [CrossRef]
  17. Park, H.-S.; Chung, S.-W. Water Transportation and Stratification Modification in the Andong-Imha Linked Reservoirs System. J. Korean Soc. Water Environ. 2014, 30, 31–43. (In Korean) [Google Scholar] [CrossRef]
  18. Park, J.C.; Song, Y.I.; Jung, Y.M.; Song, S.J.; Park, D. Assessment of the environmental, social and economic benefits of a water transfer tunnel in the Nakdong River, Korea. Int. J. Water Resour. Dev. 2015, 31, 618–629. [Google Scholar] [CrossRef]
  19. K-water. A Report on the Feasibility of the Andong-Imha Reservoir Connection Project; K-water: Daejeon, Korea, 2011. (In Korean) [Google Scholar]
  20. Ma, J.; Liu, D.; Wells, S.A.; Tang, H.; Ji, D.; Yang, Z. Modeling density currents in a typical tributary of the Three Gorges Reservoir, China. Ecol. Model. 2015, 296, 113–125. [Google Scholar] [CrossRef]
  21. Vandenberg, J.A.; Prakash, S.; Buchak, E.M. Sediment diagenesis module for CE-QUAL-W2. Part 1: conceptual formulation. Environ. Model. Assess. 2015, 20, 239–247. [Google Scholar] [CrossRef]
  22. Antar, N.; Moodie, T.B. Weakly nonhydrostatic effects in compositionally-driven gravity flows. Stud. Appl. Math. 2003, 111, 239–267. [Google Scholar] [CrossRef]
  23. Lai, Y.G.; Weber, L.J.; Patel, V.C. Nonhydrostatic three-dimensional model for hydraulic flow simulation. I: formulation and verification. J. Hydraul. Eng. 2003, 129, 196–205. [Google Scholar] [CrossRef]
  24. Çalışkan, A.; Elçi, Ş. Effects of Selective Withdrawal on Hydrodynamics of a Stratified Reservoir. Water Resour. Manag. 2008, 23, 1257–1273. [Google Scholar] [CrossRef]
  25. Cole, T.M.; Wells, S.A. CE-QUAL-W2: A Two-Dimensional, Laterally Averaged, Hydrodynamic and Water Quality Model, version 3.71; Portland State University: Portland, OR, USA, 2013. [Google Scholar]
  26. Kim, B.; Kim, Y. Phosphorus cycle in a deep reservoir in Asian monsoon area (Lake Soyang, Korea) and the modeling with a 2-D hydrodynamic water quality model [CE-QUAL-W2]. Korean J. Limnol. 2004, 37, 205–212. (In Korean) [Google Scholar]
  27. Bonalumi, M.; Anselmetti, F.S.; Wüest, A.; Schmid, M. Modeling of temperature and turbidity in a natural lake and a reservoir connected by pumped-storage operations. Water Resour. Res. 2012, 48, W08508. [Google Scholar] [CrossRef]
  28. K-Water. Turbidity Management Plan through Joint Reservoir Operation; K-Water: Daejeon, Korea, 2008. (In Korean) [Google Scholar]
  29. Yi, Y.K.; Lee, S.U.; Koh, D.K. Water temperature prediction of streams entering into Imha reservoir using multi-regression method. J. Korean Soc. Water Environ. 2006, 22, 920–926. (In Korean) [Google Scholar]
  30. Cole, T.; Buchak, E.M. CE-QUAL-W2: A Two Dimensional, Laterally Averaged, Hydrodynamic and Water Quality Model; Version 3.2 User’s Manual, Instructions Report EL-95-1; U.S. Army Engineer Waterways Experiment Station: Vicksburg, MS, USA, 2003. [Google Scholar]
  31. Chung, S.W.; Park, J.H.; Kim, Y.K.; Yoon, S.W. Application of CE-QUAL-W2 to Daecheong Reservoir for Eutrophication Simulation. J. Korean Soc. Water Environ. 2007, 23, 52–63. (In Korean) [Google Scholar]
  32. K-water. Investigation of the Relationship between Turbid Water and Water Quality in Imha Reservoir, Technical Note; K-water: Daejeon, Korea, 2007. (In Korean) [Google Scholar]
Figure 1. Location of the Andong and Imha reservoirs and the water transfer tunnel in the Nakdong River basin in South Korea (Park et al., 2015 [18]).
Sustainability 09 00993 g001
Figure 2. Locations of observation stations for turbidity and water temperature with grid construction; (a) Imha reservoir; (b) Andong reservoir.
Sustainability 09 00993 g002
Figure 3. The regression relationship between the inflow discharge and inflow turbidity for (a) Imha reservoir; (b) Andong reservoir.
Sustainability 09 00993 g003
Figure 4. Water temperature (left) and turbidity (right) calibration results at Dam station in the Imha reservoir (2006); (a) July 12; (b) July 14; (c) July 15; (d) July 17. (In Figure 4, hollow circles and solid lines denote actual values and simulation values, respectively.)
Sustainability 09 00993 g004
Figure 5. Water temperature (left) and turbidity (right) calibration results at Nosan station in the Andong reservoir (2006); (a) July 19; (b) August 3; (c) August 16; (d) August 31; (e) September 28. (In Figure 5, hollow circles and solid lines denote actual values and simulation values, respectively.)
Sustainability 09 00993 g005
Figure 6. Selective periods for the water transfer from Imha reservoir to Andong reservoir through the tunnel; (a) 2002 year; (b) 2006 year.
Sustainability 09 00993 g006
Figure 7. Model of a water transfer tunnel consideration framework for reservoir turbidity modeling in this study.
Sustainability 09 00993 g007
Figure 8. Average turbidity distribution effects depending on the water transfer tunnel over 14–19 July 2006 (Case 4); (a) Imha reservoir; (b) Andong reservoir.
Sustainability 09 00993 g008
Figure 9. Released flow turbidity simulation results; (a) Imha reservoir in 2002; (b) Andong reservoir in 2002; (c) Imha reservoir in 2006; (d) Andong reservoir in 2006.
Sustainability 09 00993 g009
Figure 10. Withdrawal turbidity simulation based on withdrawal depth at Imha reservoir based on Figure 6; (a) Case 1; (b) Case 2; (c) Case 3; (d) Case 4.
Sustainability 09 00993 g010
Figure 11. Averaged vertical turbidity profiles with the water transfer tunnel in Imha reservoirs; (a) Case 2; (b) Case 4.
Sustainability 09 00993 g011
Figure 12. Two-dimensional turbidity distribution on 17 July 2006 (Case 4) at Imha reservoir; (a) Without tunnel; (b) Withdrawal 1 (EL. 141.0 m); (c) Withdrawal 2 (EL. 146.5 m); (d) Withdrawal 3 (EL. 152.0 m).
Sustainability 09 00993 g012
Table 1. Summary of the Andong and Imha reservoir characteristics (Park and Chung, 2014 [17]).
DescriptionAndong ReservoirImha Reservoir
Dam crest elevation (EL. m)166168
Annual mean precipitation (mm)950.0987.1
Watershed area (km2)15841361
Water surface area (km2)51.526.4
Total storage volume (×106 m3)1248595
Normal water level (EL. m)160163
Dam height (m)8373
Dam length (m)612515
Table 2. Parameters used for turbidity current simulation in CE-QUAL-W2.
ParametersUnitDefault (Cole and Buchak, 2003 [30])Imha Reservoir (Lee et al., 2007 [15])Daecheong Reservoir (Chung et al. 2007 [31])This Study
Horizontal eddy viscositym2/s1111
Horizontal eddy diffusivitym2/s1111
Coefficient of bottom heat exchangeW/m2/s0.3-0.30.3
Solar radiation absorbed in surface layer-0.450.60.60.45
Suspended Solids Settling ratem/day---0.05~0.1
Carbonaceous biochemical oxygen demand (CBOD) decay rate1/day---0.03
Table 3. Simulation scenario composition.
Simulation Period (Year)Description
2002Without a water transfer tunnel
With a water transfer tunnelWithdrawal 1 (EL. 141.0 m)
Withdrawal 2 (EL. 146.5 m)
Withdrawal 3 (EL. 152.0 m)
2006Without a water transfer tunnel
With a water transfer tunnelWithdrawal 1 (EL. 141.0 m)
Withdrawal 2 (EL. 146.5 m)
Withdrawal 3 (EL. 152.0 m)

