Article

Alfalfa Water Use and Yield under Different Sprinkler Irrigation Regimes in North Arid Regions of China

Research Center for Grassland Ecology and Resources, Beijing Forestry University, No. 35 Tsinghua East Road, Beijing 100083, China
*
Author to whom correspondence should be addressed.
Sustainability 2017, 9(8), 1380; https://doi.org/10.3390/su9081380
Submission received: 27 April 2017 / Revised: 26 July 2017 / Accepted: 2 August 2017 / Published: 4 August 2017
(This article belongs to the Special Issue Sustainable Water Resources Management)

Abstract

:
Alfalfa (Medicago sativa) is one of the major crops grown in Northern China in recent years, however, the current serious water shortage conditions present a challenge to the growth of this crop, especially if efficient use of water is considered in forage production for sustainability. This study aimed to evaluate alfalfa productivity and water use efficiency (WUE) under different sprinkler irrigation levels. This experiment was conducted at Shiyanghe Experimental Station for Water-Saving in Agriculture and Ecology of China Agricultural University in Wuwei, Gansu, China, over a period of two years. There were three irrigation treatments: A1: 100% measured evapotranspiration (ETc) of alfalfa; A2: irrigation amount was 66% of A1; A3: irrigation amount was 33% of A1; and a control of A4: no irrigation during the growing season. A randomized block design with three replications were applied. The results showed that the ETc and forage yield of alfalfa decreased, while WUE and crude protein (CP) increased with the decreasing irrigation amounts. The seasonal average ETc and yield ranged from 412 mm to 809 mm and from 11,577 to 18,636 kg/ha, respectively, under different irrigation levels. The highest yields were obtained from the first growth period in all treatments in both years, due to the winter irrigation and the longest growth period. Alfalfa grown under lesser irrigation treatment conditions had higher variability in ETc and yield, mainly due to the variability in the amount of rainfall during the growth period. The seasonal average WUE of treatments ranged from 22.78 to 26.84 kg/(mm·ha), and the highest WUE was obtained at the first growth period, regardless of treatments. Seasonal average CP content ranged from 18.99% to 22.99%. A significant linear relationship was found between yield and ETc or irrigation amount, and the fitting results varied between growth periods and years. The present results also implied that winter irrigation provided the space for saving water and should be applied at the end of each growing season to fill the soil profile, and to maintain a greater yield in the next growing season. During the growing season, more irrigation should be concentrated in the early growth period, especially in the second growth period.

1. Introduction

Since the Chinese government released the Alfalfa Development Plan for Dairy Industry Revitalization in January 2012, the planting area of alfalfa in China reached 4.71 million hectares by the end of 2015. At the same time, the hay yield of high-quality alfalfa increased by 8.2 times over the measurements taken in 2010 [1]. Even so, every year China still has to import a significant amount of alfalfa forage. For example, the imports in 2016 were 1.46 million tons [2]. Alfalfa cultivation in China is mainly distributed in arid and semi-arid regions of the north and the northwest parts of the country. According to 2015 statistics regarding the six provinces in North and Northwest China, high-quality alfalfa acreage accounted for 89.8% of the country [1]. The north and northwest regions of China are located in arid and semi-arid areas where precipitation is scarce, evaporation is strong, and water resources are the key to restricting alfalfa production. The serious challenge of developing alfalfa production and sustainable use of water resources must be faced.
As the water shortage has become one of most serious challenges in alfalfa cultivation, improving the productivity and heritability of alfalfa under water shortage conditions is an important goal; in light of this, some studies have focused on the varieties of drought resistant alfalfa plants [3], especially in the seedling stage [4]. Besides breeding, improved irrigation methods are also key in enhancing the productivity of the crop. Sprinkler irrigation is a kind of advanced irrigation method which could change a microclimate due to irrigation water evaporation during irrigation [5,6,7,8,9]. The changes could decrease the transpiration of crops [7,10,11] and the canopy temperature [5,7], as well as improve photosynthesis [12]. Sprinkler irrigation is widely used in wheat and maize cultivation [13,14]. In recent years, the center-pivot sprinkler irrigation system has been a popular irrigation method worldwide [15] in grass cultivation [16,17], including alfalfa [18]. In Northern China, the center-pivot sprinkler irrigation system is also promoted for alfalfa cultivation [19]. Knowing the ETc, yield and WUE are important factors in alfalfa production.
Many studies have researched the production of alfalfa under different irrigation regimens in different regions. According to the summary of Lindenmayer et al. [20], the growing season ETc averaged 910 mm over full irrigation treatments, 800 mm for deficit irrigation, and 390 mm for dry land treatments. The average annual yield was 16,600 kg/ha under full irrigation, 11,100 kg/ha under a variety of deficit irrigation treatments, and 6000 kg/ha under arid conditions. The ETc, yield, and WUE of alfalfa are influenced by irrigation levels, crop management, crop stand age, water table, and cropping systems. Lamm et al. [21] illustrated a large annual difference in yield performance, while the irrigation levels did not contribute much to the yield of alfalfa since alfalfa roots can extend deep into the ground to extract water, making it tolerant to drought stress.
Although many studies are available on alfalfa water consumption and the factors affecting alfalfa growth and yield under different irrigation management systems, the alfalfa production-water function varies with site, year, and the time of the year [20] and cannot be freely transferred from study to study. It is necessary to investigate the ETc, yield, and WUE of alfalfa under specific climate conditions and management. There have been some in-field studies on the production of alfalfa in Northern China, but these studies were more about the difference of yield and WUE between cultivars [22,23] or the cultivation method [24,25]; few investigated the production of alfalfa under sprinkler irrigation. The goal of this study was to produce alfalfa in Northern China with a center-pivot sprinkler irrigation system to evaluate the effects of different irrigation amounts on alfalfa yield and WUE in the arid northwest region of China.

2. Materials and Methods

2.1. Experimental Site

The field experiments were conducted during 2014 and 2015 at Shiyanghe Agricultural and Ecological Water Saving Experimental Station, Wuwei, Gansu Province, Northwest China, with a latitude of 37°52′20′′N, 102°50′50′′E, and an elevation of 1581 m above sea level. The experimental site is located in a typical inland desert climate zone, where the mean annual temperature is 8 °C, the annual precipitation is 164.4 mm (mainly concentrated in July and August), the annual pan evaporation is approximately 1132–1509 mm, the average annual duration of sunshine is 3000 h, and the average number of frost-free days is 150. The groundwater table is 40–50 m below the ground surface. The soil in the experimental field was sandy loam with a mean dry bulk density of 1.52 g/cm3, a porosity of 52%, and a field capacity (FC) of 0.29 cm3/cm3 for the 0–160 cm layer. Meteorological data, including precipitation, solar radiation, wind speed, air temperature, and relative humidity, were downloaded from the automatic weather station located in the experimental station.
Monthly rainfall and average temperature during growing seasons in 2014 and 2015 are presented in Figure 1. Some data were missing (22–27 September 2014, 14–19 August 2015, 23–27 September 2015) due to the equipment failure of the weather station. No rainfall occurred during these periods according to the water butt located in the experiment station. The total precipitation amount was 243.8 mm and 145.6 mm, respectively, and represented 149% and 89% of the long-term average annual precipitation, respectively. Lower temperatures recorded during the early growing season in 2015 resulted in the delay of the regeneration of alfalfa. The re-growth date in 2015 was 11 days later than that in 2014.
Alfalfa (variety: Emperor) was drill sown with line spacing of 22.5 cm on 2 May 2013. The seeding rate was 15 kg/ha. Each experimental plot had a surface of 9 m2 (3.0 m × 3.0 m). The inter-space between plots was 1.0 m in order to minimize the irrigation edge effects. Each treatment had three replications. In the first year after seeding, the management and irrigation of all plots was the same as the local planting experiences. The winter irrigation was applied at the end of each growing season. After the winter irrigation, the soil water content (SWC) was close to the field capacity and maintained appropriate soil moisture through the winter to maintain the plant stand density. Even at the beginning of the next growing season, the SWC was still at a good level. Experiments were started in the second year due to the seeding stage in the first year not being representative of the growth of alfalfa over a long period.

2.2. Data Collection

Volumetric soil water content (SWC) in the root zone at the depth of 0–160 cm was measured with polyvinyl chloride (PVC) access tubes using a portable soil moisture profiler (Diviner 2000, Sentek Pty Ltd., Stepney SA, Australia). One access tube, with a length of 180 cm, was set in the center of each plot. Measurements were made at 10-cm intervals, at a maximum soil depth of 160 cm, every 5–10 days and after irrigation or rainfall. All tubes were calibrated by soil samples taken from the experimental plot at the beginning of each growth period to improve the accuracy of the measurements.
The ETc (mm) for individual plots was estimated using the water balance approach [26]:
ETc = I + P D R 0 + C R ± Δ S
where I is the irrigation amount (mm), P is the amount of precipitation during the growing period (mm), D is the deep percolation (mm), R0 is the surface runoff (mm), CR is the capillary rise (mm), and ΔS is the change in soil moisture during a period of time (mm). In Equation (1), D and CR were considered to be negligible due to the deep underground water, and SWC in all plots never exceeded the FC during the growing season. R0 was assumed to be 0 since the field was flat and had a field edge.
Daily alfalfa-reference ET (ETr) were computed using the Penman-Monteith combination-based energy balance equation [27]:
ETr = 0.408 Δ ( R n G ) + γ 1600 T + 273 u 2 ( e s e a ) Δ + γ ( 1 + 0.38 u 2 )
where Δ is the slope of saturation vapor pressure versus air temperature curve (kPa/°C); R n is the net radiation at the canopy surface (MJ/(m2·day)); G is the heat flux density at the soil surface (MJ/(m2·day)) and equals zero for the daily time step; T is the mean daily air temperature (°C); u 2 is the mean daily wind speed at 2 m height (m/s); e s is the saturation vapor pressure; e a is the actual vapor pressure; and γ is the psychrometric constant (0.05516 kPa/°C). The ETr in the periods for which the meteorological data was missing was considered equal to the value of the previous day.
The yield of alfalfa was measured by taking a sample of 0.45 m × 0.45 m at the early flowering stage (10% blooming). The samples were first oven-dried at 105 °C for 30 min and then at 85 °C for 48 h to provide constant mass. The samples were used for the crude protein (CP, % of dry matter) measurements. WUE (kg/(mm·ha)) was calculated using the following equation:
WUE = Y / ETc
where Y is the yield of alfalfa (kg/ha) and ETc is the crop evapotranspiration (mm) calculated from Equation (1). The CP was measured using the Kjeltec 8000 solution brochure GB outlined by FOSS Technology [28].
The growth periods in 2014 and 2015 are shown in Table 1. The average ETc and yield of all plots as the value of all treatments in the first growth period was considered. Irrigation was applied at the beginning of the second growth period and the first irrigation amount was A1: 30 mm, A2: 20 mm, A3: 10 mm.

2.3. Experimental Design

The irrigation treatments are shown in Table 2. Every irrigation event was applied after the soil moisture measurements. The irrigation amount of A1 was the average measured ETc of three replications of A1, calculated using Equation (1) between the soil moisture measurement and the last irrigation event. Irrigation was applied using a sprinkler irrigation system with sprinkler heads diagonal to the plot, with a spray angle of 90°. Sprinkler heads (73,001) with one nozzle (kv8), provided by K-Rain Ltd., Riviera Beach, FL, USA, were mounted on 70-cm risers, and the mean pressure was 140 kPa with a flow rate of 0.16 m3/h and a spray range of 3 m. The water amount was controlled by artificial observation using a water meter.

2.4. Statistical Analysis

All the plant data collected was statistically analyzed by PASW 18.0 using analysis of variance (ANOVA) and testing of the obtained results was done by Fisher’s least significant difference (LSD) test (p ≤ 0.05 levels between the means). The response of yield and WUE to ETc or irrigation amount were evaluated using Origin 7.0.

3. Results

3.1. Evapotranspiration During the Growing Season

Irrigation amount, ETc, and precipitation in the different growth periods during the growing seasons in 2014 and 2015 are presented in Table 3. The average seasonal ETc in 2014 and 2015 increased from 412 mm to 809 mm, while the irrigation amount increased from 0 (rainfed) to 100% of measured ETc. The pipe laying of the irrigation system in 2014 led to the failure of irrigation in the first growth period, but the ETc of the first growth period was still highest compared with other growth periods in A3 and A4 in 2014, and A2, A3, and A4 in 2015, respectively. The variation trends of ETc were similar in all treatments in 2014. After the first growth period, the ETc of all treatments decreased while reaching a peak in the third growth period. In the fourth growth period, the ETc decreased. The variation trends of ETc were different in 2015; the highest ETc was still measured in A1 in the third growth period, which received the largest irrigation amount, while in the A2 and A3 treatments ETc decreased after the first growth period and leveled off from the second to the fourth growth period. In the control treatment, ETc decreased from the first to third growth periods and then leveled off.
The evapotranspiration rate (ETc rate, mm/d) of alfalfa during the growing seasons in 2014 and 2015 is shown in Figure 2. The higher ETc during the same period led to the higher ETc rate. The average ETc rate in the 2014 and 2015 growing seasons was 4.63 mm/d in A1, 3.79 mm/d in A2, 2.99 mm/d in A3, and the lowest ETc was 2.15 mm/d obtained from A4, the rain-fed treatment.
The average ETc rate in all treatments for different growth periods in 2014 and 2015 remained low and constant in the first and second growth periods, reached a peak in the third growth period, and declined in the fourth growth period. In 2015, a higher ETc rate was also obtained in the third growth period in A1, A2, and A3, with an extremely high ETc rate occurring in A1 between 16 August and 19 August.

3.2. Yield

The irrigation amount had a significant effect on yield, which is shown in Table 4. The greatest yield of the different growth periods and seasonal total yield was obtained from the A1 treatment, followed by the A2 and A3 treatments, with the lowest yield obtained from the control. The yield of the first growth period was higher than that of the other growth periods in two growing seasons, regardless of irrigation, because the first growth period was the longest and had high initial SWC.
The yield of the first growth period accounted for 35–50% of the seasonal yield. The percentage of the yield in the first growth period for the seasonal yield increased when the seasonal irrigation amount decreased. The variation of yield and ETc was similar in both years. The yield in the first and third growth periods in all treatments decreased in 2015 compared to the same growth period in 2014, which resulted in the decrease of the seasonal yield compared to that of 2014, except for the A1 treatment despite the higher yields in the second and fourth growth periods in 2015. The yields of the third growth period in 2015 were 82.36%, 66.29%, 57.44%, and 29.54% in A1, A2, A3, and A4, respectively, compared to the same growth period in 2014. The yield of the third growth period in 2015, except A1, was significantly lower than that in 2014 (p < 0.05).
The response of yield (kg/ha) to ETc (mm) in different growth periods, each growing season, and two growing seasons in 2014 and 2015 are presented in Table 5. The relationship of the first growth period in 2014 was not shown due to no irrigation. In this experiment, the coefficients of determination between the yield and ETc in all growth periods were similar and high over the two growing seasons (R2 > 0.95). The slopes of the regression line of each growth period, except the first growth period in 2015, were similar, but the value of the intercepts varied. Combining the annual or two growing seasons data, the slopes of the regression line were comparable, but the value of the interception still varied. The slopes of the regression line of each growing season and the two growing seasons also varied from that of each growth period, and the R2 decreased.
A significant linear relationship, except in the first growth period in 2015, was obtained between the yield of alfalfa and the water applied (irrigation plus rainfall), as shown in Table 6. The slopes of the regression line, except in the first growth period in 2015, were similar, but the value of the intercepts varied. The coefficients of determination between yield and water applied in each growth period were similar (R2 > 0.96). When annual or two growing seasons data was combined, the coefficients of determination decreased, especially when including the data of the first growth period, and the R2 increased after removing the data of the first growth period.

3.3. Forage Quality

The CP (% of dry matter) in 2014 and 2015 is shown in Table 7. The CP content decreased with the increased irrigation amount. The average CP content of the two growing seasons was 18.99 in A1, 20.29 in A2, 21.68 in A3, and 22.99 in A4. Between the growth periods, the first growth period had the lowest CP content compared to the other growth periods. The variability of CP was opposite to the trend of the average ETc. The average CP content of all treatments was 15.64, 22.43, 20.87, 25.02, respectively, from the first growth period to the fourth growth period.

3.4. Water Use Efficiency

The WUE of different treatments in 2014 and 2015 are presented in Figure 3. The highest WUE was obtained from the A4 treatment, although the greatest yield occurred in the A1 treatment. The average WUE of the different treatments in the two growing seasons were 22.78 kg/(mm·ha) in A1, 24.15 kg/(mm·ha) in A2, 25.31 kg/(mm·ha) in A3, and 26.84 kg/(mm·ha) in A4, respectively. The average WUE of all treatments in each growth period ranged from 20.22 kg/(mm·ha) to 30.04 kg/(mm·ha). The highest average WUE was obtained from the first growth period and decreased with successive growth periods.

4. Discussion

4.1. Evapotranspiration During the Growing Season

Overall, this data showed that the irrigation amount affected the ETc and these results agreed with some studies [29,30,31,32], but these values differed from the studies due to the climate and field management variability. According to Bauder et al. [29], the ETc of alfalfa ranged from 197 mm to 724 mm and the greatest difference in values of the ETc was obtained in the driest year, 1975. Accordingly, in this study, the greater difference in values between A1 and the control treatment was obtained in 2015, the drier year compared to 2014. Lamm et al. [21] found that the ETc of alfalfa ranged from 887 to 1069 mm, and the irrigation amount increased from 70% to 100% ETc of alfalfa. In Wright’s study [33], the average water consumption of alfalfa for five years under sufficient soil water conditions was 1022 mm. Retta and Hanks [34] found that the ETc of alfalfa ranged from 232 mm to 728 mm while the irrigation amount (irrigation plus rain) increased from 96 mm to 622 mm. Cavero et al. [35] found the ETc of alfalfa, with irrigation amounts equal to the crop irrigation requirement in daytime and nighttime, ranged from 832 mm to 941 mm.
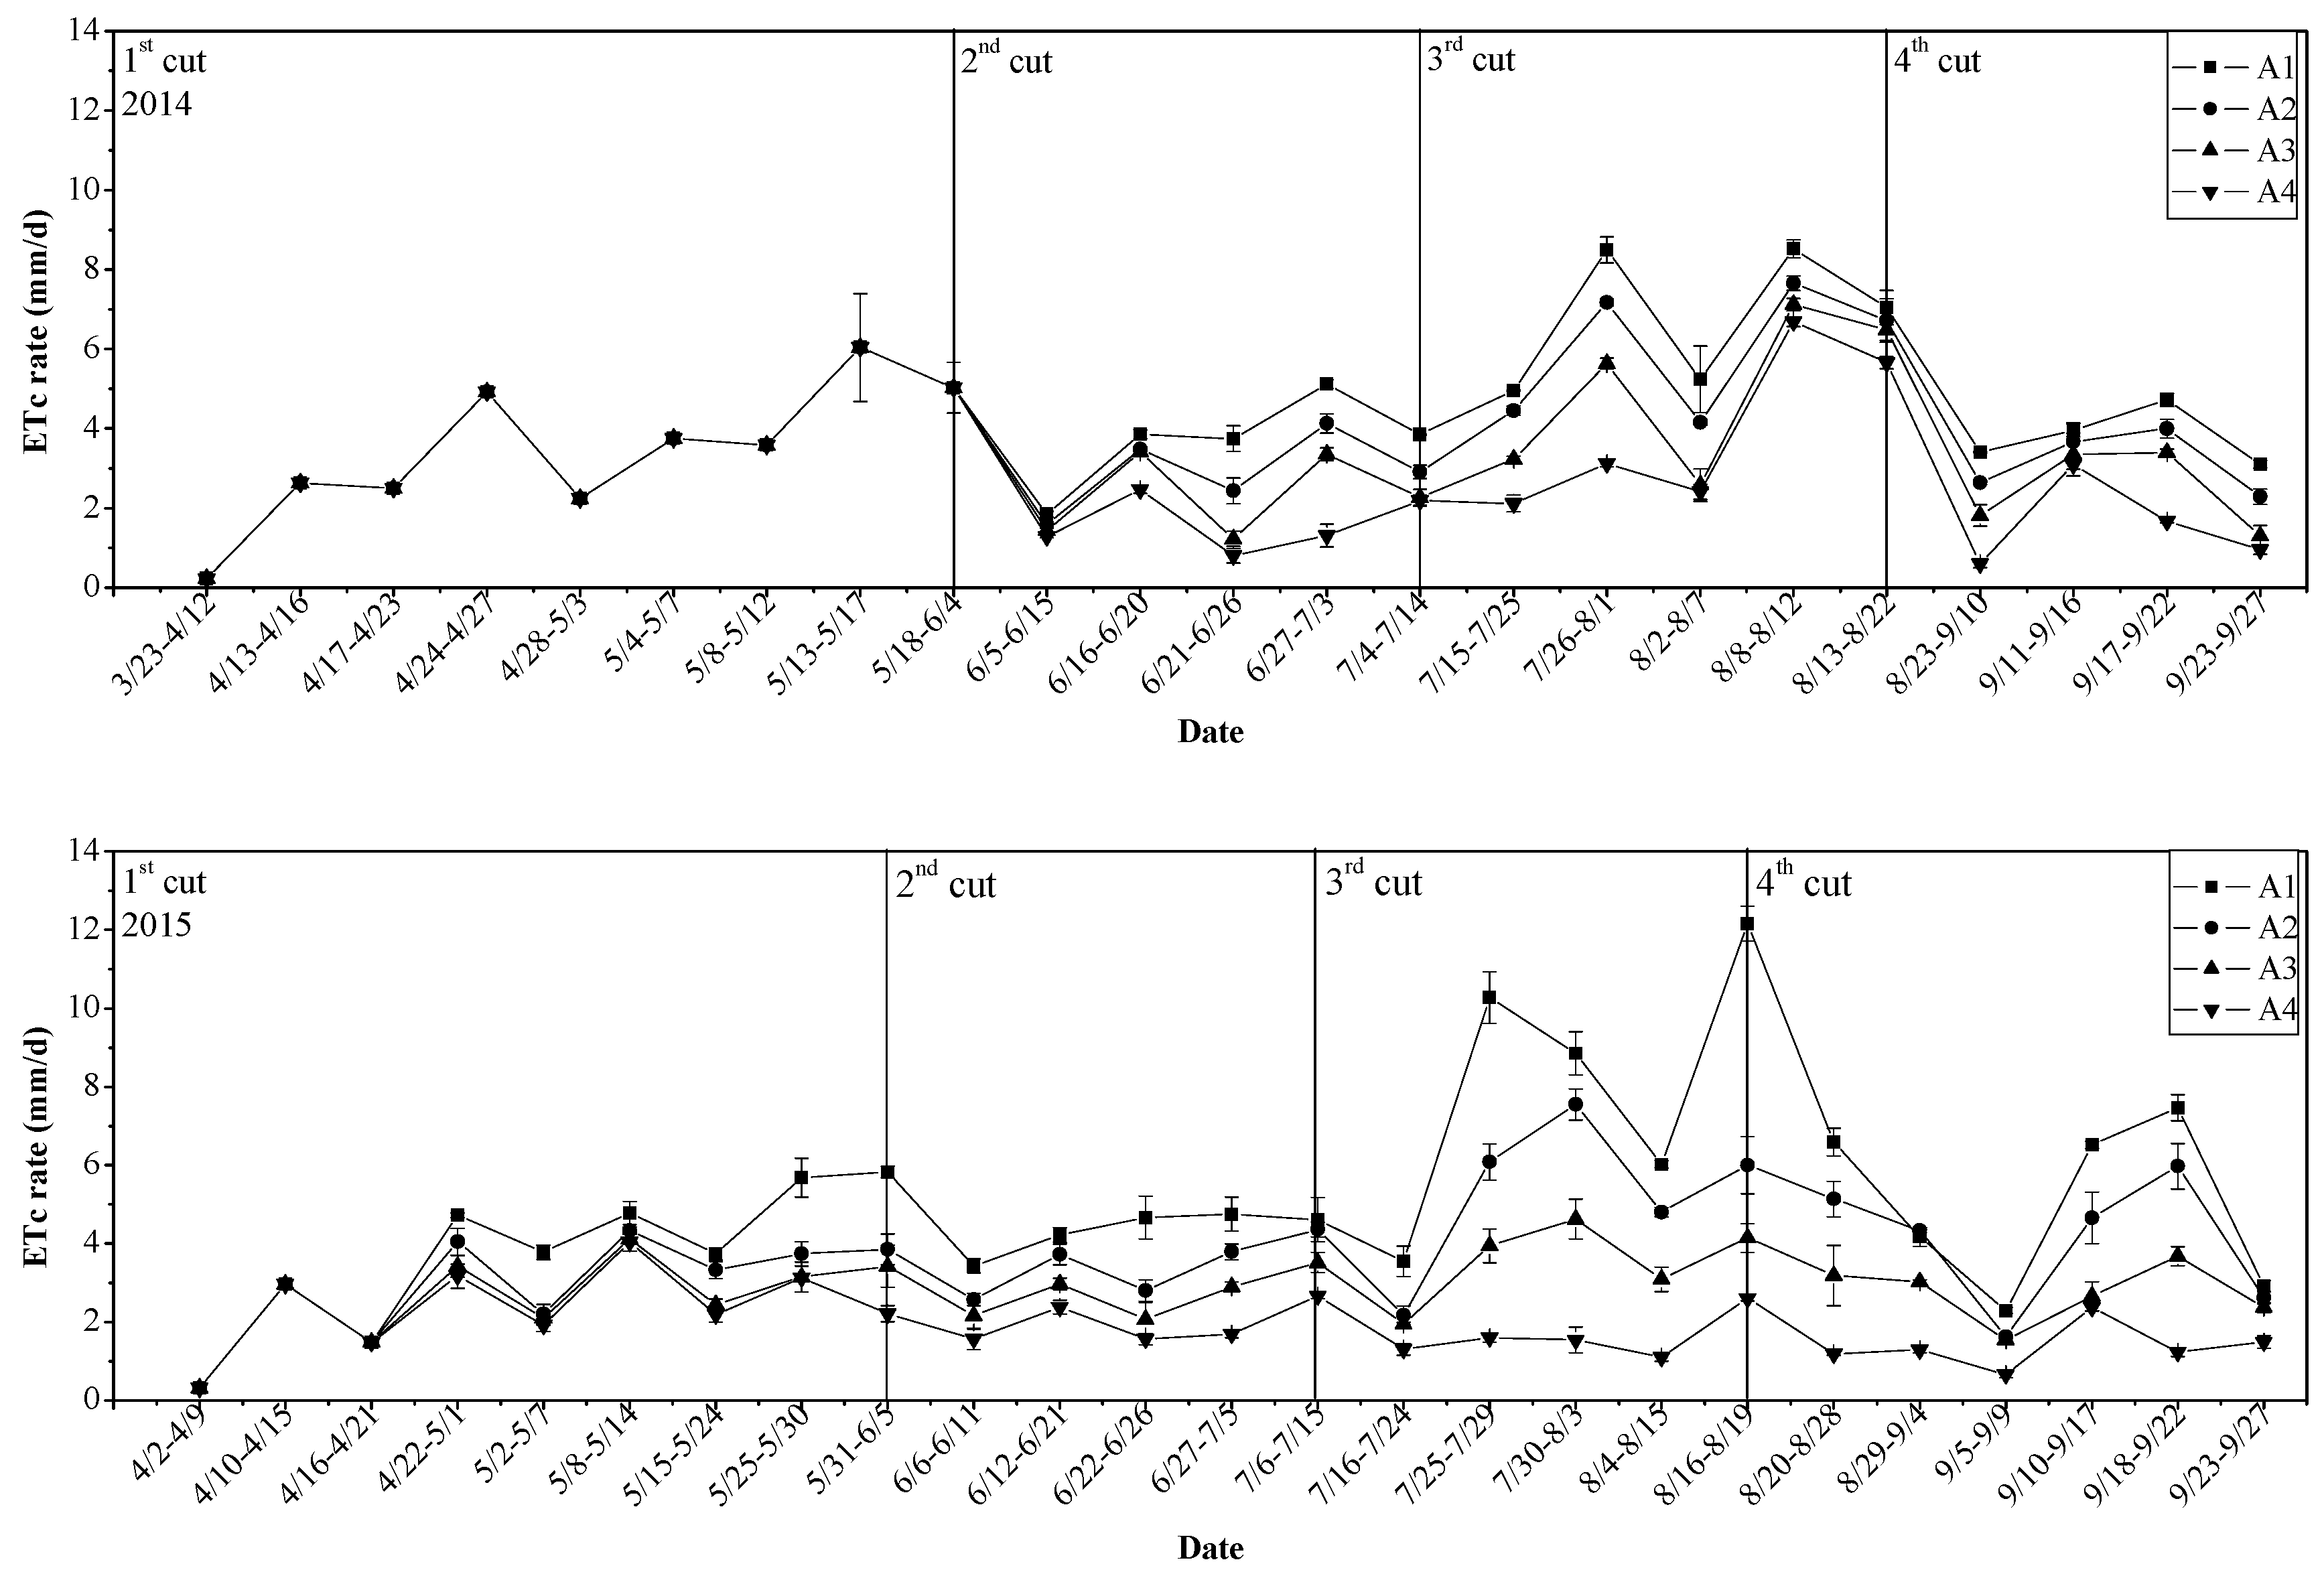
The ETc of the first growth period was a large amount regardless of the irrigation. This situation was due to the winter irrigation at the end of the previous growing season, which maintained the SWC at a good level at the beginning of the growing season, allowing the alfalfa to extract enough water for transpiration from the soil in the early first growth period. The soil water was consumed with the alfalfa growth, resulted in the water deficit condition in the late first growth period as the ETc was lower than the ETr. On the other hand, the longest growth periods receiving more solar radiation and a more effective growing temperature than other growth periods (data not shown) could increase the ETc of alfalfa [36,37]. In 2014, the ETc reached another peak in the third growth period, which was due to the higher daily temperature and rainfall. In the fourth growth period, daily temperatures became cooler and solar radiation decreased, causing the alfalfa to go dormant and the ETc to decrease. During the third growth period in 2015, high daily temperatures and solar radiation were also recorded, but the rainfall was poor compared to the same growth period in 2014, which caused the difference in the ETc in A2, A3, and A4. Irrigation is an important factor which affects the ETc of alfalfa [21,30,31,37]. The decrease in irrigation amount resulted in a water deficit. Under water deficit conditions, rainfall becomes the major factor influencing the ETc [38]. The SWC in A3 and A4 was low after the first growth period, so a low precipitation amount during the third growth period with higher daily temperatures intensified the water deficit, which led to the decrease of the ETc in A2, A3, and A4.
The ETc of alfalfa was more than the water applied (irrigation plus rainfall) during the growing season in all treatments in 2014 as well as in A3 and A4 in 2015, which means that the alfalfa also extracted water for growth from the soil as well as the irrigation water applied during the growing season. Comparing the ETc and ETr in Table 3, it shows that all treatments, even the A1 treatment, were grown under water deficit conditions during the first and second growth periods in 2014. The ETc of alfalfa in A1 and A2 in 2015 was less than the water applied, which means that some irrigation water and rainfall was stored in the soil. Malek et al. [39] found that unforeseen rain between irrigations led to the ETc occasionally being less than the irrigation plus rain in the short term, and the water stored in the soil would be used when the crop needed it. It is believed that extra water from irrigation or rainfall will be used as a crop needs it, even in the long term.
The higher ETc during the same growth period led to a higher ETc rate. The average ETc rate of all treatments remained low in the first, second, and fourth growth periods. The higher ETc rate in all treatments obtained in the third growth period in 2014 was due to the largest rainfall, which made all treatments except A4 fully or nearly fully irrigated when comparing the ETc and ETr. Higher temperatures and solar radiation also increased the ETc rate [36,37]. Other studies showed that the extremely high ETc rate with irrigated alfalfa was due to advection [40,41,42]. Daigger et al. [43] also found a similar ETc trend. In their research, the ETc rate was 4.2 mm/d, 5.5 mm/d, and 5.9 mm/d from the first to the third growth period, while the daily water use increased in June, July, and the first part of August, after which it declined. An extremely high ETc rate of 12.16 mm/d occurred in A1 between 16 August and 19 August in 2015. This was due to the fully irrigated conditions during this growth period in A1 when comparing the ETc and ETr. Hanson et al. [31] also found a high ETc rate of 12 mm/d in fully irrigated alfalfa. Wright [33] found that the highest ETc rate exceeded 10 mm/d in most seasons. The ETc rate in A4 in 2015 remained low and constant due to the low average daily temperature in the first growth period and a water deficit in the other growth periods.

4.2. Yield

The results of this study indicate that the yield increased when the irrigation amount increased, concurring with some studies [21,44,45,46]. According to Bauder et al. [29], the yield of alfalfa without irrigation increased from 2622 kg/ha to 11,050 kg/ha when the amount of rainfall increased from 70 mm to 478 mm. Retta and Hanks [34] also found that the yield increased from 2890 kg/ha to 17,490 kg/ha when the rainfall increased from 96 mm to 278 mm under similar irrigation amounts between years. Bolger and Matches [47] found that the yield of the first growth period accounted for 41–46% of a seasonal yield, while the percentage was 35–50% in this study. The percentage of the yield of the first growth period in seasonal yield increased when the seasonal irrigation amount decreased. This result was due to the longest growth season of the first growth period [46]. Daigger et al. [43] also suggested that producers should fill the soil profile with water to a depth of 2.5 m early in the growing season to take full advantage. The greater yield obtained in the third growth period in 2014 was due to the greater rainfall during that time, which made all treatments except the rainfed treatment fully or nearly fully irrigated. The third growth period (from mid-July to mid-August) was the period with the highest temperatures and greatest solar radiation. Radiation use efficiency (RUE) decreased when alfalfa was under water-stress [46] and the high daily temperatures intensified the stress, which led to the stronger decrease in RUE. In addition, when winter irrigation was applied, early-regrowth alfalfa (2014) could produce high yields even if there was no irrigation during the growth period, enabling producers to save irrigation water in the early first growth period when the winter irrigation could be applied instead.
A significant linear relationship was obtained between the ETc and yield in all fitting results (p < 0.05). Similar results were also found in some studies [32,47,48,49,50], but the fitting results varied between growth periods and growing seasons [38,47,48,50]. Li et al. [45] found that the relationship between ETc and yield varied under different planting and irrigation treatments. Decreasing R2 when annual or two growing seasons data was combined was due to climate variability, especially rainfall between years. Undersander [38] found that precipitation decreased the R2.
The linear relationship between the yield of alfalfa and water applied agreed with Bauder et al. [29]. Klocke et al. [51] found that the relationship between yield and water applied to alfalfa was nearly linear during the second through fourth year, and a linear relationship was obtained in the fifth year. Montazar and Sadeghi [52] found a quadratic relationship between the yield of alfalfa and irrigation amount. Other studies also implied a linear relationship between grain yield and water applied in maize [53,54,55]. Yield response to water applied was a combined influence of the irrigation amount, the precipitation, and the SWC from the beginning to the end of the year [51]; high initial SWC in 2014, after the winter irrigation at the end of the previous growing season, contributed more to the growth of the alfalfa during the first growth period than in other growth periods.

4.3. Forage Quality

This study showed that the CP content decreased with the increasing irrigation amount, which agrees with Holman et al. [56] and Cavero et al. [57], who studied the alfalfa production under solid-set sprinkler irrigation in a semi-arid climate. Halim et al. [58] also found that the CP content in both stem base and stem tops increased with a decreasing irrigation level; however, the CP in leaves has a positive relationship with the irrigation level, leading to an insignificant difference of CP content in total herbage between different irrigation levels. That study also indicated the maturity of alfalfa grown under water stress delayed and decreased the stem/leaf ratio, which significantly affected the CP content. First growth periods have the lowest CP contents, compared to other growth periods, due to it being the longest growth period. This result is in agreement with Min [59], who studied the effects of cutting interval on the quality of alfalfa.

4.4. Water Use Efficiency

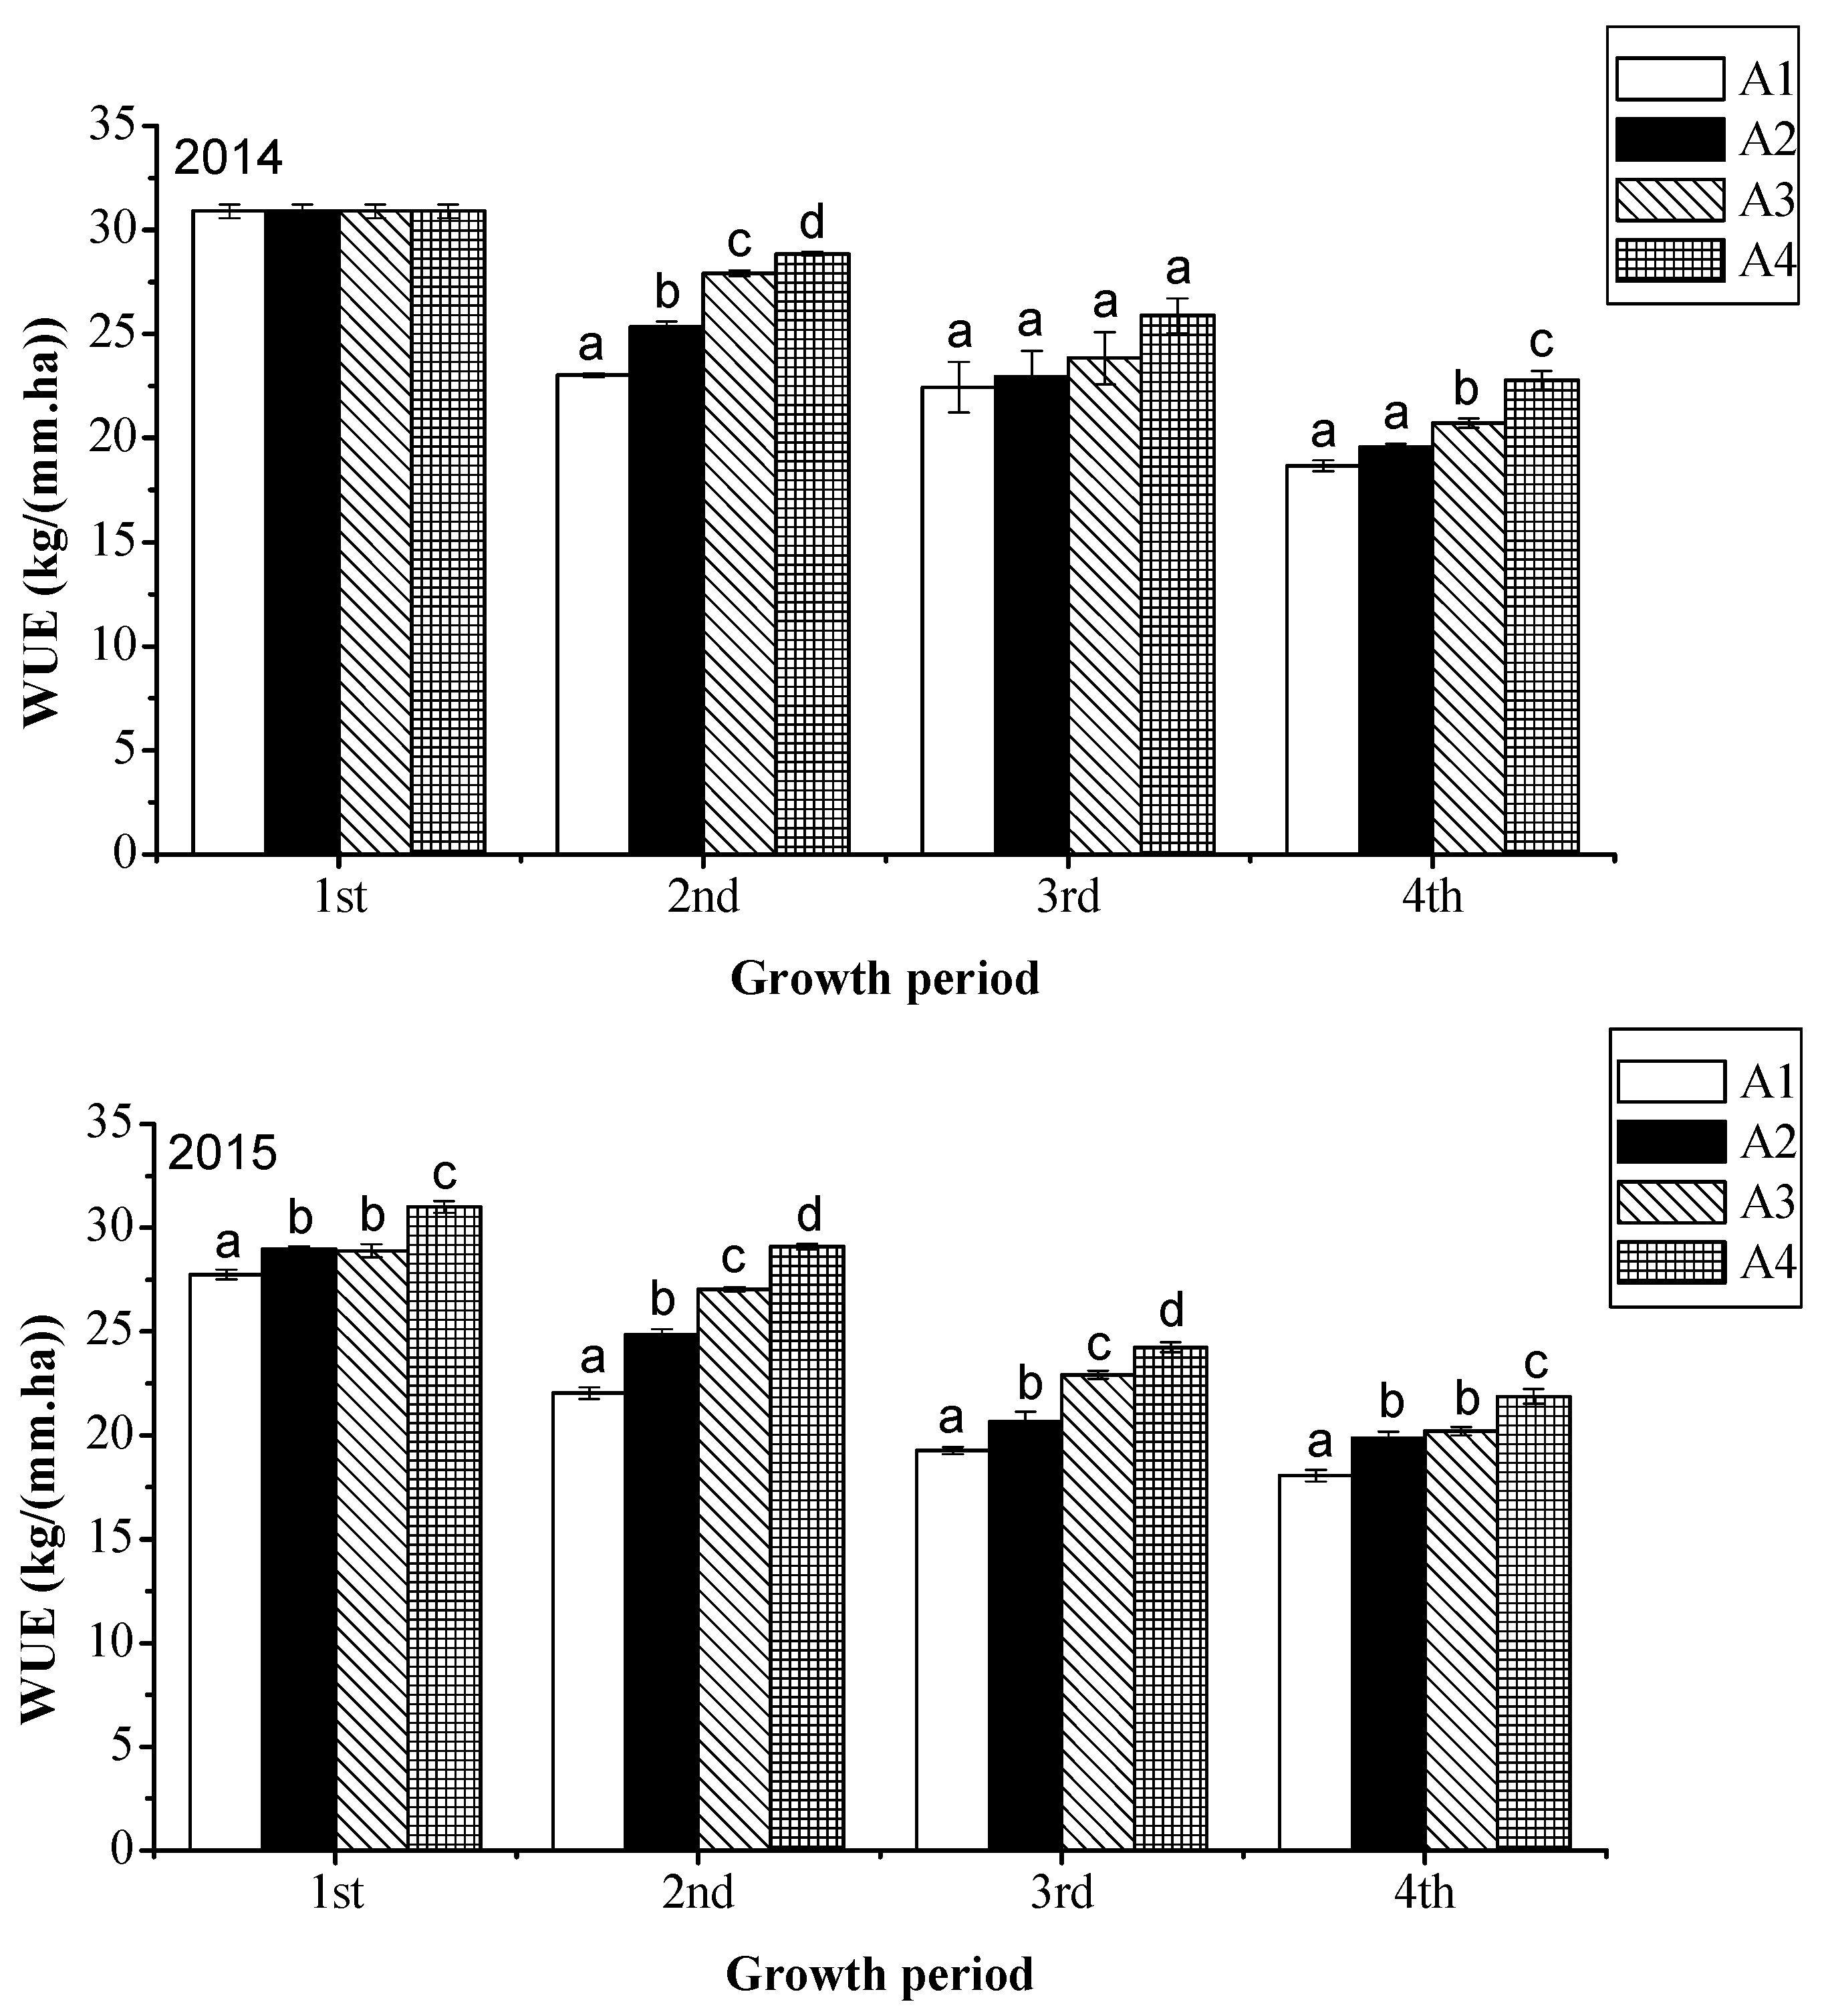
In this experiment, WUE increased with the decreasing irrigation level; this varying trend was also found in some studies [21,32,60]. Erice et al. [61] found that the WUE increased under a drought of 14 days and declined after a recovery period. Anower et al. [3] found that the WUE increased with less irrigation applied, but the rising range varied between cultivars. Other studies found that the WUE decreased under dry conditions due to the differences in climate [30,50,62]
The highest average WUE was obtained from the first growth period and decreased with successive growth periods. This agreed with Lamm et al. [21]. The decrease of the average WUE was due to the climate and the physiology of alfalfa. Alfalfa is a C3 crop, which has a higher photosynthesis rate under cooler temperatures, such as in the first and second growth periods. The production of biomass aboveground in the early season depends on the carbohydrates accumulated in the previous fall, which resulted in the highest WUE. On the other hand, after the first growth period, carbohydrates for growth comes from photosynthesis in the new leaves [63,64]. In the third growth period, the highest temperature in the whole year was recorded, and, in the fourth growth period, the coldest temperature was recorded, beginning the dormancy of alfalfa and resulting in the decrease of the WUE [30]. Sammis [50], however, found that the highest WUE was obtained in fall. Bolger and Matches [47] found that the WUE was highest in the first growth period and remained constant through the summer. As the highest WUE was obtained in the early harvest, irrigation should be concentrated during this growing period; some studies have shown the same results [21,65]. In the case of winter irrigation applied at the end of a previous growing season, irrigation water should be concentrated in the second growth period to maintain the seasonal yield with less irrigation, as the first growth period produced a high yield without irrigation in 2014.

5. Conclusions

This experiment studied the response of alfalfa growth to different sprinkler irrigation levels, and the results indicated that the irrigation amount significantly affected the ETc, yield, forage quality, and WUE of alfalfa. The ETc and yield increased with increasing irrigation levels, while the WUE and CP content decreased. Similarly, significant relationships were observed between yield and ETc or irrigation amount, but the fitting results varied due to the growth period, climate variability, and the local cultivation practice, especially due to winter irrigation at the end of the previous growing season, which provided the ability to save water to maintain high yields in arid regions. Since alfalfa grew under water deficit conditions in the late first and whole second growth periods, as irrigation was not applied in the first growth period and due to the successive decreasing WUE in the growing season, irrigation should be concentrated in the early growth periods, especially in the late first and whole second growth periods.

Acknowledgments

This work was supported by the National Key Research and Development Plan (2016YFC0400301) and the National Natural Science Foundation of China (No. 51379011). The authors would like to thank the support provided by the Sien Li at Shiyanghe Experimental Station for Water-saving in Agriculture and Ecology of China Agricultural University and Jinglu Li, the staff associated with Jinan University.

Author Contributions

Yan Li and Derong Su conceived and designed the experiments; Yan Li performed the experiments and analyzed the data; Yan Li wrote the paper and Derong Su modified the content.

Conflicts of Interest

The authors declare no conflicts of interest.

References

  1. Anonymous. National alfalfa industrial development plan (2016–2020). Chin. Agric. Inf. 2017, 2, 9–13. (In Chinese) [Google Scholar]
  2. More Hay and Less Seed Imports in China in 2016. Available online: http://www.grassland.gov.cn/grassland-new/ShengCheng/Article/gzdt/2017/02/08/1049479166.htm (accessed on 21 June 2016).
  3. Anower, M.R.; Boe, A.; Auger, D.; Mott, I.W.; Peel, M.D.; Xu, L.; Kanchupati, P.; Wu, Y. Comparative drought response in eleven diverse alfalfa accessions. J. Agron. Crop Sci. 2017, 203, 1–13. [Google Scholar] [CrossRef]
  4. Rumbaugh, M.D.; Asay, K.H.; Johnson, D.A. Influence of drought stress on genetic variances of alfalfa and wheatgrass seedlings. Crop Sci. 1984, 24, 297–303. [Google Scholar] [CrossRef]
  5. Tolk, J.A.; Howell, T.A.; Steiner, J.L.; Krieg, D.R.; Schneider, A.D. Role of transpiration suppression by evaporation of intercepted water in improving irrigation efficiency. Irrig. Sci. 1995, 16, 89–95. [Google Scholar] [CrossRef]
  6. Playa′n, E.; Salvador, R.; Faci, J.M.; Zapata, N.; Martı´nez-Cob, A.; Sanchez, I. Day and night wind drift and evaporation losses in sprinkler solid-sets and moving laterals. Agric. Water Manag. 2005, 76, 139–159. [Google Scholar] [CrossRef]
  7. Cavero, J.; Medina, E.T.; Puig, M.; Martínez-Cob, A. Sprinkler irrigation changes maize canopy microclimate and crop water status, transpiration, and temperature. Agron. J. 2009, 101, 854–864. [Google Scholar] [CrossRef]
  8. Urrego-Pereira, Y.; Cavero, J.; Medina, E.T.; Martínez-Cob, A. Microclimatic and physiological changes under a center pivot system irrigating maize. Agric. Water Manag. 2013, 119, 19–31. [Google Scholar] [CrossRef] [Green Version]
  9. Urrego-Pereira, Y.F.; Martínez-Cob, A.; Cavero, J. Relevance of sprinkler irrigation time and water losses on maize yield. Agron. J. 2013, 105, 845–853. [Google Scholar] [CrossRef]
  10. Martínez-Cob, A.; Playán, E.; Zapata, N.; Cavero, J.; Medina, E.T.; Puig, M. Contribution of evapotranspiration reduction during sprinkler irrigation to application efficiency. J. Irrig. Drain. Eng. 2008, 134, 745–756. [Google Scholar] [CrossRef]
  11. Mcnaughton, K.G. Net interception losses during sprinkler irrigation. Agric. Meteorol. 1981, 24, 11–27. [Google Scholar] [CrossRef]
  12. Urrego-Pereira, Y.F.; Martínez-Cob, A.; Fernández, V.; Cavero, J. Daytime sprinkler irrigation effects on net photosynthesis of maize and alfalfa. Agron. J. 2013, 105, 1515–1528. [Google Scholar] [CrossRef]
  13. Liu, H.; Yu, L.; Luo, Y.; Wang, X.; Huang, G. Responses of winter wheat (Triticum aestivum L.) evapotranspiration and yield to sprinkler irrigation regimes. Agric. Water Manag. 2011, 98, 483–492. [Google Scholar] [CrossRef]
  14. Wen, J.; Li, J.; Li, Y. Response of maize growth and yield to different water and nitrogen schemes on very coarse sandy loam soil under sprinkler irrigation in the semi-arid region of china †. Irrig. Drain. 2016, 64, 619–636. [Google Scholar] [CrossRef]
  15. Dilshad, B.; William, L.K.; Tsz Him, L.; Suat, I.; Derrel, L.M. Energy conservation using variable-frequency drives for center-pivot irrigation: Standard systems. Trans. ASABE 2017, 600, 95–106. [Google Scholar] [CrossRef]
  16. Al-Gaadi, K.A.; Hassaballa, A.A.; Tola, E.; Kayad, A.G.; Madugundu, R.; Alblewi, B.; Assiri, F. Prediction of potato crop yield using precision agriculture techniques. PLoS ONE 2016, 11, e0162219. [Google Scholar] [CrossRef] [PubMed]
  17. Ouazaa, S.; Latorre, B.; Burguete, J.; Serreta, A.; Playán, E.; Salvador, R.; Paniagua, P.; Zapata, N. Effect of the start–stop cycle of center-pivot towers on irrigation performance: Experiments and simulations. Agric. Water Manag. 2015, 147, 163–174. [Google Scholar] [CrossRef]
  18. Kayad, A.G.; Al-Gaadi, K.A.; Tola, E.; Madugundu, R.; Zeyada, A.M.; Kalaitzidis, C. Assessing the spatial variability of alfalfa yield using satellite imagery and ground-based data. PLoS ONE 2016, 11, e0157166. [Google Scholar] [CrossRef] [PubMed]
  19. Ar Horqin Banner, Inner Mongolia Is Attempting to Build a Million mu of Quality Pasture (Alfalfa) Demonstration Base. Available online: http://www.grassland.gov.cn/Grassland-new/Item/3479.aspx (accessed on 21 June 2016). (In Chinese)
  20. Lindenmayer, R.B.; Hansen, N.C.; Brummer, J.; Pritchett, J.G. Deficit irrigation of alfalfa for water-savings in the great plains and intermountain west: A review and analysis of the literature. Agron. J. 2011, 103, 45–50. [Google Scholar] [CrossRef]
  21. Lamm, F.R.; Harmoney, K.R.; Aboukheira, A.A.; Johnson, S.K. Alfalfa production with subsurface drip irrigation in the central great plains. Trans. ASABE 2012, 55, 1203–1212. [Google Scholar] [CrossRef]
  22. Guoyan, P.; Zhu, O.; Qunying, L.; Qiang, Y.; Jishun, W. Water consumption of seven forage cultivars under different climatic conditions in the North China plain. J. Resour. Ecol. 2011, 2, 74–82. [Google Scholar] [CrossRef]
  23. Zhang, T.-J.; Kang, J.-M.; Guo, W.-S.; Zhao, Z.-X.; Xu, Y.-P.; Yan, X.-D.; Yang, Q.-C. Yield evaluation of twenty-eight alfalfa cultivars in hebei province of China. J. Integr. Agric. 2014, 13, 2260–2267. [Google Scholar] [CrossRef]
  24. Jun, F.; Yu, G.; Quanjiu, W.; Malhi, S.S.; Yangyang, L. Mulching effects on water storage in soil and its depletion by alfalfa in the Loess Plateau of northwestern China. Agric. Water Manag. 2014, 138, 10–16. [Google Scholar] [CrossRef]
  25. Li, X.; Su, D.; Yuan, Q. Ridge-furrow planting of alfalfa (Medicago sativa L.) for improved rainwater harvest in rainfed semiarid areas in Northwest China. Soil Tillage Res. 2007, 93, 117–125. [Google Scholar] [CrossRef]
  26. James, L.G. Principle of Farm Irrigation System Design; Cab International: Wallingford, UK, 1988; Volume 12, pp. 279–291. Available online: https://www.researchgate.net/publication/39003164_Principles_of_Farm_Irrigation_System_Design (accessed on 15 July 2016).
  27. Monteith, J.L. Evaporation and environment. In The State and Movement of Water in Living Organisms; Cambridge University Press: Cambridge, UK, 1965; pp. 205–234. [Google Scholar]
  28. Kjeltec 8000 Solution Brochure GB. Available online: http://www.foss.cn/industry-solution/chemical-analysis/brochures-and-data-sheets (accessed on 21 June 2016).
  29. Bauder, J.W.; Bauer, A.; Ramirez, J.M.; Cassel, D.K. Alfalfa water use and production on dryland and irrigated sandy loam. Agron. J. 1978, 70, 95–99. [Google Scholar] [CrossRef]
  30. Carter, P.R.; Sheaffer, C.C. Alfalfa response to soil water deficits. I. growth, forage quality, yield, water use, and water-use efficiency. Crop Sci. 1983, 23, 669–675. [Google Scholar] [CrossRef]
  31. Hanson, B.; Putnam, D.; Snyder, R. Deficit irrigation of alfalfa as a strategy for providing water for water-short areas. Agric. Water Manag. 2008, 93, 73–80. [Google Scholar] [CrossRef]
  32. Lindenmayer, B.; Hansen, N.; Crookston, M.; Brummer, J.; Jha, A. Strategies for reducing alfalfa consumptive water use. In Proceedings of the Hydrology Days, Fort Collins, CO, USA, 26–28 March 2008; pp. 52–61. Available online: https://www.researchgate.net/publication/237561132_Strategies_for_Reducing_Alfalfa_Consumptive_Water_Use (accessed on 15 July 2016).
  33. Wright, J.L. Daily and seasonal evapotranspiration and yield of irrigated alfalfa in southern Idaho. Agron. J. 1988, 80, 662–669. [Google Scholar] [CrossRef]
  34. Retta, A.; Hanks, R.J. Corn and alfalfa production as influenced by limited irrigation. Irrig. Sci. 1980, 1, 135–147. [Google Scholar] [CrossRef]
  35. Cavero, J.; Faci, J.M.; Martínez-Cob, A. Relevance of sprinkler irrigation time of the day on alfalfa forage production. Agric. Water Manag. 2016, 178, 304–313. [Google Scholar] [CrossRef]
  36. Hobbs, E.H.; Krogman, K.K. Evapotranspiration from alfalfa as related to evaporation and other meteorological variables. Can. J. Plant Sci. 1966, 46, 271–277. [Google Scholar] [CrossRef]
  37. Zhao, C.; Feng, Z.; Chen, G. Soil water balance simulation of alfalfa (Medicago sativa L.) in the semiarid Chinese Loess Plateau. Agric. Water Manag. 2004, 69, 101–114. [Google Scholar] [CrossRef]
  38. Undersander, D.J. Alfalfa (Medicago sativa L.) growth response to water and temperature. Irrig. Sci. 1987, 8, 23–33. [Google Scholar] [CrossRef]
  39. Malek, E.; Bingham, G.E.; McCurdy, G.D.; Hanks, R.J. Determination of evapotranspiration from an alfalfa crop irrigated with saline waste water from an electrical power plant. Irrig. Sci. 1992, 13, 73–80. [Google Scholar] [CrossRef]
  40. Blad, B.L.; Rosenberg, N.J. Evapotranspiration by subirrigated alfalfa and pasture in the east Central Great Plains1. Agron. J. 1974, 66, 248–252. [Google Scholar] [CrossRef]
  41. Rosenberg, N.J.; Verma, S.B. Extreme evapotranspiration by irrigated alfalfa: A consequence of the 1976 midwestern drought. J. Appl. Meteorol. 2010, 17, 934–941. [Google Scholar] [CrossRef]
  42. Tolk, J.A.; Howell, T.A.; Evett, S.R. Nighttime evapotranspiration from alfalfa and cotton in a semiarid climate. Agron. J. 2006, 98, 730–736. [Google Scholar] [CrossRef]
  43. Daigger, L.A.; Axthelm, L.S.; Ashburn, C.L. Consumptive use of water by alfalfa in western nebraska. Agron. J. 1970, 62, 507–508. [Google Scholar] [CrossRef]
  44. Ismail, S.M.; Almarshadi, M.H. Maximizing productivity and water use efficiency of alfalfa under precise subsurface drip irrigation in arid regions. Irrig. Drain. 2013, 62, 57–66. [Google Scholar] [CrossRef]
  45. Li, Z.; Zhang, W.; Sun, Z. Yield and water use efficiency of non- and single-irrigated alfalfa with ridge and furrow planting in northern China. Agron. J. 2015, 107, 1039–1047. [Google Scholar] [CrossRef]
  46. Testa, G.; Gresta, F.; Cosentino, S.L. Dry matter and qualitative characteristics of alfalfa as affected by harvest times and soil water content. Eur. J. Agron. 2011, 34, 144–152. [Google Scholar] [CrossRef]
  47. Bolger, T.P.; Matches, A.G. Water-use efficiency and yield of sainfoin and alfalfa. Crop Sci. 1990, 30, 143–148. [Google Scholar] [CrossRef]
  48. Kipnis, T.; Vaisman, I.; Granoth, I. Drought stress and alfalfa production in a mediterranean environment. Irrig. Sci. 1989, 10, 113–125. [Google Scholar] [CrossRef]
  49. Saeed, I.A.M.; El-Nadi, A.H. Irrigation effects on the growth, yield, and water use efficiency of alfalfa. Irrig. Sci. 1997, 17, 63–68. [Google Scholar] [CrossRef]
  50. Sammis, T.W. Yield of alfalfa and cotton as Influenced by irrigation. Agron. J. 1981, 73, 323–329. [Google Scholar] [CrossRef]
  51. Klocke, N.L.; Currie, R.S.; Holman, J.D. Alfalfa Response to Irrigation from Limited Water Supplies. Trans. ASABE 2013, 56, 1759–1768. [Google Scholar] [CrossRef]
  52. Montazar, A.; Sadeghi, M. Effects of applied water and sprinkler irrigation uniformity on alfalfa growth and hay yield. Agric. Water Manag. 2008, 95, 1279–1287. [Google Scholar] [CrossRef]
  53. Farré, I.; Faci, J.M. Comparative response of maize (Zea mays L.) and sorghum (Sorghum bicolor L. Moench) to deficit irrigation in a Mediterranean environment. Agric. Water Manag. 2006, 83, 135–143. [Google Scholar] [CrossRef]
  54. Kresovi’c, B.; Tapanarova, A.; Tomi´c, Z.; Životić, L.; Vujovi´c, D.; Sredojevi’c, Z.; Gajic, B. Grain yield and water use efficiency of maize as influenced by different irrigation regimes through sprinkler irrigation under temperate climate. Agric. Water Manag. 2016, 169, 34–43. [Google Scholar] [CrossRef]
  55. Mansouri-Far, C.; Modarres Sanavy, S.A.M.; Saberali, S.F. Maize yield response to deficit irrigation during low-sensitive growth stages and nitrogen rate under semi-arid climatic conditions. Agric. Water Manag. 2010, 97, 12–22. [Google Scholar] [CrossRef]
  56. Holman, J.; Min, D.; Klocke, N.; Kisekka, I.; Currie, R. Effects of irrigation amount and timing on alfalfa nutritive value. Trans. ASABE 2016, 59, 849–860. [Google Scholar] [CrossRef]
  57. Cavero, J.; Faci, J.; Medina, E.; Martínez-Cob, A. Alfalfa forage production under solid-set sprinkler irrigation in a semiarid climate. Agric. Water Manag. 2017, 191, 184–192. [Google Scholar] [CrossRef]
  58. Halim, R.A.; Buxton, D.R.; Hattendorf, M.J.; Carlson, R.E. Water-stress effects on alfalfa forage quality after adjustment for maturity differences. Agron. J. 1989, 81, 189–194. [Google Scholar] [CrossRef]
  59. Min, D. Effects of cutting interval between harvests on dry matter yield and nutritive value in alfalfa. Am. J. Plant Sci. 2016, 7, 1226–1231. [Google Scholar] [CrossRef]
  60. Collino, D.J.; Dardanelli, J.L.; Luca, M.J.D.; Racca, R.W. Temperature and water availability effects on radiation and water use efficiencies in alfalfa (Medicago sativa L.). Aust. J. Exp. Agric. 2005, 45, 383–390. [Google Scholar] [CrossRef]
  61. Erice, G.; Louahlia, S.; Irigoyen, J.J.; Sánchez-Díaz, M.; Alami, I.T.; Avice, J.-C. Water use efficiency, transpiration and net CO2 exchange of four alfalfa genotypes submitted to progressive drought and subsequent recovery. Environ. Exp. Bot. 2011, 72, 123–130. [Google Scholar] [CrossRef]
  62. Smeal, D.; Kallsen, C.E.; Sammis, T.W. Alfalfa yield as related to transpiration, growth stage and environment. Irrig. Sci. 1991, 12, 79–86. [Google Scholar] [CrossRef]
  63. Robison, G.D.; Massengale, M.A. Effect of harvest management and temperature on forage yield, root carbohydrates, plant density and leaf area relationships in alfalfa. Crop Sci. 1968, 8, 147–151. [Google Scholar] [CrossRef]
  64. Smith, D. Carbohydrate root reserves in alfalfa, red clover, and birdsfoot trefoil under several management schedules. Crop Sci. 1962, 2, 75–78. [Google Scholar] [CrossRef]
  65. Guitjens, J.C. Alfalfa irrigation during drought. J. Irrig. Drain. Eng. 1993, 119, 1092–1098. Available online: https://www.researchgate.net/publication/245288664_Alfalfa_Irrigation_during_Drought (accessed on 15 July 2016). [CrossRef]
Figure 1. Monthly rainfall and average temperature during growing seasons in 2014 and 2015; the bars represent temperature and the line denotes rainfall.
Sustainability 09 01380 g001
Figure 2. ETc rate (mm/d) during the growing seasons in different treatments in 2014 and 2015.
Sustainability 09 01380 g002
Figure 3. Water use efficiency in 2014 and 2015, data are mean values ± SE. Bars with different letters in same growth period are significantly different (p < 0.05).
Sustainability 09 01380 g003
Table 1. Growth period in 2014 and 2015.
YearGrowth PeriodDateIrrigation (Yes/No)
2014122 March–4 JuneNo
25 June–14 JulyYes
315 July–22 AugustNo irrigation after 10 August
423 August–27 SeptemberYes
201512 April–5 JuneYes
26 June–15 JulyYes
316 July–19 AugustYes
420 August–27 SeptemberYes
Table 2. Irrigation treatments in 2014 and 2015.
TreatmentIrrigation Amount
A1100% measured ETc
A266% of A1
A333% of A1
A4Rain-fed
Table 3. Irrigation amount (I), evapotranspiration (ETc), and alfalfa-reference evapotranspiration (ETr) during growing seasons in 2014 and 2015.
YearGrowth PeriodI (mm)ETc (mm)ETr (mm)
A1A2A3A4A1A2A3A4
20141----220220220220426
21288543-140 a111 b89 c65 d210
316711156-259 a230 b191 c150 d209
41097336-132 a108 b82 c45 d113
Total404269135-751 a669 b582 c480 d958
2015120413668-239 a192 b169 c154 d411
21167739-175 a146 b114 c83 d196
328919296-249 a169 b114 c51 d211
423815979-204 a165 b109 c56 d160
Total847564282-867 a672 b506 c344 d978
Means within lines not followed by the same letter are significantly different (p < 0.05).
Table 4. Yield during growing seasons in 2014 and 2015.
YearGrowth PeriodY (kg/ha)
A1A2A3A4
201416788678867886788
23231 a2803 b2476 c1863 d
35817 a5277 ab4548 bc3874 c
42472 a2105 b1689 c1022 d
Total18308 a16973 b15501 c13547 d
201516632 a5565 b4872 c4789 c
23857 a3623 a3079 b2414 c
34791 a3498 b2612 c1190 d
43684 a3276 b2202 c1214 d
Total18964 a15962 b12765 c9607 d
Means within lines not followed by the same letter are significantly different (p < 0.05).
Table 5. Yield (kg/ha) response to ETc (mm) in 2014 and 2015.
Growth Period/YearFitting ResultsR2
20142Y = 803.88 + 17.71ETc0.98 *
3Y = 1168.46 + 17.91ETc0.99 *
4Y = 300.95 + 16.60ETc0.99 *
20151Y = 1154.20 + 22.88ETc0.99 *
2Y = 1188.95 + 15.88ETc0.97 *
3Y = 432.09 + 17.84ETc0.99 *
4Y = 319.59 + 17.06ETc0.99 *
2014Y = –107.42 + 24.94ETc0.90 *
2015Y = 234.44 + 22.45ETc0.77 *
2 growing seasonsY = 54.83 + 23.71ETc0.84 *
* Means the correlation was significant at p < 0.05.
Table 6. Yield (kg/ha) response to irrigation amount (I, mm) plus rainfall (P, mm) in 2014 and 2015.
Growth Period/YearFitting ResultsR2
20142Y = 1433.74 + 10.36 (I + P)0.98 *
3Y = 2533.55 + 11.80 (I + P)0.99 *
4Y = 835.61 + 13.15 (I + P)0.98 *
20151Y = 4166.82 + 9.15 (I + P)0.89
2Y = 1700.67 + 12.60 (I + P)0.96 *
3Y = 1016.92 + 12.15 (I + P)0.99 *
4Y = 1100.86 + 10.70 (I + P)0.97 *
2014 (including first growth period)Y = 1691.73 + 13.81 (I + P)0.35 *
2014 (without first growth period)Y = 743.41 + 18.42 (I + P)0.88 *
2015 (including first growth period)Y = 2039.86 + 10.64 (I + P)0.37 *
2015 (without first growth period)Y = 1343.52 + 11.15 (I + P)0.85 *
Two years (including first growth period)Y = 1905.63 + 11.79 (I + P)0.36 *
Two years (without first growth period)Y = 1128.39 + 13.97 (I + P)0.80 *
* Means the correlation was significant at p < 0.05.
Table 7. The crude protein (CP, % of dry matter) in 2014 and 2015.
YearTreatmentsGrowth Period
1234
2014A114.8820.74 a16.59 a24.76 a
A214.8821.74 b17.66 b25.69 b
A314.8822.37 c19.67 c26.09 b
A414.8824.23 d21.15 d28.06 c
2015A114.41 a20.56 a18.91 a21.09 a
A216.01 b21.83 b22.06 b22.47 b
A317.53 c23.34 c24.02 c25.54 c
A417.65 c24.62 d26.86 d26.43 d
Means in same growth period within rows not followed by the same letter are significantly different (p < 0.05).

