
Visualization of Chinese CBM Research: A Scientometrics Review


1
College of Resources and Safety Engineering, China University Mining & Technology Beijing, Beijing 100083, China
2
State Key Laboratory of Coal Mine Disaster Dynamics and Control, College of Resource and Environmental Sciences, Chongqing University, Chongqing 400030, China
*
Author to whom correspondence should be addressed.
Sustainability 2017, 9(6), 980; https://doi.org/10.3390/su9060980
Submission received: 6 April 2017
/
Revised: 18 May 2017
/
Accepted: 5 June 2017
/
Published: 8 June 2017
(This article belongs to the Section Energy Sustainability)
Abstract
:The field of coalbed methane (CBM) is well recognized as being able to provide clean fuels and reduce carbon dioxide emissions, thereby helping to reduce global warming. It is an effective solution to the problem of global climate change. Given the importance of CBM research on sustainable development, we have developed a comprehensive and powerful visualization of Chinese CBM research to help other peers obtain a quick and efficient understanding of the current situation and development of CBM research in China. This method, by using CiteSpace, also represents a paradigm shift in our way of dealing with the large volume of scientific publications and could change the way literature searches and reviews are conducted, as well as how the impact of specific work is assessed.
1. Introduction
This paper aims to provide simple but clear approaches for both students and newcomers in the industry to obtain a better understanding of the current situation and the latest progress in coalbed methane (CBM) so that they can be better informed in choosing their research focus and direction. There are different expressions for coalbed methane in academic theses, such as coal seam gas (CSG), coal seam methane (CSM), coal seam natural gas (CSNG), and coal mine methane (CMM). They all have the same meaning as CBM [1]. Listing these abbreviations can ensure that the collection of information and the retrieved literature are complete. As ‘coal’ and ‘methane’ are the two most important words in the following discussion, this paper uses the term ‘coalbed methane’. At the same time, the gas collected from reserves is not pure gas.
During the process of coal formation, CBM mainly absorbs into the surface of coal matrix particles and a minority part of them flow into the pores and cracks of the coal and wall rocks, or dissolve in the coalbed water. For a very long time, coalbed methane was considered the main cause of underground coal mine disasters, such as outbursts, gas explosions, etc. Therefore, many high gas and outburst mines in China will not begin coal mining until the gas is discharged. According to a newly-released scientific assessment report, GWP (Global Warming Potential, the extent to which individual emissions contribute to global warming) of methane is 25 times higher than that of carbon dioxide, which is defined as 1 [2]. Among the emissions that contribute to the greenhouse effect produced in China, CO2 coming from fossil fuels constitutes 13% (0.16 ± 0.02 W·m−2) and CH4 comprises 14% (0.13 ± 0.05 W·m−2) [3,4]. This shows that carbon dioxide and methane have almost the same influence on the greenhouse effect. The basis of CBM is methane; its heat value is two to five times higher than that of general coal and leaves no pollutants, other than CO2, after being burned. Since the 1970s, the leading coal production countries have realized the economic value of CBM and now collect and use it as a fuel source, instead of releasing it, venting it to the atmosphere. CBM research and development in the USA increased in the late 1980s in response to a petroleum crisis [5]. Subsequently, CBM drilling techniques include surface well drilling, underground gas drainage, surface and underground joint CBM extraction, etc. [6].
It is well known that China has abundant coal resources. According to a second analysis of China’s coal resources, the total amount of coal is nearly 5.57 × 10¹² t, among which 53.2% of the coal exists between depths of 1000 m and 2000 m [7]. Moreover, CBM is also rich in China. Based on the assessment report by the International Energy Agency (IEA), potential reserves of China’s CBM with a burial depth less than 2000 m is 36.8 × 10¹² m3, ranking third in the world [8]. The Chinese government shows great enthusiasm for CBM development. In the 12th Five-Year Plan, the proven reserves are expected to reach 10 × 1012 m3, with a goal of 0.16 × 10¹² m3. However, low permeability of many coalbeds has resulted in unsatisfactory recovery of CBM. By the end of 2013, there were 14,041 CBM fields in China; proven reserves were 5.65 × 10¹² m3, but the actual output was only 0.16 × 10¹² m3 [9], far lower than what was expected. The reason for this discrepancy is that most studies are based on the successful CBM experience in high-permeability areas, whereas the permeability of most coalbeds in China is just 1 mcd. Therefore, it is of great importance to determine how to increase the output of CBM in the areas with low permeability.
For the newcomers in this industry, it is necessary to become familiar with the research highlights, cutting-edge research, and basic knowledge in this field. In this way, repetitive work can be avoided, leading to a better research focus and direction. The best way to know a discipline is to read the published works, but in a vast sea of literature, how does one identify the appropriate publications that interest and suit us? This paper aims to introduce the methods of bibliometrics analysis for CBM research. We hope the methods mentioned in this report can help to better understand the current status and the latest progress of the CBM industry, and provide ideas to assist future research efforts.
2. Research Methods, Tools, and Data Sources
2.1. Research Methods
Knowledge grows as a dynamic process, which leads to new findings in frontier research. The concept of research expresses emergent and transient groupings in certain research fields [10] and, as such, a research front and its basic knowledge have become the necessities for scientific researchers. Researchers usually begin a research project by applying knowledge obtained in previous studies by themselves and other researchers. This typically evolves into an increasingly large network, out of which grouping forms the research front of a scientific problem. The knowledge bases of most researchers are concentrated in one or two areas in which they have a good command of the professional knowledge. As a result, however, this causes information fragmentation and many potential connections are ignored. Thus, the bibliographic records of each scientific document can be used to discover the overlooked linkages in a field or between fields [11].
Inspired by Chen’s idea [12,13], we provide an analytical framework to the network of citing articles formed by co-citation clusters to facilitate access and understanding (see Figure 1). After selecting topics of interest, one can obtain data from reliable databases by retrieval with keywords. Relevant articles can be divided into two groups: those being cited by the literature and a co-citation matrix. The co-citation network can be divided by grouping information into several clusters that are non-overlapping and summarize the information in every cluster, including headlines, authors, keywords, abstracts, and bibliographic records. Finally, a noun phrase is extracted as the label, which is called the ‘term’. For quoted passages, singular value decomposition (SVD) results in dimensionality reduction of the clusters. This can accelerate the learning algorithm because one cannot realize the visualization by intuitive graphics if the dimensionality is too high. In the end, we obtain a network of citing articles in which the size of different nodes represents the citing frequency. The dense nodes demonstrate research hot spots and the basic knowledge in the field, and burst nodes in this paper represent research fronts according to Kleinberg’s algorithm (since the first introduction in 2002, it has been playing a significant role in burst-detection techniques and date mining) [14].
With the explosive emergence of social information, knowledge domain visualization is realized by graphics through automatic clustering and labeling of the literature, and data has not only evolved and gained structural identification in different disciplines, but has also provided new inspirations for future innovations in scientific study. To achieve the goal mentioned above, a suitable and fully-functional software program that can realize literature visualization is needed.
2.2. Tools
Common information visualization software packages include ArnetMiner, PaperLens, TDA (Thomson Data Analysis), CiteSpace, etc. This paper utilizes CiteSpace 4.1.R2((c) 2003–2016 Chaomei Chen. All rights reserved) to carry out bibliometrics research regarding the progress and present situation of CBM mining in China.
Compared with other software, CiteSpace combines the analysis of citing, cluster, network, and multidimensional scaling, and the technologies of data mining, computer graphics, images, and intellectual technology to create a knowledge mapping featuring dynamics, diversity, and time-sharing. It focuses on detecting and analyzing the relations among the research trend, research front, and basic knowledge, as well as the internal relations among different research fronts. It can analyze literature information based on different periods of time, run statistics on publications and citing, show the literature information in certain periods of time from certain fields in the form of network mapping by cutting and splicing, and also reflect research bases and fronts of the field. This paper takes CBM-related literature data as the research object, uses CiteSpace to carry out data mining and quantitative analyses of cited passages and citations, refines the basic knowledge of the CBM industry, and grasps the latest advance, front focus, evolutionary approach, and future trends of the research, thus providing information for future studies.
2.3. Data Sources
One of the greatest problems associated with the co-citation of authors is that it only keeps records of the first author. Authors having the same name accentuates the problem. This paper aims to provide new postgraduates with the methods to acquire research focus fronts and basic knowledge. Using literature co-citation analysis, relationships among published works and research trends can be obtained. Traditional literature co-citation is adopted to lock headlines, keywords, and abstracts. Moreover, the period of time is limited to 10 years and retrieval is conducted with single search terms without any derivation and arrangement.
Data in this paper for quantitative analysis comes from SCI-EXPANDED (Science Citation Index Expanded) of the ISI Web of Science, which is an online subscription-based scientific citation indexing service originally produced by the Institute for Scientific Information (ISI). All data include the author, subject, keywords, abstract, and quotations. You can enter ts = (“CBM” or “CMM”) and ad = (“China”) in the search bar of the Web of Science for precise searching of the reference database. When this is done, 1748 results appear after the initial retrieval. As the abbreviation of CBM is also applied to biomedical and economic fields, irrelevant data have to be manually deleted, limiting the outcomes to the fields of mining, geology, energy, and fuel. The earliest thesis that was discovered in the reference database was published in 1999. As an emerging topic in the field of energy, CBM mining is rarely mentioned in the literature. The number of related papers published between 2007 and 2016 was only 578, and the search history included the subject, author, keywords, abstract, and citations. During the process of bibliometrics, we set the time unit as one year and divided 10 years from 2007 to 2016 into 10 time slices. Then CiteSpace was used to carry out matrix transformations of all recorded data which were downloaded from the Web of Science.
2.4. Distribution of Papers
To get the general data, initial statistics and summaries through the analytical function of the Web of Science were obtained (see Figure 2).
Based on the publishing date, the number of theses related to coalbed methane (CBM) in China has been increasing over time since 2007. From 2007 to 2010, China progressed gradually in this field and the number of SCI theses increased slowly; from 2010 to 2013, it increased in a wave-like manner. There was an obvious growth around 2011, probably because of China’s incentive policies. The number of published papers in 2013 was over three times greater than that in 2011, which showed an increased amount of research and more scientific findings in this field as the number of published papers increased; after 2014, the number of published SCI papers began decreasing, which was related to over-capacity in China’s coal industry.
According to the publishing institutions (see Figure 3), the China University of Mining and Technology ranks first and is far ahead of other universities and agencies with 95 published papers. The China University of Geosciences has 81 published papers, and ranks second. The other 8 in the top 10 are the China University of Petroleum, the Chinese Academy of Sciences, Shanghai Jiao Tong University, Henan Polytechnic University, Peking University, Chongqing University, the University of Science and Technology of China, and Sichuan University.
3. Experimental Section
3.1. Co-Cited Network Mapping
Drawing a map of the co-cited network based on the literature data collected in Section 2 can be achieved by using CiteSpace V. For the best results, the value of time slicing as 1 and defining the node type as ‘cited reference’ were chosen. The top 1% of the most cited or occurring items form each slice. The visualization results were obtained, as shown in Figure 4a. It includes 364 nodes and 1443 lines.
To facilitate the interpretation, each node in the picture represents one citation, and larger node sizes suggest that the publication is cited more frequently, implying that the paper is an important one within the knowledge domain. Link colors correspond directly to each time slice; for example, blue indicates the earliest citations. The most recent co-citation relationships are visualized as yellow or orange links. Purple rings indicate higher values for this metric. Larger node sizes suggest that the publication is cited more frequently and implies that the paper is an important one within the knowledge domain. Publications with large node sizes and purple rings are worth further discussion because they reflect primacy or dominance in this knowledge domain.
3.2. Early Founding Literature and High Citing Frequency Literature
Intellectual basis is a concept useful to make the nature of research fronts clear. It can be divided into two categories: early founding literature and key literature with high citation frequency and centrality, both of which form the research frame of CBM.
To find early founding literature, we identified the main theoretical and experimental studies in this field published before 2007 by half-life (the number of years that a publication receives half of its citations since its publication) and cited frequency, as shown in Table 1.
According to Figure 5, there are six papers that have high centrality (a metric of a node in a network that measures how likely an arbitrary shortest path in the network will go through the node) and cited frequency between 2007 and 2016. They are the intellectual bases that have great effect on the field of CBM in China, as shown in Table 2.
3.3. Previous Research
Crosdale et al. have verified gas sorption by coal is closely related to its physical and chemical properties, which are, in turn, governed by coal type and rank. Coal rank and type (maceral composition), per se, do not appear to be the critical factors in controlling gas sorption, but rather exert influence over pore structure development [15].
According to Bustin, the variation in the amount of desorbed gas reflects the degree of saturation and the gas storage capacity of the coal, and gas desorption rates are closely correlated with the total amount of desorbed gas and not with any measured compositional data. Although they failed in their attempt to establish a model to predict reservoir capacity, it can serve still as a reference [16].
Ayers reviewed the cases of San Juan and Powder River Basins and expounded, in detail, about the coalbed gas systems, resources, and production. According to Ayers, key parameters that control gas resources and output are thermal maturity, maceral composition, gas content, coal thickness, fracture density, in situ stress, permeability, burial history, and hydrologic setting. These parameters vary greatly in fields of production in the United States and around the world [17].
On the other hand, Scott holds the opinion that gas content in coal is not fixed, but changes when equilibrium conditions within the reservoir are disrupted. Major hydrogeologic factors affecting gas content variability include gas generation, coal properties, and reservoir conditions. Gas content generally increases where conventional and hydrodynamic trapping of coal gases occur and may decrease in areas of active recharge with downward flow potential and/or convergent flow where there is no mechanism for entrapment [18].
Qinshui Basin is the most successful CBM production base in China. The geologic features of its CBM bear great value for research. Su et al. came to the conclusion that an abnormally high pressure reservoir in the deep stagnant zone is a favorable area for coalbed methane exploration and development [19].
Shi’s model [20] is a new version of the stress formulation, making a direct link between the volumetric matrix strain and the amount of gas desorbed, and can be well matched with the San Juan basin and Fenn Big Valley. The new permeability calculation model has been widely used and referred to.
In 2008, Yao discussed the relation between the fractal dimension and adsorption capacity of methane by fractal analysis and pointed out that the two fractal dimensions, D1 and D2, had different correlations with CH4 adsorption capacity of coal. Higher fractal dimension D1 correlates to more irregular surfaces that provide more space for CH4 adsorption. Higher fractal dimension D2 represents a higher heterogeneity of the pore structure and a higher liquid/gas surface tension that reduces CH4 adsorption capacity. Therefore, more irregular coal surfaces and more homogeneous pore structures indicate higher CH4 adsorption capacity of coal [21]. Afterwards, Yao selected samples from more regions, including North, Northwest, and Northeast China, and carried out more elaborate experiments. The results show the fractal dimension has a negative correlation with the petrologic permeability of coal, particularly for higher rank coal (with 1.47–4.21% R0, mean max vitrinite reflectance.), from which a strong negative linear correlation (R2 = 0.85) between the fractal dimension and permeability is observed. A ‘U-shaped’ trend between fractal dimensions and coal ranks is observed, with the minimum fractal dimensions occurring at 1.1–1.3% RO,max. The sub-bituminous, highly-volatile bituminous, semi-anthracite, and anthracite coals have higher fractal dimensions. The effects of coal rank upon the fractal dimensions are mainly due to the variety of micropore contents and aromaticity of coals with coalification [22].
How to estimate the output effectively, precisely, and rapidly is one of the most important topics. Based on the mathematic analytic hierarchy process of the Weibei Coalfield (Southeastern Ordos Basin, China), Yao, at the same time, calculated the analytic hierarchy process and the evaluated factors included coal thickness, gas content, coal rank, CBM resource concentration, permeability and porosity, burial depth, and tectonic type [23]. According to Cai’s point of view, a positive relationship was found between CBM content and basin hydrodynamics, in which CBM easily concentrates in groundwater stagnant zones because of the water pressure. Taking the Southern Qinshui Basin as an example, he integrated a geographical information system (GIS) and the analytical hierarchy fuzzy prediction method (AHP) to evaluate the CBM resources. The methods by Yao and Cai can help us better estimate the potential of reservoirs [24].
Tao revealed that the burial depth, the bottom hole pressure, and the dewatering rate affected the effective stress imposed on the coal reservoir, which further induced changes in permeability and productivity. The elastic modulus of the coal body reflects its ability to withstand compression: the greater the elastic modulus is, the less the permeability decreases. If the bottom hole pressure drops too fast, or the dewatering rate is too high, there will be a strong stress response, resulting in decreasing permeability and productivity. These laws can better help with production management [25].
While many researchers examined the effect of pore structure on gas adsorption/diffusion and gas flow in coal seams, Cai’s work serves as a classical case for those who want to understand the pore structure and its impact on CH4 adsorption capacity and flow capability. According to his articles, the more irregular the surface, the more heterogeneous the pore structure is, meaning more surface area and stronger adsorption capability, especially for micropores with sizes in the range of 2–10 nm and the mesopores. At the same time, the ash yield also has a great effect on CH4 adsorption capacity of coal. The coal with a high content of macroporosity generally has good gas flow capability. Therefore, it may have significant implications for CBM exploitation [26].
3.4. Visualized Analysis of Research Fronts, Hot Spots, and Discussion
In order to get an impression of the evolution of the research focus in coalbed methane studies, key terms with high frequency and centrality are detected every two years and the list is drawn in Figure 6.
From an interpretive perspective, the size of a cluster is determined by the total number of nodes (publications) that a cluster contains. In this instance, there are 36 total clusters in the network. Table 3, generated by CiteSpace, details the largest clusters chronologically. Figure 6 illustrates the cluster labels which summarize the publications, including keywords, titles, and abstracts. One can analyze these cluster labels to find out the research fronts and hot spots in the CBM research field.
The analysis of terms cited in articles in Table 3 by Cluster Explorer shows that CBM research in China from 2007 to 2008 mainly focused on CO2 sequestration and CBM displacement. On one hand, on account of the desired geological environment, the commercial exploitation of CBM has been achieved in the Ordos Basin, Qinshui Basin, and Huainan Coalfield in China. At the same time, there was favorable news about enhanced coalbed methane recovery (ECBM) projects in America and Australia. ECBM can not only reduce greenhouse gases, but increase the production of CBM, which has greatly inspired the enthusiasm of Chinese researchers. In 2009 and 2010, researchers gave more consideration to coal reservoir characteristics—such as high pressure and groundwater—as the exploration went deeper. Since CO2 had an obvious effect on the adsorption swelling of coal, it was of great importance to obtain a better understanding of CO2 sorption/CH4 desorption. In 2011, some hot spots focused on the research of permeability where the geological environment was complex and mining could not reach, as the amount of studies increased. A better understanding of the flow conditions of CO2 and CH4 in coal matrices were accomplished by this research. There were also studies on the enhancement, upgrade, and application of underground/surface CBM extraction technologies. In this manner, the hydraulic fracturing, cutting, and deep-hole blasting technologies were widely applied, and the long-distance docking of surface multi-branch horizontal wells and underground boreholes was firstly achieved in China.
3.5. Knowledge Tree Mapping
Finally, combining Figure 5 and Figure 6 into a knowledge tree mapping (as seen in Figure 7), the cluster labels that represent the research hot spots by rank order comprise the vertical axis. The nodes are arranged horizontally, chronologically, and linked with different colored lines. Blue indicates the earliest citations, whereas orange indicates the most recently made citations. The larger nodes or nodes with purple rings show more important value. For example, if someone wants to know about some information of the Eastern Ordos basin, Su’s work is the most cited [19] and Tao’s [27] paper is the latest research.
4. Conclusions
According to the analysis, the number of papers about CBM shows an increasing trend, currently, especially after 2011 when there was an obvious rise. Probably inspired by China’s energy policies (CO2 mitigation, climate change, and environmental sustainability), the field is going through a period of rapid development. However, the number of SCI papers decreased after 2014, which was probably a reflection of the overcapacity in China’s coal industry. Based on the amount of papers and the distribution of publishing institutions, the China University of Mining and Technology is the leading research institution. Knowledge can be obtained from a visualized map of co-cited networks, including six founding theses and six papers with high citing frequency and centrality with respect to research on ECBM technologies and the perfection, upgrade, and application of CBM extraction technologies. Research fronts aim to further understand the permeability of coal seams where the geological environment is complex.
Acknowledgments
This work was supported by the National Natural Science Foundation of China (51174241, 51674049) and by the State Key Laboratory of Coal Mine Disaster Dynamics and Control, Chongqing University, Chongqing, China. This support is gratefully acknowledged.
Author Contributions
X.L. and X.Z. conceived the design, coordinated and helped to draft the manuscript, acquired data, conducted the analysis and interpretation of data, and reviewed the manuscript; L.Z. and G.H. participated in the sequence alignment and critical revision for important intellectual content. All authors read and approved the final manuscript.
Conflicts of Interest
The authors declare no conflict of interest.
References
- Moore, T.A. Coalbed methane: A review. Int. J. Coal Geol. 2012, 101, 36–81. [Google Scholar] [CrossRef]
- Riahi, K. Fifth Assessment Report; IPCC: New York, NY, USA, 2014. [Google Scholar]
- Li, B.; Gasser, T.; Ciais, P.; Piao, S.; Tao, S.; Balkanski, Y.; Li, L.Z. The contribution of China’s emissions to global climate forcing. Nature 2016, 531, 357–361. [Google Scholar] [CrossRef] [PubMed]
- Spracklen, D.V. Global warming: China’s contribution to climate change. Nature 2016, 531, 310–312. [Google Scholar] [CrossRef] [PubMed]
- Rightmire, C.T.; Eddy, G.E.; Kirr, J.N. (Eds.) Coalbed Methane Resources of the United States; American Association of Petroleum Geologists: Tulsa, OK, USA, 1984. [Google Scholar]
- Zhou, F.; Xia, T.; Wang, X.; Zhang, Y.; Sun, Y.; Liu, J. Recent developments in coal mine methane extraction and utilization in China: A review. J. Nat. Gas Sci. Eng. 2016, 31, 437–458. [Google Scholar] [CrossRef]
- Li, W.; Xu, R. Technology of gas drainage and utilization in Huaibei mining area. J. Coal Sci. Eng. (China) 2009, 15, 278–283. [Google Scholar] [CrossRef]
- Yun, J.; Xu, F.; Liu, L.; Zhong, N.; Wu, X. New progress and future prospects of CBM exploration and development in China. Int. J. Min. Sci. Technol. 2012, 22, 363–369. [Google Scholar] [CrossRef]
- Liu, D.M.; Li, J.Q. Main geological controls on distribution and occurrence and enrichment patterns of coalbed methane in China. Coal Sci. Technol. 2014, 42, 19–24. [Google Scholar]
- De Solla Price, D.J. Networks of scientific papers. Science 1965, 149, 510–515. [Google Scholar] [CrossRef]
- Mullins, N.C.; Hargens, L.L.; Hecht, P.K.; Kick, E.L. The group structure of cocitation clusters: A comparative study. Am. Sociol. Rev. 1977, 42, 552–562. [Google Scholar] [CrossRef]
- Chen, C. CiteSpace II: Detecting and visualizing emerging trends and transient patterns in scientific literature. J. Am. Soc. Inf. Sci. Technol. 2006, 57, 359–377. [Google Scholar] [CrossRef]
- Chen, C.; Ibekwe-SanJuan, F.; Hou, J. The structure and dynamics of cocitation clusters: A multiple-perspective cocitation analysis. J. Am. Soc. Inf. Sci. Technol. 2010, 61, 1386–1409. [Google Scholar] [CrossRef]
- Wang, X.; Nathwani, J.; Wu, C. Visualization of International Energy Policy Research. Energies 2016, 9, 72. [Google Scholar] [CrossRef]
- Crosdale, P.J.; Beamish, B.B.; Valix, M. Coalbed methane sorption related to coal composition. Int. J. Coal Geol. 1998, 35, 147–158. [Google Scholar] [CrossRef]
- Bustin, R.M.; Clarkson, C.R. Geological controls on coalbed methane reservoir capacity and gas content. Int. J. Coal Geol. 1998, 38, 3–26. [Google Scholar] [CrossRef]
- Ayers, W.B., Jr. Coalbed gas systems, resources, and production and a review of contrasting cases from the San Juan and Powder River basins. AAPG Bull. 2002, 86, 1853–1890. [Google Scholar]
- Scott, A.R. Hydrogeologic factors affecting gas content distribution in coal beds. Int. J. Coal Geol. 2002, 50, 363–387. [Google Scholar] [CrossRef]
- Su, X.; Lin, X.; Liu, S.; Zhao, M.; Song, Y. Geology of coalbed methane reservoirs in the Southeast Qinshui Basin of China. Int. J. Coal Geol. 2005, 62, 197–210. [Google Scholar] [CrossRef]
- Shi, J.Q.; Durucan, S. A model for changes in coalbed permeability during primary and enhanced methane recovery. SPE Reserv. Eval. Eng. 2005, 8, 291–299. [Google Scholar] [CrossRef]
- Yao, Y.; Liu, D.; Tang, D.; Tang, S.; Huang, W. Fractal characterization of adsorption-pores of coals from North China: An investigation on CH 4 adsorption capacity of coals. Int. J. Coal Geol. 2008, 73, 27–42. [Google Scholar] [CrossRef]
- Yao, Y.; Liu, D.; Tang, D.; Tang, S.; Huang, W.; Liu, Z.; Che, Y. Fractal characterization of seepage-pores of coals from China: An investigation on permeability of coals. Comput. Geosci. 2009, 35, 1159–1166. [Google Scholar] [CrossRef]
- Yao, Y.; Liu, D.; Tang, D.; Tang, S.; Che, Y.; Huang, W. Preliminary evaluation of the coalbed methane production potential and its geological controls in the Weibei Coalfield, Southeastern Ordos Basin, China. Int. J. Coal Geol. 2009, 78, 1–15. [Google Scholar] [CrossRef]
- Cai, Y.; Liu, D.; Yao, Y.; Li, J.; Qiu, Y. Geological controls on prediction of coalbed methane of No. 3 coal seam in Southern Qinshui Basin, North China. Int. J. Coal Geol. 2011, 88, 101–112. [Google Scholar] [CrossRef]
- Tao, S.; Wang, Y.; Tang, D.; Xu, H.; Lv, Y.; He, W.; Li, Y. Dynamic variation effects of coal permeability during the coalbed methane development process in the Qinshui Basin, China. Int. J. Coal Geol. 2012, 93, 16–22. [Google Scholar] [CrossRef]
- Cai, Y.; Liu, D.; Pan, Z.; Yao, Y.; Li, J.; Qiu, Y. Pore structure and its impact on CH4 adsorption capacity and flow capability of bituminous and subbituminous coals from Northeast China. Fuel 2013, 103, 258–268. [Google Scholar] [CrossRef]
- Tao, S.; Tang, D.; Xu, H.; Gao, L.; Fang, Y. Factors controlling high-yield coalbed methane vertical wells in the Fanzhuang Block, Southern Qinshui Basin. Int. J. Coal Geol. 2014, 134, 38–45. [Google Scholar] [CrossRef]
Figure 1.
Analytical framework.

Figure 2.
The number of papers published from 2007 to 2016.
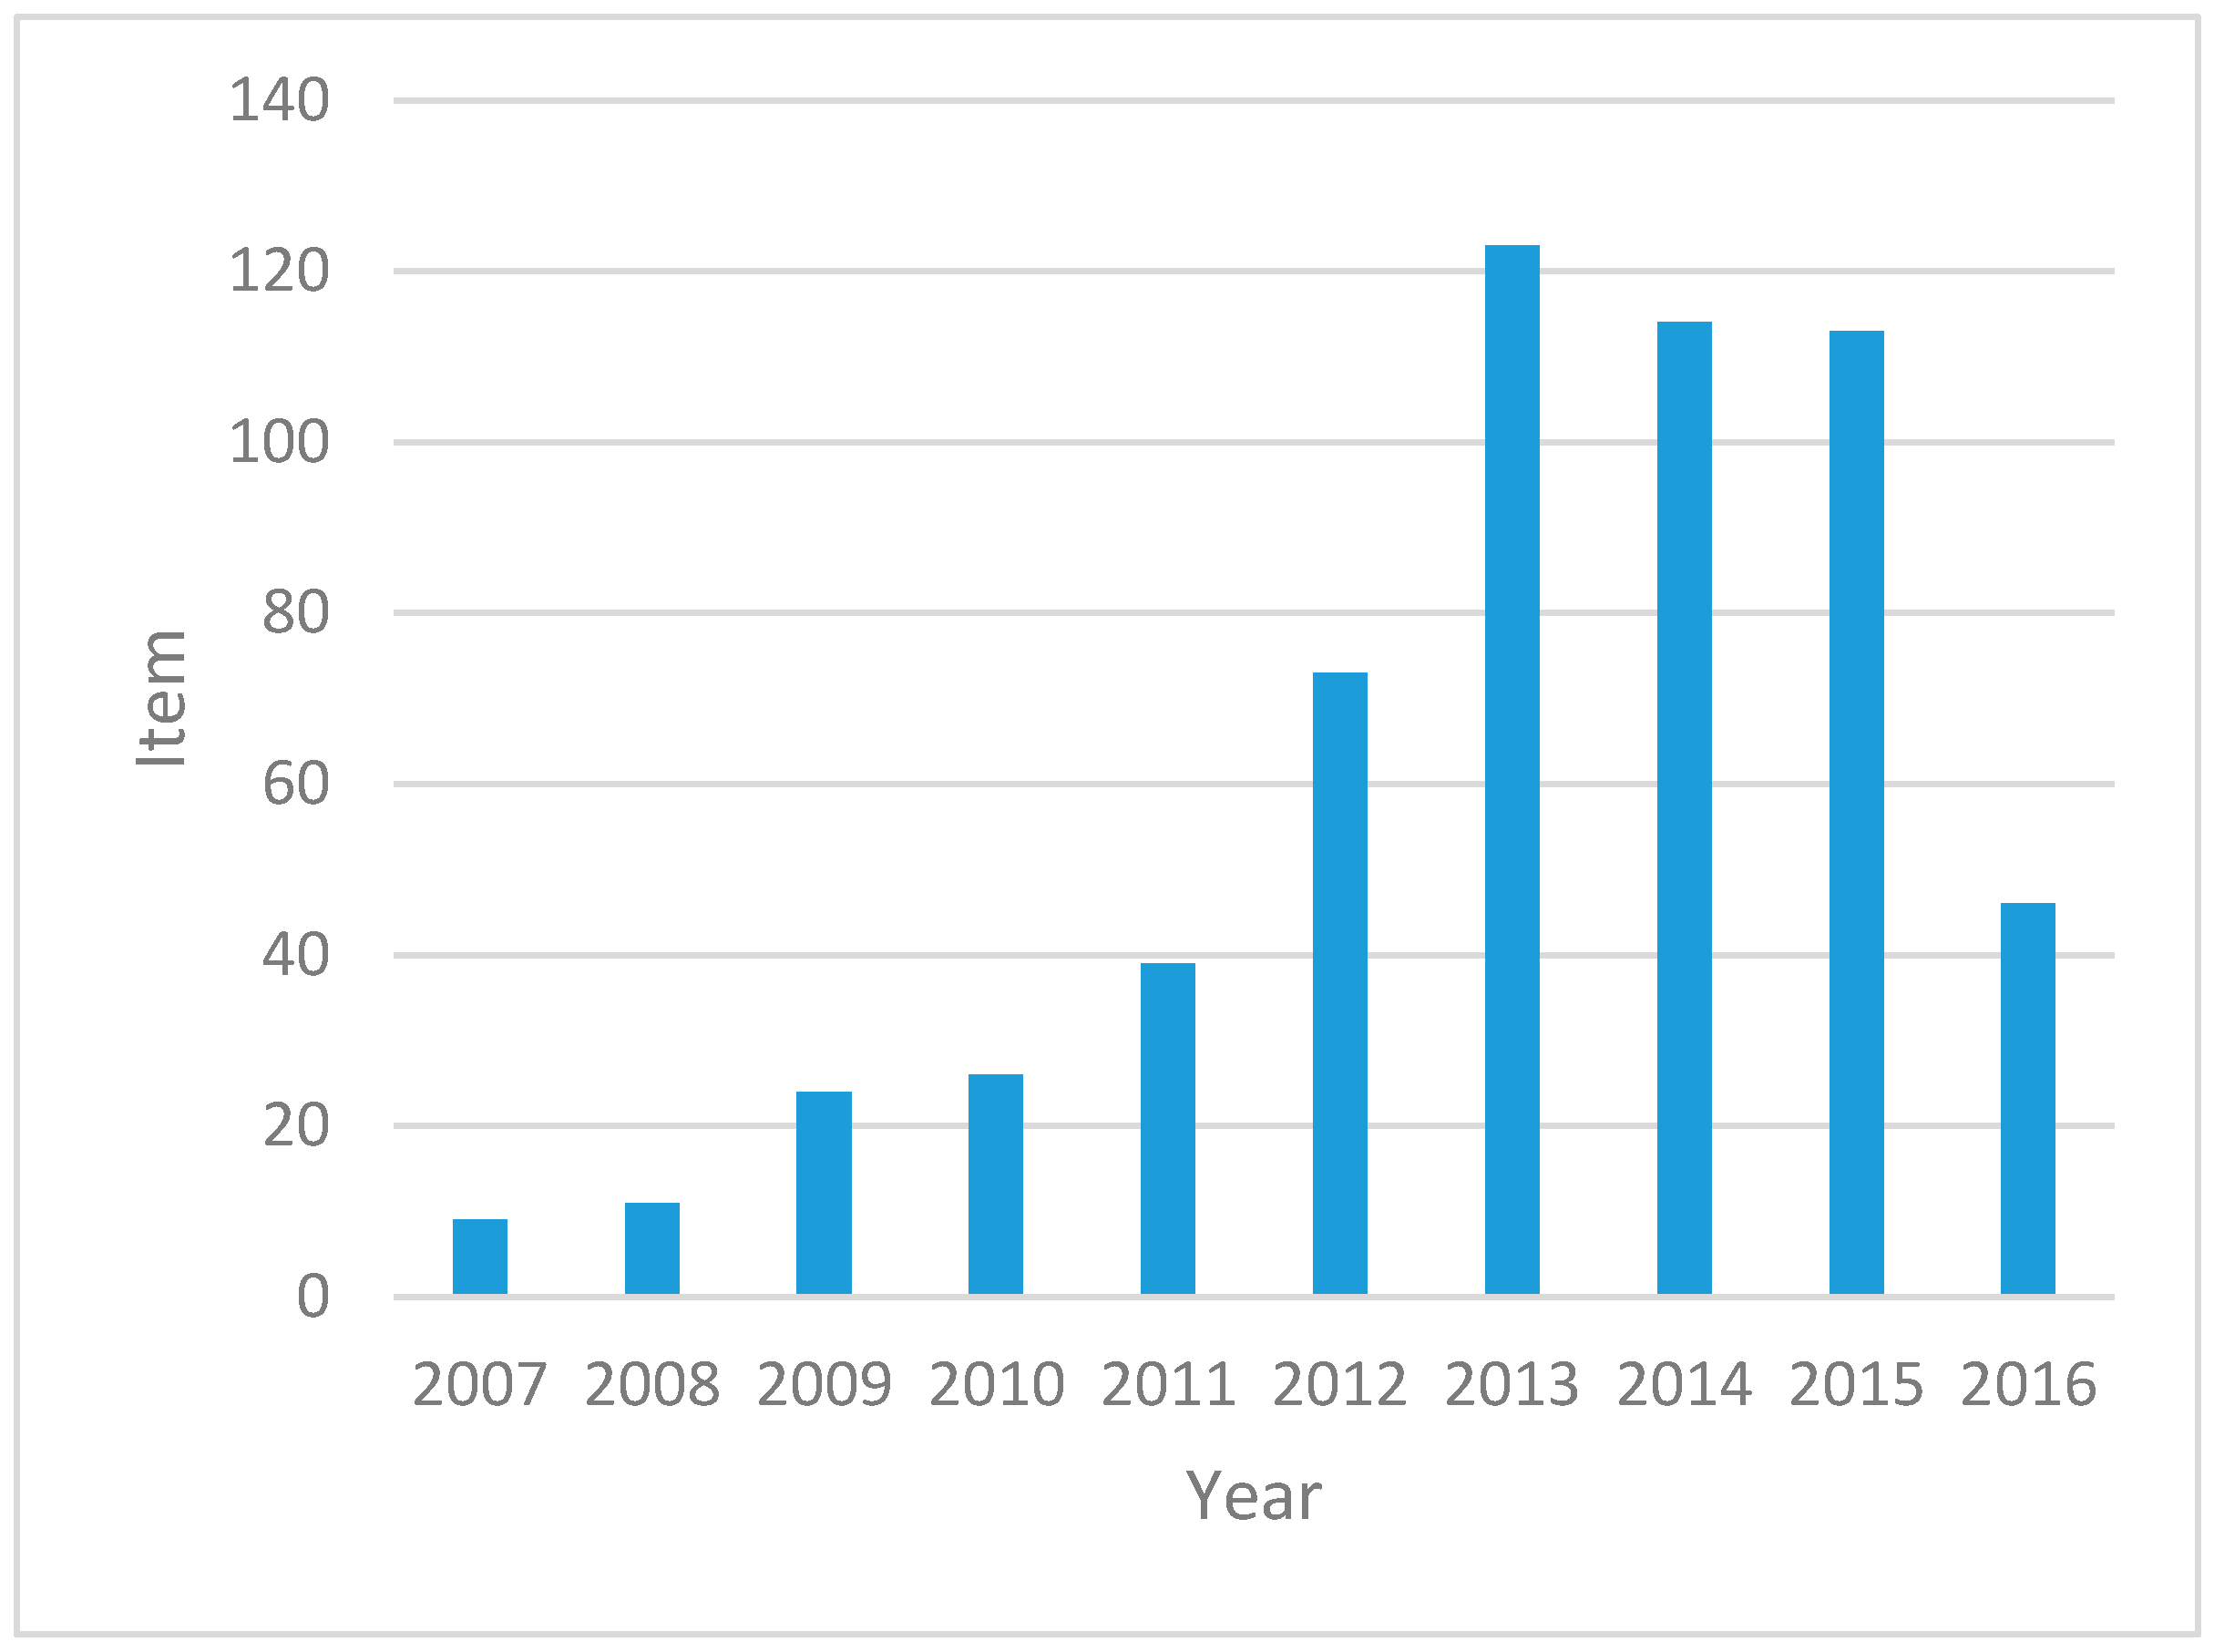
Figure 3.
Statistics of paper publishing institutions.
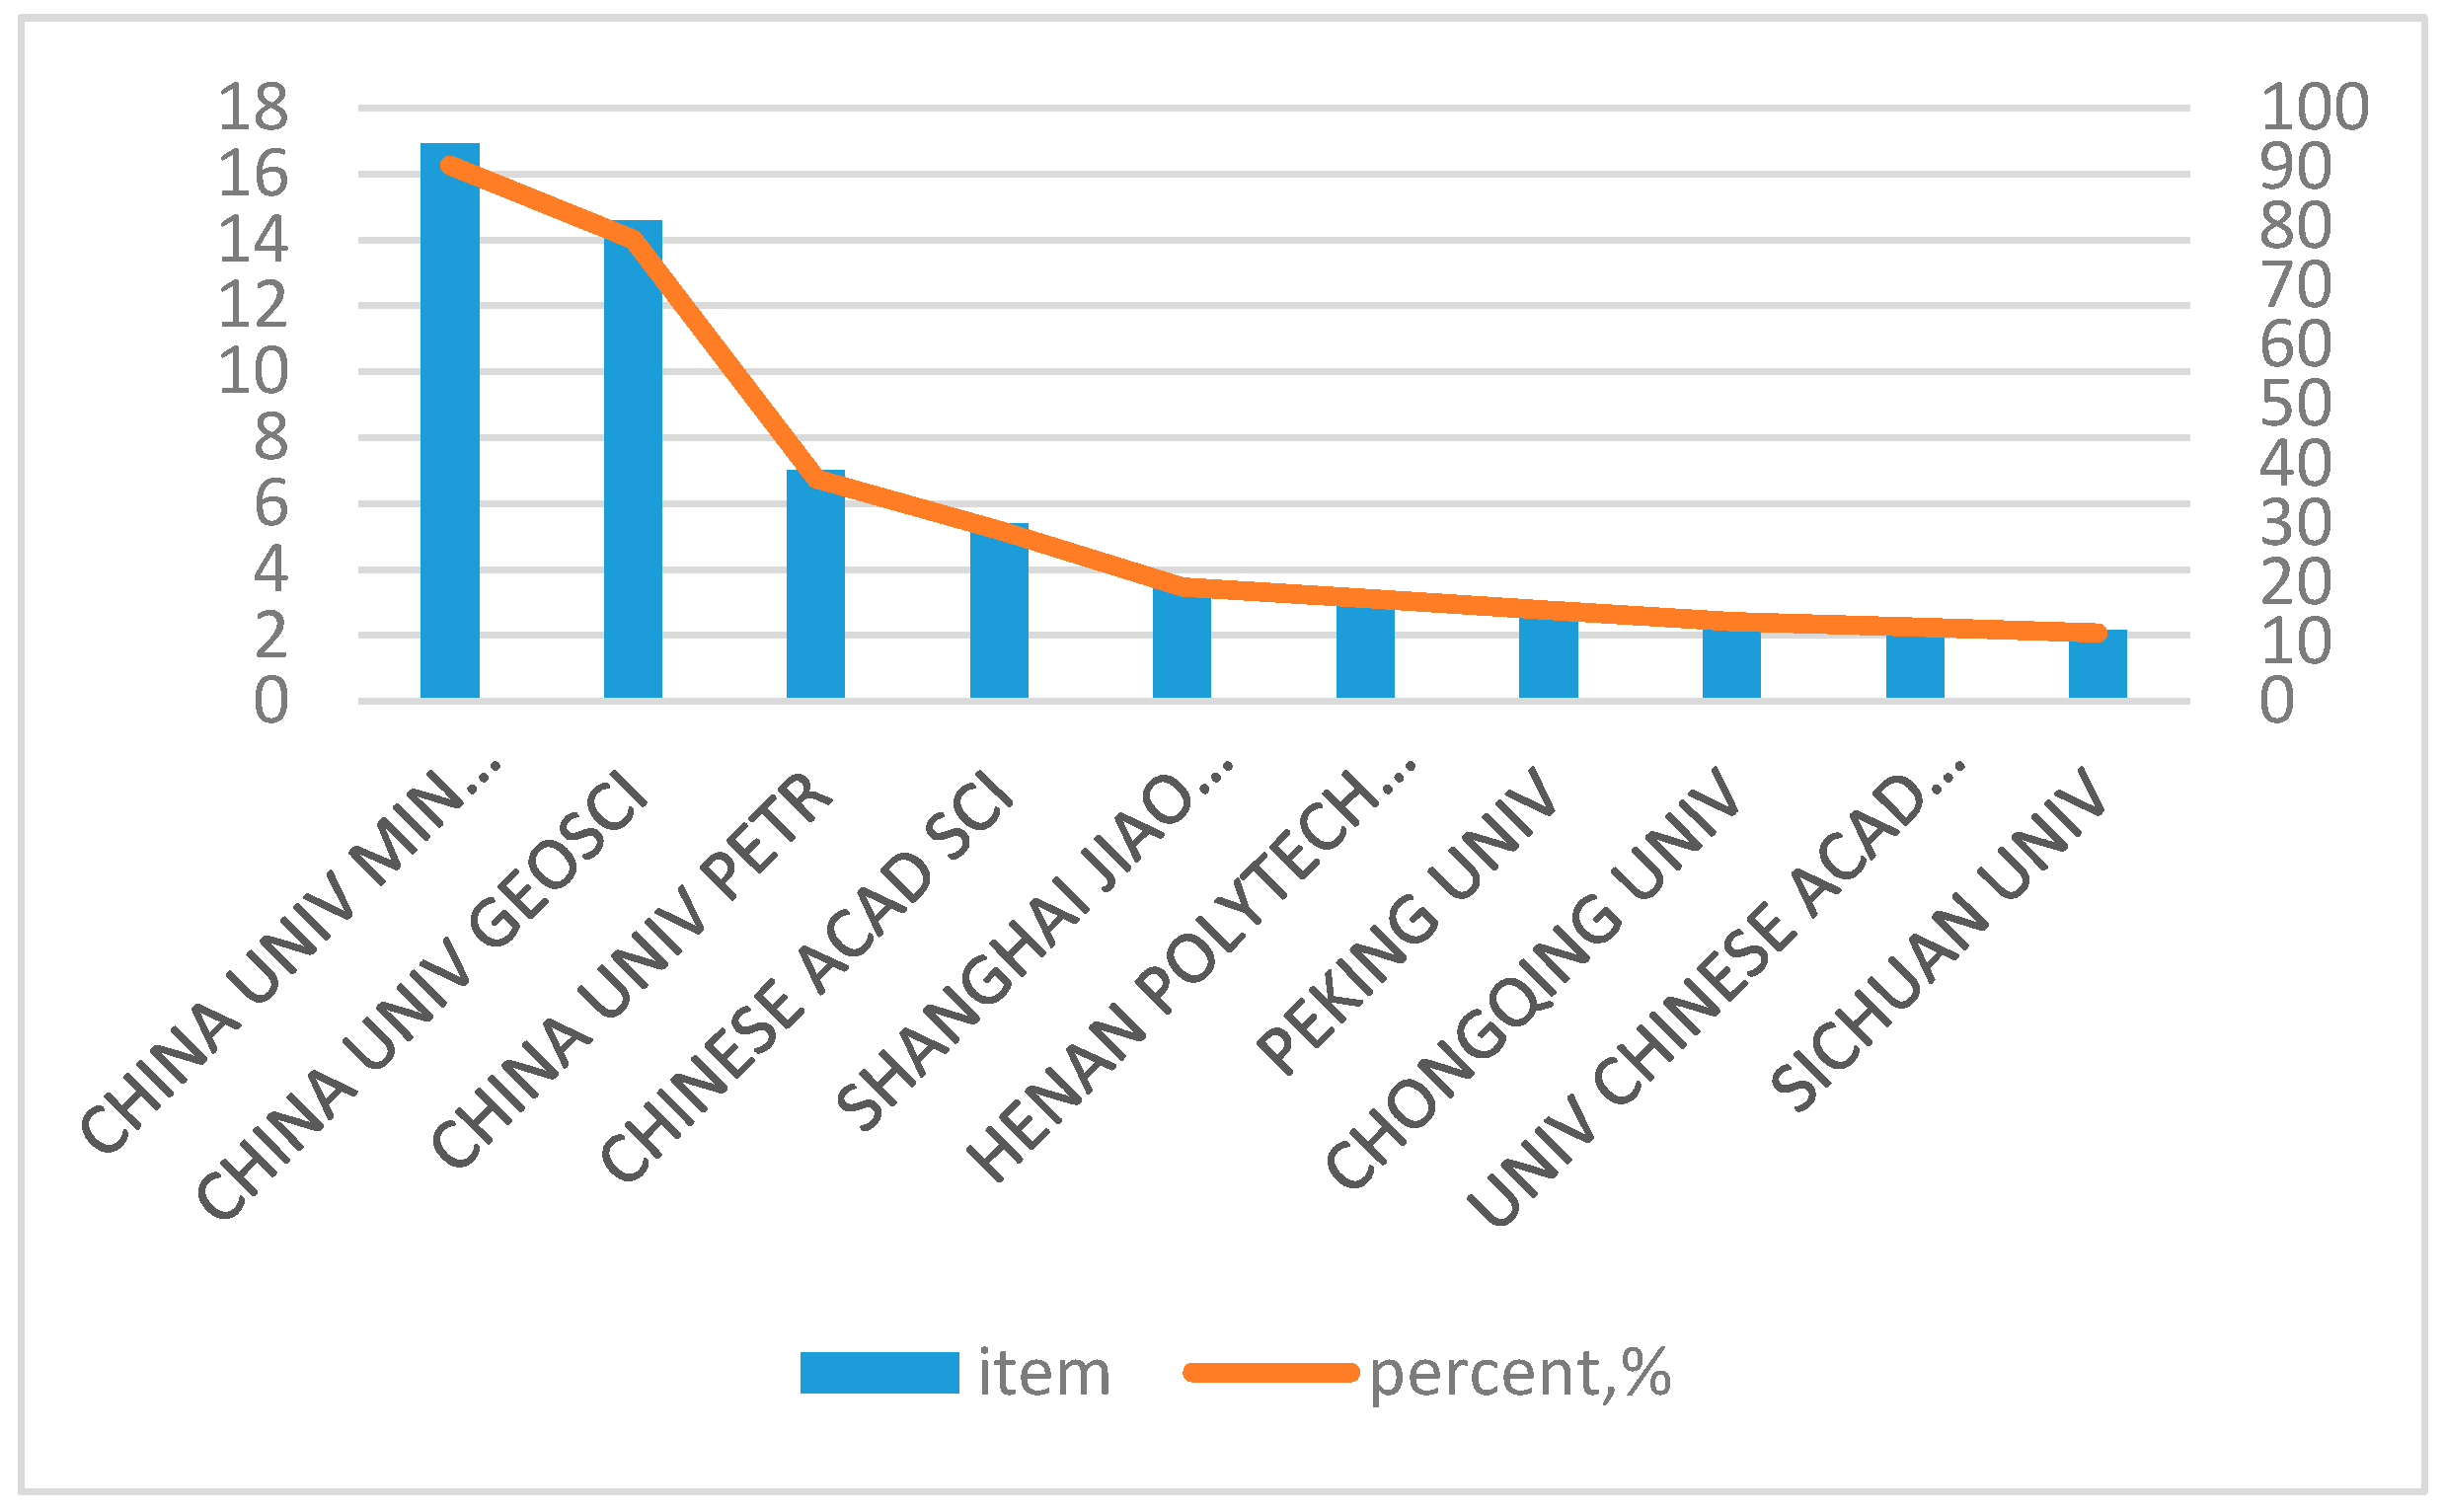
Figure 4.
Map of the co-cited network. (a) Befeore nodes screening; (b) After nodes screening.
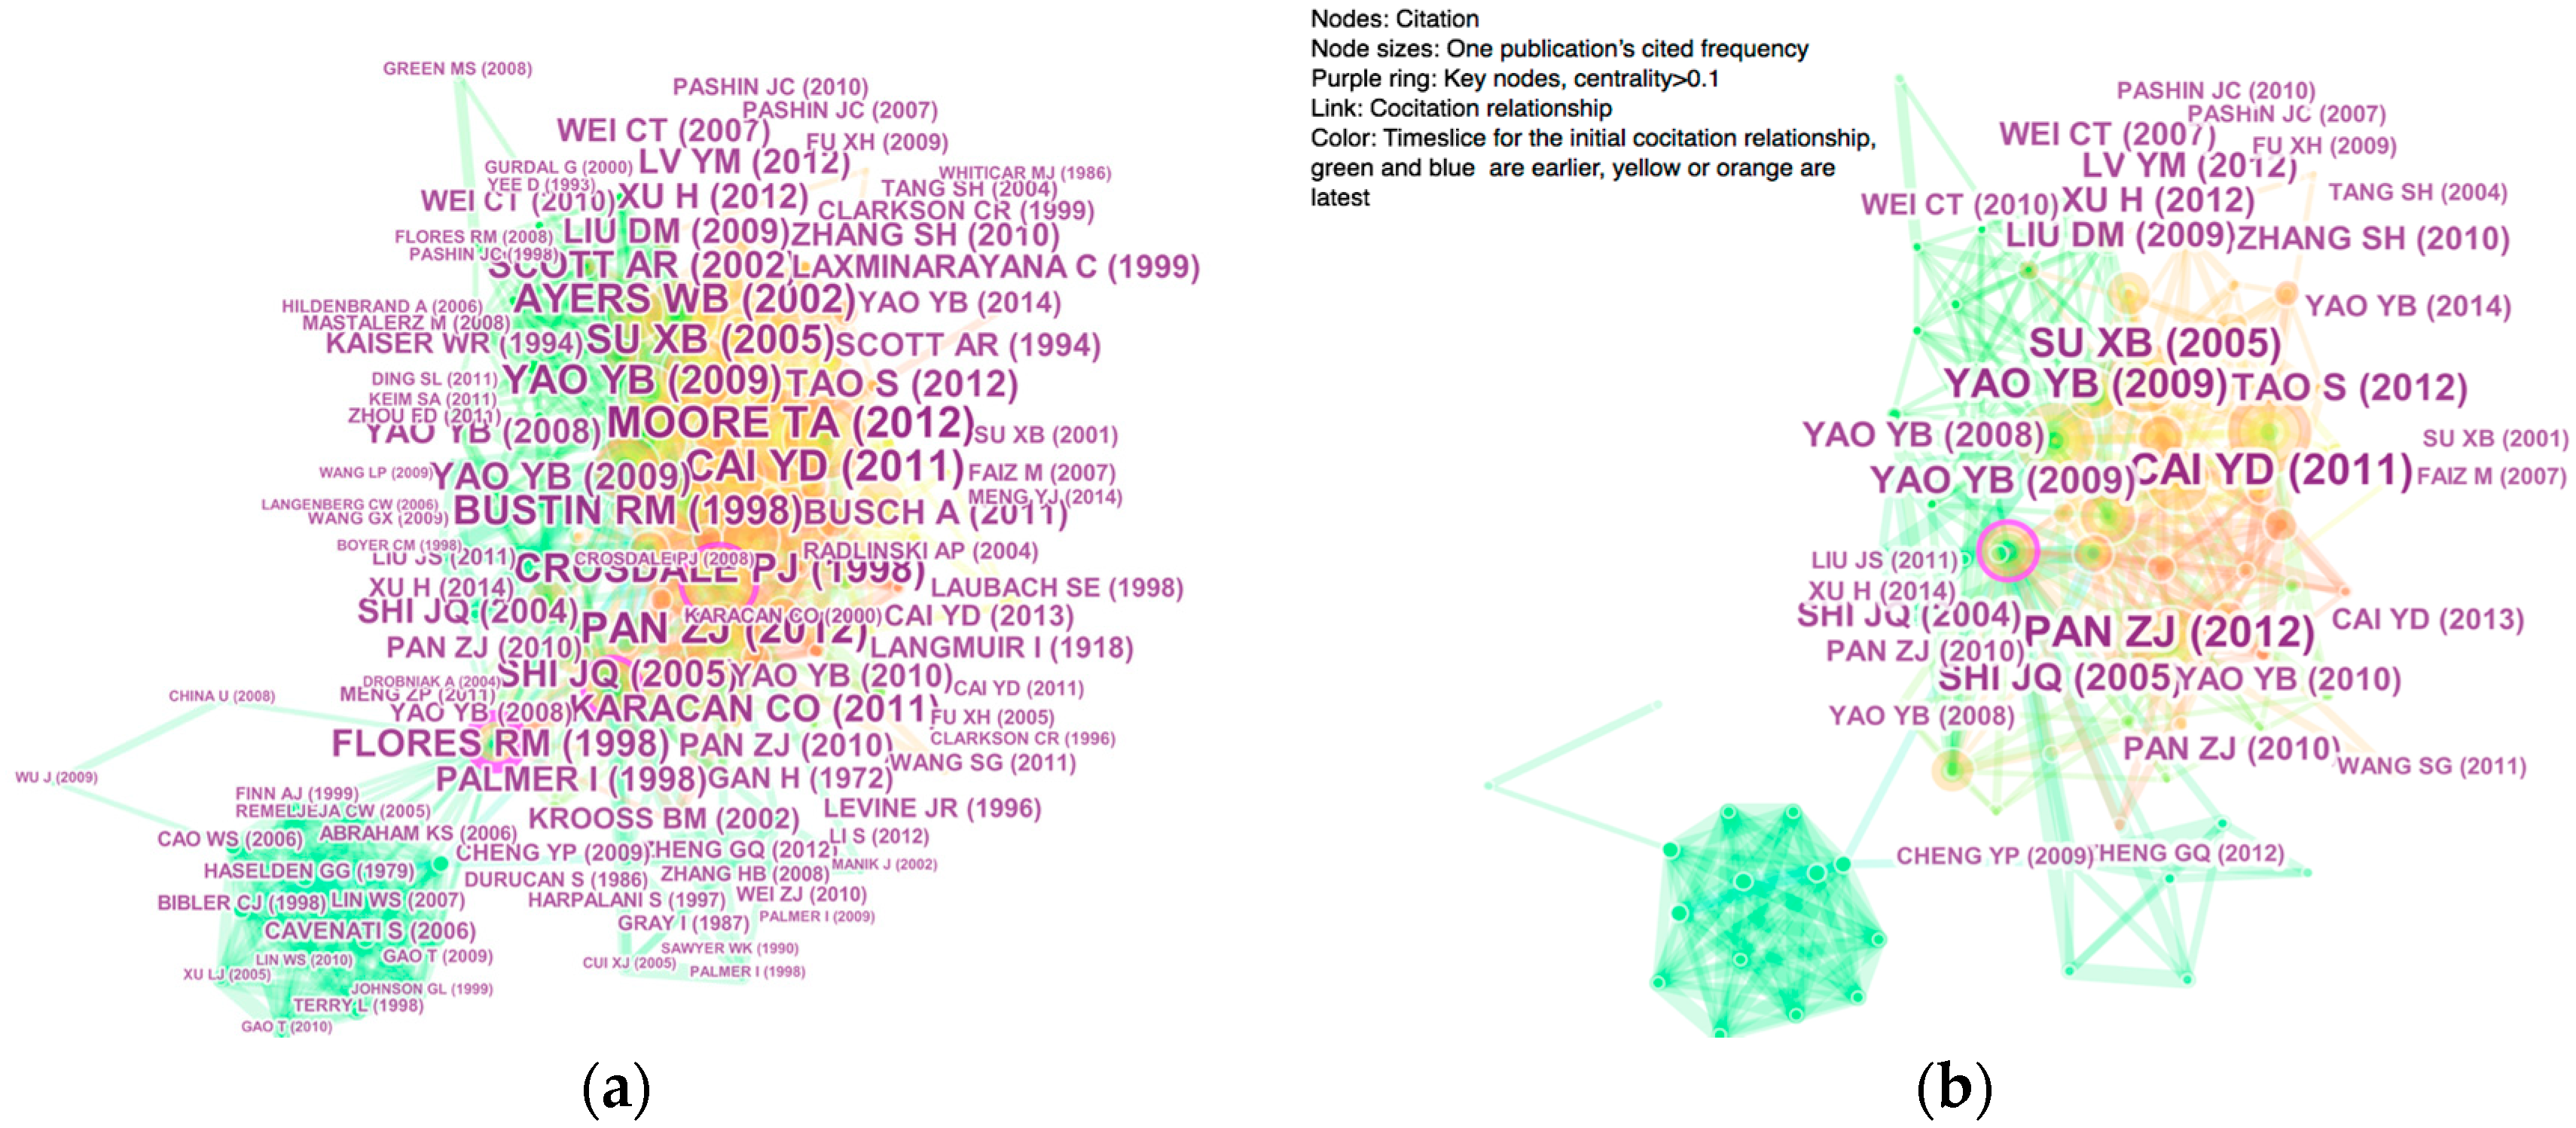
Figure 5.
Time sequence map of the co-cited network.
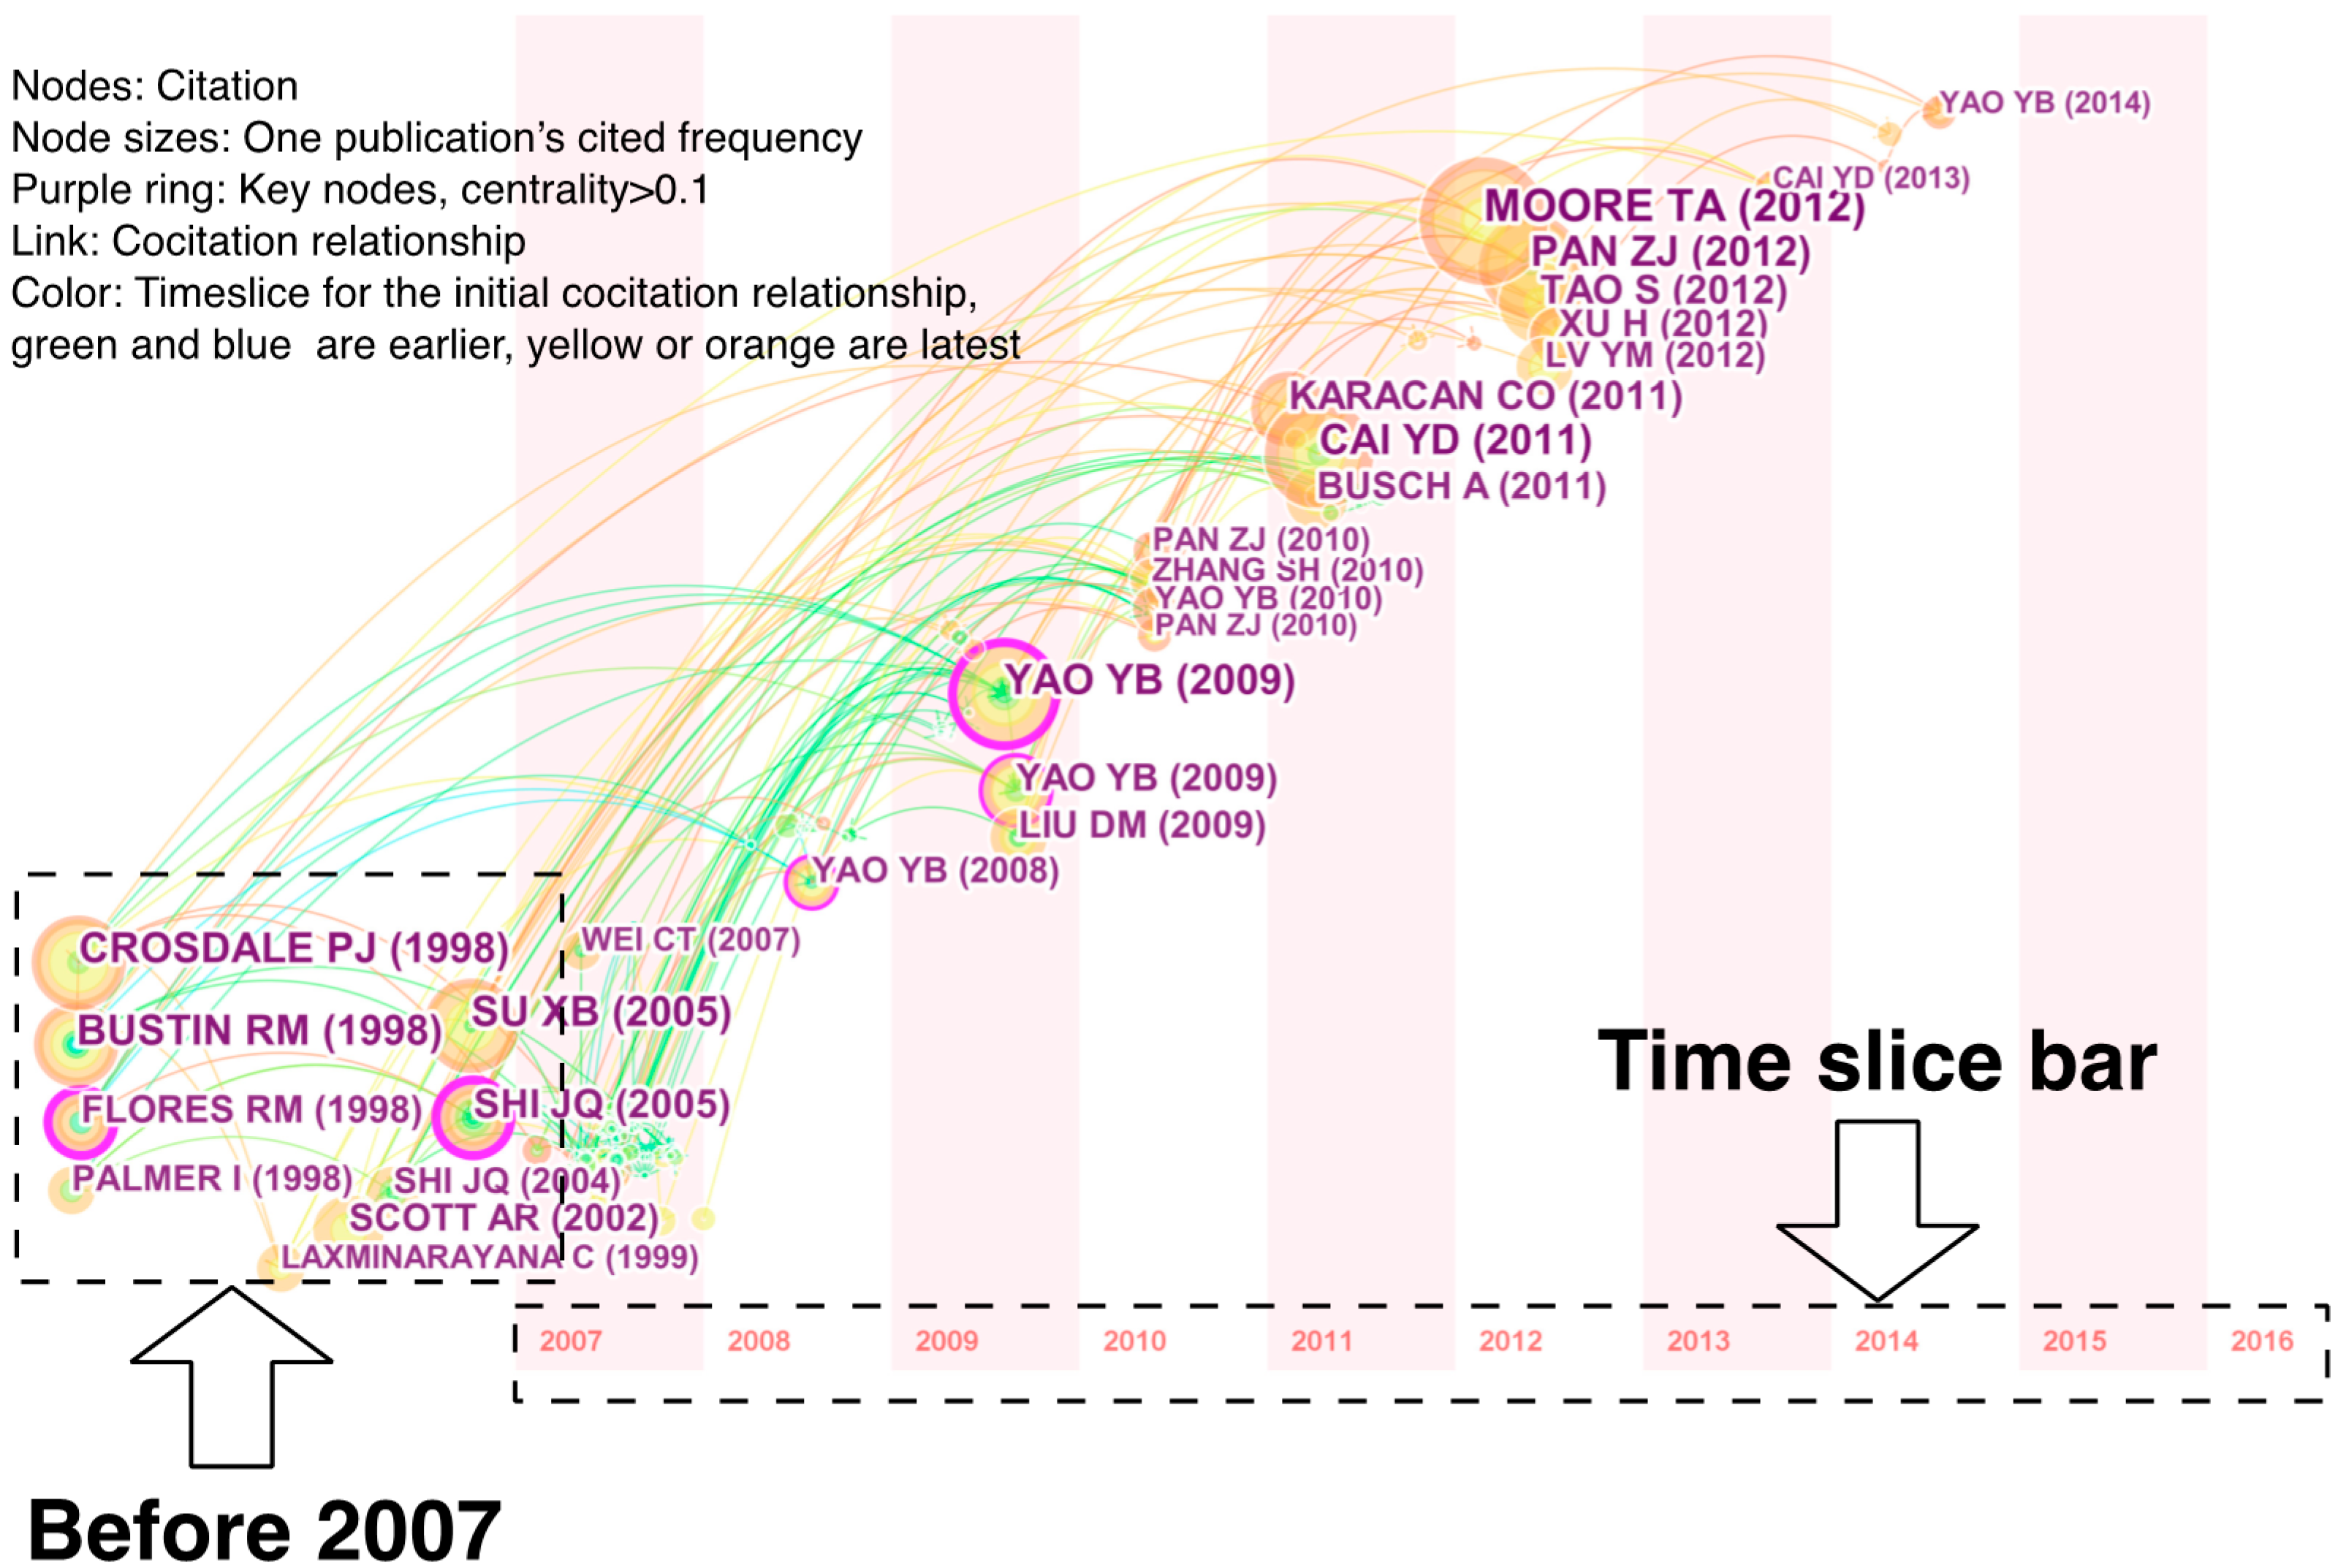
Figure 6.
Visualized map of research fronts and hot spots.
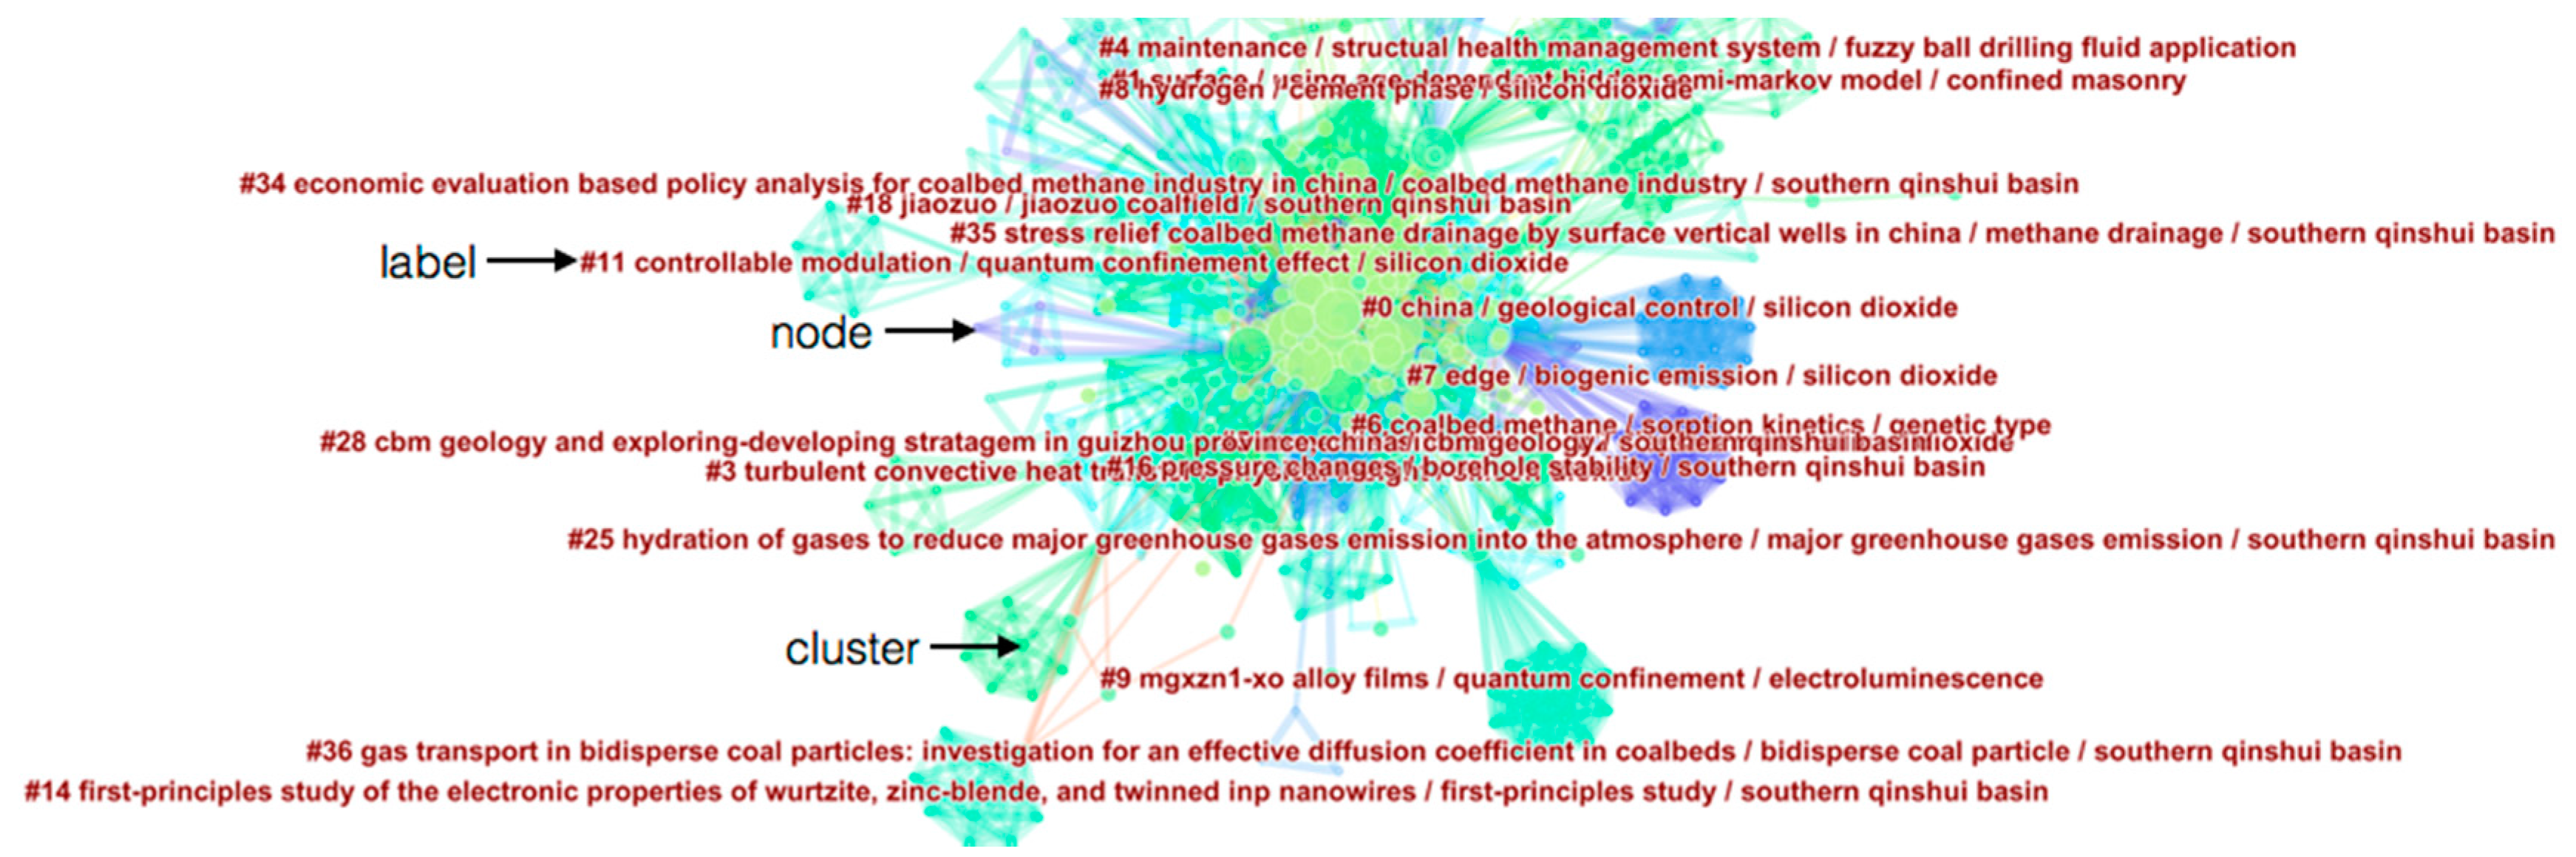
Figure 7.
Knowledge mapping tree.


Table 1.
Early founding literature
| Author | Year | Source | Freq | Half-Life |
|---|---|---|---|---|
| Crosdale | 1998 | INT J COAL GEOL | 29 | 13 |
| Bustin | 1998 | INT J COAL GEOL | 28 | 11 |
| Ayers | 2002 | AAPG BULL | 27 | 7 |
| Scott | 2002 | INT J COAL GEOL | 24 | 7 |
| Su | 2005 | INT J COAL GEOL | 32 | 3 |
| Shi | 2005 | SPE RESERV EVAL ENG | 21 | 5 |
Table 2.
Classical papers with high citing frequency and centrality
| Author | Year | Source | Freq | Centrality |
|---|---|---|---|---|
| Yao YB | 2008 | INT J COAL GEOL | 21 | 0.02 |
| Yao YB | 2009 | COMPUT GEOSCI-UK | 22 | 0.01 |
| Yao YB | 2009 | INT J COAL GEOL | 29 | 0.04 |
| Cai YD | 2011 | INT J COAL GEOL | 28 | 0.05 |
| Tao S | 2012 | INT J COAL GEOL | 22 | 0.02 |
| Cai YD | 2013 | FUEL | 14 | 0.01 |
Table 3.
High frequency and centrality terms assessed every two years
| Time Span | High Frequency and Centrality Terms |
|---|---|
| 2007–2008 | CO2 sequestration; enhanced coalbed methane recovery; sequestration; coalbed methane well; Hedong area; land surface temperature; coal mine district monitoring carbon dioxide injection; coalbed methane displacement; gas diffusion |
| 2009–2010 | Methane resource assessment; Southern North China; coal reservoir characteristic; Huaibei coalfield; Xiangning mining area; anthracitic coal; conceptual economic; CO2 storage; Shanxi; full scale; methane drainage; high-pressure; sorption isotherm; CH4; sorption kinetic; CBM adsorption-liquefaction process |
| 2011–2012 | Utilization; pumping system; sucker rod; coal-bed methane; radial horizontal well; meta-analysis; China; coalbed methane development process; CBM contant; CBM database; coalbed thickness |
| 2013–2014 | Pore structure; anisotropic permeability; permeability change; reservoir pressure; CBM extraction; development; coalbed methane production; coalbed methane development process; absolute permeability |
| 2015–2016 | Coal mine gas; methane separation; gas hydrate formation; silica sand CH4-N2-O2-ThF-H2O system; field application; hydraulics calculation; hydraylic fracturing; radial jet drilling; gas outbursts; CBM drainage |
© 2017 by the authors. Licensee MDPI, Basel, Switzerland. This article is an open access article distributed under the terms and conditions of the Creative Commons Attribution (CC BY) license (http://creativecommons.org/licenses/by/4.0/).
Share and Cite
MDPI and ACS Style
Luo, X.; Zhang, X.; Zhang, L.; Huang, G. Visualization of Chinese CBM Research: A Scientometrics Review. Sustainability 2017, 9, 980. https://doi.org/10.3390/su9060980
AMA Style
Luo X, Zhang X, Zhang L, Huang G. Visualization of Chinese CBM Research: A Scientometrics Review. Sustainability. 2017; 9(6):980. https://doi.org/10.3390/su9060980
Chicago/Turabian StyleLuo, Xiao, Xin Zhang, Long Zhang, and Gun Huang. 2017. "Visualization of Chinese CBM Research: A Scientometrics Review" Sustainability 9, no. 6: 980. https://doi.org/10.3390/su9060980
Note that from the first issue of 2016, this journal uses article numbers instead of page numbers. See further details here.