
A Multi-Step Approach to Assess the Lifecycle Economic Impact of Seismic Risk on Optimal Energy Retrofit

 ,
,  ,
, 


Abstract
:1. Introduction
2. Methodology
- Step (1)—Optimization of building energy retrofit: a wide set of possible and compatible combinations of retrofit solutions is considered among a set of ERMs, determining, at the end of this step, the most suitable configuration as the outcome of a cost-optimal analysis.
- Step (2)—Assessment of seismic economic losses: given that the existing building is prone to seismic risk, future costs associated with the reduction of the building structural capacity are handled in this step. In detail, the seismic induced damages and the related economic investment to restore the damaged components are quantified for the “as built” existing building throughout its lifetime.
- Step (3)—Integration of energy and structural aspects: the cost-optimal ERMs identified in Step (1) are associated to proper engineering demand parameters and component performances of the existing building. In detail, the operation of the ERMs is linked to the level of seismic induced damage of the non-structural components onto which they are applied (e.g., walls, windows, etc.).
- Step (4)—Assessment of the influence of energy retrofit on seismic economic losses: the analysis of Step (2) is conducted for the retrofitted building as well, based on the constraints defined in Step (3) and by considering the implementation of the cost-optimal energy retrofit solution identified in Step (1). The difference in global costs (i.e., saving) is, in this way, quantified with respect to the as built configuration. The outcomes can be useful for the selection of proper ERMs, looking at the overall cost-effectiveness of the retrofit itself. On the other hand, they can be used to integrate combined energy and structural retrofit measures, with the final aim of reducing the overall cost (or, more in general, other sustainability parameters) of the intervention.
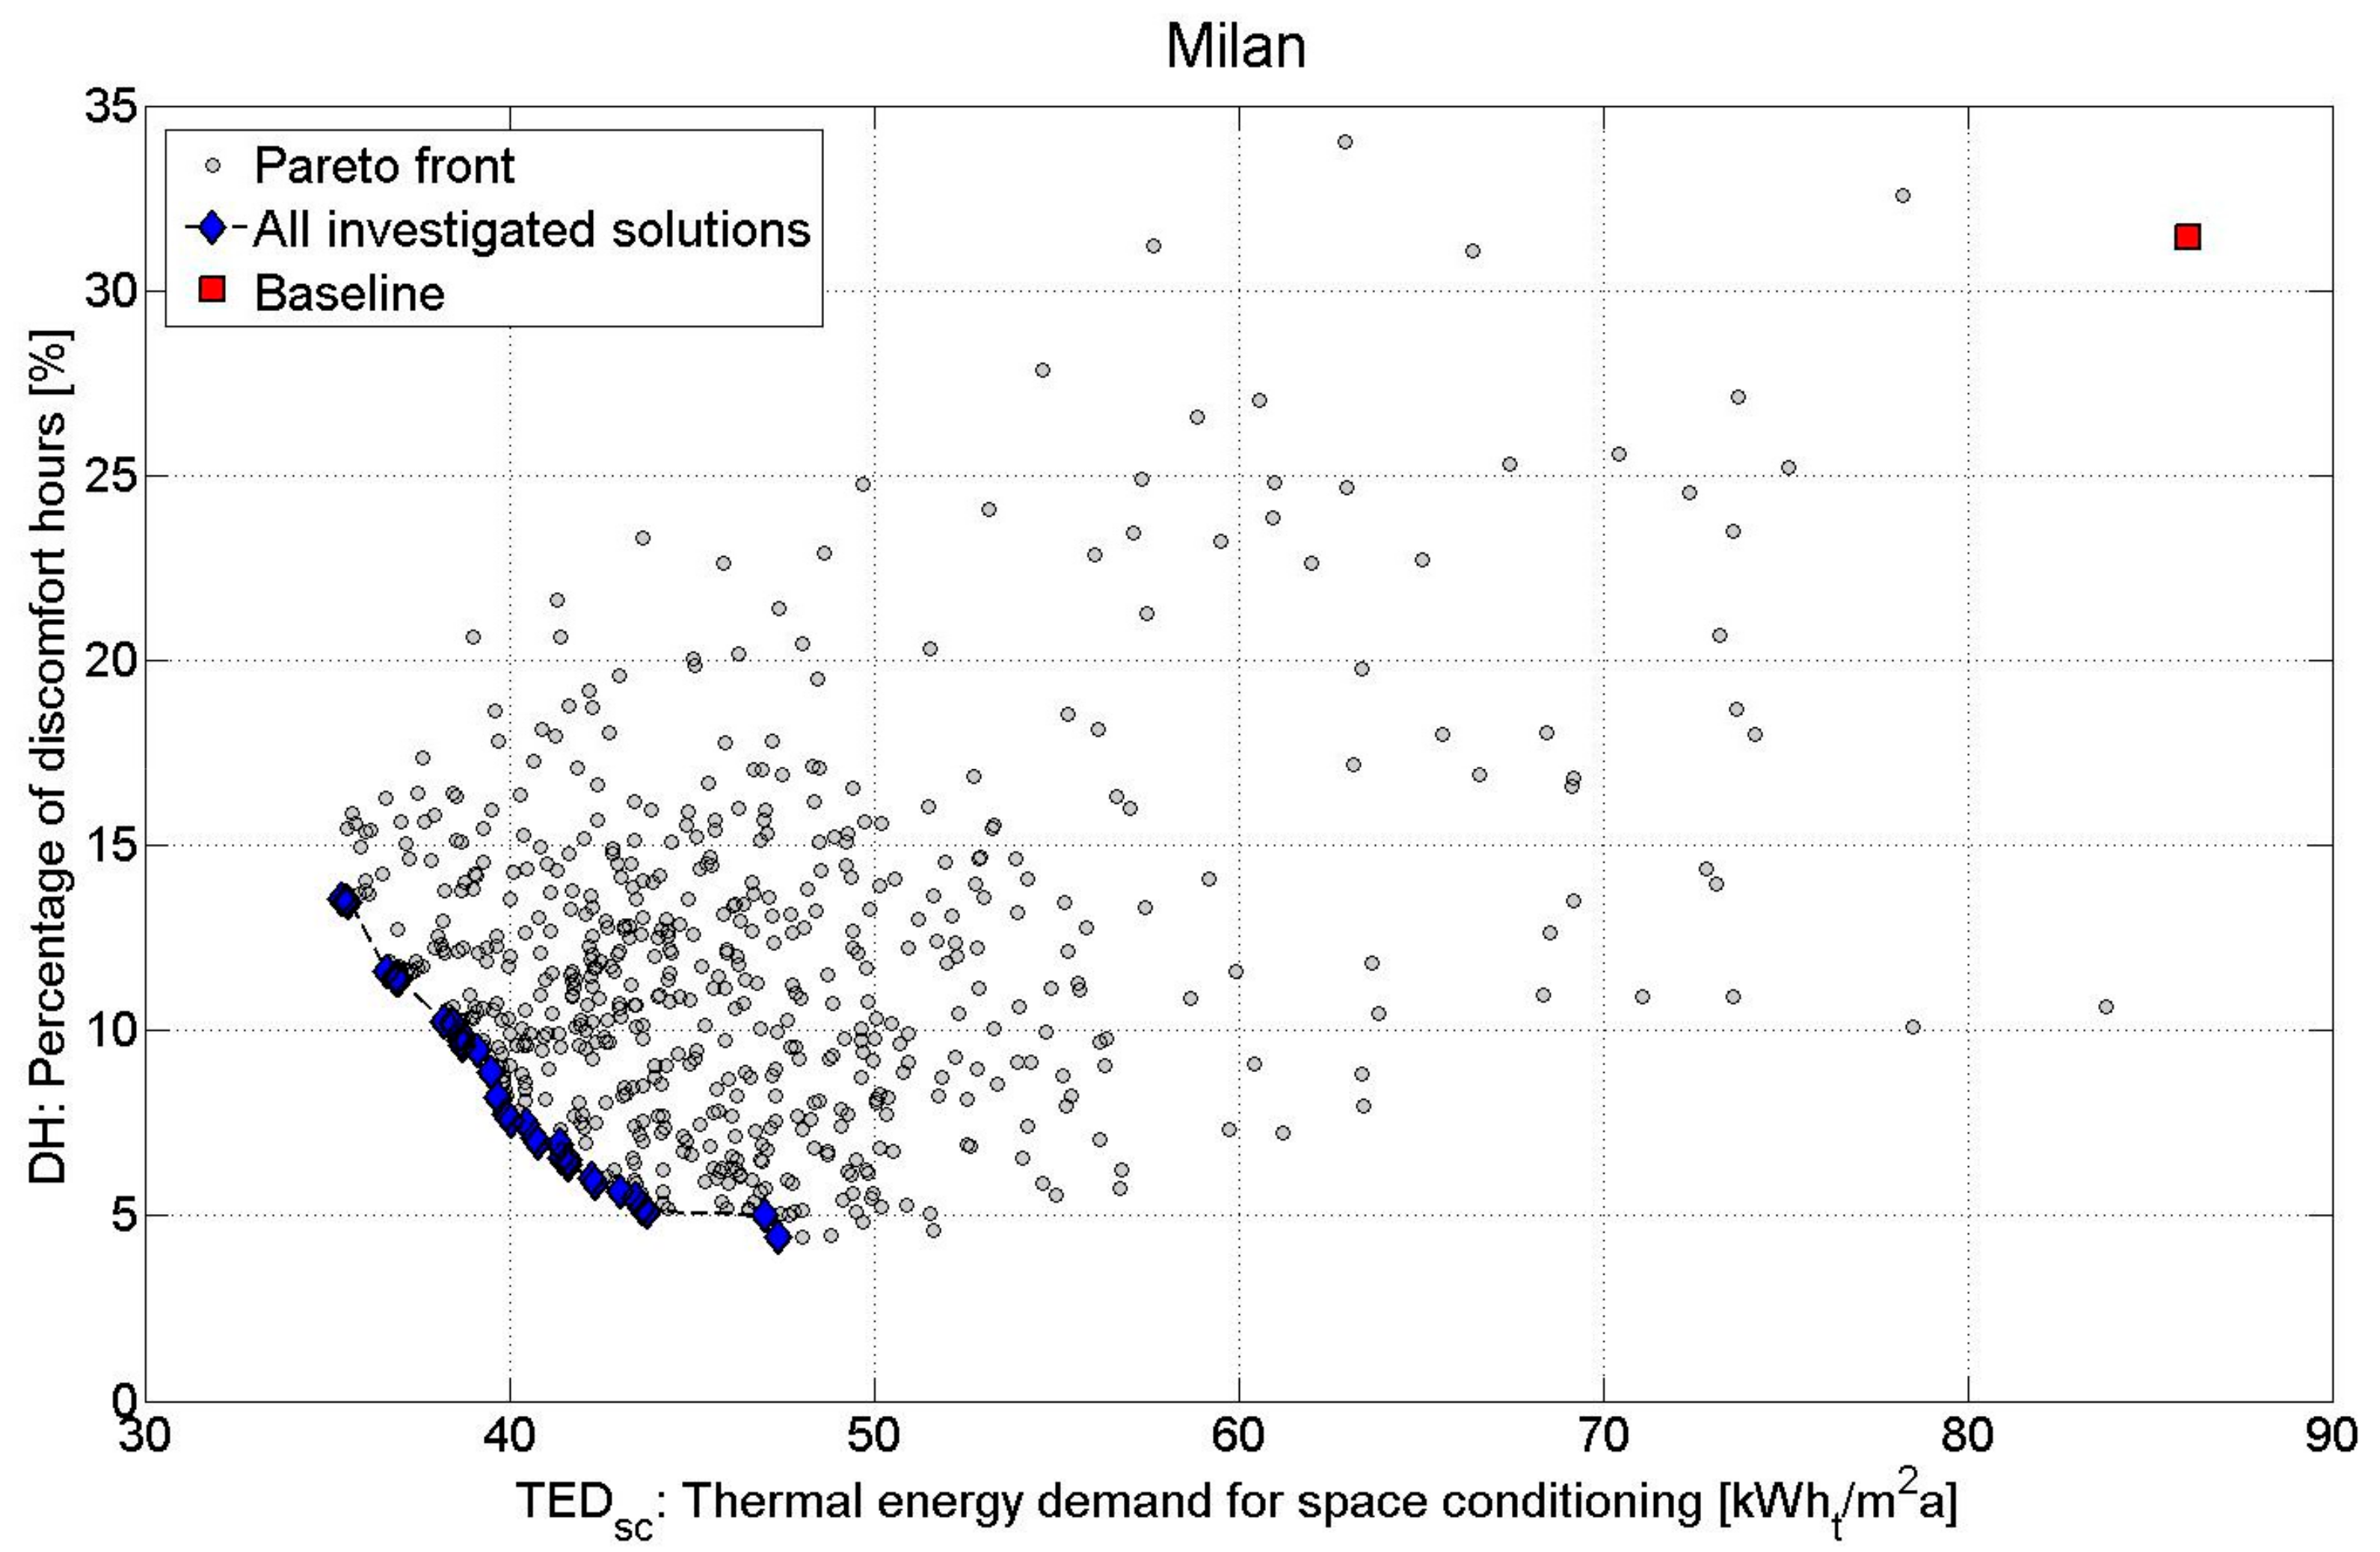
2.1. Step (1)—Optimization of Building Energy Retrofit
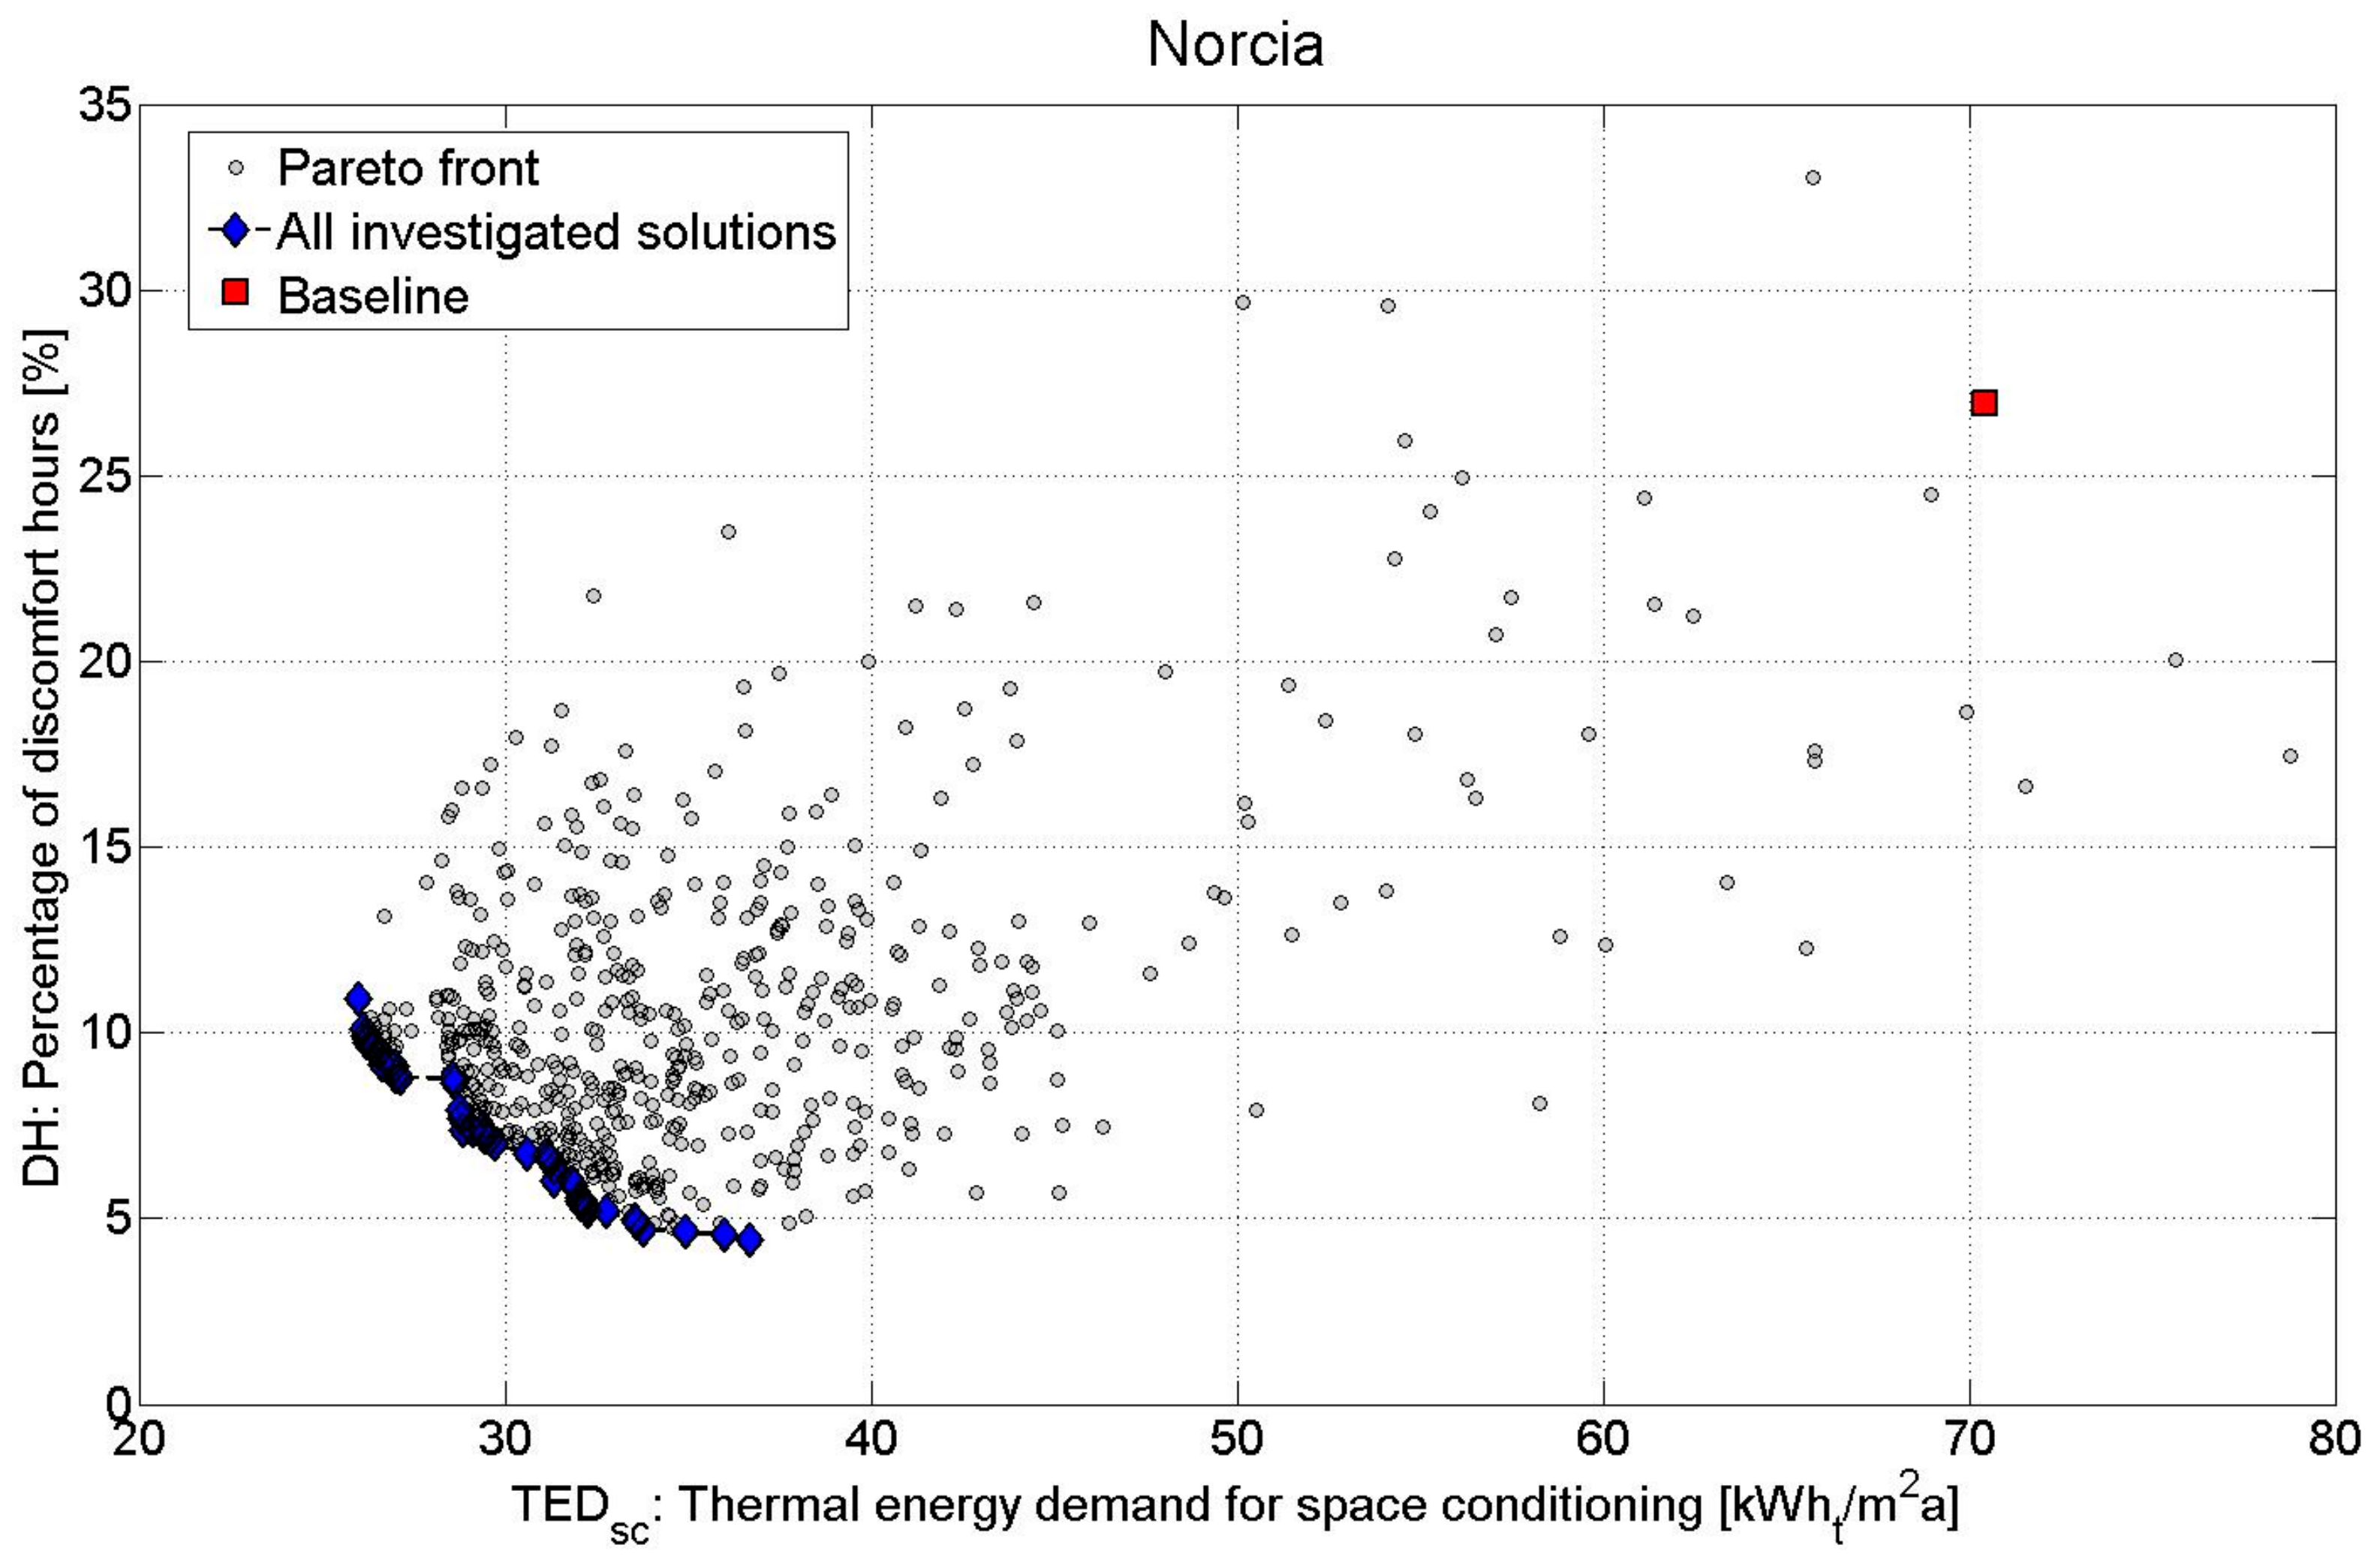
- TEDsc: thermal energy demand for space conditioning; and
- the ERMs investigated in Stage 1 that are addressed to the building envelope and to the variation of set point temperatures; and
- ERMs for improving the energy performance of primary energy systems, including the exploitation of renewable energy sources (RESs).
2.2. Step (2)—Assessment of Seismic Economic Losses
- hazard analysis: the output of this stage is the seismic intensity measure;
- structural analysis: the outputs of this stage are the engineering demand parameters;
- damage analysis: the output of this stage is the damage measure; and
- loss analysis: the output is the decision variable once assessed the performance.
2.3. Step (3)—Integration of Energy and Structural Aspects
2.4. Step (4)—Assessment of the Influence of Energy Retrofit on Seismic Economic Losses
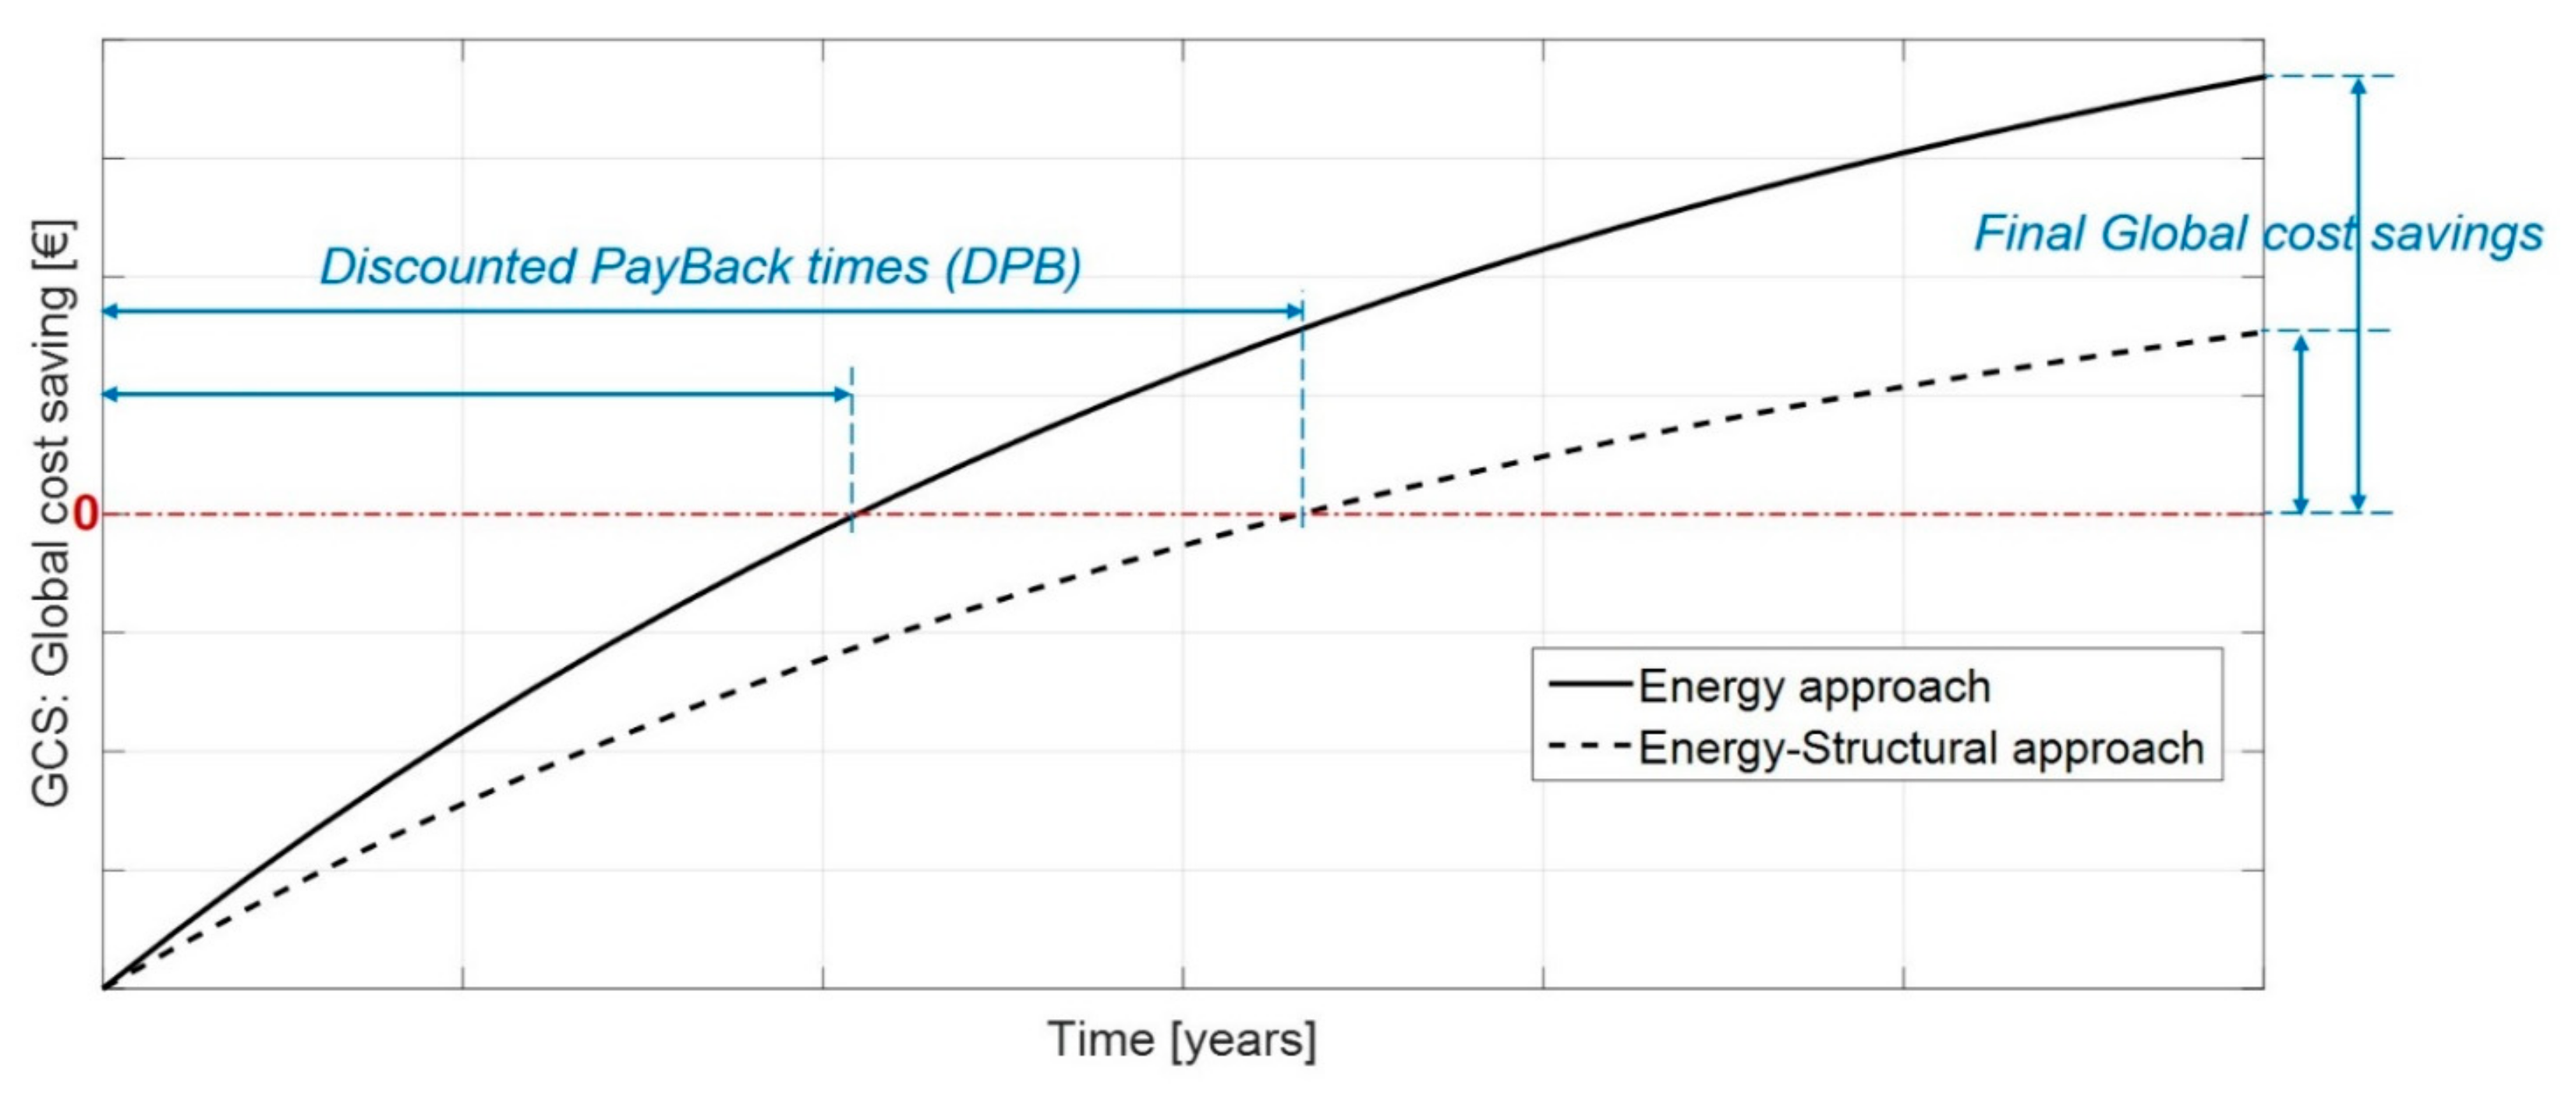
- Scenario 1: Seismic economic losses are not considered in global cost assessment; therefore, the costs derive from the implementation of a merely energy approach.
- Scenario 2: Seismic economic losses are considered in global cost assessment as an additional annual cost in the form of discounted expected annual losses (EALs), thereby implementing a coupled energy-structural approach.
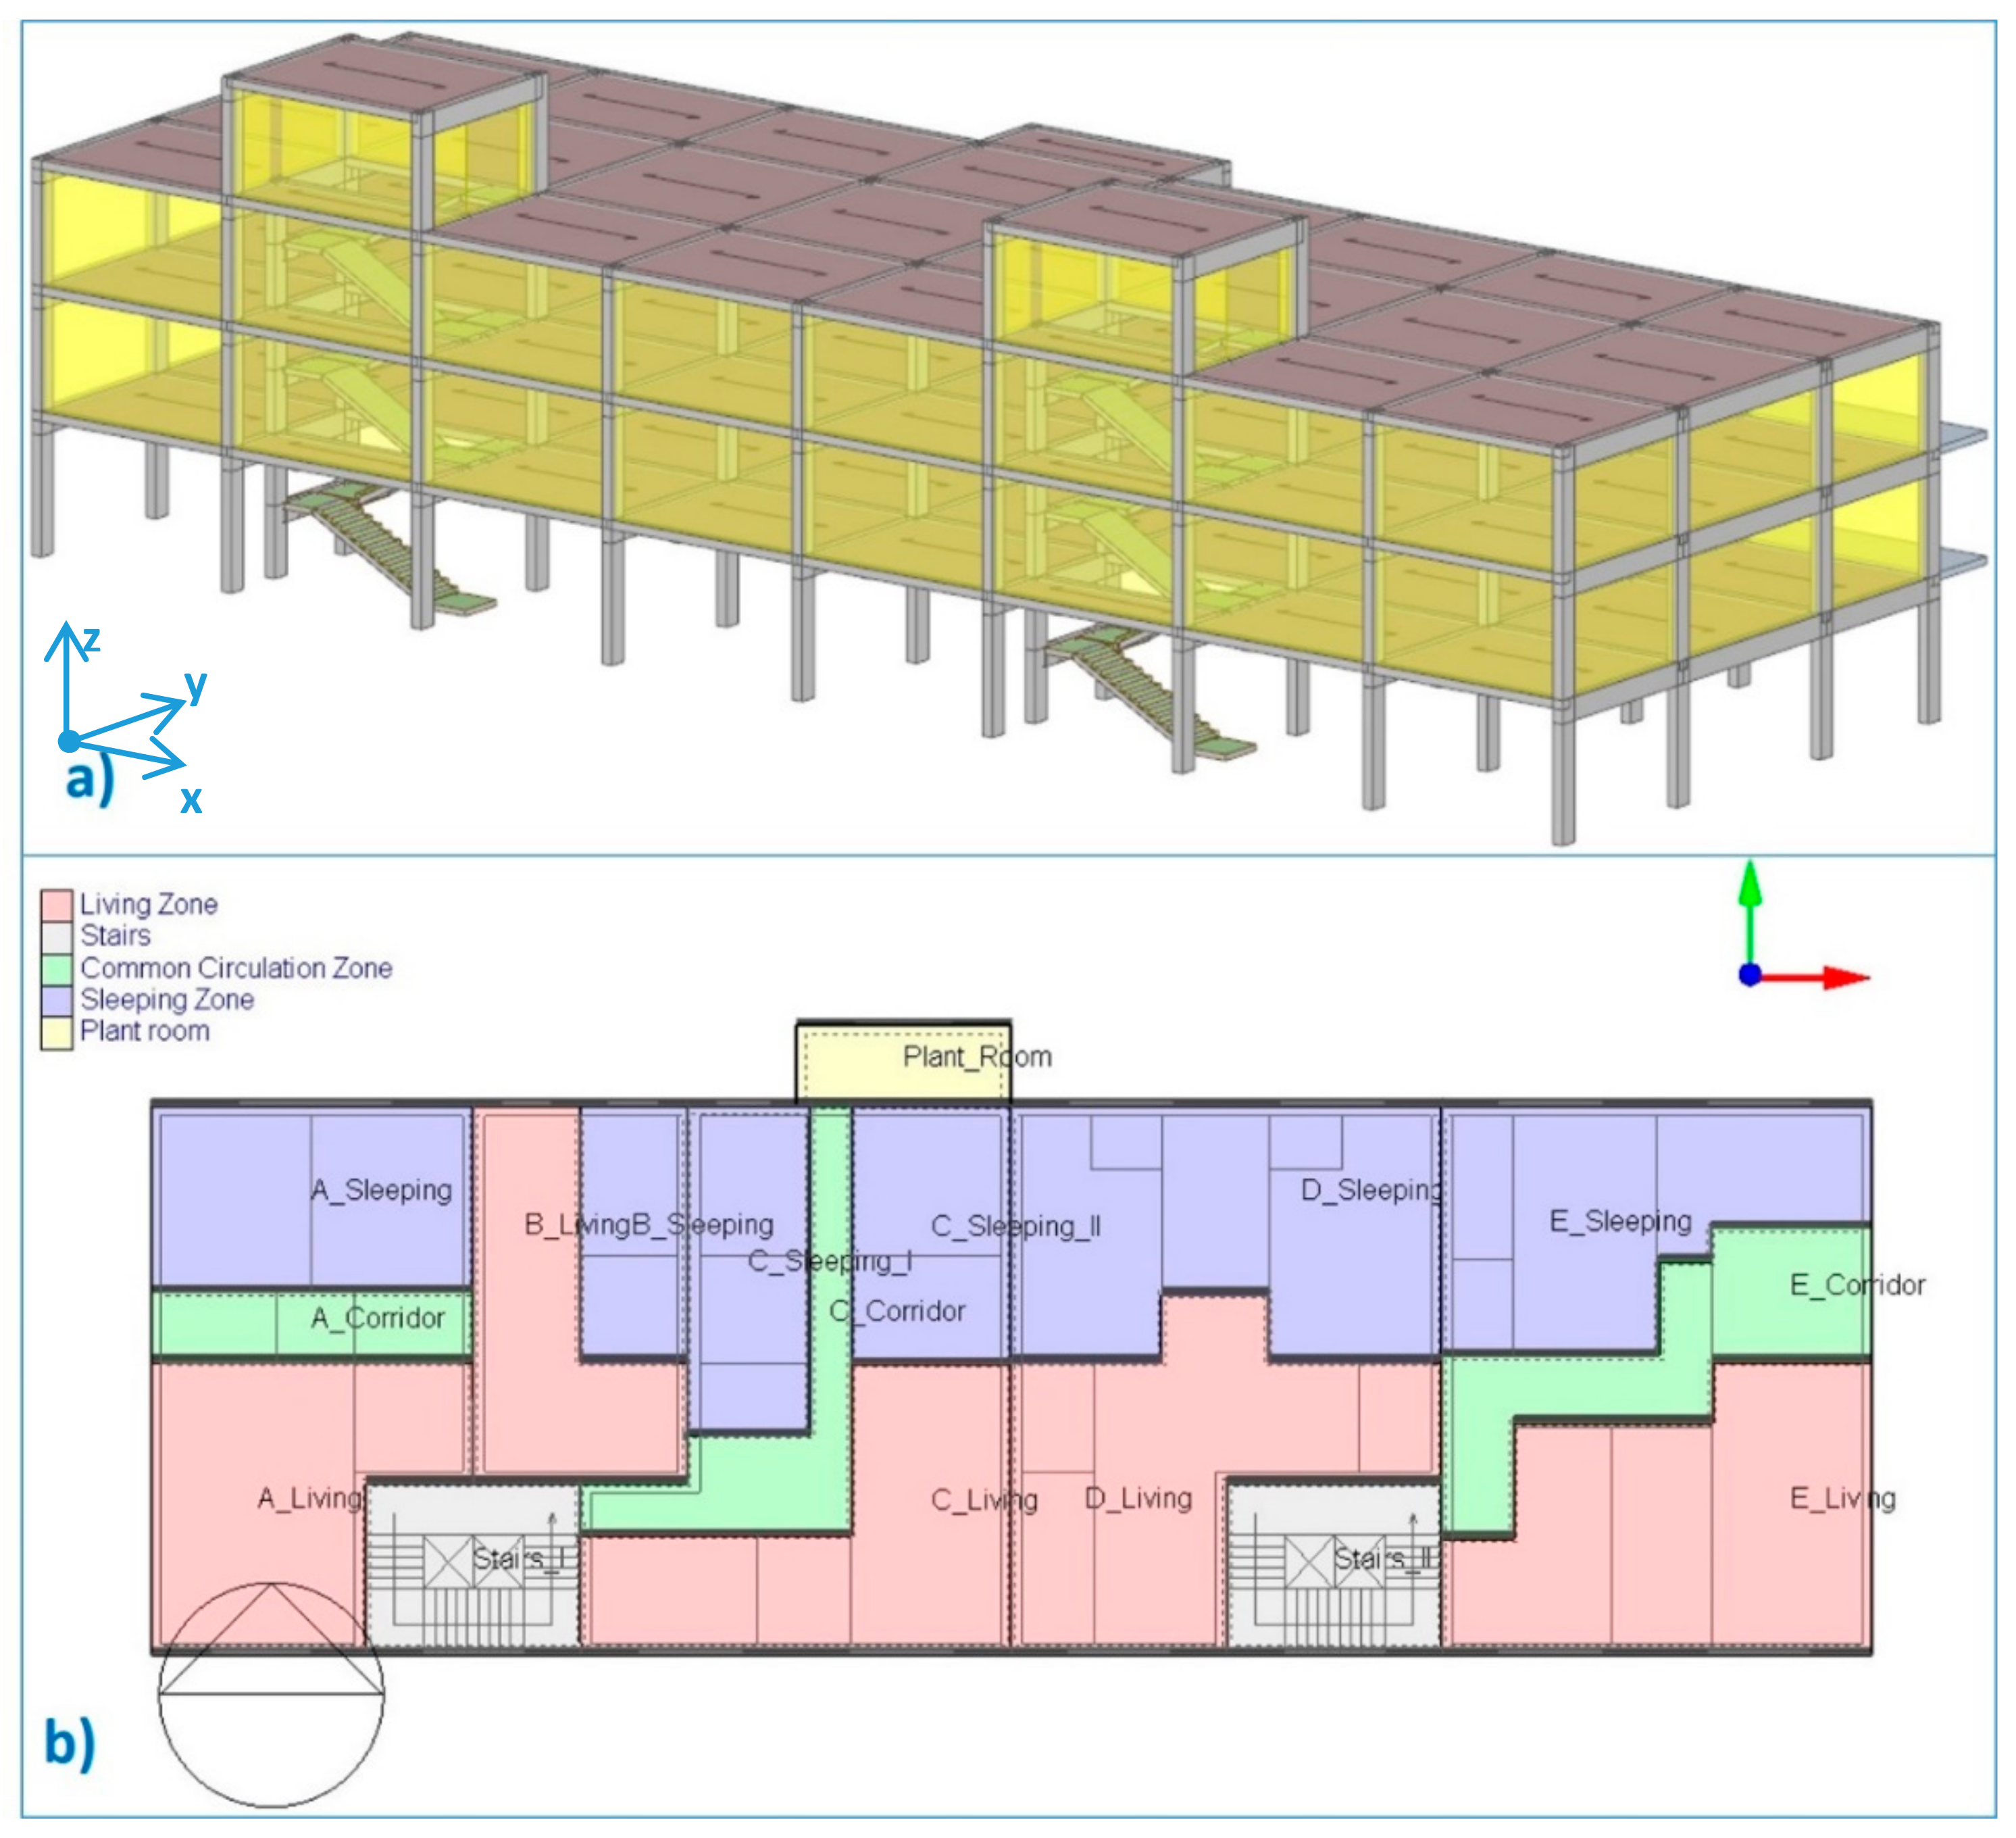
3. Case Study
3.1. Investigated Energy Retrofit Measures (ERMs)
- variation of heating set point temperature (Th), which cannot be higher than 22 °C according to Italian regulations [20];
- variation of cooling set point temperature (Tc);
- variation of the infrared emissivity of the external vertical walls (ev) by means of the installation of external plasters;
- variation of the solar absorptance of the external vertical walls (av) by the installation of external plasters;
- variation of the infrared emissivity of the roof (er) by the installation of external plasters;
- variation of the solar absorptance of the roof (ar) by the installation of external plasters;
- installation of an external layer of thermal insulation (thermal conductivity = 0.026 W/m K, density = 25 kg/m3, specific heat = 1340 J/kg K) on the external vertical walls (the insulation layer’s thickness is denoted as tv);
- installation of an external layer of thermal insulation (see above properties) on the roof (the insulation layer’s thickness is denoted as tr); and
- replacement of the windows with energy efficient ones, where the following eight options are considered:
- -
- (w1) double-glazed air-filled windows with wooden frames: Uw = 2.67 W/m2K; SHGC (solar heat gain coefficient) = 0.691; this option characterizes the baseline;
- -
- (w2) double-glazed air-filled windows with low-emissive coatings and PVC frames: Uw = 1.96 W/m2K, SHGC = 0.691;
- -
- (w3) double-glazed air-filled windows with low-emissive, tinted coatings and PVC frames: Uw = 1.76 W/m2K, SHGC = 0.380;
- -
- (w4) double-glazed air-filled windows with low-emissive, selective coatings and PVC frames: Uw = 1.64 W/m2K, SHGC = 0.433;
- -
- (w5) double-glazed argon-filled windows with low-emissive coatings and PVC frames: Uw = 1.71 W/m2K, SHGC = 0.691;
- -
- (w6) double-glazed argon-filled windows with low-emissive, tinted coatings and PVC frames: Uw = 1.49 W/m2K; SHGC = 0.380;
- -
- (w7) double-glazed air-filled windows with low-emissive, selective coatings and PVC frames: Uw = 1.34 W/m2K; SHGC = 0.433; and
- -
- (w8) triple-glazed argon-filled windows with low-emissive coatings and PVC frames: Uw = 1.10 W/m2K; SHGC = 0.579.
- the improvement of the energy efficiency of the primary heating system;
- the improvement of the energy efficiency of the primary cooling system;
- the improvement of the energy efficiency of the primary system for the production of domestic hot water (DHW); and
- the installation of systems for the exploitation of RESs, namely photovoltaic (PV) panels.
3.2. Simulation Assumptions
- the primary energy conversion factor is set equal to 1.95 for electricity and 1.05 for natural gas, according to current Italian law [23];
- the energy price is set equal to 0.25 €/kWhel for electricity and 0.90 €/Nm3 for natural gas as done in [21];
- produced electricity that is sold to the grid (in presence of PV panels) is remunerated at the price of 0.08 €/kWhel, as done in [10];
- the polluting emissions’ factor is set equal to 0.708 tCO2-eq/MWhel for electricity 0.237 tCO2-eq/MWhp for natural gas [24];
- in EnergyPlus simulations, the IWEC (international weather for energy calculations) weather data file related to Milan [25] is used when Milan is considered as location; on the other hand, the IGDG (Italian climatic data collection “Gianni De Giorgio”) weather data file related to Perugia [25] is used for Norcia. In this regard, accredited weather data files are not available for Norcia, but the use of Perugia file provides a good approximation, since these two locations are very close (the distance is around 70 km) and characterized by similar climatic conditions.
4. Results and Discussion
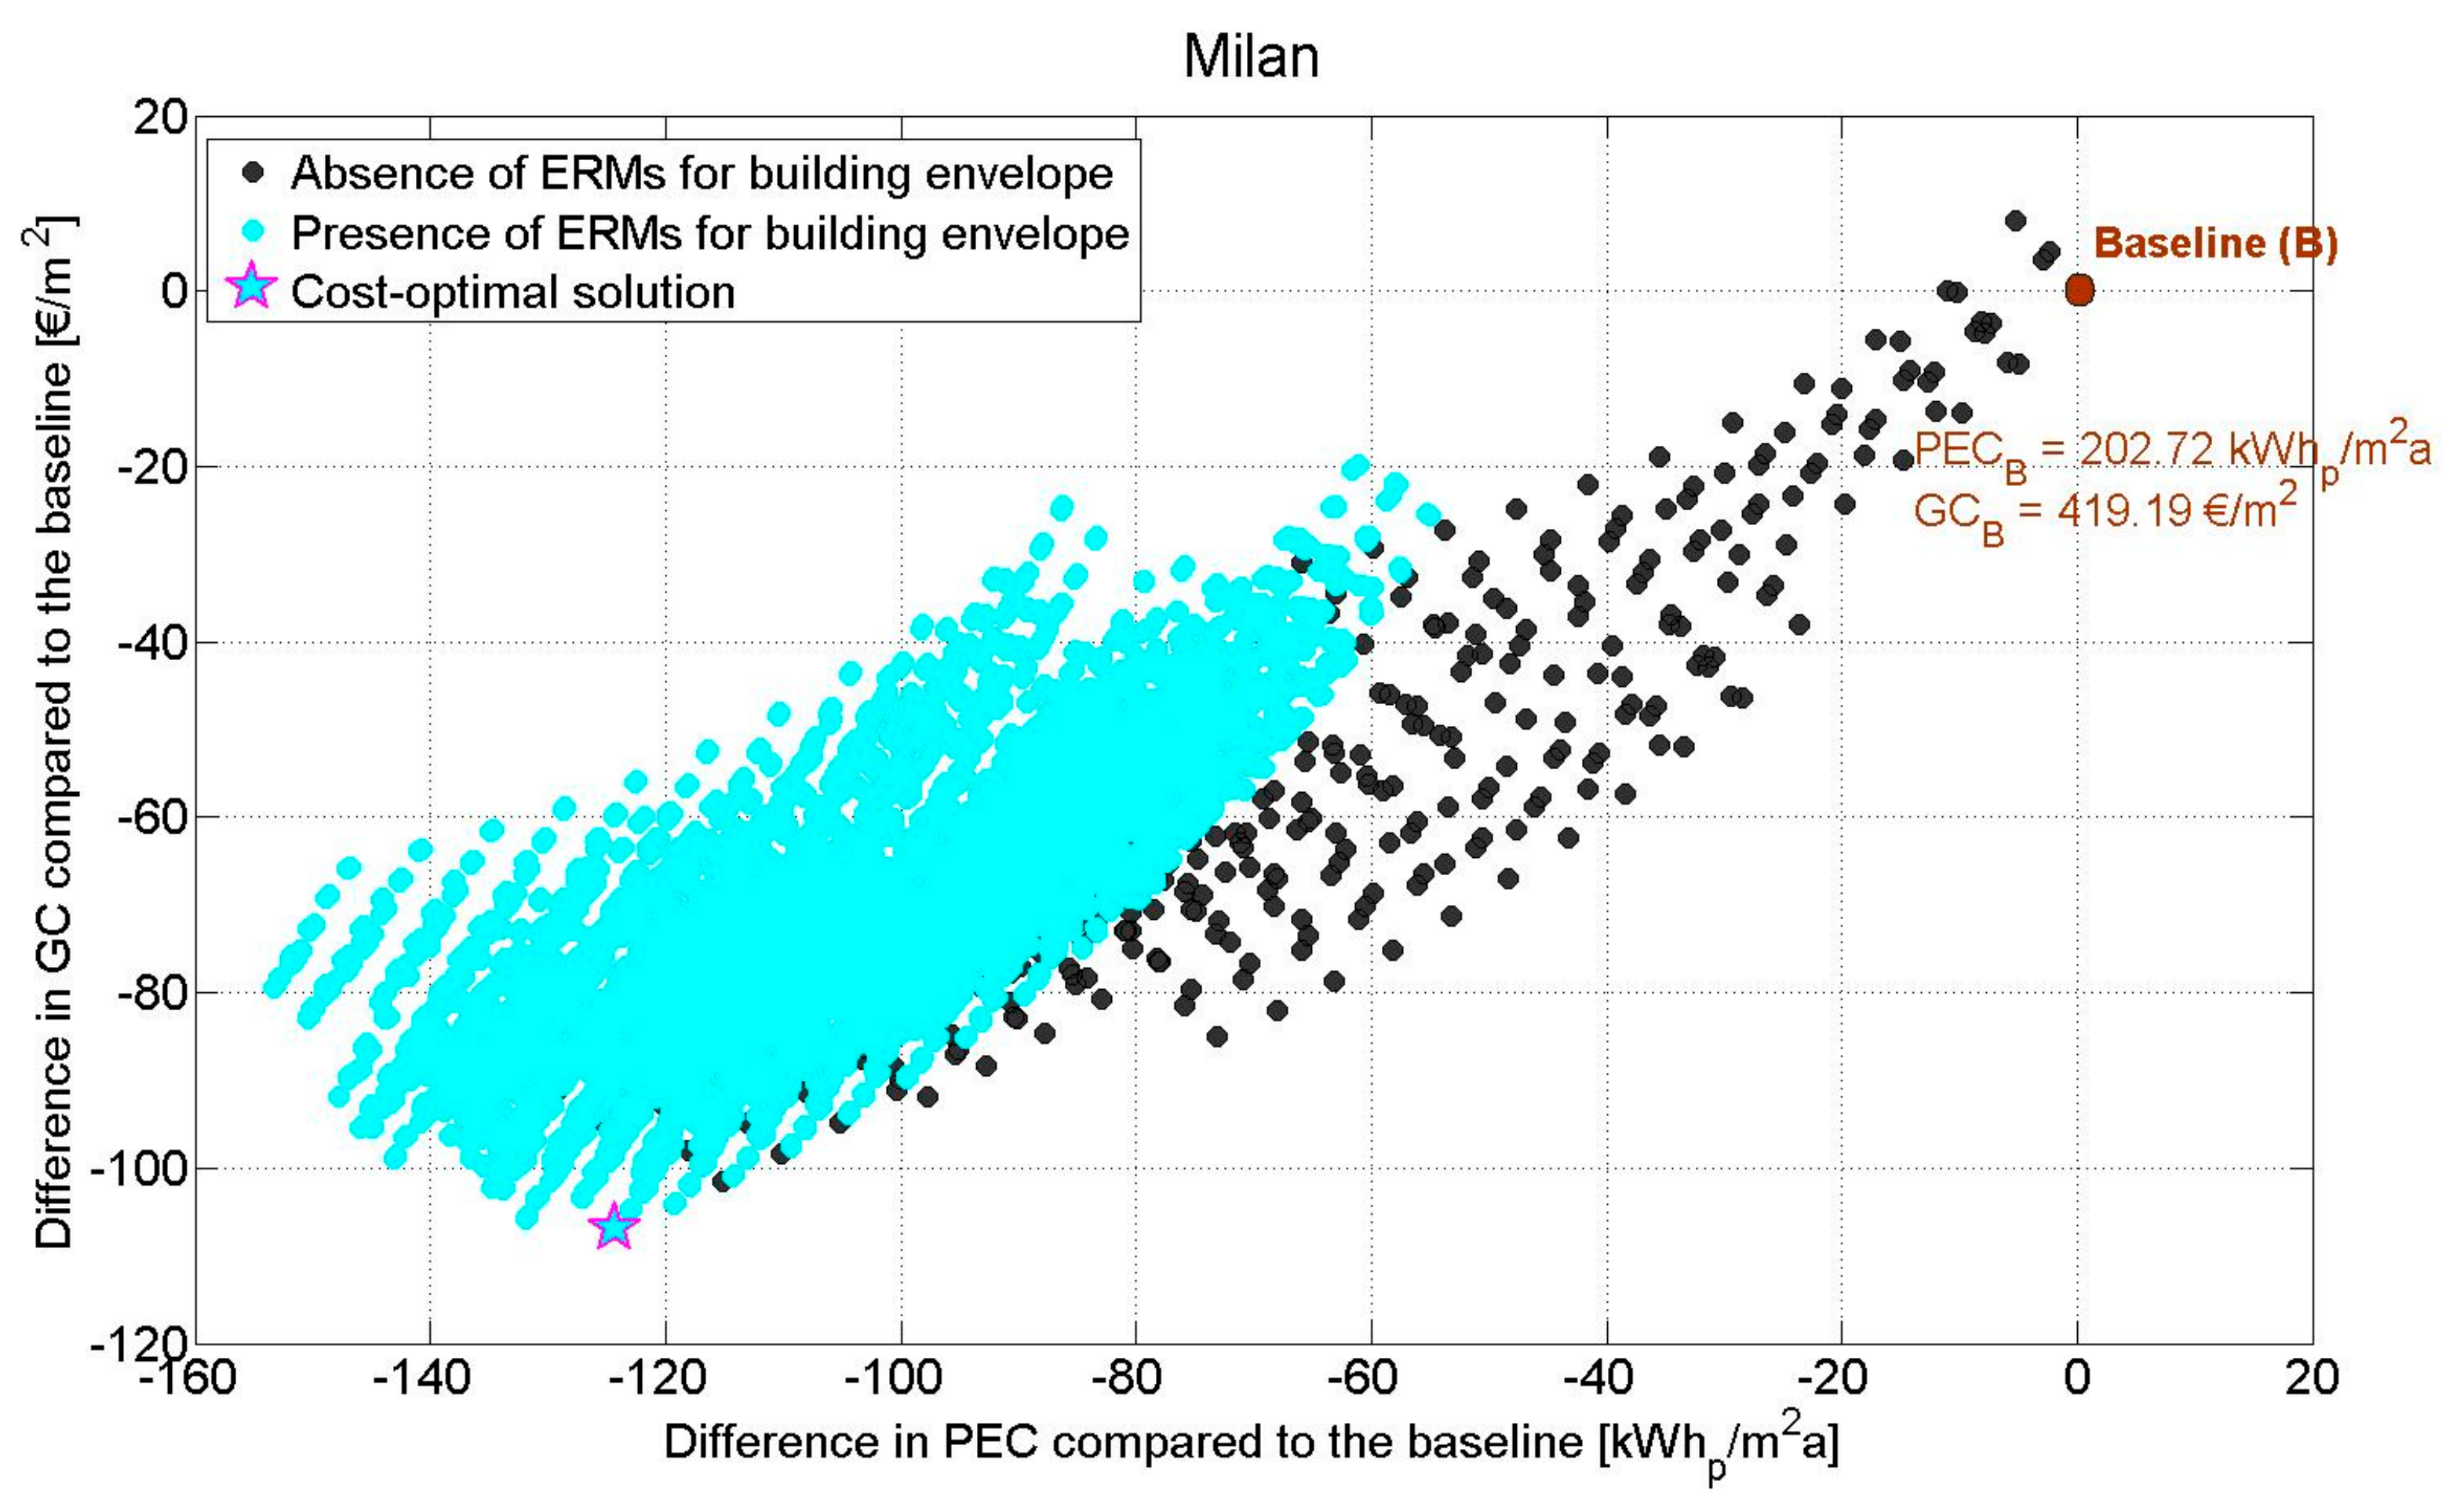
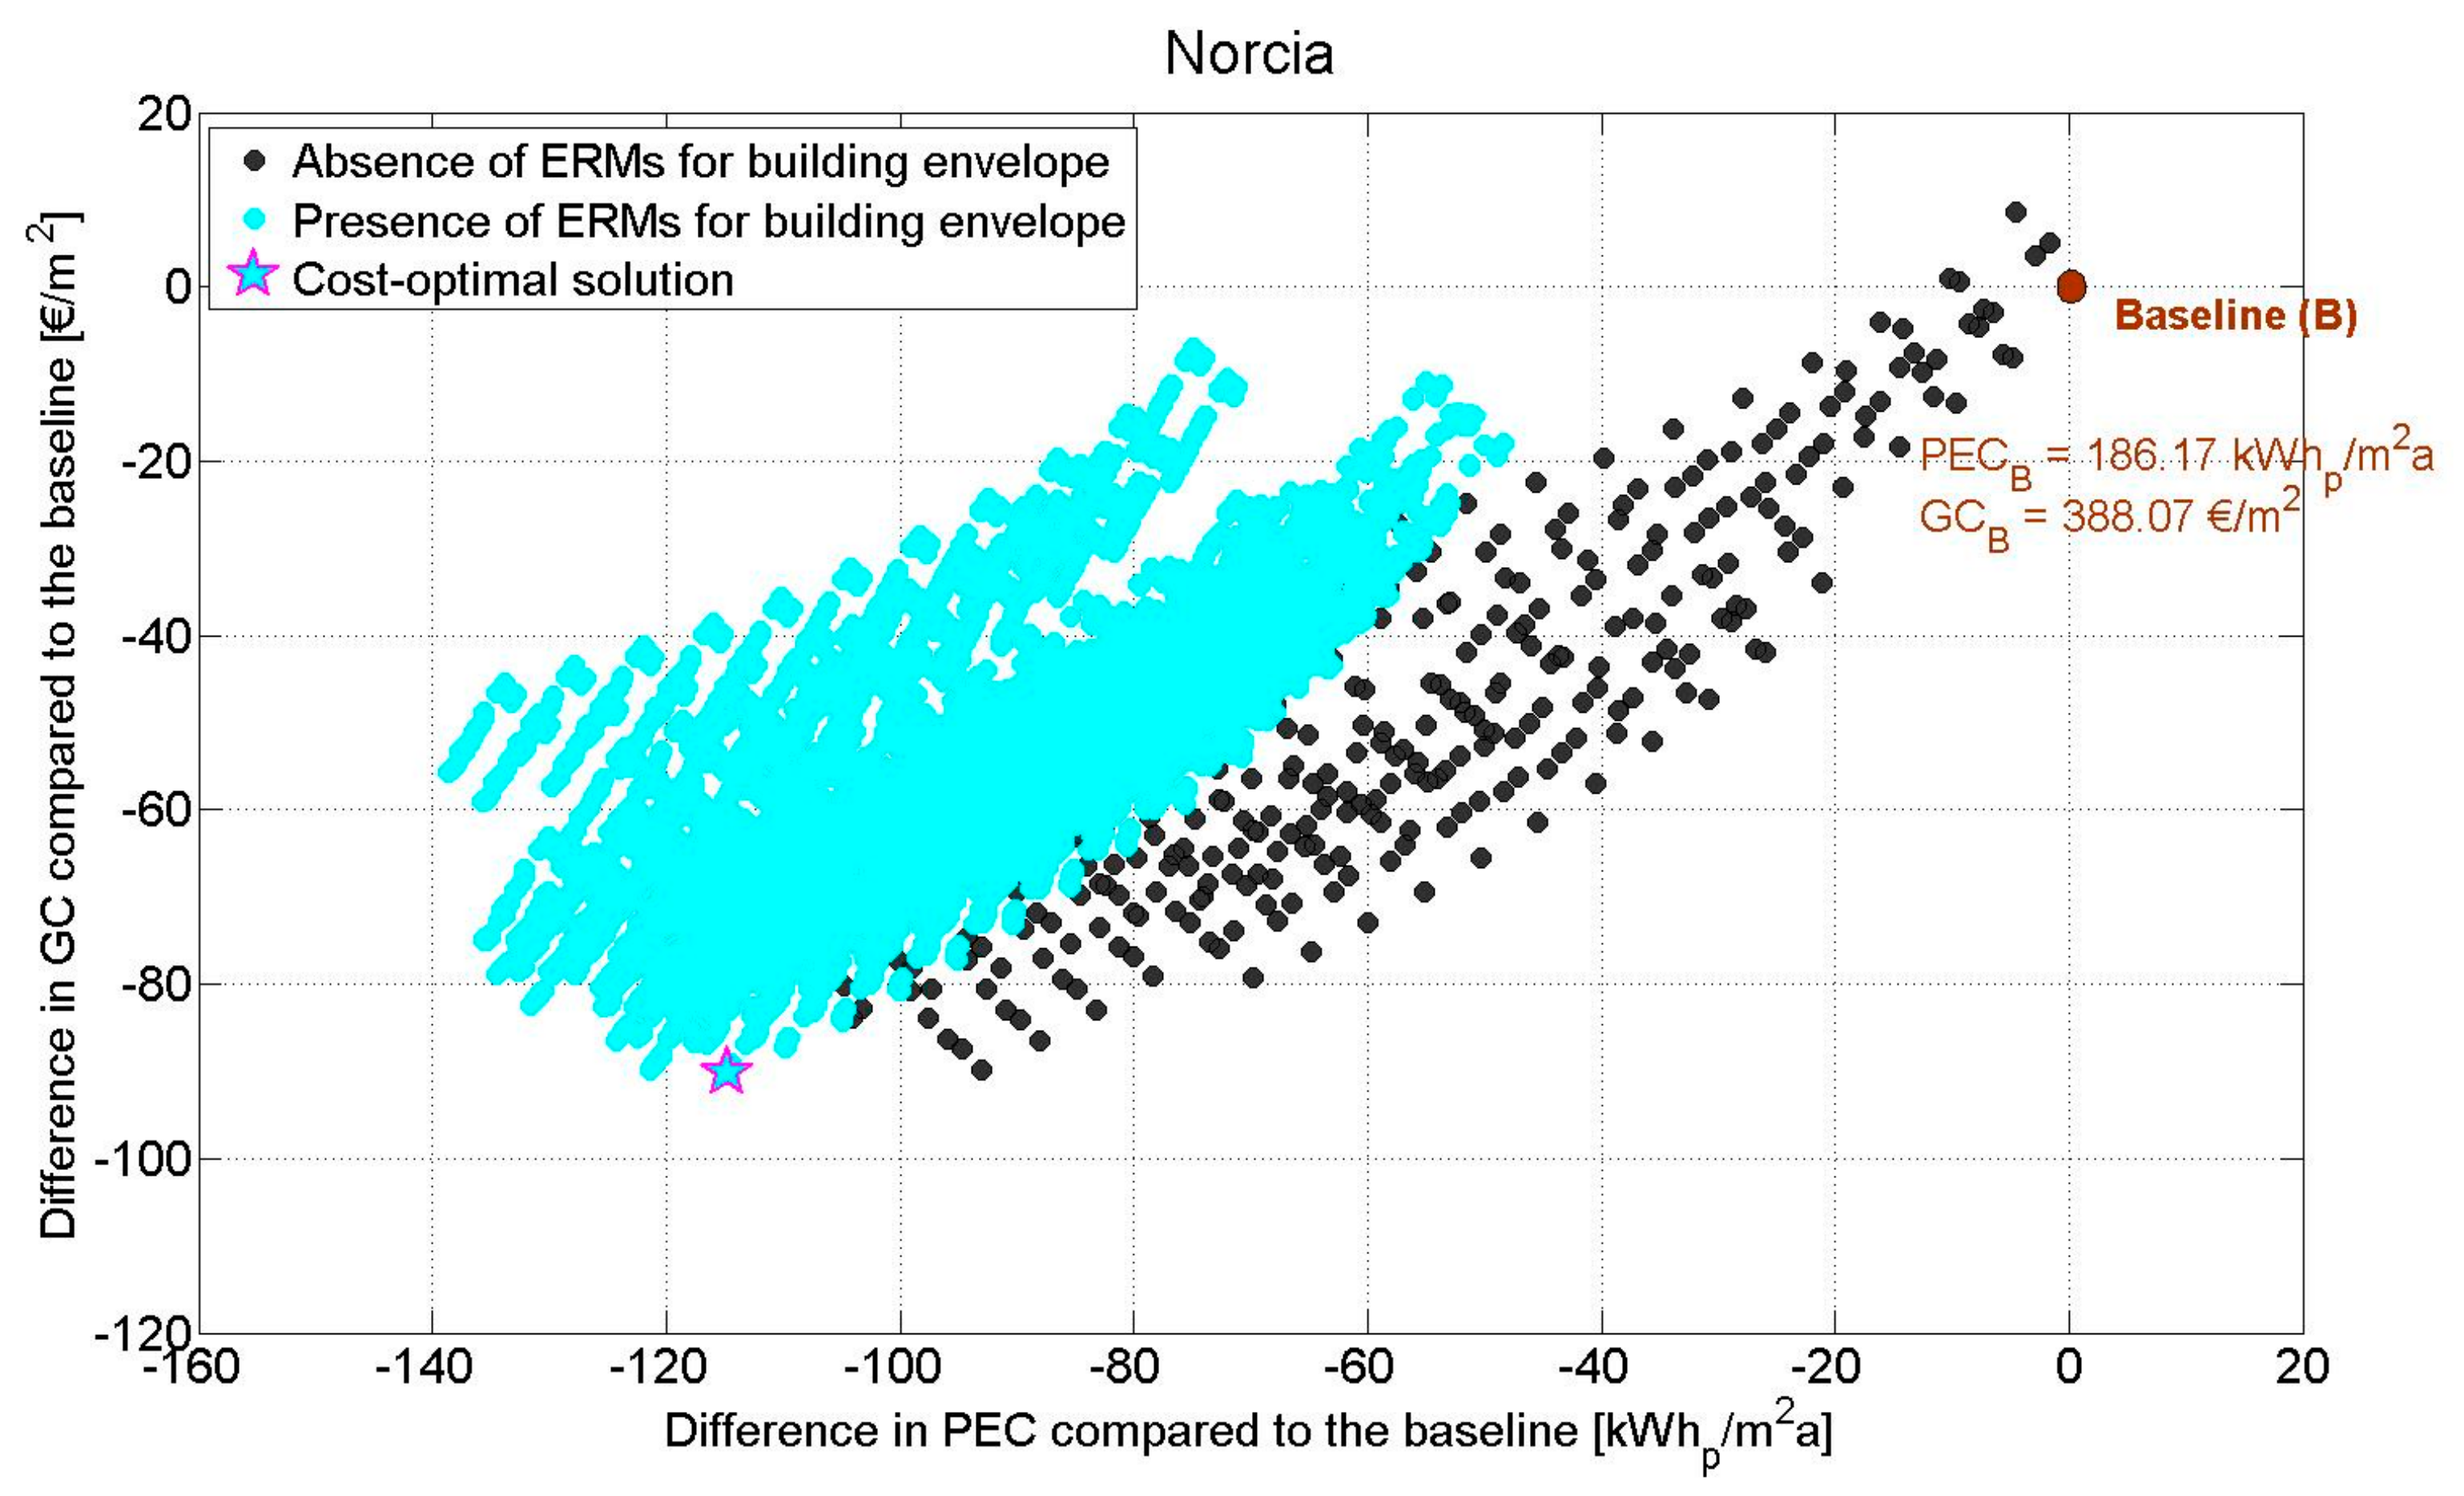
4.1. Baseline: As-Built Building Performance
4.2. Building Retrofit: Energy Optimization and Economic Loss Assessment
- 14 cm-thick thermal insulation of both external vertical walls and roof; and
- installation of triple glazed windows.
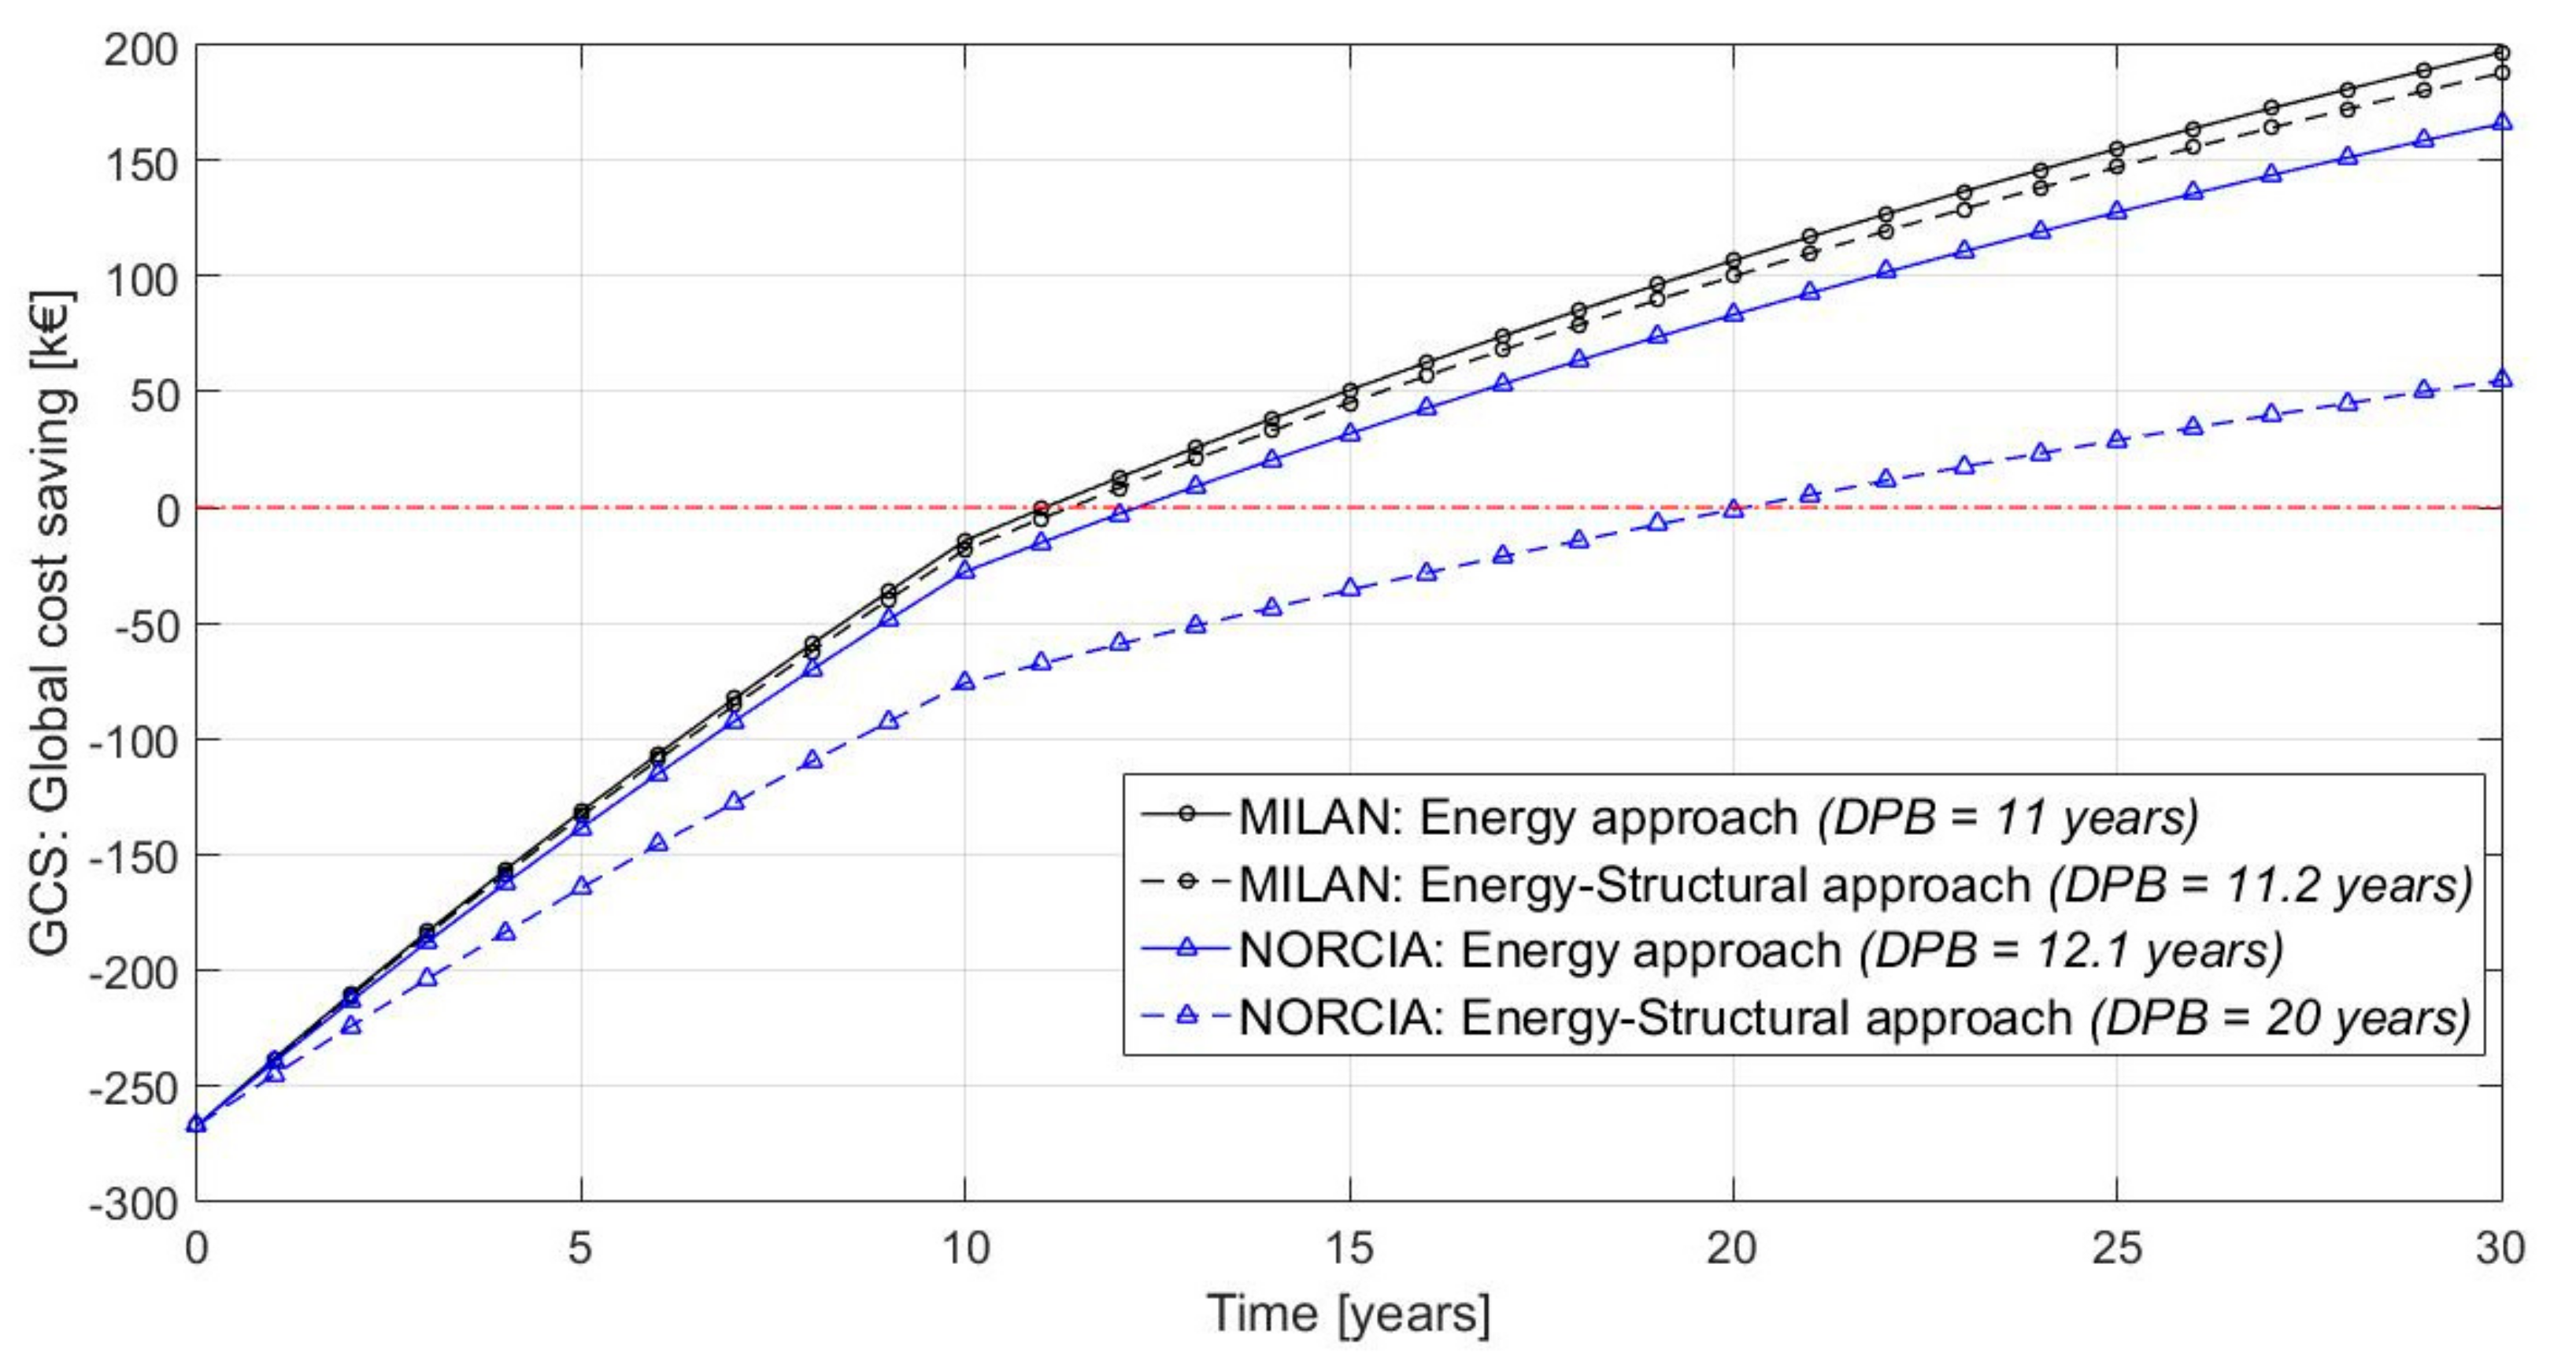
- for Milan, the final GCS changes from 197.05 k€ to 188.94 k€, and the DPB from 11 to 11.2 years; and
- for Norcia, the final GCS changes from 166.12 k€ to 54.98 k€, and the DPB from 12.1 to 20 years.
5. Conclusions
- Step (1): The energy retrofit is optimized by performing a multi-stage procedure, which implements a genetic algorithm and a smart research strategy in order to find a robust cost-optimal solution.
- Step (2): Seismic economic losses are quantified for the “as-built” existing building throughout its lifetime.
- Step (3): Energy and structural aspects are integrated by associating the cost-optimal energy measures—identified in Step (1)—to the structural performance of building components.
- Step (4): The analysis of Step (2) is conducted in presence of the cost-optimal energy retrofit solutions in order to assess the lifecycle economic impact of seismic risk on optimal energy retrofit.
Acknowledgments
Author Contributions
Conflicts of Interest
Nomenclature
| Symbols | ||
| a | absorptance to solar radiation | [-] |
| cov | percentage of roof area covered by PV panels | [-] |
| dEM | difference in EM compared to the baseline | [kgCO2-eq/m2 a] |
| dGC | difference in GC compared to the baseline | [€] |
| dPEC | difference in PEC compared to the baseline | [Whp/m2 a] |
| e | thermal (infrared) emissivity | [-] |
| t | thickness of thermal insulation layer | [m] |
| DH | percentage of discomfort hours | [%] |
| DPB | discounted payback time | [years] |
| EM | polluting emissions | [kgCO2-eq/m2 a] |
| EAL | expected annual loss | [€/a] |
| GC | global cost | [€/m2] |
| GCS | global cost saving | [€] |
| IC | investment cost | [€] |
| PEC | primary energy consumption | [Whp/m2 a] |
| PGA | peak ground acceleration | [m/s2] |
| SHGC | solar heat gain coefficient | [-] |
| TED | thermal energy demand | [Wht/m2 a] |
| U | thermal transmittance | [W/m2 K] |
| Subscripts | ||
| B | referred to the baseline (as built configuration) | |
| el | referred to electrical energy or power | |
| p | referred to primary energy or power | |
| r | referred to the roof | |
| sc | referred to space conditioning | |
| t | referred to thermal energy or power | |
| v | referred to the external vertical walls | |
| w | referred to the windows | |
| Acronyms | ||
| DHW | domestic hot water | |
| EDP | engineering demand parameter | |
| ERM | energy retrofit measure | |
| GA | genetic algorithm | |
| IM | intensity measure | |
| PV | photovoltaic | |
| RES | renewable energy source | |
References
- Willard, B. The Sustainability Advantage—Seven Business Case Benefits of a Triple Bottom Line; New Society: British Columbia, BC, Canada, 2002. [Google Scholar]
- Menna, C.; Asprone, D.; Jalayer, F.; Prota, A.; Manfredi, G. Assessment of ecological sustainability of a building subjected to potential seismic events during its lifetime. Int. J. Life Cycle Assess. 2013, 18, 504–515. [Google Scholar] [CrossRef]
- Asadi, E.; Da Silva, M.G.; Antunes, C.H.; Dias, L. Multi-objective optimization for building retrofit strategies: A model and an application. Energy Build. 2012, 44, 81–87. [Google Scholar] [CrossRef]
- Ascione, F.; Bianco, N.; de Stasio, C.; Mauro, G.M.; Vanoli, G.P. A new methodology for cost-optimal analysis by means of the multi-objective optimization of building energy performance. Energy Build. 2015, 88, 78–90. [Google Scholar] [CrossRef]
- Kanapeckiene, L.; Kaklauskas, A.; Zavadskas, E.K.; Raslanas, S. Method and system for multi-attribute market value assessment in analysis of construction and retrofit projects. Expert Syst. Appl. 2011, 38, 14196–14207. [Google Scholar] [CrossRef]
- Raslanas, S.; Alchimovienė, J.; Banaitienė, N. Residential areas with apartment houses: Analysis of the condition of buildings, planning issues, retrofit strategies and scenarios. Int. J. Strateg. Prop. Manag. 2011, 15, 152–172. [Google Scholar] [CrossRef]
- EnergyPlus, the Official Building Simulation Program of the United States Department of Energy. Available online: http://www.eere.energy.gov/buildings (accessed on 14 December 2016).
- MATLAB®-MATrixLABoratory (2010)—7.10.0. User’s Guide MathWorks. Available online: http://it.mathworks.com (accessed on 8 December 2016).
- Ascione, F.; Bianco, N.; de Masi, R.F.; Mauro, G.M.; Vanoli, G.P. Design of the building envelope: A novel multi-objective approach for the optimization of energy performance and thermal comfort. Sustainability 2015, 7, 10809–10836. [Google Scholar] [CrossRef]
- Ascione, F.; Bianco, N.; de Stasio, C.; Mauro, G.M.; Vanoli, G.P. Multi-stage and multi-objective optimization for energy retrofitting a developed hospital reference building: A new approach to assess cost-optimality. Appl. Energy 2016, 174, 37–68. [Google Scholar] [CrossRef]
- Fanger, P.O. Thermal Comfort. Analysis and Applications in Environmental Engineering; McGraw-Hill: New York, NY, USA, 1970. [Google Scholar]
- Deb, K. Multi-Objective Optimization Using Evolutionary Algorithms; John Wiley & Sons: Chichester, UK, 2001. [Google Scholar]
- European Commission and Parliament. Directive 2010/31/EU of the European Parliament and of the Council of 19 May 2010 on the Energy Performance of Buildings (EPBD Recast); European Commission and Parliament: Brussels, Belgium, 2010. [Google Scholar]
- European Commission. Commission Delegated Regulation (EU) No 244/2012 of 16 January 2012 Supplementing Directive 2010/31/EU of the European Parliament and of the Council on the Energy Performance of Buildings; European Commission: Brussels, Belgium, 2012. [Google Scholar]
- Vitiello, U.; Asprone, D.; Di Ludovico, M.; Prota, A. Life-cycle cost optimization of the seismic retrofit of existing RC structures. Bull. Earthq. Eng. 2016. [Google Scholar] [CrossRef]
- Aslani, H.; Miranda, E. Probabilistic Earthquake Loss Estimation and Loss Disaggregation in Buildings; Report No. 157; Department of Civil and Environmental Engineering, Stanford University: Stanford, CA, USA, 2005. [Google Scholar]
- Goulet, C.A.; Haselton, C.B.; Mitrani-Reiser, J.; Beck, J.L.; Deierlein, G.G.; Porter, K.A.; Stewart, J.P. Evaluation of the seismic performance of a code-conforming reinforced-concrete frame building—From seismic hazard to collapse safety and economic losses. Earthq. Eng. Struct. Dyn. 2007, 36, 1973–1997. [Google Scholar] [CrossRef]
- Fajfar, P. Capacity spectrum method based on inelastic demand spectra. Earthq. Eng. Struct. Dyn. 1999, 28, 979–993. [Google Scholar] [CrossRef]
- NTC (2008) NTC, Norme Tecniche per le Costruzioni, D.M 14 Gennaio 2008. Available online: http://www.camera.it (accessed on 8 December 2016).
- Decree of the President of the Republic (DPR) 26 agosto 1993. n. 412, Regolamento recante norme per la progettazione, l’installazione, l’esercizio e la manutenzione degli impianti termici degli edifici ai fini del contenimento dei consumi di energia, in attuazione dell’art. 4, comma 4, della L. 9 gennaio 1991. Available online: http://efficienzaenergetica.acs.enea.it (accessed on 5 December 2016). (In Italian).
- Mauro, G.M.; Hamdy, M.; Vanoli, G.P.; Bianco, N.; Hensen, J.L.M. A new methodology for investigating the cost-optimality of energy retrofitting a building category. Energy Build. 2015, 107, 456–478. [Google Scholar] [CrossRef]
- Italian Government. Law December 28, 2015, n. 208 (“Legge di stabilità 2016”); Italian Government: Rome, Italy, 2015. Available online: http://www.gazzettaufficiale.it (accessed on 6 December 2016). (In Italian)
- Italian Government Decree, Decreto interministeriale 26 giugno 2015, Applicazione delle metodologie di calcolo delle prestazioni energetiche e definizione delle prescrizioni e dei requisiti minimi degli edifici. Italian Government: Rome, Italy, 2015. Available online: http://www.sviluppoeconomico.gov.it (accessed on 6 December 2016). (In Italian)
- Technical Annex to the SEAP Template Instructions Document: THE EMISSION FACTORS. Available online: https://www.eumayors.eu/index_en.html (accessed on 20 December 2016).
- EnergyPlus Weather Data. Available online: https://energyplus.net/weather (accessed on 14 December 2016).
- SAP2000, version 16; Computer and Structures: Berkeley, CA, USA.
- European Standard. Eurocode 8: Design of Structures for Earthquake Resistance–Part 3: Assessment and Retrofitting of Buildings (Ref. No. EN 1998-3: 2005: E); European Committee for Standardizations (CEN): Brussels, Belgium, 2004. [Google Scholar]
- Pagni, C.A.; Lowes, L.N. Fragility functions for older reinforced concrete beam-column joints. Earthq. Spectra 2006, 22, 215–238. [Google Scholar] [CrossRef]
- Ruiz-Garcia, J.; Negrete, M. Drift-based fragility assessment of confined masonry walls in seismic zones. Eng. Struct. 2009, 31, 170–181. [Google Scholar] [CrossRef]
- Ascione, F.; Bianco, N.; de Masi, R.F.; de Stasio, C.; Mauro, G.M.; Vanoli, G.P. Multi-objective optimization of the renewable energy mix for a building. Appl. Therm. Eng. 2016, in press. [Google Scholar] [CrossRef]


| Columns | Beams in Y Direction | Beams in X Direction | |
|---|---|---|---|
| First story | 0.50 × 0.30, LR *: 4Ø14, TR *: Ø8/25 cm | 0.60 × 0.30, LR: 4Ø22, TR: Ø8/25 cm | 0.35 × 0.24, LR: 4Ø14, TR: Ø8/25 cm |
| Second story | 0.50 × 0.30, LR: 4Ø14, TR: Ø8/25 cm | 0.60 × 0.30, LR: 4Ø22, TR: Ø8/25 cm | 0.35 × 0.24, LR: 4Ø14, TR: Ø8/25 cm |
| Third story | 0.50 × 0.30, LR: 4Ø14, TR: Ø8/25 cm | 0.60 × 0.30, LR: 4Ø22, TR: Ø8/25 cm | 0.35 × 0.24, LR: 4Ø14, TR: Ø8/25 cm |
| Design Variable | Options | Number of Options | Number of Bits for Encoding | |
|---|---|---|---|---|
| (1) | Th [°C] | 19, 20 (B *), 21, 22 | 4 | 2 |
| (2) | Tc [°C] | 24, 25, 26 (B), 27 | 4 | 2 |
| (3) | ev | 0.1, 0.25, 0.4, 0.5, 0.6, 0.7, 0.8, 0.9 (B) | 8 | 3 |
| (4) | av | 0.1, 0.25, 0.4, 0.5, 0.6 (B), 0.7, 0.8, 0.9 | 8 | 3 |
| (5) | er | 0.1, 0.25, 0.4, 0.5, 0.6, 0.7, 0.8, 0.9 (B) | 8 | 3 |
| (6) | ar | 0.1, 0.25, 0.4, 0.5, 0.6 (B), 0.7, 0.8, 0.9 | 8 | 3 |
| (7) | tv [m] | 0 (B), 0.04, 0.05, 0.06, 0.08, 0.10, 0.12, 0.14 | 8 | 3 |
| (8) | tr [m] | 0 (B), 0.04, 0.05, 0.06, 0.08, 0.10, 0.12, 0.14 | 8 | 3 |
| (9) | Windows’ type | w1 (B), w2, w3, w4, w5, w6, w7, w8 | 8 | 3 |
| Description and Considered Options | Investment Cost (IC) | Incentives | |||
|---|---|---|---|---|---|
| Heating System | Existing gas boiler (B *) | Natural gas boiler with nominal efficiency (η), assessed considering the LCV (lower calorific value) of gas, equal to 0.85. | ― | ― | |
| Condensing gas boiler | Condensing natural gas boiler with nominal η equal to 1.06. | 13,100 € | 65% of IC up to 30 k€, accorded in 10 | ||
| Air-source heat pump | Air-source electric heat pump with nominal COP (coefficient of performance) equal to 3.8. | 26,000 € | 65% of IC up to 30 k€, accorded in 10 years | ||
| Heating & Cooling | Ground-source reversible heat pump | Reversible ground-source electric heat pump with geothermal vertical probes:
| 97,500 € | 65% of IC up to 30 k€, accorded in 10 | |
| Cooling System | Existing air-cooled chiller (B) | Air-cooled electric chiller with nominal EER equal to 2.5. | ― | ― | |
| Efficient air-cooled chiller | Energy-efficient air-cooled electric chiller with nominal EER equal to 3.4. | 19,250 € | ― | ||
| DHW System | Existing gas boiler (B) | Natural gas boiler with nominal η equal to 0.85. | ― | ― | |
| Efficient gas boiler | Energy-efficient natural gas boiler with nominal η equal to 0.95. | 15,750 € | ― | ||
| RESs | Solar photovoltaic (PV) panels | Solar PV panels on the roof, south-oriented with tilt angle of 34°. The size is expressed by “cov”: percentage of the available roof area (=600 m2) covered by PV panels. Mutual shading is avoided. Cov can vary between 0% (B) and 100% with a step of 10%. Two typical PV types are considered: | poly-crystalline silicon | 250 € per m2 of panels’ surface | 50 % of IC up to 96 k€, accorded in 10 years |
| mono-crystalline silicon | 430 € per m2 of panels’ surface | ||||
| Force Pattern | Eccentricity | Safety Level | |
|---|---|---|---|
| Milan | Norcia | ||
| Mass X | X − E − | 80% | 15% |
| Mass Y | Y + E − | 100% | 50% |
| First Mode X | X − E + | 75% | 20% |
| First Mode Y | Y + E + | 100% | 24% |
| Location | TEDsc | DH | PEC | GC | EM (CO2-eq) |
|---|---|---|---|---|---|
| Milan | 86.08 kWht/m2a | 31.43% | 202.72 kWhp/m2a | 419.19 €/m2 (722.25 k€) | 58.66 kg/m2a (108.06 t/a) |
| Norcia | 70.43 kWht/m2a | 26.94% | 186.17 kWhp/m2a | 388.07 €/m2 (714.91 k€) | 54.38 kg/m2a (100.18 t/a) |
| Force Pattern | Eccentricity | Expected Annual Loss (EAL) | |
|---|---|---|---|
| Milan | Norcia | ||
| Mass X | X − E − | 5.29 k€ | 59.74 k€ |
| Mass Y | Y + E − | 3.47 k€ | 42.11 k€ |
| First Mode X | X − E + | 5.58 k€ | 60.40 k€ |
| First Mode Y | Y + E + | 3.47 k€ | 43.38 k€ |
| Location | TEDsc | DH | dPEC * | dGC * | IC | DPB | dEM * (CO2-eq) |
|---|---|---|---|---|---|---|---|
| Milan | 35.41 kWht/m2a | 13.55% | −124.26 kWhp/m2a | −106.96 €/m2 (−197.05 k€) | 267.6 k€ | 11 years | −36.22 kg/m2a (−66.73 t/a) |
Cost-optimal energy retrofit solution
| |||||||
| Location | TEDsc | DH | dPEC * | dGC * | IC | DPB | dEM * (CO2-eq) |
| Norcia | 26.13 kWht/m2a | 10.10% | −114.77 kWhp/m2a | −90.17 €/m2 (−166.12 k€) | 267.6 k€ | 12.1 years | −33.83 kg/m2a (−62.32 t/a) |
Cost-optimal energy retrofit solution
| |||||||
| Energy Retrofit Measure (ERM) | Effects on Seismic Loss Assessment |
|---|---|
| External plastering and 14 cm-thick thermal insulation of the walls | This ERM is applied on existing walls, and thus it is implemented in the fragility models of such walls. In particular, it influences the replacement cost of the walls that increases from 97 €/m2 to 145 €/m2. |
| External plastering and 14 cm-thick thermal insulation of the roof | The damage analysis assumes that each floor is a rigid diaphragm due to the thickness of the slab and cannot be damaged. For this reason, this ERM influences only the reconstruction cost of the whole building. |
| Installation of triple-glazed windows | This ERM influences the replacement cost of the component that increases from 200 €/m2 to 290 €/m2. |
| Installation of the condensing boiler | This ERM influences the replacement cost of the component (i.e., boiler) that increases from 7.8 k€ to 13.1 k€. |
| Installation of poly-crystalline PV | The damage analysis assumes that each floor is a rigid diaphragm due to the thickness of the slab and cannot be damaged. For this reason, this ERM influences only the reconstruction cost of the whole building. |
| Force Pattern | Eccentricity | Expected Annual Loss (EAL) | |
|---|---|---|---|
| Milan | Norcia | ||
| Mass X | X − E − | 7.69 k€ | 65.36 k€ |
| Mass Y | Y + E − | 3.70 k€ | 46.10 k€ |
| First Mode X | X − E + | 6.04 k€ | 66.07 k€ |
| First Mode Y | Y + E + | 3.71 k€ | 47.53 k€ |
| Force Pattern | Eccentricity | Increment of the Expected Annual Loss (EAL)> | |||
|---|---|---|---|---|---|
| Milan | Norcia | Milan | Norcia | ||
| [%] | [%] | [€] | [€] | ||
| Mass X | X − E − | 8.13% | 9.41% | 0.43 k€ | 5.62 k€ |
| Mass Y | Y + E − | 6.63% | 9.48% | 0.23 k€ | 3.99 k€ |
| First Mode X | X − E + | 8.24% | 9.39% | 0.46 k€ | 5.67 k€ |
| First Mode Y | Y + E + | 6.92% | 9.57% | 0.24 k€ | 4.15 k€ |
| Average Values | 7.48% | 9.46% | 0.34 k€ | 4.86 k€ | |
© 2017 by the authors. Licensee MDPI, Basel, Switzerland. This article is an open access article distributed under the terms and conditions of the Creative Commons Attribution (CC BY) license (http://creativecommons.org/licenses/by/4.0/).
Share and Cite
Mauro, G.M.; Menna, C.; Vitiello, U.; Asprone, D.; Ascione, F.; Bianco, N.; Prota, A.; Vanoli, G.P. A Multi-Step Approach to Assess the Lifecycle Economic Impact of Seismic Risk on Optimal Energy Retrofit. Sustainability 2017, 9, 989. https://doi.org/10.3390/su9060989
Mauro GM, Menna C, Vitiello U, Asprone D, Ascione F, Bianco N, Prota A, Vanoli GP. A Multi-Step Approach to Assess the Lifecycle Economic Impact of Seismic Risk on Optimal Energy Retrofit. Sustainability. 2017; 9(6):989. https://doi.org/10.3390/su9060989
Chicago/Turabian StyleMauro, Gerardo Maria, Costantino Menna, Umberto Vitiello, Domenico Asprone, Fabrizio Ascione, Nicola Bianco, Andrea Prota, and Giuseppe Peter Vanoli. 2017. "A Multi-Step Approach to Assess the Lifecycle Economic Impact of Seismic Risk on Optimal Energy Retrofit" Sustainability 9, no. 6: 989. https://doi.org/10.3390/su9060989
APA StyleMauro, G. M., Menna, C., Vitiello, U., Asprone, D., Ascione, F., Bianco, N., Prota, A., & Vanoli, G. P. (2017). A Multi-Step Approach to Assess the Lifecycle Economic Impact of Seismic Risk on Optimal Energy Retrofit. Sustainability, 9(6), 989. https://doi.org/10.3390/su9060989