Article

Economic Valuation of the Aquatic Biodiversity Conservation in South Korea: Correcting for the Endogeneity Bias in Contingent Valuation

1
Bayreuth Center of Ecology and Environmental Research, University of Bayreuth, Bayreuth 95440, Germany
2
Environmental Policy Research Group, Korea Environment Institute, Sejong 30147, Korea
3
Department of Agricultural and Resource Economics, Kangwon National University, Chuncheon 24341, Korea
4
Institute for Environmental Economics and World Trade, University of Hannover, Hannover 30167, Germany
*
Author to whom correspondence should be addressed.
Sustainability 2017, 9(6), 930; https://doi.org/10.3390/su9060930
Submission received: 24 February 2017 / Revised: 23 May 2017 / Accepted: 30 May 2017 / Published: 2 June 2017
(This article belongs to the Special Issue Sustainable River Basin Management)

Abstract

:
In this study, we use the Contingent Valuation (CV) method to estimate households’ willingness to pay (WTP) for the aquatic ecosystem health (biodiversity) improvement. This paper extends CV studies by dealing with the endogenous effect of a proxy variable, namely the subjective experience of negative environmental quality changes. The results show that the correction for the endogeneity bias facilitates the efficiency of parameter estimation in the empirical model. The mean WTP per household accounts for around 46.8% (KRW 79.6) of the current water use charge (KRW 170 per cubic meter). The total benefit from conserving the biodiversity is around KRW 198.62 billion. We found several factors that affect households’ WTP for fish biodiversity conservation, suggesting the importance of these factors in the formulation of water policies associated with aquatic biodiversity. In addition, the inefficient water management costs should be redistributed to other projects or new programs such as for the fish biodiversity conservation.

1. Introduction

Fish is at the very top of the aquatic ecosystem food chain and is widely used as a water quality indicator organism [1,2]. Rich fish diversity contributes to not only the provision of social-economic services, but also to the maintenance of the ecological balance of natural resources [3]. The restoration of fish habitats and the increases in populations of endangered fish can, thus, contribute to an improved provision of various ecosystem services [4,5]. On the contrary, decreases in fish biodiversity may have an adverse impact on the value of cultural services of aquatic ecosystems such as recreation, ecotourism, and education. Once the cultural value is distorted it can never be replaced [6]. Therefore, fish biodiversity conservation confers wider environmental benefits and also protects aquatic biodiversity for future generations [7].
The Han River basin is a primary source of drinking water for the Seoul metropolitan area in South Korea [8,9]. This basin is considered to have better aquatic biodiversity as a vital component of the stream food chain such as trophic diatom, benthic macroinvertebrate, and fish compared to other basins [10]. However, despite continuous efforts of the Korean government, the water quality of the basin has been an issue for years. The Han River Drinking Water Source Quality Improvement and Residents Support Act (hereafter “The Han River Law”) was, accordingly, established in 1999. A water use charge was introduced as a prime financial source for water quality improvement as stipulated in the Han River Law. Residents in the mid- and downstream areas in the Han basin (Seoul, Incheon, and part of Gyeonggi-do) who are supplied with water from upstream water source protection zones (part of Gyeonggi-do, Gangwon-do, and Chungcheongbuk-do) have to pay a water use charge [11,12].
One of the most severe water quality problems in the basin is attributed to water turbidity. This problem has occurred along with heavy rain events during the summer monsoon [8,13]. A high level of soil erosion from mountainous agricultural fields in upstream areas of the basin is also blamed for the contaminated turbid water problem [8,13]. An increase in turbidity levels is a primary cause of degrading water quality which leads to the degradation of aquatic ecosystems [14]. The negative effects of turbid water include, for example, breathing disorders, reduction in fertility, stunted growth, and destruction or degradation of fish habitat in all layers of the river from top to bottom [15,16,17,18]. Although fish diversity provides an important source of nutrition (food), commerce, and recreation for people [19,20], the frequent contaminated turbid water has accelerated loss in fish diversity due to the absence of practical policies and finance for the conservation and protection of endangered aquatic biota [21].
Taking fish diversity to social-economic services and ecological balance into account, endangered fish species extinction would lead to a severe welfare loss to all communities in the basin. This loss indicates that fish species endangered by turbid water should have a high priority in biodiversity conservation and water management decisions which influence social well-being [22]. Consequently, economic valuation studies on fish biodiversity conservation would provide policy makers with crucial information for a better understanding of the economic value of fish biodiversity. Such information can raise the awareness of the significance of aquatic biodiversity conservation.
The contingent valuation (CV) method as a stated preference approach has been widely used in the literature due to its capability of measuring the non-market value of ecosystem services [5,23]. Accordingly, there have been a number of studies using the CV method in order to measure a public preference for aquatic biota conservation [24,25,26,27,28,29,30,31]. Most of them are, however, based on single fish species which have the public’s great attention. Since many people express a strong preference for conserving their favorite individual species, the WTPs may be overrated by the bias in the valuation literature. The biased information may result in a failure to fulfill conservation policy aims [22].
Despite its popularity, the CV method has potential problems about proxy variables, e.g., attitudes toward and satisfaction levels for an environmental quality change as important determinants of WTP [32]. A proxy variable based on subjective experience of environmental quality changes may be influenced by the unobserved characteristics of respondents, which affect their WTPs. If the unobserved characteristics are correlated with both the subjective experience variable and the WTP, the coefficient of the variable will be biased in a WTP model. This is defined as the endogeneity bias [32]. In other words, any WTP models with the existence of endogeneity bias would provide inconsistent parameter estimates [33].
Against these circumstances, we, first of all, investigate the factors that affect households’ WTP for aquatic biodiversity conservation in the Han River basin. Instead of single fish species, wider assessments of aquatic biodiversity conservation are carried out based on the change in fish communities influenced by turbid water. Secondly, we examine and correct the endogeneity bias of a proxy variable underlying unobservable characteristics based on the subjective experience (direct or indirect) of negative environmental quality changes caused by the turbid water. Finally, we elicit households’ WTP for aquatic biodiversity conservation and estimate the total benefits.
Our study contributes to the literature in two aspects. Methodologically, we use a bivariate probit model to improve the statistical accuracy of parameter estimates through correction of the endogeneity bias, a potential problem of the CV method. Empirically, we calculate the total benefits (monetary value), which are regarded as an ecosystem service value elicited from the improvement in aquatic biodiversity due to the policy enforcement, and provide pragmatic settlement for the policy relation.
Our paper is structured as follows. Section 2 presents the description of case study areas including the issues associated with the distribution of water use charges and degradation and destruction of aquatic ecosystems (endangered fish communities). Section 3 describes the methodology of the study. The empirical results and discussion are presented in Section 4. Section 5 summarizes the conclusions and policy implications.

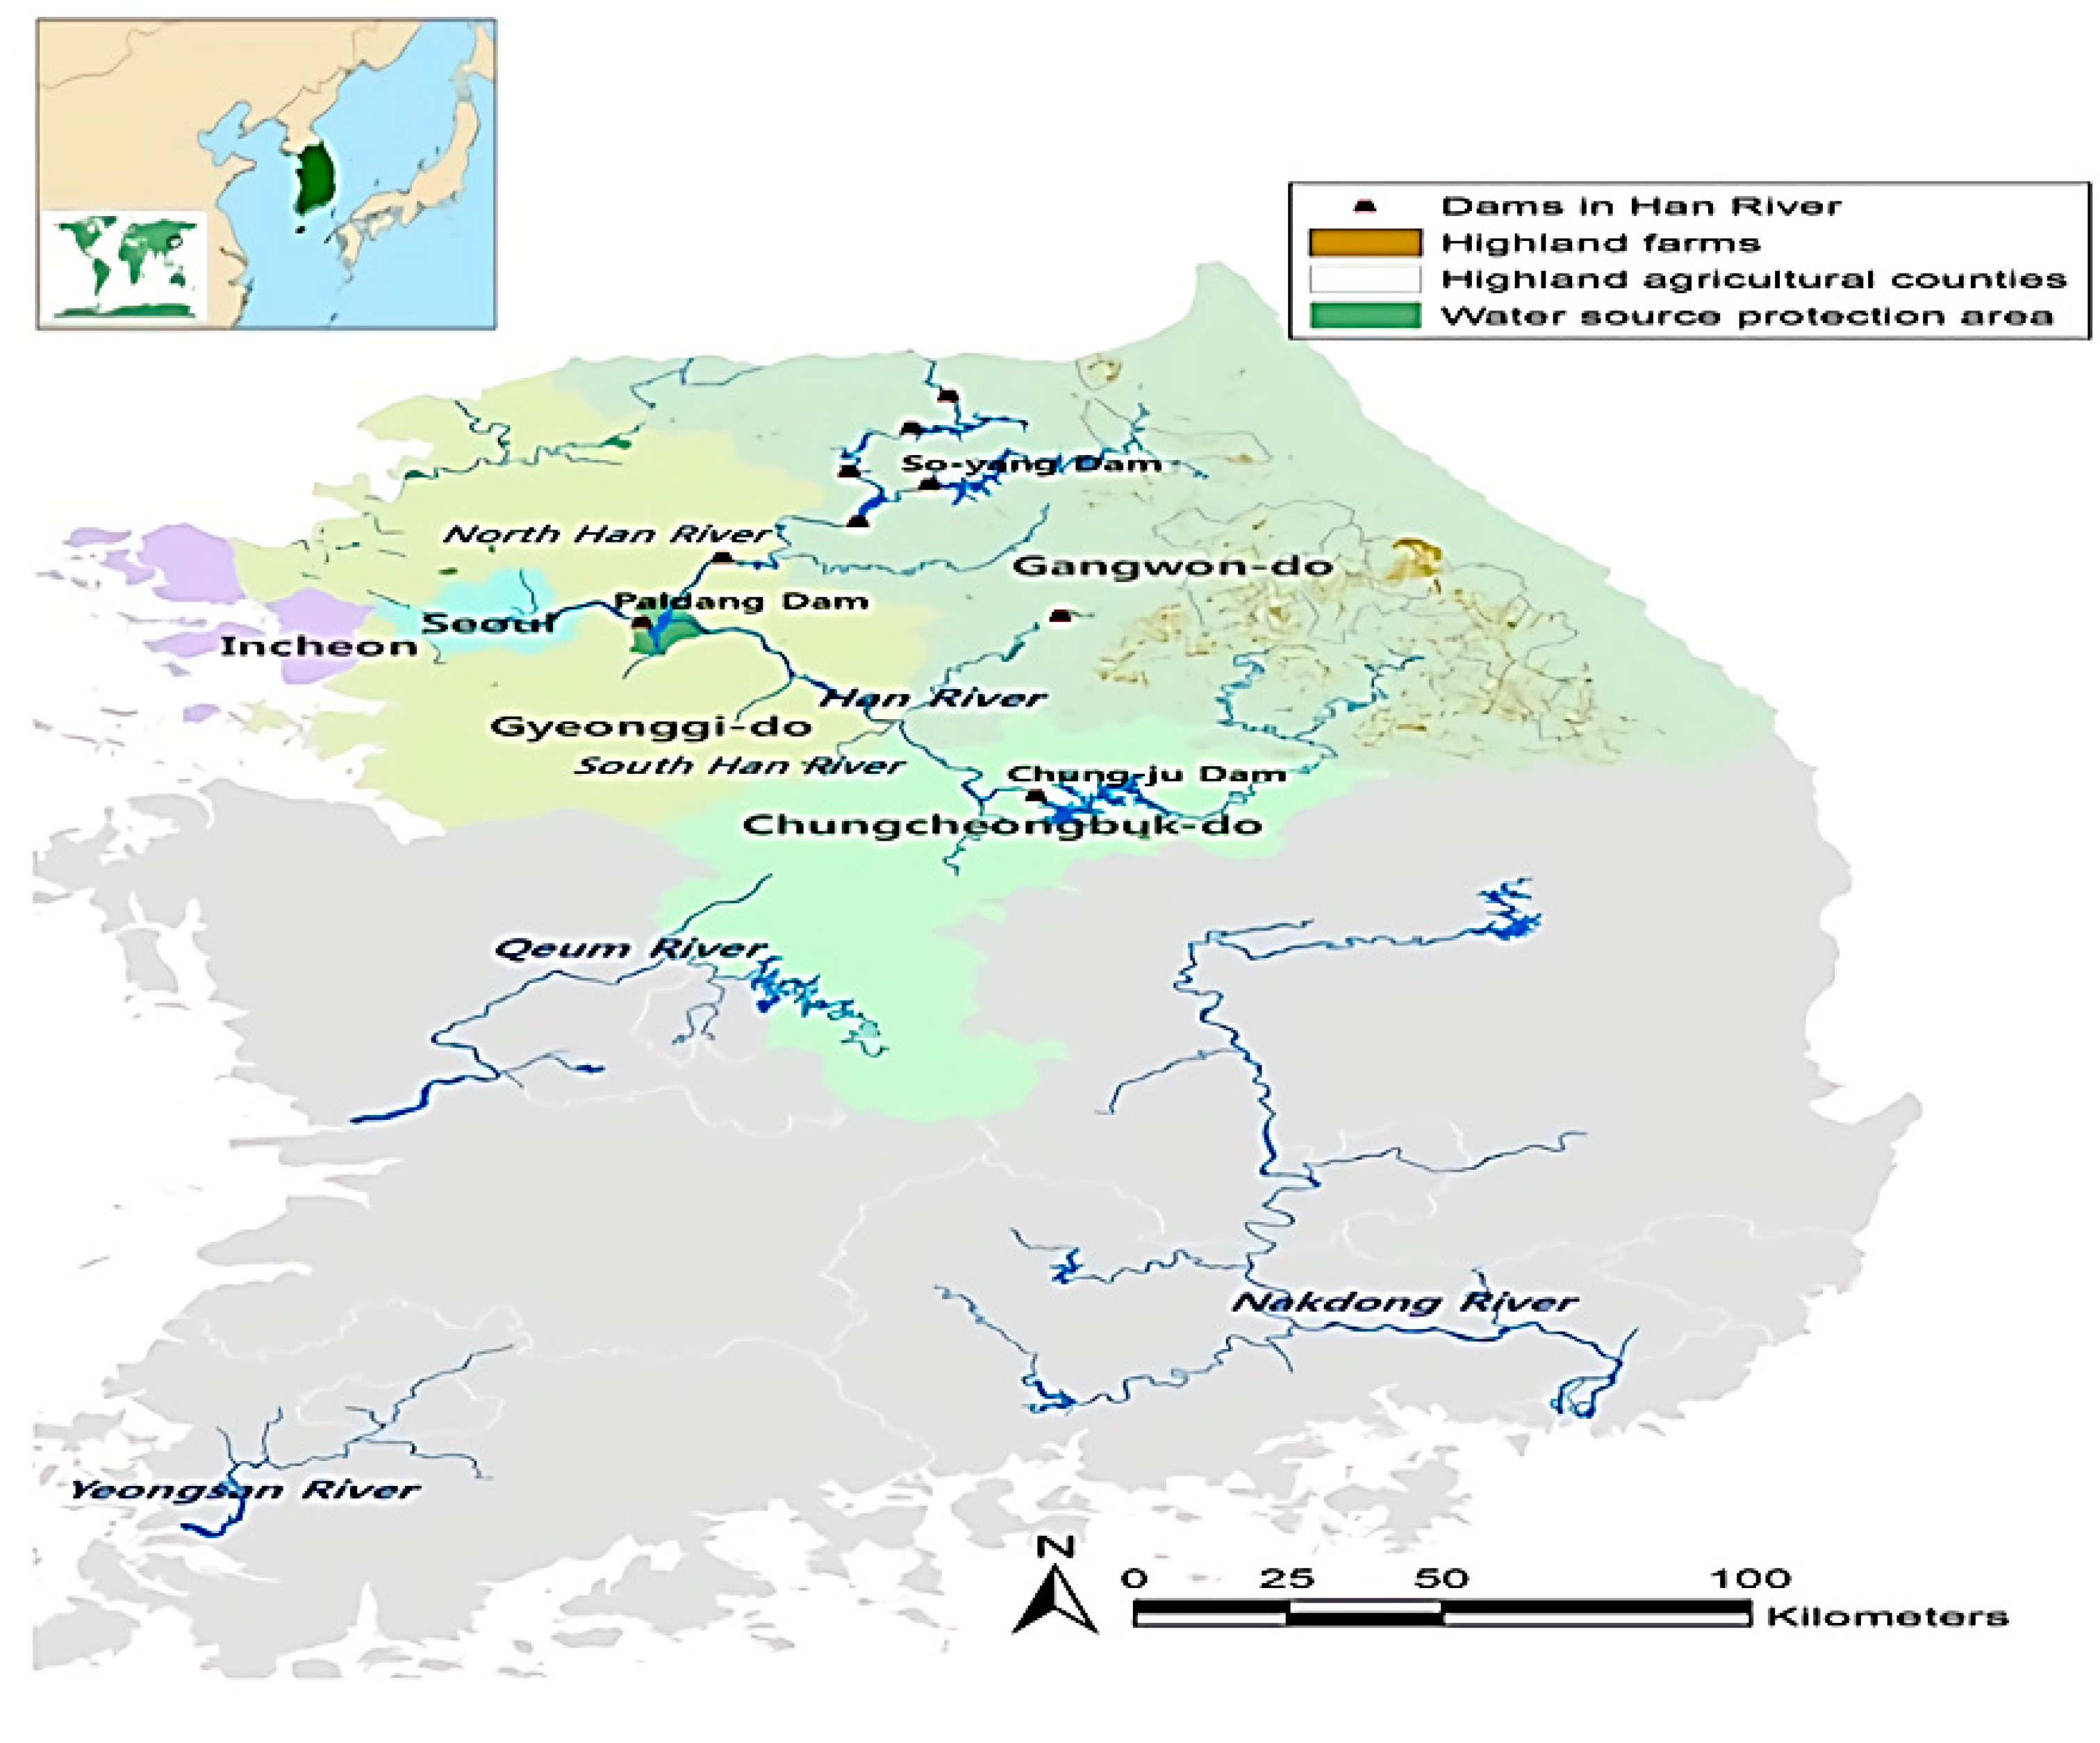
2. The Paldang Lake Case Study

The Han River basin lies on Seoul and Incheon (downstream), Gyeonggi-do (midstream), and Gangwon-do and Chungcheongbuk-do (upstream) (Figure 1). The area and human population of the basin are 24,988 km 2 and around 20.4 million, respectively. The upstream areas have the highest proportion of the area (65.6%, 16,398 ), followed by the mid- (31.6%, 7886 km 2 ) and the downstream areas (2.8%, 704 km 2 ). On the contrary, the downstream areas have the highest proportion of the population (56.6%, around 11.5 million), followed by the mid- (36.6%, around 7.5 million) and the upstream areas (6.9%, 1.4 million). The highland area for vegetable production in the basin which leads to the high soil erosion as a prime cause of the contaminated turbid water problem is 2753 km 2 . Around 61.8% (1702 km 2 ) of the vegetable areas belong to the upstream areas. The water source protection zones in the basin correspond to 191.3 km 2 and are predominated around the Paldang Lake in the midstream area (78.2%) [8,12].
Around the Paldang Lake as a main drinking water source in the Han River, basin pollution control and waste treatment facilities have been established and expanded year by year in order to protect or improve water quality. However, it has not been improved and there were growing needs for more systematic water management. The Han River Law was accordingly promulgated in 1999. Following the beneficiaries’ pay principle, a water use charge was introduced to arrange finance required for the Han River management fund. The charge has been increased from KRW 80 per cubic meter in 1999 to KRW 170 per cubic meter in 2014 (KRW is the currency unit of South Korea, and at the time of the survey (year 2014), USD 1 equaled KRW 1053.30) [11]. The residents in the mid- and downstream areas who receive various tangible and intangible benefits from the Han River have to pay this charge to the fund [8,9].
The Han River basin management fund is used for (1) construction and operation of waste treatment facilities; (2) upstream land purchase and riparian zone management; (3) upstream community support program; (4) water quality improvement programs such as natural stream restoration, non-point pollution source treatment, eco-friendly clean industry development, and drinking water source management; (5) operating expenses; and (6) total pollutant load management [12] (Table 1).
Contaminated turbid water which is released from high mountainous agricultural fields in upstream areas of the basin is still persistent. During the summer season, the highland vegetable farming is well developed in upstream areas over 400 m in altitude from the Han River basin. Intensively overusing chemical fertilizers such as nitrogen ( N ), phosphoric acid (P2O5), and potassium oxide (K2O) cause the topsoil to be poor. Farmers in the highland areas use 1.4 times of N , 2.4 times of P2O5, and 2.0 times of K2O more than the standard level of fertilizers recommended by the government [8,34]. Since about 50% of the highland fields descend steeply (more than 15° slope), soil erosion and nutrient runoff in the highland fields are further accelerated by heavy rain events during the summer season [8,35]. As stated by Kwak (2005) [36], the annual soil losses in the highland vegetable fields which have more than 15° slope are an average of 624.69 tons per hectare. This is eight times larger than those in other crop fields. Comparing with the Organization for Economic Cooperation Development (OECD) norm for annual soil losses (average 11 tons per hectare), only 17.8% of the highland fields (below 7° slope) meet the norm and the rest (82.2%) cause serious soil losses. This has led to a sharp rise in turbidity levels and a decline in water quality, consequently degrading the aquatic ecosystems of the basin.
The fish assessment index (FAI) is one of the biological indicators for aquatic ecological health assessment using the composition and diversity of collected fish species. The FAI is classified into four categories: “A (Excellent): 87.5 F A I 100 ”, “B (Good): 56.2 F A I < 87.5 ”, “C (Fair): 25.0 F A I < 56.2 ”, and “D (Poor): 0 F A I < 25.0 ”. The higher the value of FAI, the better the ecological health [10,37,38]. Based on the FAI, fish species living in category D (poor water quality) such as Silurusasotus, Cyprinuscarpio, and Carassiusauratus, which are much less affected by turbid water, are dominant in the Paldang Lake [21]. The proportion of fish species living in category A (excellent water quality) of the basin such as Rhynchocyprisoxycephalus, Rhynchocypriskumgangensis, and Brachymystaxlenok had been sharply reduced from 22.2% in 2008 to 12.5% in 2011 [10].
Stress index (SI) is another useful tool for predicting the effects of the pollution intensity of turbid water [39]. The higher the value of SI, the more stressful the fish habitat is. Kim et al. (2007) [15] investigated the impacts of turbid water on the individual number, density, and communities of fish by comparing the SI of fish habitat in a turbid (Daegi) stream (TS) with that in a non-turbid (Bongsan) stream (NTS). It showed that the TS with a mean SI of 10.3 has an eighty-four times higher stressful fish habitat than the NTS with a mean SI of 5.3. The NTS is dominated by Rhynchocypriskumgangensis (around 86.4%) living in category A (excellent water quality), whereas the TS is dominated by Zacco platypus or koreanus (around 32.0%), Orthriasnudus, Iksookimiakoreensis, and Pseudogobioesocinus (around 37.5%) living in category C (fair water quality) and category D (poor water quality). Fish density in the NTS was 4.1 times higher than that in the TS. Similarly, the fish community in the NTS is very analogous to that in natural streams of similar size. On the other hand, the TS has totally different fish communities. These results show that the inflow of massive soil to streams destroys fish habitats by filling spaces between gravel and crevices in rocks. It also degrades biodiversity through a break in the food chain caused by burying periphyton and benthos as primary producers. Fish communities may be considerably changed under strong stresses provoked by contaminated turbid water as aquatic chronic toxicity, risking the ecological balance of the basin [15,40,41].
Operational problems of the fund have been, in addition, posed along with frequent turbid water discharge problems in the Han River basin. The wasteful and inefficient use of the fund for water quality control, e.g., overinvestment in waste treatment facilities, underperforming land purchase of riparian zones, temporary community support, has been criticized by all local communities (stakeholders) [8,11]. While residents in the downstream areas call for the refusal or abolition of the water use charge, residents in the upstream areas ask for further compensation for their contributions for providing aquatic ecosystems services for the lowland areas [8,12].The responsibility for aquatic biodiversity conservation is still in dispute between stakeholders of the river system, without evaluating the economic benefits from conservation. Still, not much is known about the economic value of aquatic biodiversity and also the potential impact of its loss on social well-being [42].

3. Methodology

3.1. Measuring Welfare Change with Contingent Valuation Method Section

Ecosystem services are contributions of ecosystem structure (various species composition making up the biophysical architecture) and function (capacity to provide goods and services that satisfy human needs, directly and indirectly) to human well-being [43,44,45], by (1) creating economic wealth (income) and (2) preventing damages that impose costs on society. Therefore, both of these issues should be accounted for in policy assessments [46].
In the Han River basin, current measures and budgets required for aquatic biodiversity conservation are, however, insufficient to reduce contaminated turbid water from degrading aquatic ecosystems. There are, moreover, few studies associated with measuring positive and negative effects of the conservation policy. It is, thus, important to assess the economic benefits (monetary values) generated by the policy in order to derive optimal levels of conservation. This can help to gain reliable and objective information on trade-offs between benefits through aquatic biodiversity improvement and opportunity costs of abandoning economic and recreational activities [14,47].
The economic values of aquatic biodiversity are defined in the context of human welfare [48] and estimated by exploiting its effects on human welfare [23]. Individuals’ welfare can be affected by changes in quality of aquatic biodiversity [49]. As noted by Hicks (1943) [50], the concept of compensating surplus (CS) can be used to measure gain or loss from aquatic biodiversity. This welfare measure can be interpreted as individuals’ WTP for proposed new programs, improving quality in aquatic biodiversity which increases their welfare [23,49].
An alternative is the estimation of the willingness to accept (WTA) to compensate for the loss of aquatic biodiversity. However, it is widely believed that the WTA measure is rarely used in the stated preference approach (SPA) because the SPA is not incentive-compatible for WTA measure. The National Oceanic and Atmospheric Administration (NOAA) Blue Ribbon Panel on the CV also recommends researchers to measure WTP which is likely to provide (cautious) lower values, not WTA which may provide higher values [50]. We, thus, apply WTP approaches to elicit the individuals’ preference for aquatic biodiversity conservation [51,52,53,54,55].
This method is based on hypothetical scenarios which are similar to real conditions for aquatic biodiversity conservation. This can be much clearer by considering the relation between the expenditure function as dual to the indirect utility function and the Hicksian CS measure. The CV approach can be a way of estimating changes in the expenditure function or in the indirect utility function [56]. It has the capability of appropriately gaining the CS for an increase in the quality of aquatic biodiversity [23].

3.2. Contingent Valuation Scenarios and Target Population

In this study, we take into account aquatic biodiversity with regard to the abundance of fish communities, i.e., fish assessment index (FAI) and stress index (SI) showing the condition of aquatic ecosystems, according to water quality categories. Hwang et al. (2013) [10] indicated that based on the mean FAI in a recent three year period (2010 to 2012), the Han River basin overall belongs to category B (good water quality), but its FAI slightly decreased from 60.6 (2007 to 2009) to 59.9 (2010 to 2012). A close look at the result revealed that the proportion of category A (excellent water quality) decreased from 22.1% to 14.6%, whereas the proportion of category C (fair water quality) increased from 26.1% to 29.5%. As stated by Mills et al. (1985) [57], if the concentration of suspended solids (SS) lasts for 31 days in a range of more than 25 mg·L−1 per year or for 11 days in a range of more than 80 mg·L−1 per year, it causes serious damage to fish habitats in rivers. This is equivalent to a mean SI ranging from 9.8 to 10.0 year−1 corresponding to Kim et al. (2007) [15] (SI of 10.3 in the turbid stream of the basin).
In this respect, it is evident that the habitat of aquatic life in the basin has been influenced by contaminated turbid water, which indicates that fish communities are most likely to change under significant environmental stress caused by contaminated turbid water. Thus, we evaluate the WTP stated by households directly or indirectly associated with the basin in order to improve current levels of the mean FAI and SI. In the hypothetical market scenario, respondents are asked to choose a bid proposed or state a value for the improvement of the levels of mean FAI and SI (1) by increasing the proportion of water quality category A by around 15% (from 14.6% to 30.0%) and decrease that of category C by around 15% (from 29.5% to 15.0%), and (2) by reducing or keeping the concentration of SS below 25 mg·L−1 per year which have no negative impact on the habitat of aquatic life, consequently leading to abundance of fish communities (aquatic biodiversity) in the basin.
Following Whitehead et al. (1995) [58], the mid- and downstream on-site users of water from the Paldang Lake in the Han River basin are surveyed in this study. This is based on their acquaintance with the goods, and also with the fact that the WTPs of on-site users are more reliable because non-users do not take into account their income constraints when presenting their WTP. The CV results developed with direct knowledge of the goods, which narrows the gap between hypothetical and real markets, are valid [59].
To elicit households’ WTP, we use the single-bounded (SB) dichotomous choice question format in which respondents are asked for a yes-no answer to the WTP question developed by Alberini (1995) [60], Bishop and Heberlein (1979) [61], Haab and McConnell (2002) [56], and Hanemann et al. (1991) [26]. Compared to the double-bounded (DB) format in which respondents are asked a second dichotomous choice question that depends on the answer to the first, the SB format derives less information from respondents and is thus less efficient. It is, however, less complex to implement the survey and to analyze the data, and is relatively free from potential preference anomalies such as anchoring and shift biases that the DB format has [3,26,62].
To set up a good bid level (or starting point), which promotes respondents to reveal their true WTP [63,64], we first had discussions with two focus groups which include each 20 household heads over 19 years old. The heads are randomly selected from the mid- and downstream target population in order to gain information on (1) the preference for water use and water quality; (2) the perception of water use charges and aquatic biodiversity conservation; and (3) the level of WTP for the aquatic biodiversity conservation. Based on this preliminary analysis using data gathered from the focus group meetings, the bid levels for the WTP are Type A-20% (KRW 34), Type B-40% (KRW 68), Type C-60% (KRW 102), Type D-80% (KRW 136), and Type E-100% (KRW 170) of the current water use charge (170 KRW per cubic meter). Table 2 shows each type of bid level proposed and the proportion of respondents’ acceptance and refusal for each bid.

3.3. Survey Design and Administration

A quota sampling approach as a non-probability sample technique is used in this CV study. The main advantage of this quota sampling is to provide further information at a lower cost and in a faster time than a probability sample approach [65,66]. Setting up three quotas such as age, gender, and regional population, the sample size of 500 households with ±5% sampling error was decided based on the 2013 demographics of the mid- and downstream areas in the Han River basin. To prevent one bid level from being concentrated in one district, each type of bid level is evenly and randomly distributed to each district: midstream-288 (Type A-57, Type B-57, Type C-56, Type D-58, and Type E-58) and downstream-212 (Type A-43, Type B-43, Type C-42, Type D-42, and Type E-42).
The survey was carried out via e-mail instead of face-to-face interviews because it is being touted as a cost-effective and efficient survey implementation tool in many studies [67,68,69,70,71,72]. Specific tracking of the number of lost e-mails and the time the e-mail survey was started, replied to, and deleted can improve sampling procedures [73]. The e-mail survey can also increase response quality. This is because respondents are prone to give longer, more detailed, and plainer responses by e-mail compared to other types of surveys [73,74].

3.4. Data Analysis

We use a bivariate probit model to examine the determinants of households’ WTP. The probit model not only generates predicted values between 0 and 1, but also fits well to the non-linear relationship between the probabilities and the explanatory variables [75,76]. The probit model is defined as:
y j * = β X j + ε j ,   { y j = 1   i f   y j * > b i d j y j = 0   i f   y j * b i d j
where y j * represents the unobservable jth respondent’ actual WTP for aquatic biodiversity conservation; X j is a vector of the explanatory variables; β is a vector of parameters of explanatory variables; ε j is the unobservable random component distributed N   ( 0 ,   σ ) ; and y j is the discrete response of the jth respondent to the bid, b i d j , payment question (yes = 1 or no = 0).
As stated by Whitehead (2006) [32], the WTP model for an improvement in aquatic biodiversity is W T P j = β X 1 j + θ s e j + ε 1 j , where s e j is a subjective experience (both direct and indirect) of the environmental quality change, and θ is a parameter of the subjective experience. If the subjective experience variable is omitted, the WTP model is W T P j = β X 1 j + e 1 j , where e 1 j is the new error term: e 1 j = θ s e j + ε 1 j . If the subjective experience variable is correlated with any of the components of X 1 j , e 1 j is not separate from the independent variables, thus leading to a bias in parameters of the X 1 j due to the correlation with the subjective experience of the quality change.
The potential endogeneity bias can result from the inclusion of the subjective experience variable as a proxy variable. The level of the experience of the quality change is a subjective judgment which differs across individuals. The model of the subjective experience can be denoted as s e j = π X 2 j + ε 2 j , where X 2 j is a vector of variables which present the level of the subjective experience of the change in environmental quality, π is a vector of parameters of the X 2 j , and ε 2 j is a normally distributed error term. By putting the subjective experience model, s e j , in the former WTP model, the new WTP model can be generated as W T P j = β X 1 j + θ ( π X 2 j + ε 2 j ) + ε 1 j . If the common unobservable factors have an impact on both the subjectively perceived quality and the WTP, the correlation between ε 1 j and ε 2 j leads to another correlation between the subjective perception variable and the error term in the WTP model [32].
If there are, in other words, the same unobserved characteristics of the individuals that influence their likelihood of gaining subjective experience of the environmental quality change and their WTP as well, basic (naïve) probit models may cause the biased and inconsistent parameter on the subjective experience variable because they would reveal the mixed effect of the subjective experience and unobservable attitudes towards the environmental quality changes. The endogeneity bias would be positive or negative if the sign of the effect of the unobserved characteristics of the individuals is the same or opposite, respectively [33].
The potential endogeneity bias may lead to unreliable estimates of households’ WTP. In particular, the relation between the subjective experience of the quality change and the response to the bid payment question (WTP) may be biased. Therefore, we used a two-equation bivariate probit model as follows [77,78].
y 1 j * =   β 1 X 1 j + ε 1 j y 2 j * = ω y 1 j + β 2 X 2 j + ε 2 j ,
y 1 j ( e x p e r i e n c e ) = { 1   i f   S E j * > 0 0   i f   S E j * 0 ,   y 2 j ( a c c e p t a n c e ) = { 1   i f   W T P j * > b i d j 0   i f   W T P j * b i d j
y 1 j * and y 2 j * are latent variables and are not observable. S E j * indicates the inclination to have the subjective experience of the environmental quality change, W T P j * shows the inclination to accept the bid proposed in the payment question, implying the WTP for the aquatic biodiversity conservation. The two latent variables can be, however, observed from the dichotomous variables, y 1 j (whether a respondent has directly or indirectly experienced environmental quality changes) and y 2 j (actual answer of a respondent to the bid payment question). S E j * and W T P j * can be, thus, associated with the two reciprocative and observable dichotomous variables, experience and acceptance.
Following Cappellari and Jenkins (2003) [79], the relation between experience and acceptance was modeled along with a bivariate probit model using the mvprobit in STATA. This can enable the unobserved variables, S E j * and W T P j * , to be jointly distributed as a multivariate normal with a free correlation coefficient, ρ [33]. We first derived the determinants of WTP using the naïve model (Model 1) where acceptance is the dependent variable with the explanatory variables including experience. We then attempted to control the potentially endogenous experience using the bivariate probit model. One equation where experience is the dependent variable and the basic WTP equation (accept) simultaneously included in the multivariate probit model (Model 2). The variables in the experience equation would reflect only on S E j * , but not on W T P j * after correcting for parameters of other variables in the model. The variation in S E j * which is not correlated with the variation in W T P j * may enhance the elicitation of the relation between experience and acceptance, while correcting for the correlation between the experience and the error terms in the WTP model.
Following Ahlheim and Schneider (2013) [80], Farolfi et al. (2007) [81], Jones et al. (2008) [82], Mendonca and Tilton (2000) [83], Ojeda et al. (2008) [84], Phuong and Gpalakrishana (2003) [85], and Zhongmin et al. (2003) [86], we hypothesize that the households’ WTP for the aquatic biodiversity conservation are affected by (1) five socio-demographic variables for their characteristics: gender (male or female, dummy variable), age (year), children (whether to have children residing together, dummy variable), current residence of respondents (Gyeonggi-do: midstream, Seoul and Incheon: downstream, dummy variable), and income (low, med, high, dummy variable) and (2) two proxy variables for the quality change such as the perception of water quality (a 5-point Likert scale with a range from (1) very bad to (5) very good), and the subjective experience of environmental quality changes (yes or no, dummy variable). Table 3 presents the descriptive statistics (variable definition, mean, and standard deviation) of those variables used in the bivariate probit model.

4. Result and Discussion

4.1. Profile of the Surveyed Households

Of the 500 households surveyed in this study, the average income was in the range of KRW 40.0 million to less than KRW 50.0 million per year per household. In general, higher income households may not be significantly affected by a deduction from their total income for the bid amount. The household member variable is likely to have a negative influence on WTP. As household member increases, budgets tighten for larger families and their WTP decreases [80,87]. Gyeonggi-do is close to the Paldang Lake as a prime water source and has the largest benefits from the use of water resources (i.e., drinking, fishing, recreation, etc.) provided by the Paldang Lake. They are also close to the upstream area (Gangwon-do) including most of the high mountainous agricultural fields as a prime source of non-point pollution. Water quality deterioration caused by turbid water may lead to a decline in the benefits of the household in Gyeonggi-do [88,89]. If households have greater negative experiences and perceptions of the current water quality and fully recognize that the Paldang Lake provides diverse benefits to them, they may be more willing to pay for the aquatic ecosystem conservation program [13] (see Table 3).
Nearly all of the respondents (99.2%) felt the necessity of the aquatic biodiversity conservation program for the aquatic ecosystem health improvement in the Han River basin, whereas around 73.0% of the respondents accepted the program. The prime reason for the refusal (27.0%) of the program was that respondents are highly skeptical of the effect of the program (74.0%), followed by uncertain benefits of water users gained from the program (19.3%). This consequence shows that the mid- and downstream residents tend to distrust existing water management policies including the water use charge. They also doubt the benefits they will receive from the new programs proposed.

4.2. Correcting the Endogeneity Bias and Identifying the Determinants of WTP

To explore anomalous answers to the dichotomous choice (closed-end) question, respondents are asked with the open-ended question to specify their maximum WTP at the last stage of the CV survey. Respondents who are certain of their WTP in the closed-end question may respond to the open-ended question consistently. Those who aberrantly reveal their WTP in the closed-end question may, on the contrary, respond inconsistently [8]. We did not find any inconsistent results between the accepted closed-end bid in intervals and the open-ended WTP value. Since the accepted bid in the SB question is at broader intervals compared to that in the double-bounded (DB) question, there might be to some extent a limit to minutely detect aberrant responses through the comparison of the two questions. We, nevertheless, tried to reduce any possibility of other biases affecting respondents’ WTP in the CV data. Since the result shows that the inconsistent response bias might not be present, we, thus, focused on controlling the endogeneity bias in this study.
Table 4 shows the results of Model 1 which does not consider the endogeneity bias versus Model 2 (combination of experience and acceptance equations) which controls the bias. Based on the Wald test in Model 2, the null hypothesis that the correlation coefficient, ρ , among the two dichotomous variables experience and acceptance is equal to zero is rejected. The latter model considering the endogeneity bias, therefore, results in a statistically significant improvement in model fit.
The result of the Model 1 can be contrasted with that of the Model 2. As discussed earlier, the higher the level of the bid proposed increases, the higher the probability of accepting the bid decreases. The bid, accordingly, has negative and significant parameter estimates across the two models. We can confirm that the effect of experience on WTP is significant in both models. However, its sign conversely changed from being positive in Model 1 to negative in Model 2. This is because the positive correlation, ρ , between experience and the error terms in Model 1 exists. Due to the correlation, the true effect of experience on WTP is most likely to be biased.
The parameters of the explanatory variables estimated from Model 2 are associated with the correlation between the error terms of the experience and acceptance equations. In other words, if the respondents have the subjective experience of the negative aquatic ecosystem changes, the presence of their unobserved characteristics is more likely to encourage the variables to advocate the aquatic biodiversity conservation (positive effect). If the unobserved characteristics leading to the endogeneity bias are, however, corrected, the sign of the effect of experience turns negative. It is assumed that despite the contribution of the mid- and downstream residents to the water use charge aiming at water quality control, many of them have observed and heard about the damage from contaminated turbid water to aquatic biota. It makes them skeptical of the effectiveness of the water use charge. Thus, they have a fairly negative attitude toward any levies on new programs.
The respondents who are aware that the Paldang Lake provides tangible and intangible benefits such as drinking water, recreational activities, and aesthetic amenities for them were not only favorable to the aquatic biodiversity conservation program, but were also more likely to pay for the program. The long term turbid water discharge problems have, however, made it harder for the mid- and downstream residents to have those benefits. In particular, the residents who have observed and heard negative changes in environmental quality may try to find alternatives where they can enjoy outdoor activities again (experience). Those who already contribute to finding the alternative solution and regaining the benefits in different areas may be less likely to accept the payment proposed for the aquatic biodiversity conservation in the Han River.
Contrary to the result from Model 1, the regional difference in WTP among the mid- and downstream areas (region_d1, region_d2, region_d3) and the perception of current water quality (wqpercep) were not significantly correlated with households’ WTP in Model 2. Our expectation was that as households have benefits from the Paldang Lake and have more negative water quality perception, the possibility for bid choice increases. The reason is because they gain more benefits from using water resources provided by the Paldang Lake. They also recognize that the aquatic biodiversity conservation program will have a direct and positive impact on water quality and their local economy [13]. However, after correcting for the bias of experience in Model 2, the effects of region and wqpercep on WTP were not significant. They might be affected by the (true) change in the sign and the effect of experience. This means the two variables’ parameters derived from Model 1 may be inaccurate due to the impact of experience which have endogeneity bias, resulting in the biased WTP estimates. In fact, there would be no WTP difference among the mid- and downstream areas in the Han River basin since all residents along the river would have experienced the turbidity problems.
It is usually considered that income (lowincome_d1, medincome_d2, highincome_d3) should be positively correlated with WTP [50,90,91]. The sign of the income variable was, however, negative in Model 1 after controlling the endogeneity bias contrary to our expectation. There can be a different interpretation of this consequence as low and middle income households would be willing to pay more for the aquatic biodiversity conservation program than high income households. In other words, the low and middle income households are more susceptible to water quality and aquatic ecosystem conditions. If the water quality and the aquatic ecosystem conditions are, for instance, improved through the program, the low and middle income households can decrease not only the costs of drinking water purification, but also transfer costs of enjoying the recreational activities in different areas. By contrast, the high income households can easily find alternatives [9]. Our results are consistent with Stevens et al. (1991) [92] and Shin (1994) [93] who reported the negative income effects on WTP. Stevens et al. (1991) [92] discovered the negative effect of income in both closed-end and open-ended Tobit models in estimating the existence value of wildlife using the CV method. They stated that most of respondents who would pay revealed behavior contradictory to the neoclassical theory underlying the CV method [24] (p. 399). Shin (1994) [92] also detected the negative sign of income in identifying conservation values of environmental goods indicating that the option value in trading practices for possible future use of wilderness resources seems to be more vital to low and middle income people. The parameter of the income variable estimated in our study, thus, has statistical and economical significance.
Many empirical CV studies show results where the stated WTP decreases along with an increase in household members (children) (negative effect) [93,94,95]. However, our results show that the larger households are, particularly having more children, the higher their WTPs are. This means the variable children has a positive effect on the WTP. It is particularly the younger members who will be able to enjoy the benefits derived from the aquatic biodiversity conservation since those benefits will be available only in the distant future. Larger households should, thus, have a higher WTP for the program than smaller households. Some of the members of larger households will enjoy these benefits longer than the members of the smaller households. Most of them are most likely to be children and will live longer after the implementation of the aquatic biodiversity improvement program and its aim accomplishment [80].

4.3. Willingness to Pay and Benefit Calculation

Another focus of this study lies on the elicitation of households’ WTP for the aquatic biodiversity conservation in the Han River basin. Along with the mean WTP, values and numbers observed on the variability of the WTP elicited from the two models are presented in Table 5. Based on Model 2, the proportion of the monthly mean WTP per household was estimated at around 46.1% (KRW 78.4) of the current water use charge (KRW 170 per cubic meter), which was around 8.2% (KRW 13.9) higher than that of Model 1 (around 38.0%, KRW 64.6). After accounting for the correlation (endogeneity bias) between the experience and the error terms in the WTP model, each of the parameters of the explanatory variables changed. The effect of correcting the endogeneity bias could be dependent on the size of the relevant target population, which means the change in the mean WTP affecting policy decision making could be different for the level of the correction effect according to the relevant population [33].
It apparently seems that the mid- and downstream residents gain a lot of benefits from the fish biodiversity conservation seeking aquatic ecosystem improvement, whereas the upstream residents do not. Under these circumstances, the total benefits from the conservation, which entirely belong to the mid- and downstream areas, are calculated in our study. Table 6 presents the results of the benefit calculation. Based on the water use charge (KRW 170 per cubic meter) in 2014, the actual payments of mid- (Gyeonggi-do) and downstream areas (Seoul, Incheon) were at around KRW 193.93 billion and KRW 230.48 billion, respectively. Based on the proportion (46.1%, KRW 78.4) of the monthly mean WTP per household estimated in this study and the regional real payments for the water use charge, the total benefits were calculated to be around KRW 195.65 billion per year. The residents in the downstream areas obtain the highest benefits at around KRW 106.25 billion per year. The benefits of the midstream residents are around KRW 89.40 billion per year (Table 6).
Despite the implementation of the water use charge since 1999, there are still some problems regarding the distribution of the benefits along with contaminated turbid water resulting in the destruction or degradation of aquatic biodiversity. As we discussed earlier, the inflow of massive soil loss from the highland fields to the basin is regarded as the primary non-point pollution sources which negatively affect water quality and aquatic biodiversity. To solve this problem, land use management in the highland fields such as the upstream farmland purchase should be a priority among all the programs supported by the water use charge. In particular, a preferential purchase of the highland vegetables fields, which have more than 15° slope causing severe soil erosion, can reduce soil losses by more than eighty-fold [36]. This is consequently likely to decrease nutrient runoff ( N ,   P 2 O 5 ,   K 2 O ) and pollution intensity of turbid water (SI), resulting in improvement of aquatic ecological health (FAI) in the basin.
Choi et al. (2016) [8] show that total benefits derived by the implementation of the highland agriculture restriction policy are much higher than the costs related to land use management policies. This means that the economic activities of the upstream areas are patently restricted by the land use policy, while the mid- and downstream areas have the total benefits from the policy. Based on this result, the land use policy may significantly contribute to aquatic biodiversity improvement resulting in a considerable increase in social welfare.
However, the actual purchase of the upstream vegetable fields, the major source of non-point pollution, has not been implemented well. This is because due to the concern for significant income loss, the highland farmers are not willing to abandon their summer crop cultivation which is a major source of their income. To improve and conserve the aquatic biodiversity (ecosystems) in the basin, it is necessary to take further aggressive measures including increase in the (unit) costs for the highland purchase [8].
Since interest in aquatic ecosystem services has increased along with frequent turbid water discharge problems, there is a growing need for aquatic biodiversity conservation aimed at improving both aquatic ecosystems and social welfare. It is, thus, necessary and very important to more actively implement highland farmland purchases for aquatic biodiversity (ecosystem) conservation and improvement in the basin. If the practical costs could be reallocated to new or other items such as the highland purchase program, ongoing disputes between stakeholders regarding operation or management of the water use charge would be settled.

5. Conclusions and Policy Implications

This study aimed (1) to identify the determinants of households’ WTP for the fish biodiversity conservation aimed at improving aquatic ecosystems (biodiversity) in the Han River basin, (2) to investigate and correct the endogeneity bias of a proxy variable such as a subjective experience (direct or indirect) of negative environmental quality changes caused by the contaminated turbid water, and (3) to derive households’ WTP, examine differences in the WTP before and after controlling the endogeneity bias, and calculate the total benefit generated from aquatic biodiversity conservation.
To elicit the WTP (preferences) for aquatic biodiversity conservation, we used the contingent valuation (CV) method, as a popular economic valuation technique in biodiversity conservation. The CV method, however, has some potential problems. In particular, the omission of variables considering heterogeneity in perceptions of respondents of environmental quality levels between the status quo and hypothetical changes described in the CV survey increases the error of the WTP estimates. To solve the problem, proxy variables such as a subjective experience of environmental quality changes (experience) can be included in the WTP model. However, the correlation between experience and WTP affected by the unobserved characteristics of respondents may cause the endogeneity bias, leading to inconsistent parameter estimates.
We used a bivariate (multivariate) probit model (Model 2) in order to correct the potential endogeneity bias. The results show that Model 2 has greater statistical accuracy in parameter estimates compared to the naïve probit model (Model 1) without considering the bias. The coefficient of experience was endogenously biased (positively correlated) with WTP in Model 1. In Model 2, its sign and effect changed to negative (true effect). We assume that respondents who have observed and heard about damages to aquatic life due to the contaminated turbid water may be more skeptical of the effectiveness of the water use charge and also negative about that of newly proposed water policies. Since the long-term turbidity problems have been experienced by all districts along the Han River basin, there may be no WTP difference between residents of the mid- and downstream areas in the basin. In addition, those who have already found the alternatives or regained the benefits in different areas are less likely to accept the aquatic biodiversity conservation policy in the basin.
Households who reside with children (children) and have a lower income level (lowincome) may be more willing to pay for the aquatic biodiversity conservation. It seems that the higher income households can afford to find alternatives for enjoying their outdoor activities, which means that they are less responsive to environmental quality changes. If the Han River basin is qualitatively improved through the conservation program, the lower income households can save travel time and costs by enjoying the outdoor activities around the basin close to their residences. They are, thus, more affected by changes in the environmental quality. Since the younger household members will live longer after the policy enforcement and the attainment of its goal, they will be able to enjoy the benefits of the rich aquatic biodiversity longer. The households residing with children are likely to have a higher WTP for the aquatic biodiversity conservation than those without children.
The mean WTP per month per household is estimated at around 46.1% (KRW 78.4) of the current water use charge (KRW 170 per cubic meter). Based on the mean WTP per household and the real annual payments (KRW 424.41 billion) of the mid- and downstream areas for the water use charge in 2014, the total benefit from the improvement of the aquatic ecosystems generated by the fish biodiversity conservation is calculated at around KRW 195.65 billion.
Due to harm of the contaminated turbid water to aquatic biota, more positive highland purchases to improve and conserve aquatic biodiversity (ecosystem) is becoming a necessity in the basin. Obviously, the land use management policy contributes to preventing massive soil loss from the highland vegetable fields and its inflow to the basin. Above all, the purchase of the highland vegetable fields having steep slopes (more than 15°) and causing drastic soil erosion (more than 8 times) is significantly able to contribute to maintaining a good aquatic ecological balance (biodiversity) of the basin by reducing the stress of fish habitats (SI) and improving fish diversity (FAI).
Although the benefits from aquatic biodiversity improvement should be equally distributed among stakeholders in the basin, the mid- and downstream areas have almost all the benefits. On the contrary, the upstream areas (highland farmers) are under restrictions of their economic activities. For the efficient implementation of the highland vegetable field purchase, it is necessary that appropriate compensation for the abandonment of their highland cultivation causing significant income loss is guaranteed through practical measures such as a rise in unit costs for the highland purchases. To settle contentious issues on operation or management of the water use charge, reallocation of the realistic costs to the highland purchase program for the aquatic biodiversity conservation and improvement should be taken into consideration.
Society is provided a wide variety of ecosystem services such as food provision, biodiversity, recreation, drinking water, etc. from water bodies [96]. The total benefit calculated in our study is involved in only one service, aquatic biodiversity improvement created by the fish biodiversity conservation policy.

Acknowledgments

This study was carried out as part of the International Research Training Group TERRECO (GRK 1565/1) funded by the German Research Foundation (DFG) and the University of Bayreuth in the funding programme Open Access Publishing.

Author Contributions

Ik-Chang Choi conceived and designed the experiments, wrote the paper, analyzed the data, and performed the econometric analysis; Hyun No Kim analyzed the data and performed the econometric analysis; Hio-Jung Shin, John Tenhunen, and Trung Thanh Nguyen contributed reagents, materials, and analysis tools.

Conflicts of Interest

The authors declare no conflict of interest.

References

  1. Barbour, M.T.; Gerritsen, J.; Snyder, B.D.; Stribling, J.B. Rapid Bioassessment Protocols for Use in Streams and Wadeable Rivers: Periphyton, Benthic Macroinvertebrates and Fish, 2nd ed.; EPA 841-B-99-002; US EPA Office of Water: Washington, DC, USA, 1999.
  2. Karr, J.R. Assessment of Biotic Integrity using Fish Communities. Fisheries 1981, 6, 21–27. [Google Scholar] [CrossRef]
  3. Poufoun, J.N.; Abildtrup, J.; Sonwa, D.J.; Delacote, P. The value of endangered forest elephants to local communities in a transboundary conservation landscape. Ecol. Econ. 2016, 126, 70–86. [Google Scholar] [CrossRef]
  4. Loomis, J.; White, D. Economic benefits of rare and endangered species. Ecol. Econ. 1996, 18, 197–206. [Google Scholar] [CrossRef]
  5. Loomis, J.; Kent, P.; Strange, L.; Fausch, K.; Covich, A. Measuring the total economic value of restoring ecosystem services in an impaired river basin: Results from a contingent valuation survey. Ecol. Econ. 2000, 33, 103–117. [Google Scholar] [CrossRef]
  6. Beaumont, N.J.; Austen, M.C.; Mangi, S.C.; Townsend, M. Economic valuation for the conservation of marine biodiversity. Mar. Pollut. Bull. 2008, 56, 386–396. [Google Scholar] [CrossRef] [PubMed]
  7. Collares-Pereira, M.J.; Cowx, I.G. The role of catchment scale environmental management in freshwater fish conservation. Fish. Manag. Ecol. 2004, 11, 303–312. [Google Scholar] [CrossRef]
  8. Choi, I.C.; Kim, H.N.; Shin, H.J.; Tenhunen, J.; Nguyen, T.T. Willingness to Pay for a Highland Agricultural Restriction Policy to Improve Water Quality in South Korea: Correcting Anomalous Preference in Contingent Valuation Method. Water 2016, 8, 547. [Google Scholar] [CrossRef]
  9. Shin, H.J.; Kim, H.N.; Jeon, C.H.; Jo, M.H.; Nguyen, T.T.; Tenhunen, J. Benefit transfer for water management along the Han River in South Korea using Meta-Regression Analysis. Water 2016, 8, 492. [Google Scholar] [CrossRef]
  10. Hwang, S.J. Nationwide Aquatic Ecological Monitoring Program; National Institute of Environmental Research (NIER): Incheon, Korea, 2013. (In Korean)
  11. Seoul Metropolitan Government (SMG). A White Paper on Improving Water Use Charge System; SMG: Seoul, Korea, 2014. (In Korean)
  12. Kim, K.M. Improvement of the Han River Watershed Management Fund Policies; National Assembly Research Service (NARS) Issue Report 160; NARS: Seoul, Korea, 2012. (In Korean)
  13. Shin, H.J.; Jeon, C.H.; Choi, I.C.; Yeon, I.C. Estimation of beneficiary’s willingness to pay in mid and down-stream area to the water quality improvements in upper Bukhan River Basin. Seoul Stud. 2009, 10, 91–106. (In Korean) [Google Scholar]
  14. Pagiola, S.; Agostini, P.; Gobbi, J.; de Haan, C.; Ibrahim, M.; Murgueitio, E.; Ramírez, E.; Rosales, M.; Ruíz, J.P. Paying for Biodiversity Conservation Services in Agricultural Landscapes; The World Bank Environment Department Paper No. 96; The World Bank: Washington, DC, USA, 2004. [Google Scholar]
  15. Kim, J.K.; Choi, J.S.; Jang, Y.S.; Lee, K.Y.; Kim, B.C. Effects of Turbid Water on Fish Community: Case Studies of the Daegi Stream and the Bong-san Stream. Korean J. Ecol. Environ. 2007, 40, 459–467. (In Korean) [Google Scholar]
  16. Bash, J.; Berman, C.; Bolton, S. Effects of Turbidity and Suspended Solids on Salmonids; WA-RD 526.1; Center for Streamside Studies: Seattle, WA, USA, 2001. [Google Scholar]
  17. Boon, P.J.; Davis, B.R.; Petts, G.E. Global Perspectives on River Conservation: Science, Policy and Practice; John Wiley and Sons Ltd.: New York, NY, USA, 2000. [Google Scholar]
  18. Dudgeon, D. River Rehabilitation for Conservation of Fish Biodiversity in Monsoonal Asia. Ecol. Soc. 2005, 10, 15. [Google Scholar] [CrossRef]
  19. Beard, T.D., Jr.; Arlinghaus, R.; Cooke, S.J.; McIntyre, P.B.; de Silva, S.; Bartley, D.; Cowx, I.G. Ecosystem approach to inland fisheries: Research needs and implementation strategies. Biol. Lett. 2011, 7, 481–483. [Google Scholar] [CrossRef] [PubMed]
  20. Food and Agriculture Organization (FAO). The State of World Fisheries and Aquaculture; FAO of the United Nations: Rome, Italy, 2010. [Google Scholar]
  21. Lee, S.D. A management planning for aquatic ecosystems damaged by increase in turbid water in the Bukhan River. River Cult. 2012, 8, 72–76. (In Korean) [Google Scholar]
  22. Ressurreição, A.; Gibbons, J.; Dentinho, T.P.; Kaiser, M.; Santos, R.S.; Edwards-Jones, G. Economic valuation of species loss in the open sea. Ecol. Econ. 2011, 70, 729–739. [Google Scholar] [CrossRef]
  23. Mitchell, R.C.; Carson, R.T. Using Surveys to Value Public Goods: The Contingent Valuation Method; Resources for the Future (RFF) Press: Washington, DC, USA, 1989. [Google Scholar]
  24. Stevens, T.; Echeverria, J.; Glass, R.; Hager, T.; More, T. Measuring the existence value of wildlife: What do CVM estimates really show? Land Econ. 1991, 67, 390–400. [Google Scholar] [CrossRef]
  25. Bulte, E.H.; van Kooten, G.C. Marginal valuation of charismatic species: Implications for conservation. Environ. Resour. Econ. 1999, 14, 119–130. [Google Scholar] [CrossRef]
  26. Hanemann, M.; Loomis, J.; Kanninen, B. Statistical efficiency of double-bound dichotomous choice contingent valuation. Am. J. Agric. Econ. 1991, 73, 1255–1263. [Google Scholar] [CrossRef]
  27. Olsen, D.; Richards, J.; Scott, D. Existence and sport values for doubling the size of Columbia river basin salmon and steelhead runs. Rivers 1991, 2, 44–56. [Google Scholar]
  28. Kotchen, M.J.; Reiling, S.D. Estimation and questioning economic values for endangered species: An application and discussion. Endanger. Species Update 1998, 15, 77–83. [Google Scholar]
  29. Cummings, R.P.; Ganderton, P.; McGuckin, T. Substitution effects in CVM values. Am. J. Agric. Econ. 1994, 76, 205–214. [Google Scholar] [CrossRef]
  30. Boyle, K.J.; Bishop, R.C. Valuing wildlife in benefit-cost analysis: A case study involving endangered species. Water Resour. Res. 1987, 23, 943–950. [Google Scholar] [CrossRef]
  31. Carson, R.T.; Wilks, L.; Imber, D. Valuing the preservation of Australia’s Kakadu conservation zone. Oxf. Econ. Pap. 1994, 46, 727–749. [Google Scholar] [CrossRef]
  32. Whitehead, J.C. Improving willingness to pay estimates for quality improvements through joint estimation with quality perceptions. South. Econ. J. 2006, 73, 100–111. [Google Scholar] [CrossRef]
  33. Martínez-Espiñeira, R.; Lyssenko, N. Correcting for the endogeneity of pro-environment behavioral choices in contingent valuation. Ecol. Econ. 2011, 70, 1435–1439. [Google Scholar] [CrossRef]
  34. Ministry of Environment (MOE). Comprehensive Plan for Reduction of the Non-Point Pollution Source in the Highland Field; MOE: Sejong, Korea, 2004.
  35. Nguyen, T.T.; Hoang, N.V.; Seo, B. Cost and environmental efficiency of rice farms in South Korea. Agric. Econ. 2012, 43, 367–376. [Google Scholar] [CrossRef]
  36. Jung, K. Assessment of Soil Erosion Potential in Korea; Rural Development Administration: Suwon, Korea, 2005.
  37. Noh, S.Y.; Choi, H.L.; Park, J.Y.; Hwang, S.J.; Kim, S.H.; Lee, J.A. Ecological Health Assessment using Fish for the Han River and Nakdong River in Korea. J. Korean Soc. Water Environ. 2015, 31, 319–327. [Google Scholar] [CrossRef]
  38. Ministry of Environment (MOE) and National Institute of Environmental Research (NIER). Waterwide Aquatic Ecological Monitoring Program (V); MOE and NIER: Sejong, Korea, 2012.
  39. Newcombe, T.W.; MacDonald, D.D. Effects of suspended sediments on aquatic ecosystems. N. Am. J. Fish. Manag. 1991, 11, 72–82. [Google Scholar] [CrossRef]
  40. Maret, T.R.; Burton, T.A.; Harvey, G.W.; Clark, W.H. Field Testing of New Monitoring Protocols to Assess Brown Trout Spawning Habitant in Idaho Streams. N. Am. J. Fish. Manag. 1993, 13, 567–580. [Google Scholar] [CrossRef]
  41. Cederholm, C.J.; Salo, E.O. The Effects of Logging Road Landslide Siltation on the Salmon and Trout Spawning Gravels of Stequaleho Creek and the Clear Water River Basin, Jefferson County, Washington, 1972–1978; FRO-UW-7915; Fisheries Research Institute: Seattle, WA, USA, 1979. [Google Scholar]
  42. Turpie, J.K. The existence value of biodiversity in South Africa: How interest, experience, knowledge, income and perceived level of threat influence local willingness to pay. Ecol. Econ. 2003, 46, 199–216. [Google Scholar] [CrossRef]
  43. Burkhard, B.; de Groot, R.; Costanza, R.; Seppelt, R.; Jørgensen, S.E.; Potschin, M. Solutions for sustaining natural capital and ecosystem services. Ecol. Indic. 2012, 21, 1–6. [Google Scholar] [CrossRef]
  44. Crossman, N.D.; Burkhard, B.; Nedkov, S.; Willemen, L.; Petz, K.; Palomo, L.; Drakou, E.G.; Martín-Lopez, B.; McPhearson, T.; Boyanova, K. A blueprint for mapping and modeling ecosystem services. Ecosyst. Serv. 2013, 4, 4–14. [Google Scholar] [CrossRef]
  45. De Groot, R.S.; Alkemade, R.; Braat, L.; Hein, L.; Willemen, L. Challenges in integrating the concept of ecosystem services and values in landscape planning, management and decision making. Ecol. Complex. 2010, 7, 260–272. [Google Scholar] [CrossRef]
  46. Department for Environment, Food and Rural Affairs (DEFRA). An Introductory Guide to Valuing Ecosystem Services; DEFRA: London, UK, 2007.
  47. Lehtonen, E.; Kuuluvainen, J.; Pouta, E.; Rekola, M.; Li, C.Z. Non-market benefits of forest conservation in southern Finland. Environ. Sci. Policy 2003, 6, 195–204. [Google Scholar] [CrossRef]
  48. Krieger, D.J. The Economic Values of Forest Ecosystem Services: A Review; The Wilderness Society: Washington, DC, USA, 2004. [Google Scholar]
  49. Mezgebo, A.; Tessema, W.; Asfaw, Z. Economic Values of Irrigation Water in Wondo Genet District, Ethiopia: An Application of Contingent Valuation method. J. Econ. Sustain. Dev. 2013, 4, 2222–2855. [Google Scholar]
  50. Hicks, J.R. History of Economic Doctrine. Econ. Hist. Rev. 1943, a13, 111–115. [Google Scholar] [CrossRef]
  51. Alberini, A.; Kahn, J.R. (Eds.) Handbook on Contingent Valuation; Edward Elgar Publishing Inc.: Massachusetts, MA, USA, 2006. [Google Scholar]
  52. Bandara, R.; Tisdell, C. Comparison of rural and urban attitudes to the conservation of Asian elephants in Sri Lanka: Empirical evidence. Biol. Conserv. 2003, 110, 327–342. [Google Scholar] [CrossRef]
  53. Baral, N.; Gautam, R.; Timilsina, N.; Bhat, M.G. Conservation implications of contingent valuation of critically endangered White-rumped Vulture Gyps bengalensis in South Asia. Int. J. Biodivers. Sci. Manag. 2007, 3, 145–156. [Google Scholar] [CrossRef]
  54. Baral, N.; Stern, M.J.; Bhattarai, R. Contingent valuation of ecotourism in Annapurna conservation area, Nepal: Implications for sustainable park finance and local development. Ecol. Econ. 2008, 66, 218–227. [Google Scholar] [CrossRef]
  55. De Mendonca, M.J.C.; Sachsida, A.; Loureiro, P.R.A. A study on the valuing biodiversity: The case of three endangered species in Brazil. Ecol. Econ. 2003, 46, 9–18. [Google Scholar] [CrossRef]
  56. Haab, T.C.; McConnell, K.E. Valuing Environmental and Natural Resources: The Econometrics of Non-Market Valuation; Edward Elgar Publishing: Cheltenham, UK, 2002. [Google Scholar]
  57. Mills, W.B.; Porcella, D.B.; Ungs, M.J.; GhErini, S.A.; Summers, K.V. Water Quality Assessment: A Screening Procedure for Toxic and Conventional Pollutionsinsurface and Ground Water; Report 600/6-85/0.02a; U.S. Environmental Protection Agency: Athens, GA, USA, 1985.
  58. Whitehead, J.C.; Blomquist, G.C.; Hoban, T.J.; Clifford, W.B. Assessing the validityand reliability of contingent values: A comparison of on-site users, off-site users, and non-users. J. Environ. Econ. Manag. 1995, 29, 238–251. [Google Scholar] [CrossRef]
  59. Paradiso, M.; Trisorio, A. The effect of knowledge on the disparity between hypothetical and real willingness to pay. Appl. Econ. 2001, 33, 1359–1364. [Google Scholar] [CrossRef]
  60. Alberini, A. Efficiency vs bias of willingness-to-pay estimates: Bivariate and interval-data models. J. Environ. Econ. Manag. 1995, 29, 169–180. [Google Scholar] [CrossRef]
  61. Bishop, R.C.; Heberlein, T.A. Measuring values of extra market goods: Are indirect measures biased? Am. J. Agric. Econ. 1979, 61, 926–930. [Google Scholar] [CrossRef]
  62. Herridges, J.A.; Shogren, J.F. Starting point bias in dichotomous choice valuation with follow-up question. J. Environ. Econ. Manag. 1996, 30, 112–131. [Google Scholar] [CrossRef]
  63. Bateman, I.J.; Burgess, D.; Hutchinson, W.G.; Matthews, D.I. Learning design contingent valuation (LDCV): NOAA guidelines, preference learning and coherent arbitrariness. J. Environ. Econ. Manag. 2008, 55, 127–141. [Google Scholar] [CrossRef]
  64. Brouwer, R.; Martín-Ortega, J. Modeling self-censoring of polluter pays protest votes in stated preference research to support resource damage estimations in environmental liability. Resour. Energy Econ. 2012, 34, 151–166. [Google Scholar] [CrossRef]
  65. Gschwend, T. Analyzing quota sample data and the peer-review process. Fr. Politics 2005, 3, 88–91. [Google Scholar] [CrossRef]
  66. Northrop, A. Sampling and data collection. In Handbook of Research Methods in Public Administation, 2nd ed.; Miller, G.J., Whicker, M.L., Eds.; Marcel Dekker Inc.: New York, NY, USA, 1999. [Google Scholar]
  67. Kwak, N.; Radler, B. A Comparision between mail and web surveys: Response pattern, respondent profile, and data quality. J. Off. Stat. 2002, 18, 257–273. [Google Scholar]
  68. Schaefer, D.R.; Dillman, D.A. Development of a standard e-mail methodology: Results of an experiment. Public Opin. Q. 1998, 62, 378–397. [Google Scholar] [CrossRef]
  69. Schmidt, W.C. Worldwide web survey research: Benefits, potential problems, and solutions. Behav. Res. Methods 1997, 29, 274–279. [Google Scholar] [CrossRef]
  70. Smith, C.B. Casting the net: Surveying an Internet population. J. Comput. Med. Commun. 1997, 3. [Google Scholar] [CrossRef]
  71. Weible, R.; Wallace, J. The impact of the internet on data collection. Mark. Res. 1998, 10, 19–23. [Google Scholar]
  72. Sheehan, K.B. E-mail survey response rates: A review. J. Comput. Med. Commun. 2001, 6. [Google Scholar] [CrossRef]
  73. Paolo, A.M.; Bonaminio, G.A.; Gibson, C.; Patridge, T.; Kallail, K. Response rate comparisons of e-mail and mail distributed student evaluations. Teach. Learn. Med. 2000, 12, 81–84. [Google Scholar] [CrossRef] [PubMed]
  74. Bachmann, D.; Elfrink, J.; Vazzana, G. E-mail and snail mail face off in rematch. Mark. Res. 1999, 11, 11–15. [Google Scholar]
  75. Pindyck, R.S.; Rubinfeld, D.C. Econometric Models and Econometric Forecasts, 2nd ed.; Mcgraw-HillBook Co.: New York, NY, USA, 1981. [Google Scholar]
  76. Gujarati, D.N. Basic Econometrics, 4th ed.; Mcgraw-HillBook Co.: New York, NY, USA, 2004. [Google Scholar]
  77. Maddala, G.S. Limited dependent and qualitative variables in econometrics; Cambridge University Press: New York, NY, USA, 1983. [Google Scholar]
  78. Wilde, J. Identification of multiple equation probit models with endogenous dummy regressors. Econ. Lett. 2000, 3, 309–312. [Google Scholar] [CrossRef]
  79. Cappellari, L.; Jenkins, S.P. Multivariate probit regression using simulated maximum likelihood. Stata J. 2003, 3, 278–294. [Google Scholar]
  80. Ahlheim, M.; Schneider, F. Considering household size in contingent valuation studies. Environ. Econ. 2013, 4, 112–123. [Google Scholar]
  81. Farolfi, S.; Mabugu, R.; Ntshingila, S. Domestic Water Use and Values in Swaziland: A Cotingent Valuation Analysis. Agrekon 2007, 46, 157–170. Available online: http://ageconsearch.umn.edu/handle/10130 (accessed on 24 January 2017). [CrossRef]
  82. Jones, N.; Sophoulis, C.M.; Malesios, C. Economic valuation of coastal water quality and protest responses: A case study in Mitilini, Greece. J. Socio Econ. 2008, 37, 2478–2491. [Google Scholar] [CrossRef]
  83. Mendonca, A.F.; Tilton, J.E. A Contingent Valuation Study of the Environmental Costs of Mining in the Brazilizn Amazon. J. Miner. Energy 2000, 15, 21–32. [Google Scholar] [CrossRef]
  84. Ojeda, M.; Mayer, A.; Solomon, B. Economic Valuation of Environmental Services Sustained by Water Flows in the Yaqui River Delta. Ecol. Econ. 2008, 65, 155–166. [Google Scholar] [CrossRef]
  85. Phuong, D.; Gopalakrishnan, C. An Application of the Contingent Valuation Method to Estimate the Loss of Value of Water Resources due to Pesticide Contamination: The Case of the Mekong Delta-Vietnam. J. Water Resour. Dev. 2003, 19, 617–633. [Google Scholar] [CrossRef]
  86. Zhongmin, X.; Guodong, C.; Zhinqiang, Z.; Zhiyong, S.; Loomis, J. Applying contingent valuation in China to measure the total economic value of restoring ecosystem services in Ejina region. Ecol. Econ. 2003, 44, 345–358. [Google Scholar] [CrossRef]
  87. Chambers, C.M.; Chambers, P.E.; Whitehead, J.C. Contingent valuation of quasi-public goods: Validity, reliability, and application to valuing a historic site. Public Financ. Rev. 1998, 26, 137–154. [Google Scholar] [CrossRef]
  88. Bateman, I.J.; Day, B.H.; Georgiou, S.; Lake, I. The aggregation of environmental benefit values: Welfare measures, distance decay and total WTP. Ecol. Econ. 2006, 60, 450–460. [Google Scholar] [CrossRef]
  89. Pate, J.; Loomis, J. The effect of distance on willingness to pay values: A case study of wetlands and salmon in California. Ecol. Econ. 1997, 3, 199–207. [Google Scholar] [CrossRef]
  90. Awad, I.; Holländer, R. Applying contingent valuation method to measure the total economic value of domestic water services: A case study in Ramallah Governorate, Palestine. Eur. J. Econ. Financ. Adm. Sci. 2010, 20, 76–93. [Google Scholar]
  91. Torgler, B.; García-Valiñas, M.A. The determinants of individuals’ attitudes towards preventing environmental damage. Ecol. Econ. 2007, 2–3, 536–552. [Google Scholar] [CrossRef]
  92. Shin, H. Identifying the Relationship Between Preservation Values of Environmental Resources. Ph.D. Thesis, Colorado State University, Fort Collins, CO, USA, 1994. [Google Scholar]
  93. Aprahamian, F.; Chanel, O.; Luchini, S. Modeling starting point bias as unobserved heterogeneity in contingent valuation surveys: An application to air pollution. Am. J. Agric. Econ. 2007, 89, 533–547. [Google Scholar] [CrossRef]
  94. Ahlheim, M.; Frör, O.; Lehr, U.; Wagenhals, G.; Wolf, U. Contingent Valuation of Mining Land Reclamation; IAW-Report Heft; Institut für Volkswirtschaftslehre, Universität Hohenheim: Stuttgart, Germany, 2004. [Google Scholar]
  95. Liu, J.-T.; Hammitt, J.K.; Wang, J.-D.; Tsou, M.-W. Valuation of the risk of SARS in Taiwan. Health Econ. 2005, 14, 83–91. [Google Scholar] [CrossRef] [PubMed]
  96. Millennium Ecosystem Assessment (MEA). Ecosystems and Human Well-Being: Synthesis; Island Press: Washington, DC, USA, 2005. [Google Scholar]
Figure 1. The study area, Han River Basin in South Korea.
Sustainability 09 00930 g001
Table 1. Management status of the water use charge.
Items of Expenditure (Unit: KRW Billion)1999–2002200320042005200620072008200920102011201220132014
Waste treatment facility291.49
(45.9)
147.91
(50.9)
117.93
(43.5)
156.03
(48.1)
123.31
(34.6)
136.91
(45.1)
178.21
(42.5)
203.99
(43.2)
192.06
(46.5)
255.29
(58.1)
253.03
(58.1)
170.16
(39.2)
205.85
(45.0)
Land purchase, riparian zone management76.29
(12.0)
26.82
(9.2)
51.67
(19.1)
59.69
(18.4)
116.23
(32.6)
54.69
(18.0)
109.47
(26.1)
132.33
(28.0)
94.19
(22.8)
64.85
(14.8)
61.58
(14.1)
129.44
(29.8)
115.28
(25.2)
Upstream community support198.16
(31.2)
80.80
(27.8)
68.33
(25.2)
72.38
(22.3)
73.24
(20.5)
65.61
(21.6)
77.17
(18.4)
75.48
(16.0)
67.46
(16.3)
66.35
(15.1)
66.15
(15.2)
69.31
(16.0)
69.67
(15.2)
Water quality improvement support65.03
(10.2)
30.76
(10.6)
28.48
(10.5)
30.70
(9.5)
36.79
(10.3)
38.23
(12.6)
45.37
(10.8)
51.81
(11.0)
49.38
(12.0)
41.90
(9.5)
42.98
(9.9)
53.24
(12.3)
51.70
(11.3)
Operating expenses4.40
(0.7)
4.48
(1.5)
4.60
(1.7)
5.40
(1.7)
5.90
(1.6)
6.06
(2.0)
6.62
(1.6)
6.66
(1.4)
6.62
(1.6)
6.94
(1.6)
7.27
(1.7)
7.29
(1.7)
8.05
(1.8)
Total pollutant load management0.00
(0.0)
0.00
(0.0)
0.00
(0.0)
0.00
(0.0)
1.39
(0.4)
2.10
(0.7)
2.35
(0.6)
1.70
(0.4)
3.34
(0.8)
3.89
(0.9)
4.59
(1.0)
4.20
(1.0)
6.65
(1.5) 1
Sum636.46
(100.0)
290.78
(100.0)
271.01
(100.0)
324.20
(100.0)
356.86
(100.0)
303.60
(100.0)
419.19
(100.0)
471.97
(100.0)
413.05
(100.0)
439.22
(100.0)
435.59
(100.0)
433.63
(100.0)
457.21
(100.0)
1 The values in parentheses are the proportions of each expenditure item to total water use charges.
Table 2. The bids proposed and the proportion of acceptance and refusal for each bid in the contingent valuation survey.
Type of Bid Levels (KRW)Type AType BType CType DType E
20% (34)40% (68)60% (102)80% (136)100% (170) 1
Acceptance proportion0.750.520.370.210.23
Refusal proportion0.250.480.630.790.77
1 The values in parentheses are the amounts of money corresponding to each type of bid level (proportion of the standard water use charge). They were provided together for the convenience of respondents choosing a bid proposed.
Table 3. Descriptive statistics of variables used in the WTP (willingness to pay) model.
VariableDefinition of VariableMean ValueStd. Dev.ClassificationProportion (%)
genderGender of respondent (1 = male, 0 = otherwise, dummy variable)0.500.501. Male
2. Female
49.6
50.4
ageAge in years42.4111.471. Less than 30
2. 30 to less than 40
3. 40 to less than 50
4. 50 to less than 60
5. More than 60
19.0
21.4
22.6
32.2
4.8
children1 if respondent resides with children together, 0 = otherwise (dummy variable)0.340.471. No children
2. Residing with children
66.2
33.8
region_d11 if respondent lives in Gyeonggi-do belonging to the midstream area in Han River basin, 0 = otherwise (dummy variable)0.090.291. Gyeonggi_do
2. Seoul
3. Incheon
57.0
33.0
10.0
region_d21 if respondent lives in Seoul belonging to the downstream area in the Han River basin, 0 = otherwise (dummy variable)0.580.49
region_d31 if respondent lives in Incheon belonging to the downstream area in the Han River basin, 0 = otherwise (dummy variable)0.330.47
lowincome_d11 if income of respondent is less than KRW 30 million, 0 = otherwise (dummy variable)0.230.421. Less than 20.0
2. 20.0 to less than 40.0
3. 40.0 to less than 60.0
4. 60.0 to less than 80.0
5. More than 80.0
10.4
29.2
31.2
17.0
12.2
medincome_d21 if income of respondent is between KRW 30 million to less than KRW 50 million, 0 = otherwise (dummy variable)0.330.47
highincome_d31 if income of respondent is more than KRW 50 million, 0 = otherwise (dummy variable)0.440.50
wqpercep (water quality perception)Respondent’s current water quality perception (1 = very bad, 2 = bad, 3 = normal, 4 = good, 5 = very good)2.940.771. Bad
2. Normal
3. Good
27.0
51.4
21.6
experience1 if respondent has directly or indirectly (media) experienced environmental quality changes (turbid water, perish of fish, algal), 0 = otherwise (dummy variable)0.690.461. Experienced
2. Inexperienced
69.2
30.8
Table 4. Variable Parameter estimates of the naïve probit model versus the multivariate probit model.
VariablesModel 1 Naïve ModelModel 2 Multivariate Model
AcceptanceExperienceAcceptance
bid−0.011 ***−0.008 ***
experience0.245 **−1.159 ***
gender−0.0010.220 ***0.108
age−0.0010.0060.001
children0.3730.2810.408 ***
neardistance_d10.308 **0.0120.262
middistance_d2−0.194 **0.020−0.132
fardistance_d3
lowincome_d1
medincome_d2−0.234 ***−0.011−0.201 ***
highincome_d3−0.222 ***−0.052−0.212 ***
wqpercep−0.200 ***0.210 **−0.060
constant1.396 **−0.673 **1.501 ***
ρ 0.825 ***
Log-likelihood−289.400−589.420
Wald test of ρ = 0 x 2 ( 1 )   = 5.894 ***
Observations500500
*** p < 0.01, ** p < 0.05, * p < 0.10.
Table 5. Values and numbers observed on the variability of the WTP derived from Model 1 and Model 2.
Distribution5%25%50%75%95%100%Mean
WTPModel 133.5652.0756.1875.69101.48129.7364.61
Model 212.6152.2153.25126.02165.67185.24 178.47
Observation2510012512510025500
1 Each of the WTP values elicited from Model 1 and Model 2 are presented at 5%, 25%, 50%, 75%, 95%, and 100% in ascending order. The observation is the numbers observed at each range of the percentage levels.
Table 6. Total benefit of the mid- and downstream areas generated by the aquatic biodiversity conservation in the Han River basin.
Administrative DistrictWater Use Charge (Billion KRW/Year)Mean WTP (%)Total Benefit
(KRW/Month/Cubic Meter)(Billion KRW/Year)
Gyeonggi-doMidstream193.9346.1 (78.4)89.40
SeoulDownstream178.5482.31
Incheon51.9423.94
Total424.41 1195.65
1 The total sum of regional water use charges in 2014 was around KRW 443.46 billion. Since we consider the benefits of only three administrative districts, the payments of K-water (KRW 19.06 billion) as a government organization were excluded from the total water use charge.

