Article

Energy Efficiency, Ownership Structure, and Sustainable Development: Evidence from China

1
Business School, University of Shanghai for Science and Technology, Shanghai 200093, China
2
School of Mathematical Sciences, Tongji University, Shanghai 200092, China
*
Author to whom correspondence should be addressed.
Sustainability 2017, 9(6), 912; https://doi.org/10.3390/su9060912
Submission received: 6 March 2017 / Revised: 25 May 2017 / Accepted: 27 May 2017 / Published: 1 June 2017
(This article belongs to the Section Energy Sustainability)

Abstract

:
Low energy efficiency and severe environmental pollution are two growing issues haunting China’s fast economic development. Under China’s current development model, economic growth still heavily depends on massive energy input, which makes energy efficiency one crucial topic in order to secure future sustainable development of China. This paper focuses on the unique energy ownership structure of China, and designs and adopts MATLAB programming for optimization solutions of multi-variable constrained nonlinear functions to obtain results that can better reflect China’s energy efficiency and solutions to sustainable development of China. Using this model, this paper conducts an empirical analysis on the impact of difference energy investment behaviors between China’s state-owned entities and non-state-owned business on China’s Total Factor Energy Efficiency (TFEE) and sustainable development from 2003 to 2014. We find that Beijing and Shanghai represent the highest energy efficiency level in China. However, except for the more developed regions in Eastern China, for other provinces in Northeast China, Central China and Western China, the TFEE of energy investment by state-owned and non-state-owned economies are both quite low compared with the optimal level. Based on the above findings from the empirical study and detailed analysis by region, this paper discusses the possible reasons for China’s low TFEE and provides implications and policy recommendations.

1. Introduction

Since the reform and opening-up in 1978, China has kept a proud and rapid economic growth for almost 40 years, with marvelous GDP increase. However, behind this fast economic growth is the extensive economic growth model with heavy investment and energy input. The dependence on fossil energy has resulted in an expanding heavy chemical industry and energy sector. Especially in the 21st Century, due to the over-dependence on energy consumption and such priority setting of “Economic Development over Environmental Protection” by many local officials in China, the environmental issues in China have become increasingly striking, threatening people’s quality of life and the sustainability of China’s economic development. According to the published statistics by National Bureau of Statistics of China, the investment on environmental pollution control by China in 2015 alone has reached 1.29% of the total GDP of that year (Figure 1) [1].
In terms of total energy production and consumption, in 2015, the total energy production of China was 3.62 billion tons of standard coal equivalent (SCE), while the total energy consumption was 4.30 billion tons of SCE—both have more than doubled since 2003. In terms of energy structure, until 2015, coal has remained the primary energy source of China, accounting for about 64% of China’s primary energy consumption, which is 40% higher than the world average (Figure 2) [2].
This kind of energy structure mainly depending on coal has resulted in large-scale emissions of sulfur dioxide, nitrogen oxide, and smog/dust, which further lead to the infamous pollution of “Smog/Haze”, with main component as the particulate matter whose diameter is less than or equal to 2.5 microns (PM2.5), which that now covers most of China (Figure 3 and Figure 4).
The above data on China’s GDP, energy consumption and air pollution are important for analyzing China’s energy efficiency. However, when studying topics regarding energy efficiency and sustainable development, researchers tend to ignore one important factor: as a socialist country with “unique Chinese characteristics”, China is driven by economic forces with different ownership structures. These economic entities have different investment demands and patterns in the energy industry, and therefore brought distinctly different impacts on China’s energy efficiency and sustainable development. Furthermore, when deepening our analysis to the provincial level, we have discovered large differences in fixed assets investment in the energy industry by state-owned and non-state-owned economies in difference provinces of China (Figure 5).
Therefore, in studies on China’s energy efficiency and sustainable development, “Ownership Structure” is one of the most important factors that we cannot ignore. As the declining of China’s energy stock as well as the production elasticity of energy emerging during the 12th “Five-Year Plan” stage, in order to achieve future sustainable development, we must prioritize “the improvement of energy efficiency and reduction of environmental pollution” as our primary development strategy. Under China’s current economic development model, economic growth still requires large investment of various kinds of energy. Low energy efficiency will definitely result in the exhaustion of energy resources and continuous deterioration of environmental issues. In such development model, what roles did the state-owned and non-state-owned economies play? To protect our environment and achieve sustainable development, how should we guide and regulate the energy investment behaviors by the two economic players? Answers to all these questions could eventually determine the future sustainability of China’s economic development.
Based on other theoretical and empirical studies on energy efficiency and sustainable development, taking China’s unique ownership structure with both state-owned entities and non-state-owned business into consideration, this paper has constructed a comprehensive research model covering energy efficiency, ownership structure and sustainable development. The remainder of this paper is structured as follows. In Section 2, we summarized major research literature regarding energy efficiency, environmental protection and sustainable development. In Section 3, we select the method of “Data Envelope Analysis” (DEA) as well as SBM Model commonly used in this field of study to estimate China’s Total Factor Energy Efficiency (TFEE) in a theoretical manner, and design an “Input–Output” framework for further empirical analysis. In Section 4, with the help of the MATLAB DEA-SBM program designed and created by ourselves, we analyze the different influence of state-owned and non-state-owned economies on China’s TFEE and sustainable development as well as its possible reasons in a quantitative manner based on the above statistics of provincial state-owned and non-state-Owned energy investment in the fixed assets of China, 2003–2014. Section 5 presents the conclusions and policy recommendations.

2. Literature Review

It is commonly believed by researchers that energy efficiency improvement through technology innovation is one crucial way to reduce pollution, protect the environment and achieve sustainable development. By setting up a dynamic simulation model of energy and the environment, Anderson and Cavendish (2001) reached the conclusion that technology has a positive influence on environmental improvement [3]. Birol and Keppler (2000), and Saunders (2000) pointed out that, due to “Rebound Effect”, it is uncertain how much technology advancement and energy efficiency improvements help energy saving and environmental protection [4,5]. Lantz and Feng (2006) used Canadian statistics to analyze the influence of GDP, technology advancement and population growth on energy saving and emission reduction from 1970 to 2000. According to their finding, there is little correlation between GDP and carbon emission, but there is a U-shaped relation between technology improvement and carbon emission [6]. Based on empirical studies on Japan’s data from 1993 to 2003, Honma and Hu (2008) proved that there is an inverted U-shaped relationship between energy efficiency and GDP per capita [7].
Meanwhile, some researchers have also studied the relationship between energy efficiency and economic development by focusing on the causality between energy consumption and economic growth, and its resulting policies. Porter and Linde (1995) raised the important “Porter Hypothesis” [8], pointing out that regulations on the environment (taking necessary environmental protection measures) could quicken the innovation pace of corporates, improve labor productivity thanks to technology enhancement and eventually improve the quality of economic growth. Lanjouw and Mody (1996) used the number of environment related patents as an indicator of the development in environmental protection technology, and proved the positive correlation between environmental protection investment and the advancement in environmental protection technology [9]. Mehrara (2007) used GDP per capita and energy consumption per capita as main variables in empirical studies and discovered the one-way (rather than interactive) causality between economic development and energy consumption [10]. Pao et al. (2014) started from different economic cycles, and concluded that, in the short term, energy consumption has a one-way causality relation with economic growth, while, in the long term, there is an interactive correlation between the two [11]. In terms of China study on energy consumption and economic development, Lin (2003) used co-integration analysis and error correction model and proved the one-way causality between China’s electrical energy consumption and economic growth [12]. Wu et al. (2008) also used panel co-integration analysis and error correction model and discovered that, in the long term, there is an interactive correlation between China’s energy consumption and economic development, while there is no interrelation or causality between the two in the short term [13].
Having noticed the limitation of only using single-factor energy efficiency indicators that do not account for alternative production factors in substitution of energy factors during production, Fried et al. (2002) used DEA Model to fully consider the positive and negative influence of environmental factors to energy efficiency [14]. In addition, based on the DEA Model, Hu and Wang (2006) built an estimation model for Total Factor Energy Efficiency (TFEE) [15], which has been widely recognized among researchers in this field. Based on this estimation model, Sun et al. (2011) used the DEA Model to analyze the energy efficiency of China’s industries, and explained the reason for the U-shape evolution of China’s industrial energy efficiency [16]. Based on the DEA Model using energy factors as inputs, Chen et al. (2012) calculated the regional Total Factor Energy Efficiency (TFEE) of different provinces in China by empirical studies, and analyzed the convergence of different region’s energy efficiency based on their coefficient of variation [17].
In conclusion, the current academic studies on energy efficiency mainly focus on the estimation of Total Factor Energy Efficiency (TFEE) and the convergence of energy efficiency in different regions. However, thus far, there are very few studies focusing on the influence of the unique ownership structure of different investors in China on energy efficiency and sustainable development. For example, although Wang (2014) discusses the problem of energy ownership reform in China, this paper does not carry out quantitative analysis [18]. Therefore, this paper will improve the DEA-SBM Model and design new calculation tools based on ownership structure in order to study the energy efficiency and sustainable development of China.

3. Methodology and Data Source

3.1. Total Factor Energy Efficiency (TFEE) and DEA-SBM Model

This paper will use the DEA-SBM Model to estimate the Total Factor Energy Efficiency (TFEE) of investment by entities with different ownership structures. The DEA (Data Envelope Analysis) Model was first published by Charnes and Cooper (1984) [19] and has now been widely used to evaluate the comparative efficiency of Decision Making Units (DMU) with same types of inputs and outputs. Because the calculation of the DEA Model based on input and output data of DMUs does not require detailed assumptions or constraints on the production function, this model can be widely used in estimation of energy efficiency. For example, Chang (2013) argued that the DEA Model has huge application potential in energy efficiency evaluation [20]. Zhang et al. (2011) also used the DEA Model to study the Total Factor Energy Efficiency (TFEE) of major developing countries around the world from 1980 to 2005 [21].
In addition, Tone (2001) has further constructed the SBM Model in order to overcome the “Slack Issue” of the DEA Model in DMU input factors, which has been commonly accepted in this field [22]. Li and Hu (2012), and Huang Baomin (2015) also adopted the DEA-SBM method to calculate the Total Factor Energy Efficiency (TFEE) of pollutants in order to exclude the influence from environmental factors and stochastic error [23,24].
Based on common input factors used in production functions and focusing on the energy investment behavior of entities under different ownership structures, this paper has selected Labor, Capital, Energy Investment, and Environmental Pollution as the four input factors during production. By using the DEA Model to calculate the optimal energy input on the production possibility frontier of each DMU, the Total Factor Energy Efficiency (TFEE) could be defined as the ratio of the optimal energy input vs. actual energy input. The Total Factor Energy Efficiency (TFEE) of the ith DMU ( D M U i ) at period t ( T F E E i , t ) could be written as:
T F E E i , t = e i , t E i , t
In Equation (1), e i , t is the optimal energy input on the production possibility frontier of D M U i . E i , t is the actual energy input of D M U i at period t.
After clarification on the definition of T F E E i , t , let us look at the DEA-SBM Model. For a Decision Making Unit, the input vector of m production factors by D M U i at period t is written as x i , and it output vector of n products is expressed as y i . Let Input Matrix X and Output Matrix Y be:
X = ( x i j ) R m × s
Y = ( y i j ) R n × s
In Formulas (2) and (3), x i = ( x 1 i , x 2 i , , x m , i ) t and y i = ( y 1 i , y 2 i , , y n , i ) t represent the ith column vector of Input Matrix X and Output Matrix Y respectively, i.e., the ith Decision Making Unit ( D M U i )’s actual input vector and output vector. When both x i and y i are larger than zero, the Input–Output possibility set ( p i ) of D M U i can be written as:
p i = { ( x , y ) | x X λ , y Y λ , λ 0 }
In Formula (4), λ represents the ratio vector of the actual output vs. the optimal output on the production possibility frontier of D M U i . x X λ means that, compared with the optimal input on the production possibility frontier, the actual input is higher. y Y λ means that, compared with the optimal output on the production possibility frontier, the actual output is lower.
Based on the efficiency indicator ρ i of the ith Decision Making Unit ( D M U i ) in the DEA-SBM Model, we have:
min λ ρ i = 1 m j = 1 m r = 1 s x j , r λ r x j , i 1 n j = 1 n r = 1 s y j , r λ r y j , i
  • s t   X λ x i
  •     - Y λ y i
  •     λ 0
This paper has decided to use the fmincon() Function in MATLAB software to calculate the DEA-SBM Model which is usually applied to solution of the optimization problem of multi-variable constrained nonlinear functions. Through multiple test runs, the results from this Model are highly robust with different initial variable values. The calculations have shown good convergence and high accuracy. Therefore, we believe the calculation result from this DEA-SBM Model is the global optimal solution rather than the local optimal solution of an optimization problem.
The efficiency indicator ρ calculated through the optimization formula above ranges between 0 and 1, and monotonically decreases with the increase of “Input Slack” and “Output Slack”. The increase in “Input Slack” means there is waste in input factors, so the efficiency is lower. The increase in “Output Slack” means the output is getting farther away from the optimal output level on the production possibility frontier, and therefore the production efficiency is also lower. When ρ = 1 , which means the “Input Slack” and “Output Slack” are both 0, the input–output level or ratio of this DMU has reached optimization and the highest production efficiency.

3.2. Data and Variables

Based on the provincial statistics data of China from 2003 to 2014, this paper has built a 12-year database for DEA-SBM Model. Similar to common practices in studies on China, our database does not include Tibet, Hong Kong, Macau or Taiwan. We have further divided the provinces into the four economic regions below based on the latest regional standards by National Bureau of Statistics of China in June 2011.
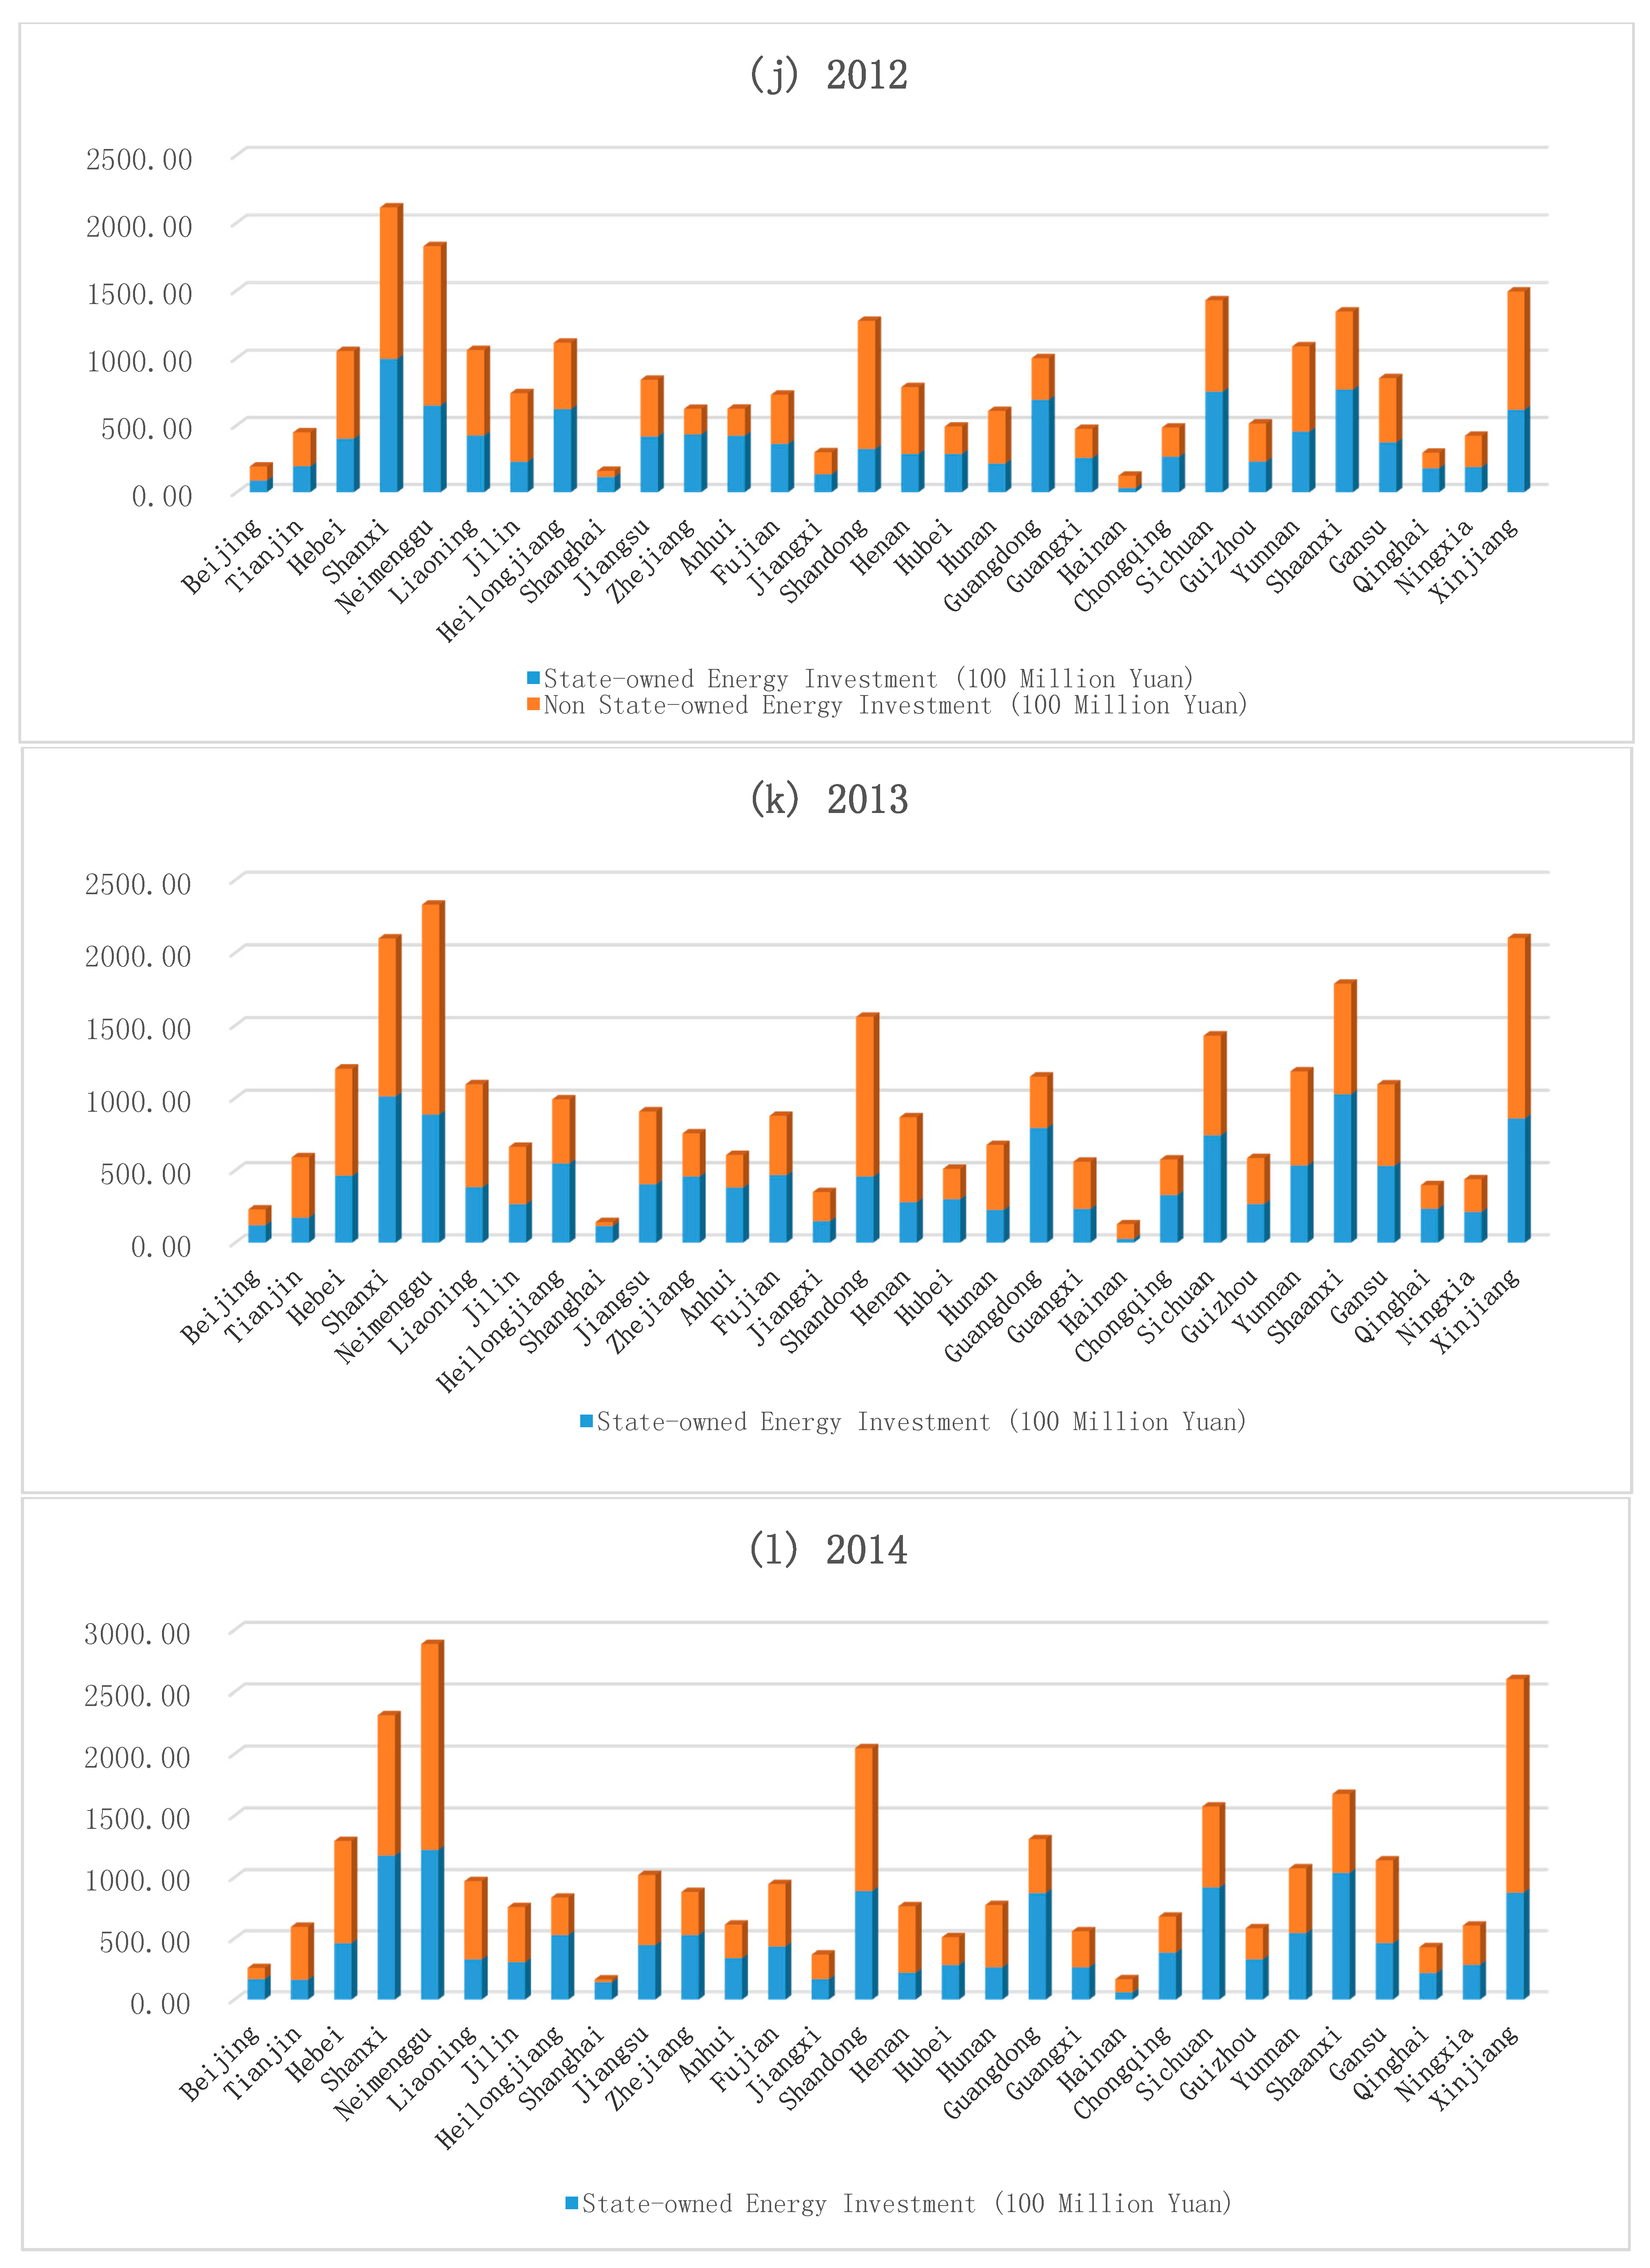
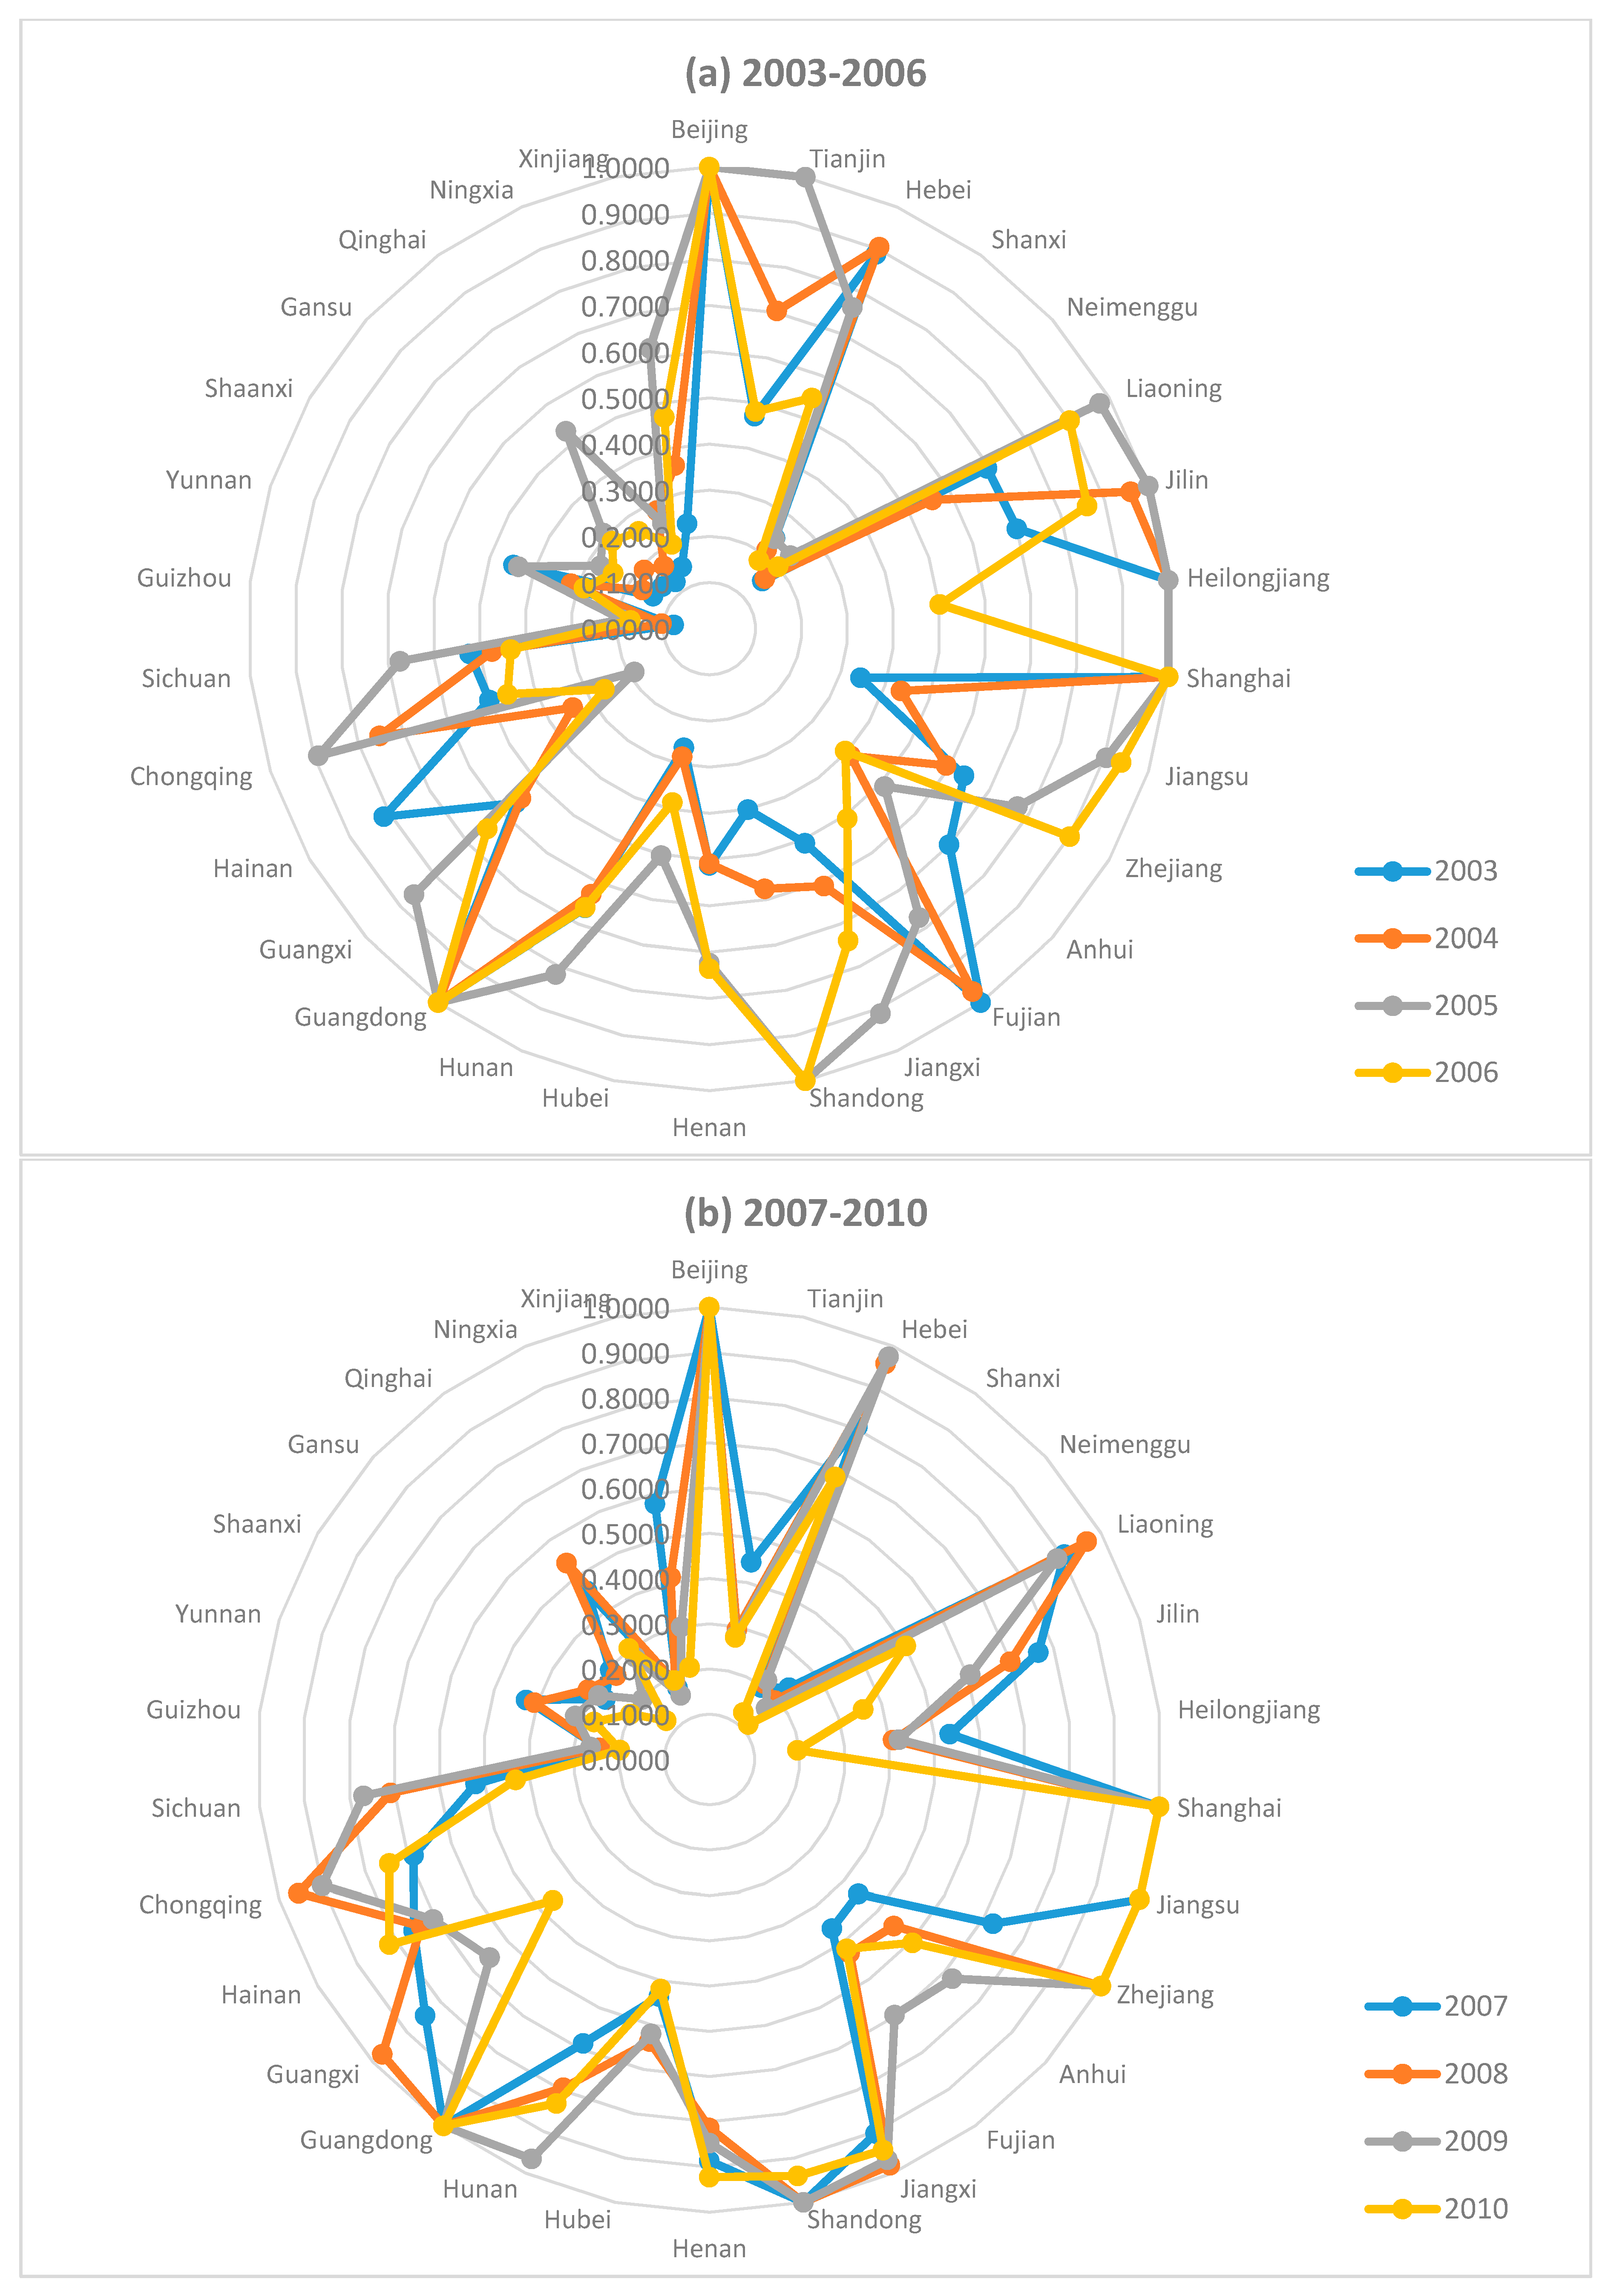
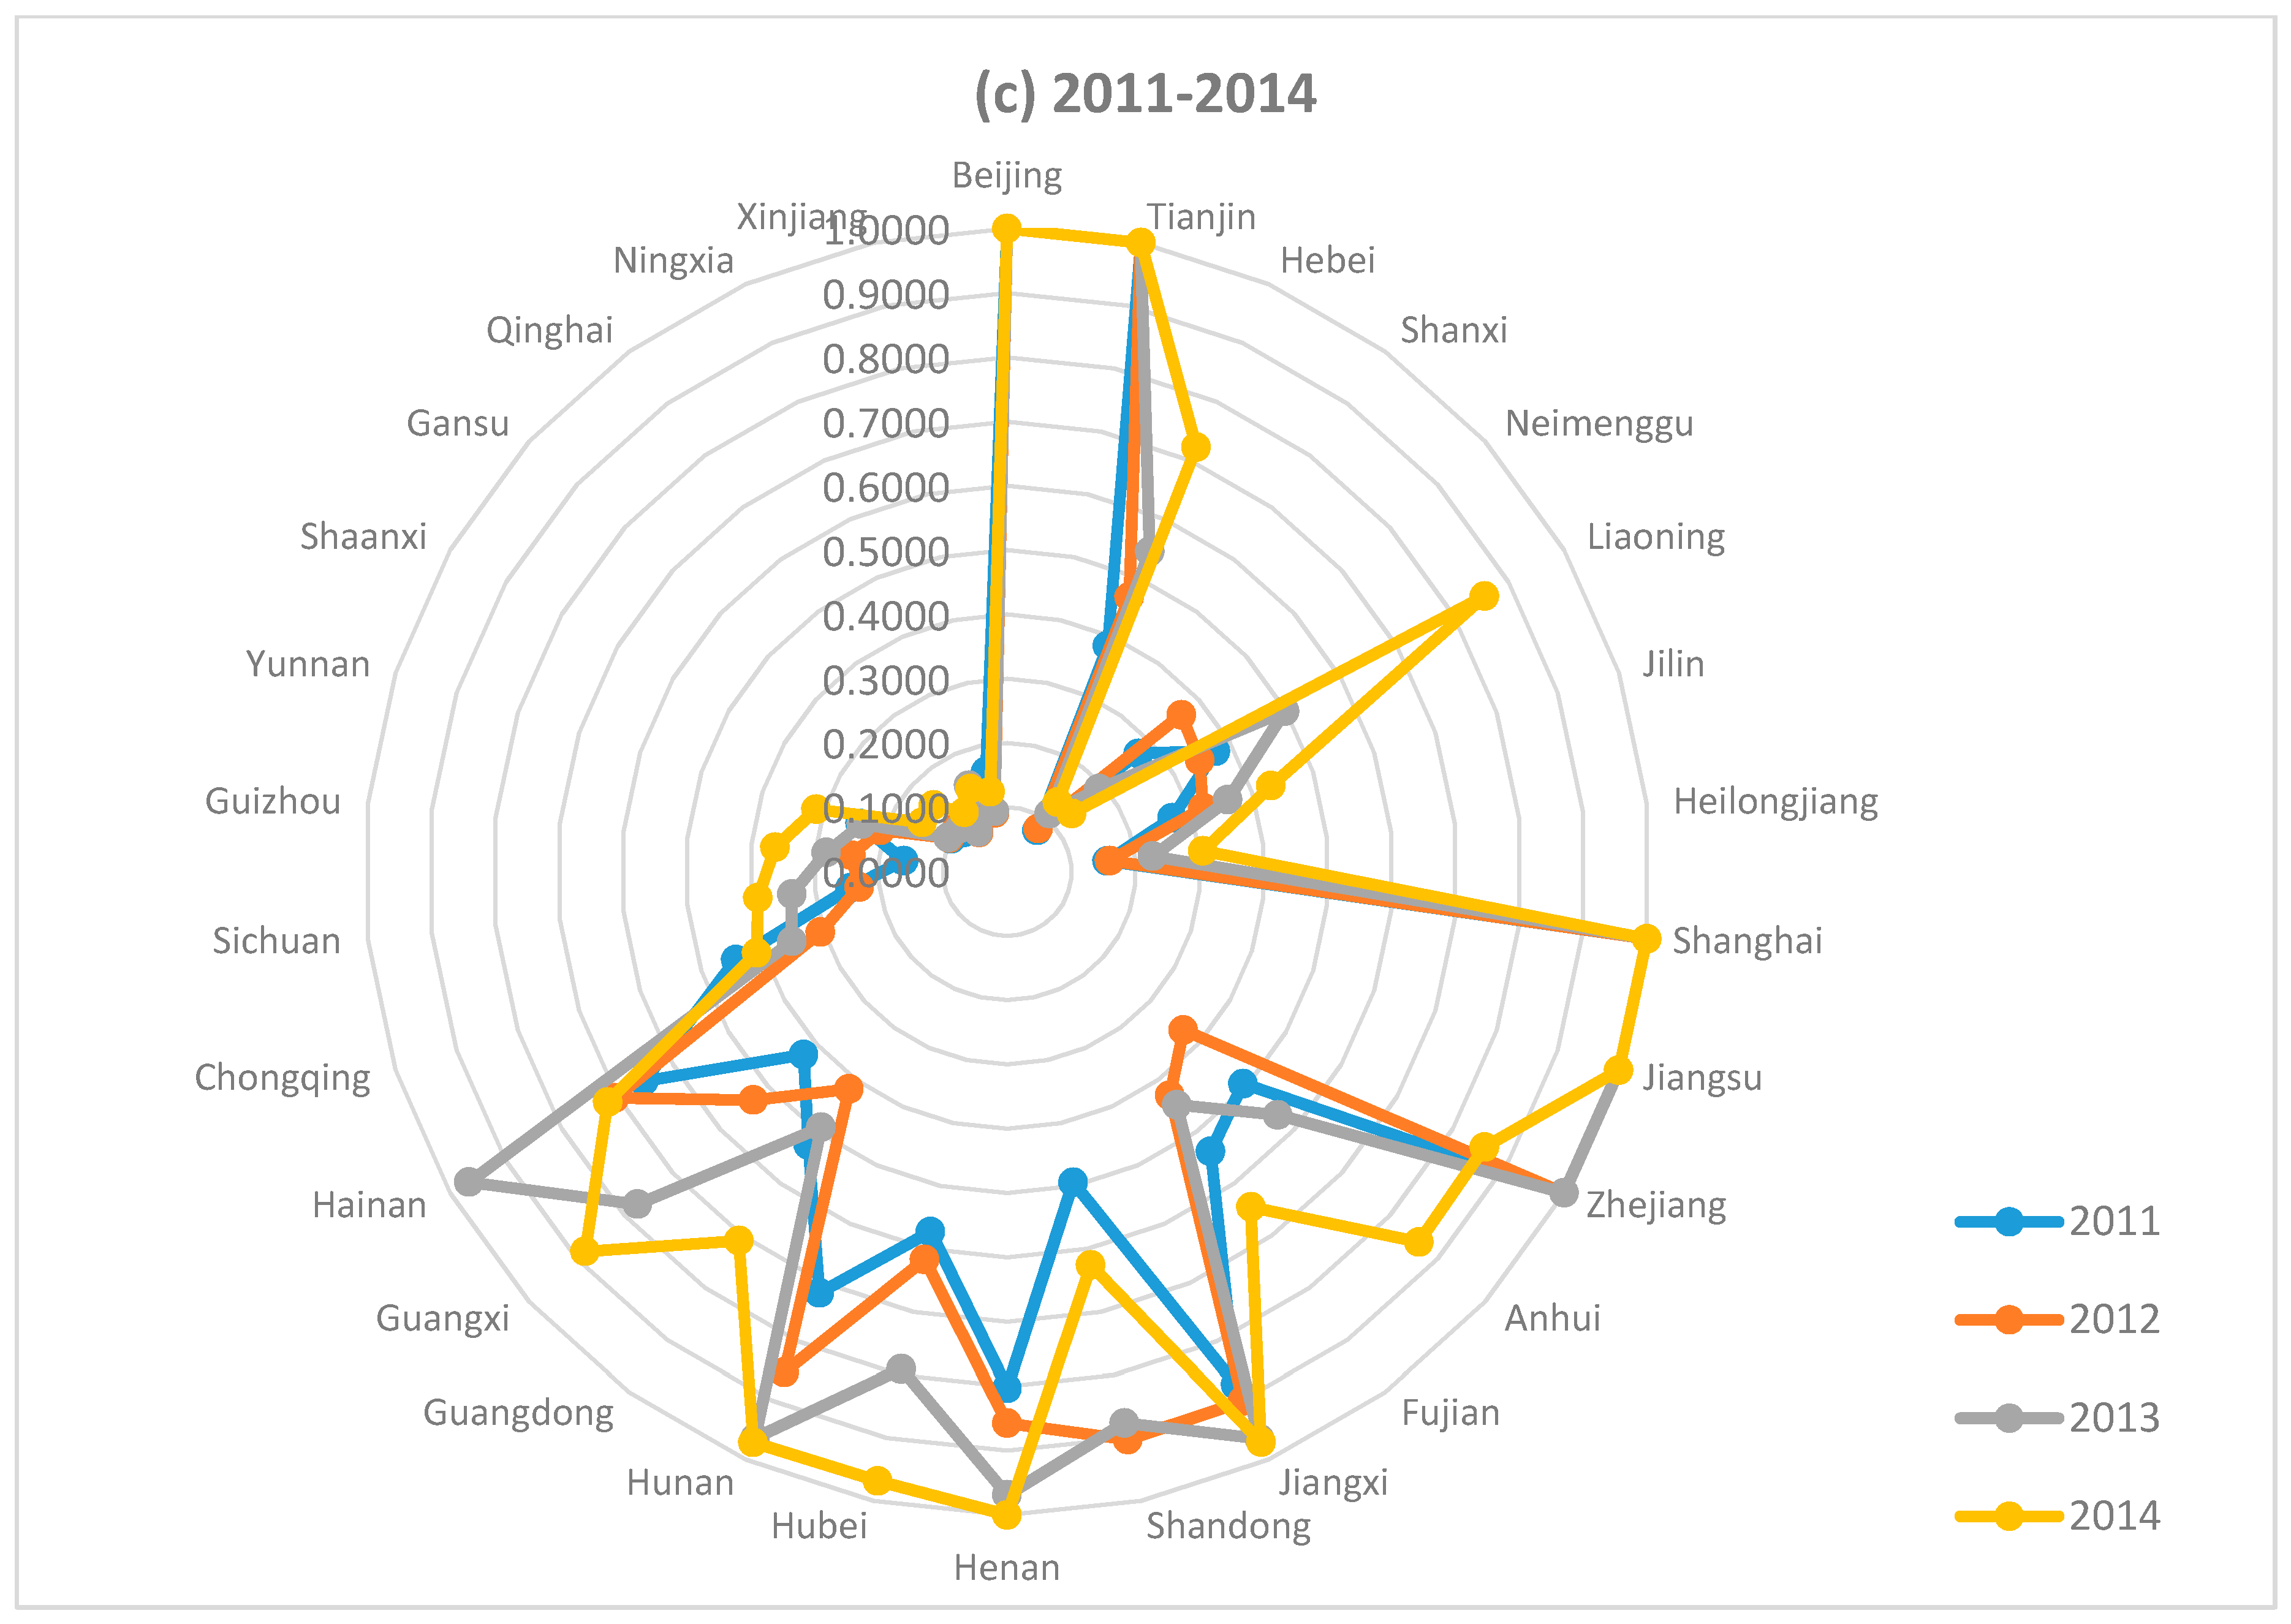
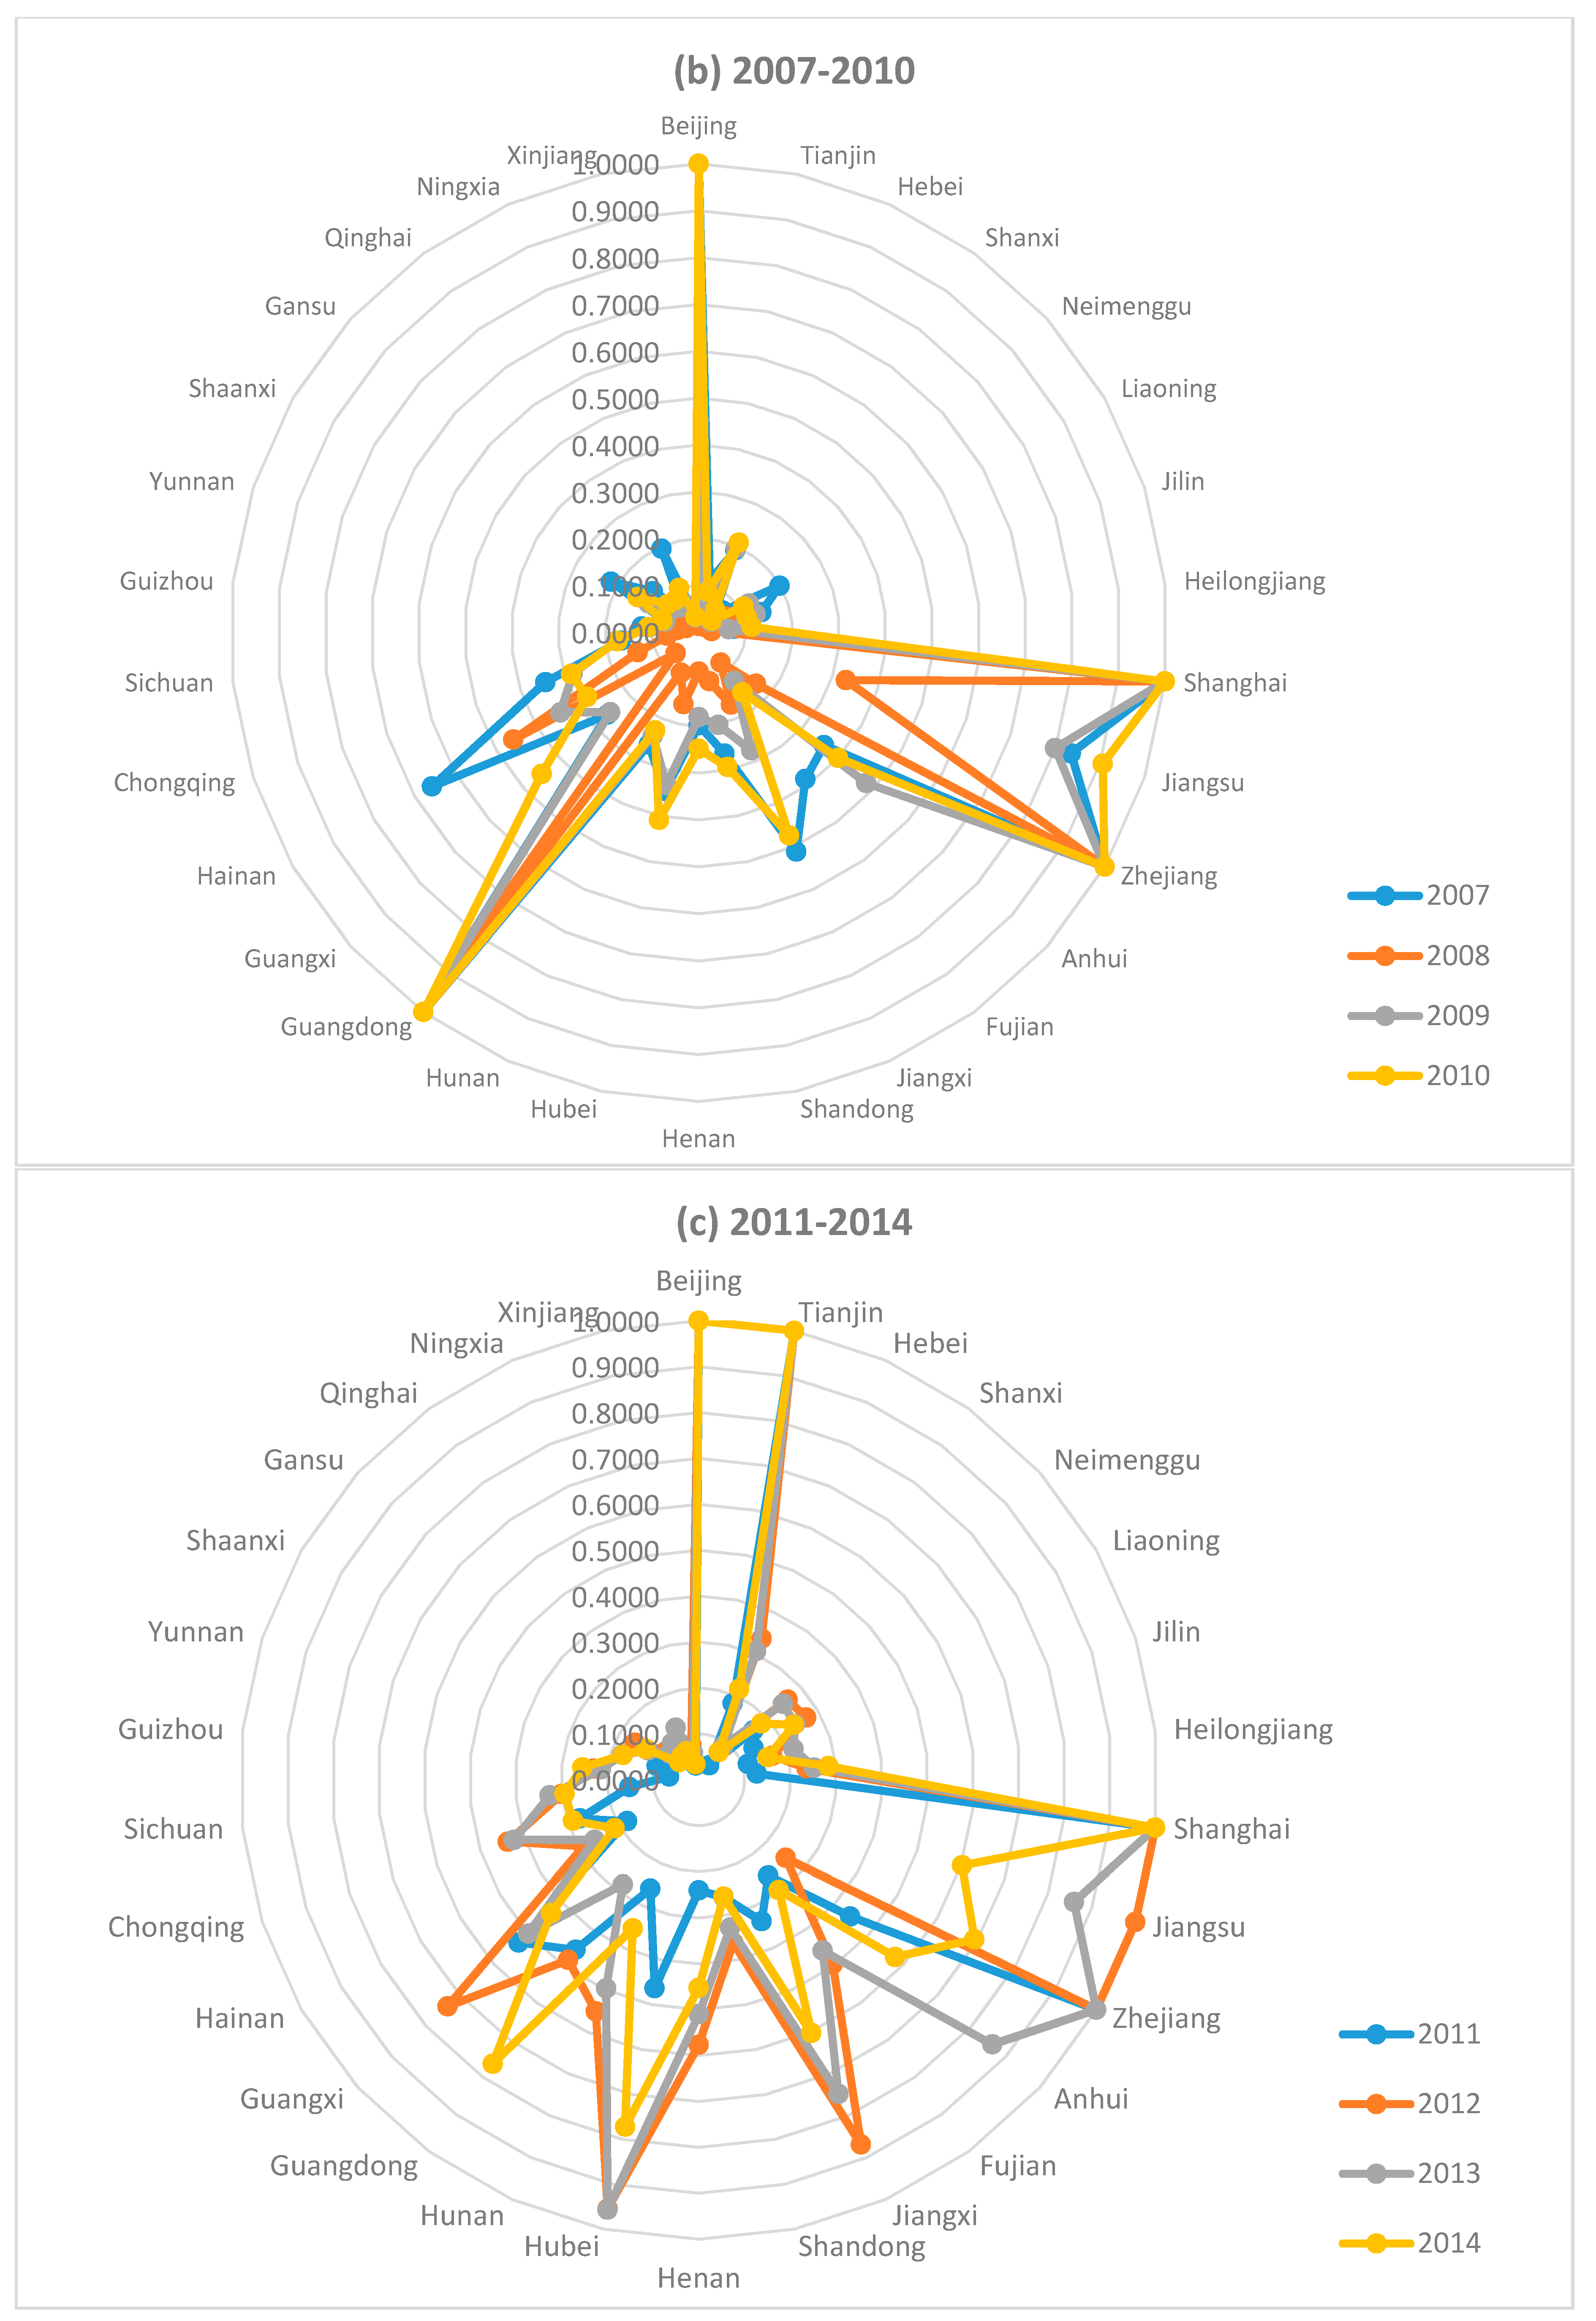
  • Eastern Region: Beijing, Tianjin, Hebei, Shanghai, Jiangsu, Zhejiang, Fujian, Shandong, Guangdong, and Hainan.
  • Northeast Region: Liaoning, Jilin, and Heilongjiang.
  • Central Region: Shanxi, Anhui, Henan, Hubei, Hunan, and Jiangxi.
  • Western Region: Inner Mongolia, Guangxi, Chongqing, Sichuan, Guizhou, Yunnan, Shaanxi, Gansu, Qinghai, Ningxia, and Xinjiang.
The input variables selected in this DEA-SBM Model are the four factors below:
(1) Labor: The total number of employed population in each province each year. The data come from the Statistical Yearbook of each province from 2003 to 2014.
(2) Capital: Considering the data requirements of SBM Model, similar to the common practice of other researchers, this paper has used the “capital stock from annual fixed assets investment by each province of China” as the “Capital” indicator in our model. Because neither “China Statistical Yearbook” nor the Provincial Statistical Yearbooks have provided these data directly, this paper has adopted the commonly used “Perpetual Inventory” accounting method to estimate the Capital Stock from Fixed Assets Investment of each province in each year: K n , t .
K n , t = K n , t 1 + I n , t D n , t = ( 1 d n ) K n , t 1 + I n , t
In Formula (6), K n , t 1 means the capital stock from last year’s fixed assets investment by certain province; I n , t is the additional fixed assets investment in current year by that province; d n is the depreciation rate of fixed assets in that province. Based on the estimation method of Capital Stock by Hall and Jones (1999) [25], the capital stock from fixed assets investment by that province in last year should be:
K n , t 1 = I n , t 1 k n + d n
In Formula (7), I n , t 1 means the additional fixed assets investment in last year by that province; k n is the growth rate of fixed assets investment by that province. To generalize the estimation, we used the geometric method to calculate the average growth rate of fixed assets investment k n in an m-year period:
k n = I n , m I n , 0 m 1
Data of above variables can be obtained directly from “China Statistical Yearbook” and the Statistical Yearbook of each province from 2003 to 2014. Therefore, using Formulas (6)–(8), we can get the amount of capital stock invested by each province of China annually. In actual computation, we have adjusted the “Fixed Assets Investment” amount of each year based on the “Price Indices of Investment in Fixed Assets” (PIIFA) with year 2003 being the base period.
(3) Fixed Assets Investment in Energy Industry by Economies with Different Ownership Structures: To study the impact of ownership structure on China’s TFEE, unlike previous literature, this paper did not choose energy consumption as the input factor of energy. Instead, this study picked the annual fixed asset investment by state-owned and non-state-owned economies in the energy industry across different provinces in Mainland China as the input factor of energy in our SBM Model. According to the statistical standard of the National Bureau of Statistics of China, the state-owned enterprises are controlled by the Chinese central government or local governments (holding more than 50%). The decision-making and behavior of those enterprises are determined by the will and interests of the government. On the other hand, non-state-owned enterprises refer to companies with less than 50% of the government’s holdings. Their decisions are less influenced by the will and interests of the government. Their business goal is to pursue maximum profits. By choosing this indicator, we can directly analyze the different impact of the energy investment by entities with different ownership structures on TFEE. By using the same statistic scope and indicator dimension, we can also compare the difference in the energy efficiency and sustainability of state-owned and non-state-owned economies. Our data of fixed asset investment by state-owned and non-state-owned economies in the energy industry come from the official data released by the National Bureau of Statistics of China.
(4) Undesirable Output as an Input Factor: In the case of undesirable outputs, some literature has treated it as Input Factors, which is reasonable under the framework of DEA-SBM Model because the production possibility frontier as a benchmark in the model requires the maximization of output under minimum input. Such as the example of environmental pollution, the maximization of such undesirable outputs would be contrary to common sense. Therefore, we follow the common practice of treating undesirable outputs as input factors in our SBM Model. Similar examples with undesirable output include Reinhard (2000), Färe and Grosskopf (2010), and Chen (2014) [26,27,28]. In our model, we have collected the data of annual emission of waste water and waste gas of different provinces officially published by the National Bureau of Statistics of China as the data for undesirable outputs. Because, from 2011, National Bureau of Statistics of China changed the former data release of total emission of waste gas to the categorized data of emissions of sulfur dioxide, nitrogen oxides, and smoke and dust, this paper used the total emission data from 2003 to 2010; for year 2011 to 2014, we used the total of all three categories of air pollution combined.
The output variables selected in this DEA-SBM Model are the three below:
(1) Annual Gross Regional Domestic Product (Annual Regional GDP): This variable comes from the official data annually published by the National Bureau of Statistics of China. In this paper, we used the GDP deflator to adjust the regional GDP amount for each province.
(2) General Budget Revenue of Local Government: This indicator includes both tax income and non-tax income of each province every year, which is an important indicator of the fiscal income of a regional government (lease refer to Xu and Qiao (2012), Field et al. (2014), and Wang (2016) [29,30,31]). Because this paper focuses on the different impacts from entities with different ownership structures on energy investment, including the factor of fiscal income as an output factor into our model is also very important. Same as the last variable, we have used a deflator to adjust these data.
(3) The Number of Patents Authorized in China: similar to other studies, this paper has chosen the number of patents as an indicator for technology advancement, which includes the total number of patent for inventions, patent for utility models, and patent for design certified in each province each year, representing the technology output level of that region (please refer to Zhu and Xu (2003), Hu et al. (2012), Ma et al. (2013), Xu (2016), and Hou et al. (2016) [32,33,34,35,36]). According to the official statistics of National Bureau of Statistics of China, this paper has used the “total number of patents certified” instead of “total number of patent application submitted” as each province’s technology output because the latter only represents the number of patent applications accepted by State Intellectual Property Office of China, not the actual number of patents granted and certified.

3.3. Calculation Methodology

Before we adopted MATLAB programming for DEA calculation (Please refer to Appendix A), we had already tried almost all the DEA software available, such as DEAP, DEA-Solver, etc. We found small difference and inconsistency in the calculation results by different software. Since none of these software programs provides explicit calculation logic, which only shows calculation results based on DMU input and output data, it is difficult for us to determine the optimal DEA software for our research topic. To pursue originality in our research and high calculation accuracy, we designed and developed our own MATLAB programming to achieve the results. This MATLAB programming based on the DEA-SBM Model in order to improve our assessment result by determining whether each DMU can achieve optimal efficiency and measuring the impact of ownership structure on Total Factor Energy Efficiency (TFEE) and sustainable development in each DMU.

4. Results and Discussion

By using the DEA-SBM Model and the innovative MATLAB programming we designed for this study, we obtained the Total Factor Energy Efficiency (TFEE) of energy investment by economies with different ownership structure in different provinces of China from 2003 to 2014 based on the input and output variables listed in Section 3.2, as shown in Table 1 and Table 2.
As shown in Table 1 and Table 2, this paper has obtained a new and more accurate Total Factor Energy Efficiency (TFEE) result of each province in China after introducing the energy investment variable based on different ownership structures and using the innovative MATLAB assessment programming. Figure 6 and Figure 7 present some important findings and conclusions of this study.
(1) Except for the more developed regions in Eastern China, for other provinces in Northeast China, Central China and Western China, the TFEE of energy investment by state-owned and non-state-owned economies are both quite low compared with the optimal level of 1. Even for the eastern provinces with the most developed economy in China, after entering the 12th “Five Year Plan” stage of economy development (2011–2015), their TFEE also suffered certain deterioration. (The full name of the Five-Year Plan is the Five-Year Plan for the Development of National Economy and Society of PRC, which serves as an integral part of China’s overall national economy planning. This Five-Year Plan mainly focuses on making proper planning for major national projects, enhancement of national productivity, and management of important structural ratios in national economy, as well as setting goals and directions for future development of China’s national economy. The study period on China’s TFEE in this study covers the end of the 10th Five-Year Plan stage to the 12th Five-Year Plan stage. Considering that the Five-Year Plan could better represent the major stages of China’s economy development, and better reflect the change patterns in China’s TFEE, the analysis in this paper is mainly based on the timeline according to the Five-Year Plan stages set by the government.) One example is Guangdong Province, whose TFEE of energy investment by state-owned and non-state-owned economies has shown a sharp decrease from the optimal efficiency level of 1 from 2011 to 2014, and only risen up a little in 2014. The main reason behind is the fast increase of pollution (i.e., the undesirable output) of Guangdong Province during the 12th “Five Year Plan” stage. Take Guangdong Province’s waste water emission as an example, this number increased by 16.81% during the 11th Five-Year Plan stage (2006–2010), but has further increased by 25.19% from 2010 to 2014. This evidence shows that, although Guangdong Province has achieved a comparatively rapid investment growth and economy development during the 12th “Five Year Plan” stage, it still faces tough challenges in terms of environmental protection and sustainable development. The same trend also happened in the TFEE of state-owned economies in Zhejiang Province in 2014, and the TFEE of non-state-owned economies in Jiangsu Province in 2013 and 2014. As developed provinces in Eastern China with strong economic growth, the two provinces have suffered large increase in undesirable output such as pollution during the 12th Five-Year Plan stage. Behind the decrease in TFEE lie the ever-growing challenges in environmental protection and sustainable development in China’s future.
(2) As the most developed provinces/cities in China with strict environmental regulation, Beijing and Shanghai have kept an optimal TFEE record of 1 through the study periods, which represents the highest energy efficiency level in China. However, in future development stages towards sustainable development, we must recognize the fact that: First, although Beijing and Shanghai are municipalities directly under the central government, they are still only cities, with scales much smaller than real provinces and administrative or economy management less difficult compared with other provinces. Second, the undesirable outcomes of these two cities have also been increasing since 2013. Due to data limitation, we were unable to conduct comparative analysis on air pollution of different provinces in China over a long period of time, but, based on the “Smog/Haze” pollution of China reflected in Figure 3 as well as the environmental protection achievements by China in recent years, these two cities still need to make great efforts to keep the optimal TFEE of 1.
(3) In terms of eastern provinces with weaker economy development, also as a municipality directly under the central government, Tianjin has seen rapid improvement in the TFEE of energy investment by state-owned and non-state-owned economies during the 12th Five-Year Plan stage, giving us more expectations over its performance during the 13th Five-Year Plan stage. In 2004, the department with the most authority in economic administration within the Chinese government, the National Development and Reform Commission, organized a series of meetings for the Heads of Beijing, Tianjin and Hebei to reach the so-called “Langfang Consensus” regarding the fundamental topics in the economic integration of these three regions. Thanks to their unique geographic location and administrative status as municipality directly under the central government, Tianjin and Beijing have always been working closely together on economic development, resource utilization and environmental protection, with closer cooperation and faster integration compared with that of Hebei. In terms of the improvement in TFEE of Tianjin and Hebei, it is more reflected in the energy investment by state-owned economies, which also reflected the influence of national strategy and polices on TFEE improvement and sustainable development of China.
(4) In the beginning year of the 12th Five-Year Plan stage (2011), the National Bureau of Statistics of China started to evaluate and consolidate the data of the three provinces in Northeast China as an independent economic zone. On the one hand, this action showed the importance of the three provinces in Northeast China in terms of national strategy. On the other hand, this also indicated the huge challenges in sustainable development for those three provinces. Compared with the TFEE during the 11th Five-Year Plan stage and by the end of the 10th Five-Year Plan stage, the TFEE of the three northeast provinces during the 12th Five-Year Plan stage is in a clear declining trend. For example, the TFEE of state-owned economies in Heilongjiang Province in 2014 was only 30.61% of its TFEE in 2003, while the TFEE of state-owned economies in Jilin Province in 2014 was only 61.58% of its TFEE in 2003. Although the TFEE of state-owned economies in Liaoning Province in 2014 is higher than its TFEE in 2003, its 2014 figure is still 11.05% lower than its peak TFEE level in 2008 during the study period. In terms of the TFEE of non-state-owned economies, the case is even worse. As traditional bases for heavy industries, the three northeast provinces have a very weak non-state-owned economy and low-active private investment. In terms of energy efficiency, the TFEE of non-state-owned economies in Heilongjiang Province in 2014 was only 28.39% of its TFEE in 2003, while the TFEE of Jilin and Liaoning Province in 2014 have also decreased compared with the TFEE level in 2003 and the 11th Five-Year Plan stage. Considering the fact that, since 2003, China’s central government including our State Department and the Central Committee has been emphasizing the strategy of “Revitalizing the Northeast China” [37,38,39], this clearly indicates the weak momentum in TFEE improvement in those three northeast provinces as well as huge challenges in terms of sustainable development.
(5) The Central parts of China are usually characterized by slow economic development. However, in terms of TFEE development, except for very few provinces, the TFEE of energy investment by state-owned and non-state-owned economies in central provinces of China both witnessed a steady improvement trend. In terms of TFEE of state-owned economies, there is an outstanding improvement in Hubei and Jiangxi Provinces, with TFEE increasing by 237.56% and 602.56% from 2003 to 2014, respectively. However, the TFEE of Hunan Province has experienced a 36.67% decrease in the same period. In terms of TFEE of non-state-owned economies, there is an obvious efficiency improvement trend in Anhui, Henan, Hubei, Hunan and Jiangxi Provinces, with their TFEE achieving or approaching the optimal level of 1 in 2014. However, the only exception was Shanxi Province, whose TFEE of both state-owned and non-state-owned economies are very low. During the study period, the highest TFEE of state-owned economies in Shanxi was 0.0927 in 2013, while the highest TFEE of non-state-owned economies was 0.2424 in 2003, which has been declining ever since. Moreover, the TFEE of non-state-owned economies has shown a 45.01% decrease in 2014 compared with 2003. Because Shanxi Province is a typical province in China with heavy energy investment and output, we did a detailed analysis on this province by focusing on its major energy source: coal in order to study the implications of this province to the improvement of TFEE and sustainable development of China.
Since 2002, with the rising price of coal, as the top production base of coal, Shanxi has become a major region for coal investment and production with both state-owned and non-state-owned economies. In 2003, the energy investments of state-owned and non-state-owned economies in Shanxi Province totaled 12.04 and 18.42 billion RMB, respectively. These spiked to 26.34 and 33.94 billion RMB, respectively, by the end of the 10th Five-Year Plan stage (i.e., 2005), achieving an increase rate of 118.68% and 84.22%, with business of various scale and different ownership structure blooming everywhere in that Province [40].
In 2008, in order to resolve the issues in coal industry development such as large number of coal business with small scale, scattered location and low technology level, the local government of Shanxi Province decided to take advantage of the market competition pressure partly resulted from the financial crisis, and launched a program for resource integration and industry restructuring for the coal industry with the government and large companies taking the lead and market economy working as the elimination mechanism [41]. The following March, this integration program was actually put into action. First, the parties involved in mergers or acquisitions need to find a certified entity to evaluate all the energy resource and assets such as coalmines under each company. Then, the parties involved will register a new subsidiary as an independent legal entity through means of merger, acquisition, coordinated restructuring, shareholding, etc. The new subsidiary will be a limited liability company, with the dominant party holding no less than 51% of the equity, and all the other parties combined owning no more than 49% of the equity. The dominant parties, picked by the local government, and took charge of the daily operation of such new subsidiary under market economy discipline. Those luckily picked to be the dominant parties in this coal industry integration program were the seven major state-owned coal companies in Shanxi Province, including the five coal companies directly controlled by the provincial government, Shanxi Coal Transportation & Distribution Group, and Shanxi Coal Import & Export Group. This coal industry integration program has lasted until March 2012.
In the beginning year of this coal industry integration program (i.e., 2008), the energy investment amount by state-owned economies in Shanxi was 53.81 billion RMB in total, exceeding the 48.51 billion RMB of energy investment by non-state-owned economies in the same period. Meanwhile, the TFEE of Shanxi’s state-owned economies was 0.2076 in 2008, which increased by 5.86% compared with 2007. However, the TFEE of non-state-owned economies has dropped sharply from 0.0655 in 2007 to 0.0250 in 2008 with a decreased rate of 61.83%. Since then, except for a 4.48% increase in 2009, the TFEE of Shanxi’s state-owned economies has been declining all the way to 0.0789 until the end of this industry integration program (i.e., 2011), which was almost the lowest level throughout the entire period, and 59.77% lower compared with the TFEE at the beginning of this industry integration program (i.e., 2007). At the same time, the TFEE of non-state-owned economies in Shanxi has decreased by 40.46% from 2007 to 2011.
Together with the deterioration of TFEE by both state-owned and non-state-owned economies, are the massive losses of the seven major coal companies after this coal industry integration program. In the first half of 2014, the total net profit of these seven major coal companies combined was −1.35 billion RMB, with climbing financing cost and financial expenses. In the first quarter of 2014, the total financial expenses of these seven major coal companies combined has reached 6.77 billion RMB, which increased by 13.42% compared with the year before. According to scholars who disagree with this industry integration program, what the Shanxi local government has actually done is driving out private economy in the name of safety; this coal industry restructuring and integration program is a typical example of retroversion of the market economy reform which resulted in the imbalance in economy structure and serious “Institutional Deficit” in Shanxi Province [42,43].
(6) The western provinces are the least developed regions in China, with lower TFEE compared with other regions and the TFEE of state-owned economies higher than that of non-state-owned economies. It is worth noting that, for the 11 western provinces of China, the TFEE of non-state-owned economies in 2014 have all improved from that of 2003, while there are only four provinces (Guangxi, Guizhou, Shaanxi, and Gansu) that have seen improvement in TFEE of state-owned economies from 2003 to 2014. This finding has proven the huge potential in improvement of TFEE by non-state-owned economies in western provinces. If proper policies are issued and implemented to facilitate the energy investment by non-state-owned economies, this would greatly benefit the sustainable development of the western provinces in China.
In other words, except for highly developed provinces/cities in China (i.e., Beijing, Shanghai, etc.), there is still huge room for improvement in TFEE, especially for Central and Western China as well as the energy investment by non-state-owned economies. The main reasons for the low TFEE, especially the low TFEE of non-state-owned economies in China are:
First, as a socialist country transitioning from the planned economy, China has maintained the dominant position of state-owned economies in its national economy. Although, since the reform and opening-up in 1978, China has seen a booming of non-state-owned economies, the example of Coal Industry Integration Program by Shanxi local government shows that, even in the 21st Century, the state-owned economies still hold a dominant position in China’s energy industry, with more weight in government decision-making, more favorable policy protection and more resources at their disposal. Considering this fact above, it is necessary to study energy efficiency by different ownership nature (i.e., state-owned and non-state-owned). In addition, it is crucial for China to make every effort to improve the TFEE of energy investment by non-state-owned economies. Only in this way can China achieve sustainable in future development stages given the mixed economy with both state-owned and non-state-owned economies.
Second, the rapid economic growth of China since the reform and opening-up has been supported by massive energy input. Local governments tend to see GDP growth as the only goal and measurement of economic development, while ignored the importance of energy efficiency improvement. Total Factor Energy Efficiency (TFEE) is the ratio of optimal energy input over the actual energy input. If our economic development and GDP growth are solely based on energy factor input while ignoring energy efficiency, it will not only severely harm our TFEE, but also weaken China’s future sustainable development.
Therefore, during the 13th Five-Year Plan stage as well as future economic development stage, China must further optimize energy consumption, control undesirable output such as pollution, make every effort to improve Total Factor Energy Efficiency (TFEE), and better utilize the contribution of non-state-owned economies in energy efficiency optimization. In this case, the Central Government must work closely with the local governments to continuously deepen economic reform, facilitate the transition and upgrade of industrial structures, and change the economic development model relying on production factor input (i.e., high output combined with heavy energy consumption and heavy pollution) to a new development model based on production efficiency (i.e., high output combined with low energy consumption and light pollution), achieving sustainable development through technology innovation and enhancement of energy efficiency.

5. Conclusions

This paper has conducted both theoretical and empirical study on the Total Factor Energy Efficiency (TFEE) of energy investment by both state-owned and non-state-owned economies in China from 2003 to 2014, with the purpose to illuminate the energy efficiency and sustainable development issue of China from a fresh perspective. By taking the different ownership structures of energy investment entities into our model, we have widened and deepened the study on China’s energy efficiency and sustainable development as considering our country’s fact as a “socialist market economy” with Chinese characteristics as well as improved previous studies that left this factor out. Moreover, this study has designed and adopted a new MATLAB programming based on the DEA-SBM Model to make our assessment results more accurate as well as improve and extend the functions of the original DEA Model.
Based on the innovative study methodology and techniques above, we have reached the following conclusions: with the continuous economic development of China, the energy investment by our state-owned and non-state-owned economies have both been increasing, but the Total Factor Energy Efficiency (TFEE) of such investment is far from optimal. Except for a few most developed cities such as Beijing and Shanghai, most provinces of China, especially those in Central and Western China, the TFEE of non-state-owned economies are far from the optimal efficiency level of 1. There is still a large gap in TFEE between different regions of China (i.e., Eastern Region, Central Region, Northeast Region and Western Region).
Based on the conclusions above, we here provide a few policy recommendations for improvement of energy efficiency and better achievement of sustainable development:
(1) Make energy efficiency enhancement and environmental protection China’s top strategy towards sustainable development. Ensure the sustainability of our economic development by improving energy efficiency, saving our energy resource and controlling undesirable outputs (i.e., pollution). Currently, the problem of blind and massive energy investment still widely exists in various provinces. Therefore, our central government must include energy efficiency improvement into our strategic goals and national policy, coordinate the energy resource input by different provinces and have comprehensive oversight on energy efficiency improvements across the country.
(2) Make efforts to improve the energy efficiency of non-state-owned economies while maintaining the TFEE of investments by state-owned economies. Despite the fact that, since China’s reform and opening-up, our private sector has been growing with more economic activities and more energy investment, it is still an urgent matter to improve the energy efficiency of non-state-owned economies in China, especially those in the Central and Western Regions to achieve sustainable development.
(3) Enhance cooperation and experience exchange on energy consumption and efficiency between and within different provinces. Because of the huge gap in energy efficiency between different regions and provinces of China, it is more important for different provinces to carry out discussion and collaboration on energy efficiency improvement. Each province should encourage and organize experience exchanges between companies with higher energy efficiency and those with lower energy efficiency to facilitate the TFEE enhancement of both state-owned and non-state-owned economies in that province.

Acknowledgments

The second author was financially supported by the National Natural Science Foundation of China (Grant No. 11501418) and the Shanghai Sailing Program (15YF1412500).

Author Contributions

Weixin Yang organized the whole research,o collected original data, and analyzed the data and background materials. As the correspondence author, Lingguang Li performed calculations, designed the methodology and MATLAB program, and provided the final figures. Both authors carefully read and approve the final manuscript.

Conflicts of Interest

The authors declare no conflict of interest.

Appendix A

MATLAB codes used for calculating TFEE of Provincial State-Owned and Non-State-Owned Energy Investment in China.
function DEASBM = DEA(x)
clc
clear
global s;
global m;
global n;
global X;
global Y;
global i;
Xp = [];
Yp = [];
G =;
X = Xp’;
Y = Yp’;
[m,s] = size(X);
[n,s] = size(Y);
A = [X;-Y];
r0 = zeros(s,1);
R = zeros(s,s);
fval = zeros(s,1);
Theta = zeros(s,1);
for i = 1:s
  [R(:,i),fval(i)] = fmincon(@Efficiency,r0,A,A(:,i),[],[],zeros(s,1),[]);
  Theta(i) = (X(g,:)*R(:,i))/X(g,i);
End
Theta
function P = Efficiency(r)
  global m;
  global n;
  global X;
  global Y;
  global i;
  Input = 0; Output = 0;
  for j = 1:m
   Input = Input + (X(j,:)*r)/X(j,i);
  end
  for j = 1:n
   Output = Output + (Y(j,:)*r)/Y(j,i);
  end
  P = (n*Input)/(m*Output);

References

  1. State Statistical Bureau of China. China Economic Census Yearbook; China Statistic Press: Beijing, China, 2000–2015.
  2. State Statistical Bureau of China. China Economic Census Yearbook; China Statistic Press: Beijing, China, 2004–2015.
  3. Anderson, D.; Cavendish, W. Dynamic Simulation and Environmental Policy Analysis: Beyond Comparative Statics and the Environmental Kuznets Curve. Oxf. Econ. Pap. 2001, 53, 721–746. [Google Scholar] [CrossRef]
  4. Birol, F.; Keppler, J.H. Prices, technology development and the rebound effect. Energy Policy 2000, 28, 457–469. [Google Scholar] [CrossRef]
  5. Saunders, H.D. Does predicted rebound depend on distinguishing between energy and energy services? Energy Policy 2000, 28, 497–500. [Google Scholar] [CrossRef]
  6. Lantz, V.; Feng, Q. Assessing income, population, and technology impacts on CO2 emissions in Canada: Where’s the EKC? Ecol. Econ. 2006, 57, 229–238. [Google Scholar] [CrossRef]
  7. Honma, S.; Hu, J.L. Total-factor energy efficiency of regions in Japan. Energy Policy 2008, 36, 821–833. [Google Scholar] [CrossRef]
  8. Porter, M.E.; Linde, C.V.D. Toward a new conception of the environment-competitiveness relationship. J. Econ. Perspect. 1995, 9, 97–118. [Google Scholar] [CrossRef]
  9. Lanjouw, J.O.; Mody, A. Innovation and the international diffusion of environmentally responsive technology. Res. Policy 1996, 25, 549–571. [Google Scholar] [CrossRef]
  10. Mehrara, M. Energy consumption and economic growth: The case of oil exporting countries. Energy Policy 2007, 35, 2939–2945. [Google Scholar] [CrossRef]
  11. Pao, H.T.; Li, Y.Y.; Fu, H.C. Clean energy, non-clean energy, and economic growth in the MIST countries. Energy Policy 2014, 67, 932–942. [Google Scholar] [CrossRef]
  12. Lin, B.Q. Electricity consumption and economic growth of China: A study based on production function. Manag. World 2003, 12, 18–27. (In Chinese) [Google Scholar]
  13. Wu, Q.S.; Chen, L.; Zhang, Y.T.; Cheng, J.H. A re-examination of the relationship between energy consumption and GDP in China: An empirical analysis based on provincial panel data. J. Quant. Tech. Econ. 2008, 6, 27–40. (In Chinese) [Google Scholar]
  14. Fried, H.O.; Lovell, C.A.K.; Schmidt, S.S.; Yaisawarng, S. Accounting for environmental effects and statistical noise in data envelopment analysis. J. Product. Anal. 2002, 17, 157–174. [Google Scholar] [CrossRef]
  15. Hu, J.L.; Wang, S.C. Total-factor energy efficiency of regions in China. Energy Policy 2006, 34, 3206–3217. [Google Scholar] [CrossRef]
  16. Sun, G.S.; Yang, X.M.; Huang, Y. Energy efficiency of China’s industry (1987–2005): Variation trend, potential of energy saving and influencing factors. China Soft Sci. 2011, 11, 34–44. (In Chinese) [Google Scholar]
  17. Chen, D.M.; Zhang, R.; Tan, Z.X. Total-factor energy efficiency and China’s economic growth convergence: Empirical test based on dynamic panel data. China Popul. Resour. Environ. 2012, 1, 136–143. (In Chinese) [Google Scholar]
  18. Wang, M. Discussion on energy ownership reform in China. Econ. Aff. 2014, 5, 29–33. [Google Scholar]
  19. Charnes, A.; Cooper, W.W. Preface to topics in data envelopment analysis. Ann. Oper. Res. 1984, 2, 59–94. [Google Scholar] [CrossRef]
  20. Chang, M.C. A comment on the calculation of the total-factor energy efficiency (TFEE) index. Energy Policy 2013, 53, 500–504. [Google Scholar] [CrossRef]
  21. Zhang, J.; Xu, L.Y.; Yu, B.; Li, X.J. Environmentally feasible potential for hydropower development regarding environmental constraints. Energy Policy 2014, 73, 552–562. [Google Scholar] [CrossRef]
  22. Tone, K. A slacks-based measure of efficiency in data envelopment analysis. Eur. J. Oper. Res. 2001, 130, 498–509. [Google Scholar] [CrossRef]
  23. Li, L.B.; Hu, J.L. Ecological total-factor energy efficiency of regions in China. Energy Policy 2012, 46, 216–224. [Google Scholar] [CrossRef]
  24. Huang, B.M. The research on energy efficiency, environmental constraints and the quality of economic growth in China. Dr. Diss. Jinlin Univ. China 2015, 7–10. (In Chinese) [Google Scholar]
  25. Hall, R.E.; Jones, C.I. Why do some countries produce so much more output per worker than others? Q. J. Econ. 1999, 1, 83–116. [Google Scholar] [CrossRef]
  26. Reinhard, S.; Lovell, C.A.K.; Thijssen, G.J. Environmental efficiency with multiple environmentally detrimental variables; estimated with SFA and DEA. Eur. J. Oper. Res. 2000, 121, 287–303. [Google Scholar] [CrossRef]
  27. Färe, R.; Grosskopf, S. Directional distance functions and slacks-based measures of efficiency. Eur. J. Oper. Res. 2010, 200, 320–322. [Google Scholar] [CrossRef]
  28. Chen, S.Y.; Zhang, S.J. Large-scale land use for construction and energy consumption after the new millennium with their impact on total-factor efficiency change in China’s regional economy. Energies 2014, 7, 1986–2003. [Google Scholar] [CrossRef]
  29. Xu, Y.S.; Qiao, B.Y. Measurement of fiscal decentralization: Theory and empirical analysis of China from 1985 to 2007. Econ. Res. J. 2012, 10, 5–14. (In Chinese) [Google Scholar]
  30. Feld, L.P.; Kirchgssner, G.; Huang, A.L. Fiscal policy and direct democracy: System design decisions. Academics 2014, 8, 30–55. [Google Scholar]
  31. Wang, L.L. Research on the audit of financial non-tax revenue collection and management under the new situation. Econ. Trade 2016, 1, 354. (In Chinese) [Google Scholar]
  32. Zhu, P.F.; Xu, W.M. On The Impact of Government’ s S&T Incentive Policy on the R&D input and its patent output of large and medium-sized Industrial enterprises in Shanghai. Econ. Res. J. 2003, 6, 45–53. [Google Scholar]
  33. Hu, H.; Li, Z.B.; Yu, Y.X. Study on the relationship between Regional R&D resources and patent output. Enterp. Econ. 2012, 1, 132–135. [Google Scholar]
  34. Ma, J.J.; Lu, R.; Liu, C.Y. Spatial econometric analysis on Chinese patent product efficiency. Sci. Res. Manag. 2013, 6, 99–105. [Google Scholar]
  35. Xu, M. Research on the elasticity relationship between patent application and R&D input factors: The empirical study on the panel data of thirty-six industries. Sci. Sci. Manag. Sci. Technol. 2016, 1, 30–37. [Google Scholar]
  36. Hou, B.B.; Zhou, A.N.; Li, H.X.; Zhang, Y.P.; Ma, X.; Xian, M.Y. An analysis of scientific research investment and patent output of universities based on DEA. Technol. Innov. Manag. 2016, 7, 381–385. [Google Scholar]
  37. The Central Committee of the Communist Party of China; The State Council of China. Several Opinions on Implementing the Strategy of Revitalizing Old Industrial Bases in Northeast Area; People’s Publishing House: Beijing, China, 2003.
  38. The State Council of China. Opinions of the State Council on Further Implementing the Revitalization of Old Industrial Bases in Northeast Area; People’s Publishing House: Beijing, China, 2009.
  39. The Central Committee of the Communist Party of China; The State Council of China. Several Opinions on the Comprehensive Revitalization of Old Industrial Bases in Northeast Area; People’s Publishing House: Beijing, China, 2016.
  40. State Statistical Bureau of China. China Economic Census Yearbook; China Statistic Press: Beijing, China, 2003–2005.
  41. General Office of Shanxi Province. Measures for the Disposal of the Resources Mining Rights Involved in the Merger and Reorganization of Coal Mining Enterprises; General Office of Shanxi Province: Taiyuan, China, 2008; Volume 83.
  42. Fan, Z.L.; Ma, Z.H. Thoughts on the integration of coal resources in Shanxi. West. Resour. 2010, 1, 9–11. (In Chinese) [Google Scholar]
  43. Gao, M.K. Analysis on the reasons for the slow construction of coal resources integration in Shanxi. Energy Energy Conserv. 2014, 7, 36–38. (In Chinese) [Google Scholar]
Figure 1. The GDP and environmental pollution treatment cost of China, 2000–2015.
Sustainability 09 00912 g001
Figure 2. China’s energy consumption structure, 2004–2015.
Sustainability 09 00912 g002
Figure 3. Pollution Emission of China, 2004–2015.
Sustainability 09 00912 g003
Figure 4. Average PM2.5 level of China from a regional view, 2014–2015.
Sustainability 09 00912 g004
Figure 5. Provincial state-owned and non-state-owned energy investment in the fixed assets of China, 2003–2014: (al) Provincial state-owned and non-state-owned energy investment in the fixed assets of China each year during 2003–2014, respectively.
Sustainability 09 00912 g005aSustainability 09 00912 g005bSustainability 09 00912 g005cSustainability 09 00912 g005d
Figure 6. Total factor energy efficiency (TFEE) of provincial state-owned energy investment in China, 2003–2014: (a) TFEE of provincial state-owned energy investment in China, 2003–2006; (b) TFEE of provincial state-owned energy investment in China, 2007–2010; and (c) TFEE of provincial state-owned energy investment in China, 2011–2014.
Sustainability 09 00912 g006aSustainability 09 00912 g006b
Figure 7. Total Factor Energy Efficiency (TFEE) of provincial non-state-owned energy investment in China, 2003–2014: (a) TFEE of provincial non-state-owned energy investment in China, 2003–2006; (b) TFEE of provincial non-state-owned energy investment in China, 2007–2010; and (c) TFEE of provincial non-state-owned energy investment in China, 2011–2014.
Sustainability 09 00912 g007aSustainability 09 00912 g007b
Table 1. Total factor energy efficiency of provincial state-owned energy investment in China, 2003–2014.
200320042005200620072008200920102011201220132014
Eastern ProvincesBeijing1.00001.00001.00001.00001.00001.00001.00001.00001.00001.00001.00001.0000
Tianjin0.47060.70371.00000.48110.44570.29370.27930.27611.00001.00001.00001.0000
Hebei0.88810.90460.76180.54700.80560.95820.97420.68390.38440.46750.54530.7226
Shanghai1.00001.00001.00001.00001.00001.00001.00001.00001.00001.00001.00001.0000
Jiangsu0.34420.43640.90450.93811.00001.00001.00001.00001.00001.00001.00001.0000
Zhejiang0.63730.59260.77080.90130.72441.00001.00001.00001.00001.00001.00000.8573
Fujian1.00000.97020.77330.50880.46120.52800.69710.51640.53810.43020.44850.6449
Shandong0.40040.57631.00001.00001.00001.00001.00000.94040.49420.90250.87620.6260
Guangdong1.00001.00001.00001.00001.00001.00001.00001.00000.52570.41830.49200.7099
Hainan0.81450.34170.18790.26230.75500.73610.70540.81680.65190.70420.96630.7171
Northeast ProvincesLiaoning0.69480.55780.97660.90140.90660.96370.88800.50180.37400.34570.49820.8572
Jilin0.70060.95951.00000.86060.76490.69950.60650.35790.27010.32040.36080.4314
Heilongjiang1.00001.00001.00000.50210.53470.40870.42170.19570.15630.16040.22750.3061
Central ProvincesShanxi0.24240.21150.24060.18270.19610.20760.21690.12830.07890.08280.11120.1333
Anhui0.69910.41120.51090.39600.44340.54880.72310.60430.49330.36860.56600.8613
Henan0.51290.50920.72350.73560.88670.81370.84700.92270.80310.85720.96871.0000
Hubei0.26380.28350.50270.38510.53500.63660.61890.51810.57270.61710.79040.9683
Hunan0.66180.62940.81880.66080.68600.79350.96570.83140.71740.85200.96360.9711
Jiangxi0.50870.61030.91200.73960.90400.98110.96780.94420.87330.90080.96480.9705
Western ProvincesNeimenggu0.15470.16170.23660.20060.23710.19470.16900.11560.27460.36430.19220.1348
Guangxi0.56400.54910.86110.64750.84550.97280.65340.46520.42570.53140.77360.8831
Chongqing0.50110.75150.89050.45980.68770.95510.90020.74420.44360.30550.35210.4094
Sichuan0.52210.47330.67380.43260.51960.70850.76880.43040.24540.23130.33660.3895
Guizhou0.07770.10410.19130.17170.24540.24360.26370.19920.16180.24410.28290.3627
Yunnan0.44620.31470.43500.28570.42580.40700.31180.26800.24020.20740.23810.3125
Shaanxi0.14100.16820.27260.24040.26580.30950.28290.20100.10070.10360.10570.1528
Gansu0.13680.19030.30950.28330.29520.27710.19890.12800.09080.10340.09970.1544
Qinghai0.12530.16740.52890.26060.45970.53690.28020.30350.11280.07490.07610.1140
Ningxia0.14620.27970.25000.19990.17330.18530.15510.19140.09400.12550.14680.1407
Xinjiang0.23240.36110.62080.46850.57750.41160.29950.20810.15880.09330.09530.1267
Table 2. Total factor energy efficiency of provincial non-state-owned energy investment in China, 2003–2014.
200320042005200620072008200920102011201220132014
Eastern ProvincesBeijing1.00001.00001.00001.00001.00001.00001.00001.00001.00001.00001.00001.0000
Tianjin0.05680.09580.09490.04320.11330.02770.04690.08861.00001.00001.00001.0000
Hebei0.35260.29360.10900.08600.19230.07080.19630.20980.18230.33660.30680.2165
Shanghai1.00001.00001.00001.00001.00001.00001.00001.00001.00001.00001.00001.0000
Jiangsu0.12530.11720.19370.24520.83510.33010.79950.90651.00001.00000.85950.6030
Zhejiang0.05120.18150.20510.34511.00001.00001.00001.00001.00001.00001.00000.6935
Fujian1.00000.63620.34750.08770.38670.07960.12820.15840.25750.49640.45920.2965
Shandong0.02310.09460.09960.07990.26430.10660.20180.29360.26060.36210.32840.2595
Guangdong1.00001.00001.00001.00001.00001.00001.00001.00000.45680.48410.28140.7637
Hainan0.67250.89690.24390.14240.65730.45710.34110.27500.18040.28990.26230.2118
Northeast ProvincesLiaoning0.25090.11760.12710.08690.19900.06810.12370.11030.13790.27040.24200.2392
Jilin0.18060.24200.09060.05500.14040.04480.12770.10740.11260.16830.21700.1580
Heilongjiang1.00001.00001.00000.05640.07470.02750.06420.11340.12690.23640.25250.2839
Central ProvincesShanxi0.04530.03560.03190.02480.06550.02500.05560.05980.03900.08630.09270.0744
Anhui0.59380.26910.11940.10290.35950.16390.48050.40000.44390.25470.86040.5759
Henan0.29890.27390.09010.06320.19820.08360.18060.24840.24030.57650.50990.4521
Hubei0.22870.24160.16320.09870.34620.15660.33310.40930.46320.95470.95670.7720
Hunan0.55870.67640.16180.08880.26190.09400.24110.22890.25900.55160.49640.3538
Jiangxi0.08580.22310.24430.17510.51200.16870.27540.47420.33650.86910.74830.6028
Western ProvincesNeimenggu0.01380.03550.03780.02580.06920.01710.03410.03730.16030.26060.24690.1830
Guangxi0.26560.26960.08270.04680.26200.06610.25430.45100.52850.73650.50000.4332
Chongqing0.04240.13210.12640.08900.34400.13720.28250.28660.27240.43740.42350.2882
Sichuan0.02970.07960.08500.05650.16640.06760.17670.17420.15200.30090.32680.2940
Guizhou0.04080.09290.06550.04360.12250.04640.10570.10860.06500.23160.21420.2552
Yunnan0.12000.05260.04520.02980.07390.02880.07530.08150.09640.17390.17580.1737
Shaanxi0.05220.15070.17560.08840.21660.06710.12360.15070.08330.16120.12770.1335
Gansu0.02730.11340.11450.05200.13160.04410.07420.08970.08200.09430.08450.0571
Qinghai0.01430.03080.03000.02080.05790.02200.06620.08540.06190.09140.09910.0637
Ningxia0.04330.05900.05960.04150.19560.05230.06410.10380.04570.06800.12380.0675
Xinjiang0.00680.02370.02610.01500.03280.01450.03270.03430.03160.07680.05910.0346

