
Do Forwarders Improve Sustainability Efficiency? Evidence from a European DEA Malmquist Index Calculation


Abstract
:1. Introduction
2. Transportation and Sustainability
“Humanity has the ability to make development sustainable to ensure that it meets the needs of the present without compromising the ability of future generations to meet their own needs. The concept of sustainable development does imply limits—not absolute limits but limitations imposed by the present state of technology and social organization on environmental resources and by the ability of the biosphere to absorb the effects of human activities. But technology and social organization can be both managed and improved to make way for a new era of economic growth.”
3. Sustainability Policies and Data for European LSP
3.1. Economic Sustainability
- ■
- EBIT—The yearly corporate profit sustainability are concerned [76,77]. Regarding this economic dimension in the proposed efficiency development analysis conducted herein, the following two output types are used as indicators:as measured by the earnings before interest and tax (EBIT) standardized figure in corporate reporting [78,79]. All currency quantities are converted to Euro values according to OECD historical exchange rate data [80].
- ■
- Dividend volume—As a further yearly economic performance indicator, the total dividend volume paid to the shareholders is used.
3.2. Environmental Sustainability
3.3. Social Sustainability
“Seeing diversity as potential—People from various cultures, with different points of view and skills work together successfully at Deutsche Post DHL Group. It’s precisely this diversity that we see as potential for the further growth of our organization and an opportunity to attract and retain talent. We promote inclusion and reject any form of discrimination—principles are part of your Group-wide Code of Conduct. In 2015, we continued to make a concerted effort to strengthen the significance of diversity within our company. We trained employees, continued the Diversity Council’s work and held another global Diversity Week. As at 31 December 2015, the proportion of women in management worldwide was 20.7% (previous year: 19.3%), a figure we intend to raise continuously.”
- ■
- Employment—As the core social role for companies is to provide work and income, the full time equivalent (FTE) figure from the corporate LSP reports (usually: figure at year end/31.12.) is taken as the output type for social sustainability.
- ■
- Gender equality and women participating in management—Though there are various definitions regarding the respective management level, most LSP comment on the share of women in management positions, be it management in general or “senior management” [92] (p. 49). This share is valued as an important and comparable indicator for the social sustainability and success of LSP in this evaluation. In some cases where the reported numbers are not available for all subsequent year of analysis, the older numbers were assumed to be at least at the level of the latest reported figure. This secures that no companies have disadvantages in this point given the fact that these shares are continuously rising in tendency.
3.4. Input Indicators and Data
- ■
- Asset volume—The total asset value as reported in the financial reporting of the selected LSP is used. The asset volume for Deutsche Post DHL had to be adjusted due to the former incorporation of the financial institution “Postbank AG” from 2006 to 2008. The (known) asset volume of the banking part was subtracted from the total asset volume in order to reach comparable levels.
- ■
- Revenue volume—The total revenue volume is included as indicator for corporate and activity size for input evaluation.
3.5. Company Selection: European Focus
4. DEA Malmquist Technique for Longitudinal Efficiency Analysis
| n | the number of DMUs to be evaluated |
| DMUj | the j-th DMU |
| m | the number of inputs to each DMU |
| s | the number of outputs to each DMU |
| xij | amount of the ith input consumed by DMU j |
| ykj | amount of the kth output produced by DMU j |
| eff | abbreviation for efficiency |
| vi | the weight assigned to the ith input |
| uk | the weight assigned to the kth output |
5. Research Results
6. Discussion
‘It is proposed that medium-sized, asset-light LSP without government ownership and influence may have a competitive advantage in reaching high sustainability efficiency levels in a long-term perspective.’
7. Conclusions
Conflicts of Interest
Appendix A

| LSP | Year | Assets (mil. Euro) | Revenue (mil. Euro) | EBIT (mil. Euro) | Dividend Volume (mil. Euro) | GHG Emissions Scope 2 (Tonnes CO2-Equivalent) * | Employment (FTE) | Women in Management (%) * |
|---|---|---|---|---|---|---|---|---|
| DB | 2006 | 48,440.00 | 30,053.00 | 2143.00 | 341.00 | 22,690,050.00 | 229,200.00 | 10.00 |
| DB | 2007 | 48,529.00 | 31,309.00 | 2370.00 | 333.00 | 22,850,000.00 | 237,078.00 | 11.00 |
| DB | 2008 | 48,193.00 | 33,452.00 | 2483.00 | 147.00 | 23,230,000.00 | 240,242.00 | 12.00 |
| DB | 2009 | 47,303.00 | 29,335.00 | 1685.00 | 347.00 | 23,400,000.00 | 239,382.00 | 13.00 |
| DB | 2010 | 52,003.00 | 34,410.00 | 1866.00 | 500.00 | 21,100,000.00 | 276,310.00 | 14.00 |
| DB | 2011 | 51,791.00 | 37,979.00 | 2309.00 | 500.00 | 21,630,000.00 | 284,319.00 | 16.40 |
| DB | 2012 | 52,525.00 | 39,296.00 | 2708.00 | 525.00 | 23,170,000.00 | 287,508.00 | 16.50 |
| DB | 2013 | 52,894.00 | 39,107.00 | 2236.00 | 200.00 | 21,160,000.00 | 295,653.00 | 16.90 |
| DB | 2014 | 55,883.00 | 39,728.00 | 2109.00 | 500.00 | 22,090,000.00 | 295,763.00 | 17.50 |
| DB | 2015 | 56,059.00 | 40,403.00 | 1759.00 | 700.00 | 21,760,000.00 | 297,202.00 | 18.20 |
| DHL | 2006 | 32,818.00 | 60,545.00 | 2282.00 | 903.00 | 7,400,000.00 | 463,350.00 | 13.50 |
| DHL | 2007 | 32,510.00 | 54,043.00 | 1873.00 | 1087.00 | 8,000,000.00 | 453,626.00 | 13.50 |
| DHL | 2008 | 31,754.00 | 54,474.00 | −1979.00 | 725.00 | 6,700,000.00 | 451,515.00 | 13.50 |
| DHL | 2009 | 34,738.00 | 46,201.00 | 231.00 | 725.00 | 5,600,000.00 | 424,686.00 | 15.60 |
| DHL | 2010 | 37,763.00 | 51,388.00 | 1835.00 | 786.00 | 6,000,000.00 | 418,946.00 | 14.60 |
| DHL | 2011 | 38,408.00 | 52,829.00 | 2436.00 | 846.00 | 5,300,000.00 | 423,502.00 | 17.60 |
| DHL | 2012 | 33,857.00 | 55,512.00 | 2665.00 | 846.00 | 5,400,000.00 | 428,129.00 | 18.50 |
| DHL | 2013 | 35,461.00 | 54,912.00 | 2865.00 | 968.00 | 5,600,000.00 | 434,974.00 | 19.60 |
| DHL | 2014 | 36,979.00 | 56,630.00 | 2965.00 | 1030.00 | 5,670,000.00 | 443,784.00 | 19.30 |
| DHL | 2015 | 37,870.00 | 59,230.00 | 2411.00 | 1031.00 | 6,050,000.00 | 450,508.00 | 20.70 |
| DSV | 2006 | 2152.58 | 4284.80 | 135.89 | 6.70 | 2,464,000.00 | 21,300.00 | 10.00 |
| DSV | 2007 | 2189.24 | 4686.11 | 212.96 | 6.71 | 2,464,000.00 | 21,280.00 | 10.00 |
| DSV | 2008 | 3178.54 | 5015.32 | 215.70 | 6.70 | 2,464,000.00 | 25,056.00 | 10.00 |
| DSV | 2009 | 2978.85 | 4846.33 | 61.78 | 0.00 | 3,212,000.00 | 19,211.00 | 10.00 |
| DSV | 2010 | 3099.07 | 5713.78 | 222.85 | 6.98 | 3,221,000.00 | 19,199.00 | 10.00 |
| DSV | 2011 | 3044.47 | 5853.51 | 207.04 | 14.06 | 3,299,767.58 | 21,679.00 | 10.00 |
| DSV | 2012 | 3101.12 | 6110.27 | 237.41 | 25.85 | 3,444,507.36 | 21,932.00 | 10.00 |
| DSV | 2013 | 3097.28 | 6128.85 | 239.74 | 31.51 | 3,454,984.92 | 22,021.00 | 10.00 |
| DSV | 2014 | 3181.53 | 6527.23 | 246.54 | 36.28 | 3,679,562.05 | 22,874.00 | 10.00 |
| DSV | 2015 | 3717.00 | 6819.83 | 296.42 | 37.94 | 3,844,508.39 | 22,783.00 | 10.00 |
| KÜHNE | 2006 | 3635.44 | 11,563.49 | 382.61 | 81.99 | 286,394.00 | 46,290.00 | 10.00 |
| KÜHNE | 2007 | 3921.82 | 12,777.27 | 422.15 | 107.82 | 286,394.00 | 51,075.00 | 10.00 |
| KÜHNE | 2008 | 3503.29 | 13,621.53 | 464.16 | 327.31 | 286,394.00 | 53,823.00 | 10.00 |
| KÜHNE | 2009 | 3926.25 | 11,518.68 | 393.09 | 180.00 | 286,394.00 | 54,680.00 | 10.00 |
| KÜHNE | 2010 | 4300.53 | 14,666.40 | 553.04 | 197.62 | 275,511.00 | 66,045.00 | 10.00 |
| KÜHNE | 2011 | 4972.27 | 15,866.58 | 606.45 | 265.58 | 196,000.00 | 71,884.00 | 10.00 |
| KÜHNE | 2012 | 5274.90 | 17,434.29 | 531.77 | 386.44 | 196,000.00 | 72,399.00 | 10.00 |
| KÜHNE | 2013 | 5177.59 | 17,000.58 | 618.16 | 340.35 | 191,884.00 | 72,036.00 | 10.00 |
| KÜHNE | 2014 | 5435.22 | 17,525.56 | 674.16 | 576.20 | 203,571.00 | 74,497.00 | 10.00 |
| KÜHNE | 2015 | 5718.60 | 19,017.95 | 796.99 | 786.67 | 197,871.00 | 80,056.00 | 10.00 |
| PANALPINA | 2006 | 1339.77 | 4916.10 | 165.88 | 31.14 | 57,147.00 | 14,304.00 | 18.00 |
| PANALPINA | 2007 | 1387.68 | 5263.81 | 182.14 | 45.08 | 57,147.00 | 15,301.00 | 18.00 |
| PANALPINA | 2008 | 1243.02 | 5598.96 | 121.72 | 49.07 | 57,147.00 | 15,630.00 | 18.00 |
| PANALPINA | 2009 | 1273.90 | 3942.79 | 19.85 | 29.71 | 38,200.00 | 13,773.00 | 18.00 |
| PANALPINA | 2010 | 1439.78 | 5185.83 | 10.86 | 0.00 | 44,210.00 | 14,836.00 | 18.00 |
| PANALPINA | 2011 | 1728.68 | 5262.95 | 140.89 | 38.06 | 57,147.00 | 15,051.00 | 18.00 |
| PANALPINA | 2012 | 1644.05 | 5558.84 | −33.60 | 39.74 | 49,682.00 | 15,224.00 | 19.00 |
| PANALPINA | 2013 | 1583.17 | 5489.51 | 38.99 | 42.40 | 52,921.00 | 16,010.00 | 19.00 |
| PANALPINA | 2014 | 1587.84 | 5520.83 | 96.31 | 53.75 | 50,527.00 | 15,639.00 | 19.00 |
| PANALPINA | 2015 | 1618.35 | 5489.82 | 109.89 | 77.92 | 49,353.00 | 14,843.00 | 19.00 |
Appendix B
| (A) Calculation Run I–IV with 0% Minimum Weight Restrictions | |||||||||||||||||||
| (I) | VRS | 2 In. | (II) | VRS | 1 In. | (III) | CRS | 2 In. | (IV) | CRS | 1 In. | ||||||||
| Year | LSP | Malm. Index | Catch. | Front. | Score | Scale | Malm. Index | Catch. | Front. | Score | Scale | Malm. Index | Catch. | Front. | Score | Malm. Index | Catch. | Front. | Score |
| 2006 | DB | 1.00 | Const. | 1.00 | Const. | 1.00 | 1.00 | ||||||||||||
| 2007 | DB | 1.05 | 1.00 | 1.05 | 1.00 | Const. | 1.05 | 1.00 | 1.05 | 1.00 | Const. | 1.05 | 1.00 | 1.05 | 1.00 | 1.04 | 1.00 | 1.04 | 1.00 |
| 2009 | DB | 0.89 | 1.00 | 0.89 | 1.00 | Const. | 0.89 | 1.00 | 0.89 | 1.00 | Const. | 0.93 | 1.00 | 0.93 | 1.00 | 0.93 | 1.00 | 0.93 | 1.00 |
| 2008 | DB | 0.90 | 1.00 | 0.90 | 1.00 | Const. | 0.90 | 1.00 | 0.90 | 1.00 | Const. | 0.93 | 1.00 | 0.93 | 1.00 | 0.93 | 1.00 | 0.93 | 1.00 |
| 2011 | DB | 1.08 | 1.00 | 1.08 | 1.00 | Const. | 1.08 | 1.00 | 1.08 | 1.00 | Const. | 1.02 | 1.00 | 1.02 | 1.00 | 1.05 | 1.00 | 1.05 | 1.00 |
| 2010 | DB | 1.08 | 1.00 | 1.08 | 1.00 | Const. | 1.08 | 1.00 | 1.08 | 1.00 | Const. | 1.06 | 1.00 | 1.06 | 1.00 | 1.02 | 1.00 | 1.02 | 1.00 |
| 2012 | DB | 1.07 | 1.00 | 1.07 | 1.00 | Const. | 1.07 | 1.00 | 1.07 | 1.00 | Const. | 1.06 | 1.00 | 1.06 | 1.00 | 1.06 | 1.00 | 1.06 | 1.00 |
| 2013 | DB | 0.90 | 1.00 | 0.90 | 1.00 | Const. | 0.90 | 1.00 | 0.90 | 1.00 | Const. | 0.90 | 1.00 | 0.90 | 1.00 | 0.90 | 1.00 | 0.90 | 1.00 |
| 2014 | DB | 0.96 | 1.00 | 0.96 | 1.00 | Const. | 0.96 | 1.00 | 0.96 | 1.00 | Const. | 0.96 | 1.00 | 0.96 | 1.00 | 0.96 | 1.00 | 0.96 | 1.00 |
| 2015 | DB | 0.89 | 1.00 | 0.89 | 1.00 | Const. | 0.89 | 1.00 | 0.89 | 1.00 | Const. | 0.89 | 1.00 | 0.89 | 1.00 | 0.89 | 1.00 | 0.89 | 1.00 |
| 2006 | DHL | 1.00 | Const. | 1.00 | Const. | 1.00 | 1.00 | ||||||||||||
| 2007 | DHL | 1.02 | 1.00 | 1.02 | 1.00 | Const. | 1.02 | 1.00 | 1.02 | 1.00 | Const. | 1.12 | 1.00 | 1.12 | 1.00 | 1.12 | 1.00 | 1.12 | 1.00 |
| 2008 | DHL | 0.69 | 1.00 | 0.69 | 1.00 | Const. | 0.69 | 1.00 | 0.69 | 1.00 | Const. | 0.90 | 1.00 | 0.90 | 1.00 | 0.90 | 1.00 | 0.90 | 1.00 |
| 2009 | DHL | 1.03 | 1.00 | 1.03 | 1.00 | Const. | 1.08 | 1.00 | 1.08 | 1.00 | Const. | 1.02 | 1.00 | 1.02 | 1.00 | 1.14 | 1.00 | 1.14 | 1.00 |
| 2011 | DHL | 1.58 | 1.00 | 1.58 | 1.00 | Const. | 1.58 | 1.00 | 1.58 | 1.00 | Const. | 1.07 | 1.00 | 1.07 | 1.00 | 1.10 | 1.00 | 1.10 | 1.00 |
| 2010 | DHL | 1.19 | 1.00 | 1.19 | 1.00 | Const. | 1.19 | 1.00 | 1.19 | 1.00 | Const. | 1.10 | 1.00 | 1.10 | 1.00 | 1.07 | 1.00 | 1.07 | 1.00 |
| 2012 | DHL | 1.08 | 1.00 | 1.08 | 1.00 | Const. | 1.02 | 1.00 | 1.02 | 1.00 | Const. | 1.04 | 1.00 | 1.04 | 1.00 | 1.00 | 1.00 | 1.00 | 1.00 |
| 2013 | DHL | 1.06 | 1.00 | 1.06 | 1.00 | Const. | 1.07 | 1.00 | 1.07 | 1.00 | Const. | 1.02 | 1.00 | 1.02 | 1.00 | 1.06 | 1.00 | 1.06 | 1.00 |
| 2014 | DHL | 1.02 | 1.00 | 1.02 | 1.00 | Const. | 1.02 | 1.00 | 1.02 | 1.00 | Const. | 1.00 | 1.00 | 1.00 | 1.00 | 1.00 | 1.00 | 1.00 | 1.00 |
| 2015 | DHL | 0.91 | 1.00 | 0.91 | 1.00 | Const. | 0.91 | 1.00 | 0.91 | 1.00 | Const. | 0.88 | 1.00 | 0.88 | 1.00 | 0.88 | 1.00 | 0.88 | 1.00 |
| 2006 | DSV | 1.00 | Const. | 1.00 | Const. | 1.00 | 1.00 | ||||||||||||
| 2007 | DSV | 1.15 | 1.00 | 1.15 | 1.00 | Const. | 1.14 | 1.00 | 1.14 | 1.00 | Const. | 1.07 | 1.00 | 1.07 | 1.00 | 0.93 | 0.96 | 0.98 | 0.96 |
| 2008 | DSV | 1.02 | 1.00 | 1.02 | 1.00 | Const. | 1.02 | 1.00 | 1.02 | 1.00 | Const. | 0.90 | 1.00 | 0.90 | 1.00 | 0.99 | 1.05 | 0.94 | 1.00 |
| 2009 | DSV | 0.60 | 0.88 | 0.69 | 0.88 | Incr. | 0.61 | 0.88 | 0.69 | 0.88 | Incr. | 0.72 | 0.74 | 0.97 | 0.74 | 0.76 | 0.72 | 1.06 | 0.72 |
| 2011 | DSV | 1.45 | 1.14 | 1.27 | 1.00 | Const. | 1.37 | 1.14 | 1.20 | 1.00 | Const. | 1.37 | 1.35 | 1.02 | 1.00 | 0.95 | 0.83 | 1.13 | 0.83 |
| 2010 | DSV | 1.03 | 1.00 | 1.03 | 1.00 | Const. | 1.03 | 1.00 | 1.03 | 1.00 | Const. | 0.96 | 0.94 | 1.02 | 1.00 | 1.26 | 1.40 | 0.90 | 1.00 |
| 2012 | DSV | 0.82 | 1.00 | 0.82 | 1.00 | Const. | 0.82 | 1.00 | 0.82 | 1.00 | Const. | 1.01 | 1.00 | 1.01 | 1.00 | 1.04 | 1.17 | 0.89 | 0.97 |
| 2013 | DSV | 1.04 | 1.00 | 1.04 | 1.00 | Const. | 1.04 | 1.00 | 1.04 | 1.00 | Const. | 1.05 | 1.06 | 0.99 | 1.00 | 1.00 | 1.03 | 0.98 | 1.00 |
| 2014 | DSV | 0.87 | 1.00 | 0.87 | 1.00 | Const. | 0.87 | 1.00 | 0.87 | 1.00 | Const. | 0.98 | 0.99 | 0.98 | 1.00 | 0.96 | 0.96 | 1.00 | 0.96 |
| 2015 | DSV | 1.03 | 1.00 | 1.03 | 1.00 | Const. | 1.03 | 1.00 | 1.03 | 1.00 | Const. | 1.06 | 1.01 | 1.05 | 1.00 | 1.08 | 1.04 | 1.03 | 1.00 |
| 2006 | KÜHNE | 1.00 | Const. | 1.00 | Const. | 1.00 | 1.00 | ||||||||||||
| 2007 | KÜHNE | 1.15 | 1.00 | 1.15 | 1.00 | Const. | 1.15 | 1.00 | 1.15 | 1.00 | Const. | 1.09 | 1.00 | 1.09 | 1.00 | 1.09 | 1.00 | 1.09 | 1.00 |
| 2008 | KÜHNE | 1.81 | 1.00 | 1.81 | 1.00 | Const. | 1.74 | 1.00 | 1.74 | 1.00 | Const. | 1.69 | 1.00 | 1.69 | 1.00 | 1.60 | 1.00 | 1.60 | 1.00 |
| 2009 | KÜHNE | 0.75 | 1.00 | 0.75 | 1.00 | Const. | 0.81 | 1.00 | 0.81 | 1.00 | Const. | 0.75 | 1.00 | 0.75 | 1.00 | 0.81 | 1.00 | 0.81 | 1.00 |
| 2011 | KÜHNE | 1.04 | 1.00 | 1.04 | 1.00 | Const. | 1.04 | 1.00 | 1.04 | 1.00 | Const. | 1.11 | 1.00 | 1.11 | 1.00 | 1.39 | 1.00 | 1.39 | 1.00 |
| 2010 | KÜHNE | 1.37 | 1.00 | 1.37 | 1.00 | Const. | 1.44 | 1.00 | 1.44 | 1.00 | Const. | 1.33 | 1.00 | 1.33 | 1.00 | 1.11 | 1.00 | 1.11 | 1.00 |
| 2012 | KÜHNE | 1.05 | 1.00 | 1.05 | 1.00 | Const. | 1.05 | 1.00 | 1.05 | 1.00 | Const. | 1.03 | 1.00 | 1.03 | 1.00 | 1.08 | 1.00 | 1.08 | 1.00 |
| 2013 | KÜHNE | 1.03 | 1.00 | 1.03 | 1.00 | Const. | 1.03 | 1.00 | 1.03 | 1.00 | Const. | 1.08 | 1.00 | 1.08 | 1.00 | 1.04 | 1.00 | 1.04 | 1.00 |
| 2014 | KÜHNE | 1.28 | 1.00 | 1.28 | 1.00 | Const. | 1.28 | 1.00 | 1.28 | 1.00 | Const. | 1.26 | 1.00 | 1.26 | 1.00 | 1.26 | 1.00 | 1.26 | 1.00 |
| 2015 | KÜHNE | 1.18 | 1.00 | 1.18 | 1.00 | Const. | 1.18 | 1.00 | 1.18 | 1.00 | Const. | 1.18 | 1.00 | 1.18 | 1.00 | 1.18 | 1.00 | 1.18 | 1.00 |
| 2006 | PANALP. | 1.00 | Const. | 1.00 | Const. | 1.00 | 1.00 | ||||||||||||
| 2007 | PANALP. | 1.20 | 1.00 | 1.20 | 1.00 | Const. | 1.20 | 1.00 | 1.20 | 1.00 | Const. | 1.16 | 1.00 | 1.16 | 1.00 | 1.16 | 1.00 | 1.16 | 1.00 |
| 2008 | PANALP. | 1.00 | 1.00 | 1.00 | 1.00 | Const. | 1.04 | 1.00 | 1.04 | 1.00 | Const. | 0.89 | 1.00 | 0.89 | 1.00 | 0.84 | 1.00 | 0.84 | 1.00 |
| 2009 | PANALP. | 1.00 | 1.00 | 1.00 | 1.00 | Const. | 0.63 | 1.00 | 0.63 | 1.00 | Const. | 0.89 | 1.00 | 0.89 | 1.00 | 0.89 | 1.00 | 0.89 | 1.00 |
| 2011 | PANALP. | 1.00 | 1.00 | 1.00 | 1.00 | Const. | 1.00 | 1.00 | 1.00 | 1.00 | Const. | 0.67 | 1.00 | 0.67 | 1.00 | 1.19 | 1.00 | 1.19 | 1.00 |
| 2010 | PANALP. | 4.86 | 1.00 | 4.86 | 1.00 | Const. | 4.86 | 1.00 | 4.86 | 1.00 | Const. | 1.19 | 1.00 | 1.19 | 1.00 | 0.66 | 1.00 | 0.66 | 1.00 |
| 2012 | PANALP. | 1.00 | 1.00 | 1.00 | 1.00 | Const. | 1.00 | 1.00 | 1.00 | 1.00 | Const. | 1.08 | 1.00 | 1.08 | 1.00 | 0.84 | 1.00 | 0.84 | 1.00 |
| 2013 | PANALP. | 1.00 | 1.00 | 1.00 | 1.00 | Const. | 1.00 | 1.00 | 1.00 | 1.00 | Const. | 0.84 | 1.00 | 0.84 | 1.00 | 1.06 | 1.00 | 1.06 | 1.00 |
| 2014 | PANALP. | 1.00 | 1.00 | 1.00 | 1.00 | Const. | 1.00 | 1.00 | 1.00 | 1.00 | Const. | 1.15 | 1.00 | 1.15 | 1.00 | 1.16 | 1.00 | 1.16 | 1.00 |
| 2015 | PANALP. | 1.00 | 1.00 | 1.00 | 1.00 | Const. | 0.98 | 1.00 | 0.98 | 1.00 | Const. | 1.06 | 1.00 | 1.06 | 1.00 | 1.07 | 1.00 | 1.07 | 1.00 |
| (B) Calculation Run V–VIII with 5% Minimum Weight Restrictions | |||||||||||||||||||
| (V) | VRS | 2 In. | (VI) | VRS | 1 In. | (VII) | CRS | 2 In. | (VIII) | CRS | 1 In. | ||||||||
| Year | LSP | Malm. Index | Catch. | Front. | Score | Scale | Malm. Index | Catch. | Front. | Score | Scale | Malm. Index | Catch. | Front. | Score | Malm. Index | Catch. | Front. | Score |
| 2006 | DB | 1.00 | Cons. | 1.00 | Cons. | 0.99 | 1.00 | ||||||||||||
| 2007 | DB | 1.05 | 1.00 | 1.05 | 1.00 | Cons. | 1.05 | 1.00 | 1.05 | 1.00 | Cons. | 1.01 | 1.01 | 1.00 | 1.00 | 1.02 | 1.00 | 1.02 | 1.00 |
| 2008 | DB | 0.91 | 1.00 | 0.91 | 1.00 | Cons. | 0.90 | 1.00 | 0.90 | 1.00 | Cons. | 0.94 | 1.00 | 0.94 | 1.00 | 0.93 | 1.00 | 0.93 | 1.00 |
| 2009 | DB | 0.90 | 1.00 | 0.90 | 1.00 | Cons. | 0.91 | 1.00 | 0.91 | 1.00 | Cons. | 0.93 | 1.00 | 0.93 | 1.00 | 0.94 | 1.00 | 0.94 | 1.00 |
| 2010 | DB | 1.09 | 1.00 | 1.09 | 1.00 | Cons. | 1.09 | 1.00 | 1.09 | 1.00 | Cons. | 1.02 | 1.00 | 1.02 | 1.00 | 1.02 | 1.00 | 1.02 | 1.00 |
| 2011 | DB | 1.11 | 1.00 | 1.11 | 1.00 | Cons. | 1.10 | 1.00 | 1.10 | 1.00 | Cons. | 1.07 | 1.00 | 1.07 | 1.00 | 1.06 | 1.00 | 1.06 | 1.00 |
| 2012 | DB | 1.08 | 1.00 | 1.08 | 1.00 | Cons. | 1.07 | 1.00 | 1.07 | 1.00 | Cons. | 1.07 | 1.00 | 1.07 | 1.00 | 1.06 | 1.00 | 1.06 | 1.00 |
| 2013 | DB | 0.91 | 1.00 | 0.91 | 1.00 | Cons. | 0.91 | 1.00 | 0.91 | 1.00 | Cons. | 0.91 | 1.00 | 0.91 | 1.00 | 0.91 | 1.00 | 0.91 | 1.00 |
| 2014 | DB | 0.94 | 0.96 | 0.98 | 0.96 | Incr. | 0.95 | 0.99 | 0.96 | 0.99 | Incr. | 0.94 | 0.96 | 0.98 | 0.96 | 0.95 | 0.99 | 0.97 | 0.99 |
| 2015 | DB | 0.91 | 1.04 | 0.88 | 0.99 | Decr. | 0.89 | 1.01 | 0.89 | 1.00 | Cons. | 0.90 | 1.03 | 0.88 | 0.98 | 0.90 | 1.01 | 0.89 | 1.00 |
| 2006 | DHL | 1.00 | Cons. | 1.00 | Cons. | 0.79 | 0.81 | ||||||||||||
| 2007 | DHL | 1.02 | 1.00 | 1.02 | 1.00 | Cons. | 1.02 | 1.00 | 1.02 | 1.00 | Cons. | 1.17 | 1.16 | 1.01 | 0.91 | 1.17 | 1.17 | 1.01 | 0.94 |
| 2008 | DHL | 0.69 | 1.00 | 0.69 | 1.00 | Cons. | 0.69 | 1.00 | 0.69 | 1.00 | Cons. | 0.93 | 1.04 | 0.89 | 0.95 | 0.94 | 1.05 | 0.89 | 0.99 |
| 2009 | DHL | 1.05 | 1.00 | 1.05 | 1.00 | Cons. | 1.08 | 1.00 | 1.08 | 1.00 | Cons. | 1.11 | 0.94 | 1.18 | 0.89 | 1.12 | 0.93 | 1.20 | 0.92 |
| 2010 | DHL | 1.55 | 1.00 | 1.55 | 1.00 | Cons. | 1.56 | 1.00 | 1.56 | 1.00 | Cons. | 1.07 | 1.12 | 0.95 | 1.00 | 1.06 | 1.09 | 0.97 | 1.00 |
| 2011 | DHL | 1.19 | 1.00 | 1.19 | 1.00 | Cons. | 1.19 | 1.00 | 1.19 | 1.00 | Cons. | 1.08 | 1.00 | 1.08 | 1.00 | 1.09 | 1.00 | 1.09 | 1.00 |
| 2012 | DHL | 1.08 | 1.00 | 1.08 | 1.00 | Cons. | 1.02 | 1.00 | 1.02 | 1.00 | Cons. | 0.99 | 1.00 | 0.99 | 1.00 | 0.98 | 1.00 | 0.98 | 1.00 |
| 2013 | DHL | 1.05 | 1.00 | 1.05 | 1.00 | Cons. | 1.06 | 1.00 | 1.06 | 1.00 | Cons. | 1.06 | 1.00 | 1.06 | 1.00 | 1.06 | 1.00 | 1.06 | 1.00 |
| 2014 | DHL | 1.02 | 1.00 | 1.02 | 1.00 | Cons. | 1.02 | 1.00 | 1.02 | 1.00 | Cons. | 1.00 | 1.00 | 1.00 | 1.00 | 1.00 | 1.00 | 1.00 | 1.00 |
| 2015 | DHL | 0.92 | 1.00 | 0.92 | 1.00 | Cons. | 0.92 | 1.00 | 0.92 | 1.00 | Cons. | 0.90 | 1.00 | 0.90 | 1.00 | 0.89 | 1.00 | 0.89 | 1.00 |
| 2006 | DSV | 1.00 | Cons. | 1.00 | Cons. | 1.00 | 1.00 | ||||||||||||
| 2007 | DSV | 1.10 | 1.00 | 1.10 | 1.00 | Cons. | 1.12 | 1.00 | 1.12 | 1.00 | Cons. | 1.09 | 1.03 | 1.06 | 1.00 | 0.95 | 0.95 | 1.00 | 0.93 |
| 2008 | DSV | 1.00 | 1.00 | 1.00 | 1.00 | Cons. | 1.02 | 1.00 | 1.02 | 1.00 | Cons. | 0.90 | 1.00 | 0.90 | 1.00 | 1.00 | 1.08 | 0.93 | 1.00 |
| 2009 | DSV | 0.61 | 0.79 | 0.77 | 0.79 | Incr. | 0.62 | 0.79 | 0.78 | 0.79 | Incr. | 0.68 | 0.71 | 0.96 | 0.71 | 0.73 | 0.69 | 1.05 | 0.69 |
| 2010 | DSV | 1.28 | 1.26 | 1.01 | 1.00 | Cons. | 1.37 | 1.26 | 1.08 | 1.00 | Cons. | 1.41 | 1.40 | 1.00 | 1.00 | 1.30 | 1.45 | 0.90 | 1.00 |
| 2011 | DSV | 0.98 | 1.00 | 0.98 | 1.00 | Cons. | 0.99 | 1.00 | 0.99 | 1.00 | Cons. | 0.96 | 0.90 | 1.06 | 0.90 | 0.95 | 0.81 | 1.17 | 0.81 |
| 2012 | DSV | 0.96 | 1.00 | 0.96 | 1.00 | Cons. | 0.93 | 1.00 | 0.93 | 1.00 | Cons. | 1.05 | 1.11 | 0.95 | 1.00 | 1.03 | 1.16 | 0.89 | 0.93 |
| 2013 | DSV | 1.03 | 1.00 | 1.03 | 1.00 | Cons. | 1.03 | 1.00 | 1.03 | 1.00 | Cons. | 1.01 | 1.00 | 1.01 | 1.00 | 1.00 | 1.05 | 0.96 | 0.98 |
| 2014 | DSV | 0.93 | 1.00 | 0.93 | 1.00 | Cons. | 0.91 | 1.00 | 0.91 | 1.00 | Cons. | 0.97 | 0.92 | 1.06 | 0.92 | 0.96 | 0.93 | 1.03 | 0.91 |
| 2015 | DSV | 1.05 | 1.00 | 1.05 | 1.00 | Cons. | 1.05 | 1.00 | 1.05 | 1.00 | Cons. | 1.06 | 1.08 | 0.98 | 1.00 | 1.07 | 1.10 | 0.97 | 1.00 |
| 2006 | KÜHNE | 1.00 | Cons. | 1.00 | Cons. | 1.00 | 1.00 | ||||||||||||
| 2007 | KÜHNE | 1.14 | 1.00 | 1.14 | 1.00 | Cons. | 1.14 | 1.00 | 1.14 | 1.00 | Cons. | 1.02 | 1.01 | 1.01 | 1.00 | 1.02 | 1.01 | 1.01 | 1.00 |
| 2008 | KÜHNE | 1.74 | 1.00 | 1.74 | 1.00 | Cons. | 1.68 | 1.00 | 1.68 | 1.00 | Cons. | 1.51 | 1.00 | 1.51 | 1.00 | 1.46 | 1.00 | 1.46 | 1.00 |
| 2009 | KÜHNE | 0.77 | 1.00 | 0.77 | 1.00 | Cons. | 0.82 | 1.00 | 0.82 | 1.00 | Cons. | 0.77 | 1.00 | 0.77 | 1.00 | 0.86 | 1.00 | 0.86 | 1.00 |
| 2010 | KÜHNE | 1.06 | 1.00 | 1.06 | 1.00 | Cons. | 1.06 | 1.00 | 1.06 | 1.00 | Cons. | 1.10 | 1.00 | 1.10 | 1.00 | 1.10 | 1.00 | 1.10 | 1.00 |
| 2011 | KÜHNE | 1.32 | 1.00 | 1.32 | 1.00 | Cons. | 1.38 | 1.00 | 1.38 | 1.00 | Cons. | 1.30 | 1.00 | 1.30 | 1.00 | 1.36 | 1.00 | 1.36 | 1.00 |
| 2012 | KÜHNE | 1.06 | 1.00 | 1.06 | 1.00 | Cons. | 1.05 | 1.00 | 1.05 | 1.00 | Cons. | 1.07 | 1.00 | 1.07 | 1.00 | 1.07 | 1.00 | 1.07 | 1.00 |
| 2013 | KÜHNE | 1.03 | 1.00 | 1.03 | 1.00 | Cons. | 1.03 | 1.00 | 1.03 | 1.00 | Cons. | 1.03 | 1.00 | 1.03 | 1.00 | 1.03 | 1.00 | 1.03 | 1.00 |
| 2014 | KÜHNE | 1.26 | 1.00 | 1.26 | 1.00 | Cons. | 1.26 | 1.00 | 1.26 | 1.00 | Cons. | 1.25 | 1.00 | 1.25 | 1.00 | 1.25 | 1.00 | 1.25 | 1.00 |
| 2015 | KÜHNE | 1.16 | 1.00 | 1.16 | 1.00 | Cons. | 1.17 | 1.00 | 1.17 | 1.00 | Cons. | 1.16 | 1.00 | 1.16 | 1.00 | 1.16 | 1.00 | 1.16 | 1.00 |
| 2006 | PANALP. | 1.00 | Cons. | 1.00 | Cons. | 1.00 | 1.00 | ||||||||||||
| 2007 | PANALP. | 1.18 | 1.00 | 1.18 | 1.00 | Cons. | 1.19 | 1.00 | 1.19 | 1.00 | Cons. | 1.15 | 1.00 | 1.15 | 1.00 | 1.15 | 1.00 | 1.15 | 1.00 |
| 2008 | PANALP. | 1.00 | 1.00 | 1.00 | 1.00 | Cons. | 1.04 | 1.00 | 1.04 | 1.00 | Cons. | 0.90 | 1.00 | 0.90 | 1.00 | 0.85 | 1.00 | 0.85 | 1.00 |
| 2009 | PANALP. | 0.46 | 1.00 | 0.46 | 1.00 | Cons. | 0.64 | 1.00 | 0.64 | 1.00 | Cons. | 0.89 | 1.00 | 0.89 | 1.00 | 0.90 | 1.00 | 0.90 | 1.00 |
| 2010 | PANALP. | 1.00 | 1.00 | 1.00 | 1.00 | Cons. | 1.00 | 1.00 | 1.00 | 1.00 | Cons. | 0.68 | 1.00 | 0.68 | 1.00 | 0.66 | 1.00 | 0.66 | 1.00 |
| 2011 | PANALP. | 3.19 | 1.00 | 3.19 | 1.00 | Cons. | 3.66 | 1.00 | 3.66 | 1.00 | Cons. | 1.17 | 1.00 | 1.17 | 1.00 | 1.18 | 1.00 | 1.18 | 1.00 |
| 2012 | PANALP. | 1.00 | 1.00 | 1.00 | 1.00 | Cons. | 1.00 | 1.00 | 1.00 | 1.00 | Cons. | 0.85 | 1.00 | 0.85 | 1.00 | 0.85 | 1.00 | 0.85 | 1.00 |
| 2013 | PANALP. | 1.00 | 1.00 | 1.00 | 1.00 | Cons. | 1.00 | 1.00 | 1.00 | 1.00 | Cons. | 1.08 | 1.00 | 1.08 | 1.00 | 1.06 | 1.00 | 1.06 | 1.00 |
| 2014 | PANALP. | 1.00 | 1.00 | 1.00 | 1.00 | Cons. | 1.00 | 1.00 | 1.00 | 1.00 | Cons. | 1.14 | 1.00 | 1.14 | 1.00 | 1.14 | 1.00 | 1.14 | 1.00 |
| 2015 | PANALP. | 1.00 | 1.00 | 1.00 | 1.00 | Cons. | 0.98 | 1.00 | 0.98 | 1.00 | Cons. | 1.05 | 1.00 | 1.05 | 1.00 | 1.07 | 1.00 | 1.07 | 1.00 |
| (C) Calculation Run IX–XII with 10% Minimum Weight Restrictions | |||||||||||||||||||
| IX | VRS | 2 In. | X | VRS | 1 In. | XI | CRS | 2 In. | XII | CRS | 1 In. | ||||||||
| Year | LSP | Malm. Index | Catch. | Front. | Score | Scale | Malm. Index | Catch. | Front. | Score | Scale | Malm. Index | Catch. | Front. | Score | Malm. Index | Catch. | Front. | Score |
| 2006 | DB | 1.00 | Cons. | 1.00 | Cons. | 0.57 | 0.62 | ||||||||||||
| 2007 | DB | 1.06 | 1.00 | 1.06 | 1.00 | Cons. | 1.06 | 1.00 | 1.06 | 1.00 | Cons. | 1.01 | 1.09 | 0.92 | 0.62 | 1.00 | 1.09 | 0.92 | 0.68 |
| 2008 | DB | 0.92 | 1.00 | 0.92 | 1.00 | Cons. | 0.92 | 1.00 | 0.92 | 1.00 | Cons. | 0.98 | 1.13 | 0.87 | 0.70 | 0.97 | 1.13 | 0.86 | 0.77 |
| 2009 | DB | 0.91 | 1.00 | 0.91 | 1.00 | Cons. | 0.92 | 1.00 | 0.92 | 1.00 | Cons. | 0.93 | 1.03 | 0.90 | 0.72 | 0.94 | 1.02 | 0.92 | 0.79 |
| 2010 | DB | 1.09 | 1.00 | 1.09 | 1.00 | Cons. | 1.09 | 1.00 | 1.09 | 1.00 | Cons. | 0.99 | 1.27 | 0.78 | 0.91 | 0.99 | 1.27 | 0.78 | 1.00 |
| 2012 | DB | 1.08 | 1.00 | 1.08 | 1.00 | Cons. | 1.11 | 1.00 | 1.11 | 1.00 | Cons. | 1.02 | 0.80 | 1.28 | 0.73 | 1.01 | 0.79 | 1.27 | 0.79 |
| 2011 | DB | 1.13 | 1.00 | 1.13 | 1.00 | Cons. | 1.07 | 1.00 | 1.07 | 1.00 | Cons. | 1.08 | 1.33 | 0.81 | 0.97 | 1.06 | 1.26 | 0.84 | 1.00 |
| 2013 | DB | 0.91 | 0.94 | 0.96 | 0.94 | Decr. | 0.92 | 1.00 | 0.92 | 1.00 | Cons. | 0.87 | 0.91 | 0.96 | 0.88 | 0.89 | 0.96 | 0.92 | 0.96 |
| 2014 | DB | 0.95 | 0.96 | 0.99 | 0.90 | Decr. | 0.94 | 0.94 | 1.00 | 0.94 | Decr. | 0.94 | 0.87 | 1.09 | 0.76 | 0.94 | 0.87 | 1.09 | 0.83 |
| 2015 | DB | 0.94 | 1.02 | 0.92 | 0.92 | Decr. | 0.92 | 1.04 | 0.89 | 0.98 | Decr. | 0.94 | 0.99 | 0.95 | 0.75 | 0.94 | 0.98 | 0.95 | 0.82 |
| 2006 | DHL | 1.00 | Cons. | 1.00 | Cons. | 0.43 | 0.46 | ||||||||||||
| 2007 | DHL | 1.01 | 1.00 | 1.01 | 1.00 | Cons. | 1.01 | 1.00 | 1.01 | 1.00 | Cons. | 1.15 | 1.17 | 0.98 | 0.51 | 1.16 | 1.18 | 0.99 | 0.54 |
| 2008 | DHL | 0.70 | 1.00 | 0.70 | 1.00 | Cons. | 0.70 | 1.00 | 0.70 | 1.00 | Cons. | 0.77 | 1.04 | 0.73 | 0.53 | 0.78 | 1.05 | 0.75 | 0.57 |
| 2009 | DHL | 1.06 | 1.00 | 1.06 | 1.00 | Cons. | 1.08 | 1.00 | 1.08 | 1.00 | Cons. | 1.11 | 0.95 | 1.16 | 0.50 | 1.13 | 0.94 | 1.20 | 0.54 |
| 2010 | DHL | 1.51 | 1.00 | 1.51 | 1.00 | Cons. | 1.54 | 1.00 | 1.54 | 1.00 | Cons. | 1.34 | 1.34 | 1.00 | 0.67 | 1.33 | 1.35 | 0.99 | 0.72 |
| 2012 | DHL | 1.07 | 1.00 | 1.07 | 1.00 | Cons. | 1.19 | 1.00 | 1.19 | 1.00 | Cons. | 1.11 | 0.94 | 1.18 | 0.64 | 1.11 | 0.94 | 1.19 | 0.68 |
| 2011 | DHL | 1.18 | 1.00 | 1.18 | 1.00 | Cons. | 1.02 | 1.00 | 1.02 | 1.00 | Cons. | 1.02 | 1.27 | 0.80 | 0.81 | 1.00 | 1.27 | 0.79 | 0.86 |
| 2013 | DHL | 1.05 | 1.00 | 1.05 | 1.00 | Cons. | 1.06 | 1.00 | 1.06 | 1.00 | Cons. | 1.07 | 0.95 | 1.13 | 0.77 | 1.07 | 0.95 | 1.13 | 0.82 |
| 2014 | DHL | 1.02 | 1.00 | 1.02 | 1.00 | Cons. | 1.02 | 1.00 | 1.02 | 1.00 | Cons. | 1.00 | 0.85 | 1.18 | 0.65 | 1.00 | 0.85 | 1.18 | 0.69 |
| 2015 | DHL | 0.93 | 1.00 | 0.93 | 1.00 | Cons. | 0.93 | 1.00 | 0.93 | 1.00 | Cons. | 0.92 | 1.00 | 0.92 | 0.65 | 0.92 | 1.00 | 0.92 | 0.69 |
| 2006 | DSV | 1.00 | Cons. | 1.00 | Cons. | 1.00 | 1.00 | ||||||||||||
| 2007 | DSV | 1.04 | 1.00 | 1.04 | 1.00 | Cons. | 1.06 | 1.00 | 1.06 | 1.00 | Cons. | 1.13 | 1.10 | 1.03 | 1.00 | 0.97 | 0.97 | 1.00 | 0.90 |
| 2008 | DSV | 0.99 | 1.00 | 0.99 | 1.00 | Cons. | 1.02 | 1.00 | 1.02 | 1.00 | Cons. | 0.91 | 1.00 | 0.90 | 1.00 | 1.01 | 1.10 | 0.92 | 0.99 |
| 2009 | DSV | 0.58 | 0.73 | 0.79 | 0.73 | Incr. | 0.62 | 0.73 | 0.86 | 0.73 | Incr. | 0.65 | 0.69 | 0.95 | 0.69 | 0.70 | 0.67 | 1.04 | 0.67 |
| 2010 | DSV | 1.45 | 1.37 | 1.05 | 1.00 | Cons. | 1.33 | 1.37 | 0.97 | 1.00 | Cons. | 1.44 | 1.46 | 0.99 | 1.00 | 1.33 | 1.48 | 0.90 | 0.99 |
| 2012 | DSV | 1.01 | 1.11 | 0.92 | 1.00 | Cons. | 0.97 | 0.90 | 1.08 | 0.90 | Incr. | 0.96 | 0.84 | 1.14 | 0.84 | 0.95 | 0.79 | 1.20 | 0.78 |
| 2011 | DSV | 0.97 | 0.90 | 1.07 | 0.90 | Incr. | 0.98 | 1.11 | 0.88 | 1.00 | Cons. | 1.05 | 1.19 | 0.88 | 1.00 | 1.03 | 1.15 | 0.90 | 0.89 |
| 2013 | DSV | 1.02 | 1.00 | 1.02 | 1.00 | Cons. | 1.02 | 1.00 | 1.02 | 1.00 | Cons. | 1.00 | 0.93 | 1.08 | 0.93 | 1.00 | 1.03 | 0.97 | 0.92 |
| 2014 | DSV | 0.95 | 1.00 | 0.95 | 1.00 | Cons. | 0.93 | 1.00 | 0.93 | 1.00 | Cons. | 0.97 | 0.92 | 1.06 | 0.85 | 0.96 | 0.91 | 1.05 | 0.84 |
| 2015 | DSV | 1.06 | 1.00 | 1.06 | 1.00 | Cons. | 1.06 | 1.00 | 1.06 | 1.00 | Cons. | 1.06 | 1.15 | 0.92 | 0.98 | 1.07 | 1.19 | 0.90 | 1.00 |
| 2006 | KÜHNE | 1.00 | Cons. | 1.00 | Cons. | 0.87 | 0.88 | ||||||||||||
| 2007 | KÜHNE | 1.13 | 1.00 | 1.13 | 1.00 | Cons. | 1.13 | 1.00 | 1.13 | 1.00 | Cons. | 1.02 | 0.99 | 1.02 | 0.86 | 1.02 | 1.00 | 1.02 | 0.86 |
| 2008 | KÜHNE | 1.67 | 1.00 | 1.67 | 1.00 | Cons. | 1.62 | 1.00 | 1.62 | 1.00 | Cons. | 1.55 | 1.17 | 1.33 | 1.00 | 1.51 | 1.16 | 1.30 | 1.00 |
| 2009 | KÜHNE | 0.79 | 1.00 | 0.79 | 1.00 | Cons. | 0.83 | 1.00 | 0.83 | 1.00 | Cons. | 0.78 | 1.00 | 0.78 | 1.00 | 0.87 | 1.00 | 0.87 | 1.00 |
| 2010 | KÜHNE | 1.08 | 1.00 | 1.08 | 1.00 | Cons. | 1.07 | 1.00 | 1.07 | 1.00 | Cons. | 1.07 | 1.00 | 1.07 | 1.00 | 1.03 | 1.00 | 1.03 | 1.00 |
| 2012 | KÜHNE | 1.06 | 1.00 | 1.06 | 1.00 | Cons. | 1.34 | 1.00 | 1.34 | 1.00 | Cons. | 1.31 | 1.00 | 1.31 | 1.00 | 1.38 | 1.00 | 1.38 | 1.00 |
| 2011 | KÜHNE | 1.27 | 1.00 | 1.27 | 1.00 | Cons. | 1.05 | 1.00 | 1.05 | 1.00 | Cons. | 1.05 | 1.00 | 1.05 | 1.00 | 1.03 | 1.00 | 1.03 | 1.00 |
| 2013 | KÜHNE | 1.02 | 1.00 | 1.02 | 1.00 | Cons. | 1.02 | 1.00 | 1.02 | 1.00 | Cons. | 1.03 | 1.00 | 1.03 | 1.00 | 1.03 | 1.00 | 1.03 | 1.00 |
| 2014 | KÜHNE | 1.24 | 1.00 | 1.24 | 1.00 | Cons. | 1.24 | 1.00 | 1.24 | 1.00 | Cons. | 1.29 | 1.00 | 1.29 | 1.00 | 1.29 | 1.00 | 1.29 | 1.00 |
| 2015 | KÜHNE | 1.15 | 1.00 | 1.15 | 1.00 | Cons. | 1.15 | 1.00 | 1.15 | 1.00 | Cons. | 1.22 | 0.99 | 1.24 | 0.99 | 1.22 | 0.99 | 1.23 | 0.99 |
| 2006 | PANALP. | 1.00 | Cons. | 1.00 | Cons. | 1.00 | 1.00 | ||||||||||||
| 2007 | PANALP. | 1.17 | 1.00 | 1.17 | 1.00 | Cons. | 1.17 | 1.00 | 1.17 | 1.00 | Cons. | 1.13 | 1.00 | 1.13 | 1.00 | 1.13 | 1.00 | 1.13 | 1.00 |
| 2008 | PANALP. | 1.00 | 1.00 | 1.00 | 1.00 | Cons. | 1.03 | 1.00 | 1.03 | 1.00 | Cons. | 0.90 | 1.00 | 0.90 | 1.00 | 0.86 | 1.00 | 0.86 | 1.00 |
| 2009 | PANALP. | 0.53 | 1.00 | 0.53 | 1.00 | Cons. | 0.66 | 1.00 | 0.66 | 1.00 | Cons. | 0.89 | 1.00 | 0.89 | 1.00 | 0.91 | 1.00 | 0.91 | 1.00 |
| 2010 | PANALP. | 1.00 | 1.00 | 1.00 | 1.00 | Cons. | 1.00 | 1.00 | 1.00 | 1.00 | Cons. | 0.69 | 1.00 | 0.69 | 1.00 | 0.67 | 1.00 | 0.67 | 1.00 |
| 2012 | PANALP. | 1.00 | 1.00 | 1.00 | 1.00 | Cons. | 3.13 | 1.00 | 3.13 | 1.00 | Cons. | 1.16 | 1.00 | 1.16 | 1.00 | 1.17 | 1.00 | 1.17 | 1.00 |
| 2011 | PANALP. | 2.62 | 1.00 | 2.62 | 1.00 | Cons. | 1.00 | 1.00 | 1.00 | 1.00 | Cons. | 0.86 | 1.00 | 0.86 | 1.00 | 0.86 | 1.00 | 0.86 | 1.00 |
| 2013 | PANALP. | 1.00 | 1.00 | 1.00 | 1.00 | Cons. | 1.00 | 1.00 | 1.00 | 1.00 | Cons. | 1.08 | 1.00 | 1.08 | 1.00 | 1.06 | 1.00 | 1.06 | 1.00 |
| 2014 | PANALP. | 1.00 | 1.00 | 1.00 | 1.00 | Cons. | 1.00 | 1.00 | 1.00 | 1.00 | Cons. | 1.13 | 1.00 | 1.13 | 1.00 | 1.13 | 1.00 | 1.13 | 1.00 |
| 2015 | PANALP. | 1.00 | 1.00 | 1.00 | 1.00 | Cons. | 0.98 | 1.00 | 0.98 | 1.00 | Cons. | 1.05 | 1.00 | 1.05 | 1.00 | 1.06 | 1.00 | 1.06 | 1.00 |
| (D) Calculation Run V–VIII with 15% Minimum Weight Restrictions | |||||||||||||||||||
| (XIII) | VRS | 2 In. | (XIV) | VRS | 1 In. | (XV) | CRS | 2 In. | (XVI) | CRS | 1 In. | ||||||||
| Year | LSP | Malm. Index | Catch. | Front. | Score | Scale | Malm. Index | Catch. | Front. | Score | Scale | Malm. Index | Catch. | Front. | Score | Malm. Index | Catch. | Front. | Score |
| 2006 | DB | 1.00 | Cons. | 1.00 | Cons. | 0.37 | 0.43 | ||||||||||||
| 2007 | DB | 1.07 | 1.00 | 1.07 | 1.00 | Cons. | 1.06 | 1.00 | 1.06 | 1.00 | Cons. | 1.02 | 1.11 | 0.92 | 0.41 | 1.01 | 1.11 | 0.92 | 0.48 |
| 2008 | DB | 0.94 | 1.00 | 0.94 | 1.00 | Cons. | 0.93 | 1.00 | 0.93 | 1.00 | Cons. | 0.96 | 1.11 | 0.86 | 0.45 | 0.95 | 1.11 | 0.85 | 0.53 |
| 2009 | DB | 0.91 | 1.00 | 0.91 | 1.00 | Cons. | 0.92 | 1.00 | 0.92 | 1.00 | Cons. | 0.98 | 0.97 | 1.01 | 0.44 | 1.00 | 0.96 | 1.04 | 0.51 |
| 2010 | DB | 1.10 | 1.00 | 1.10 | 1.00 | Cons. | 1.09 | 1.00 | 1.09 | 1.00 | Cons. | 1.00 | 1.25 | 0.80 | 0.55 | 0.99 | 1.25 | 0.79 | 0.64 |
| 2011 | DB | 1.14 | 0.99 | 1.16 | 0.99 | Decr. | 1.12 | 1.00 | 1.12 | 1.00 | Cons. | 1.03 | 0.89 | 1.16 | 0.49 | 1.02 | 0.88 | 1.15 | 0.56 |
| 2012 | DB | 1.08 | 1.01 | 1.06 | 1.00 | Cons. | 1.07 | 1.00 | 1.07 | 1.00 | Cons. | 1.07 | 1.18 | 0.90 | 0.58 | 1.06 | 1.18 | 0.90 | 0.67 |
| 2013 | DB | 0.90 | 0.86 | 1.05 | 0.86 | Decr. | 0.92 | 0.94 | 0.98 | 0.94 | Decr. | 0.87 | 0.95 | 0.92 | 0.55 | 0.88 | 0.95 | 0.92 | 0.56 |
| 2014 | DB | 1.01 | 1.02 | 0.99 | 0.88 | Decr. | 0.95 | 0.95 | 0.99 | 0.90 | Decr. | 1.01 | 0.92 | 1.09 | 0.50 | 1.01 | 0.92 | 1.10 | 0.58 |
| 2015 | DB | 0.96 | 0.99 | 0.97 | 0.87 | Decr. | 0.95 | 1.03 | 0.92 | 0.93 | Decr. | 0.97 | 1.00 | 0.97 | 0.50 | 0.97 | 1.00 | 0.97 | 0.58 |
| 2006 | DHL | 1.00 | Cons. | 1.00 | Cons. | 0.28 | 0.31 | ||||||||||||
| 2007 | DHL | 1.01 | 1.00 | 1.01 | 1.00 | Cons. | 1.01 | 1.00 | 1.01 | 1.00 | Cons. | 1.13 | 1.17 | 0.97 | 0.33 | 1.15 | 1.18 | 0.97 | 0.37 |
| 2008 | DHL | 0.71 | 1.00 | 0.71 | 1.00 | Cons. | 0.71 | 1.00 | 0.71 | 1.00 | Cons. | 0.66 | 1.04 | 0.64 | 0.35 | 0.67 | 1.05 | 0.63 | 0.39 |
| 2009 | DHL | 1.08 | 1.00 | 1.08 | 1.00 | Cons. | 1.09 | 1.00 | 1.09 | 1.00 | Cons. | 1.10 | 0.96 | 1.15 | 0.33 | 1.15 | 0.95 | 1.21 | 0.37 |
| 2010 | DHL | 1.48 | 1.00 | 1.48 | 1.00 | Cons. | 1.51 | 1.00 | 1.51 | 1.00 | Cons. | 1.53 | 1.23 | 1.24 | 0.41 | 1.52 | 1.25 | 1.22 | 0.46 |
| 2011 | DHL | 1.17 | 1.00 | 1.17 | 1.00 | Cons. | 1.18 | 1.00 | 1.18 | 1.00 | Cons. | 1.13 | 1.04 | 1.08 | 0.43 | 1.13 | 1.03 | 1.09 | 0.47 |
| 2012 | DHL | 1.07 | 1.00 | 1.07 | 1.00 | Cons. | 1.02 | 1.00 | 1.02 | 1.00 | Cons. | 1.03 | 1.16 | 0.88 | 0.49 | 1.00 | 1.15 | 0.87 | 0.54 |
| 2013 | DHL | 1.05 | 1.00 | 1.05 | 1.00 | Cons. | 1.05 | 1.00 | 1.05 | 1.00 | Cons. | 1.06 | 0.98 | 1.07 | 0.49 | 1.07 | 0.99 | 1.08 | 0.54 |
| 2014 | DHL | 1.01 | 1.00 | 1.01 | 1.00 | Cons. | 1.01 | 1.00 | 1.01 | 1.00 | Cons. | 1.00 | 0.89 | 1.12 | 0.43 | 1.00 | 0.89 | 1.12 | 0.48 |
| 2015 | DHL | 0.94 | 1.00 | 0.94 | 1.00 | Cons. | 0.94 | 1.00 | 0.94 | 1.00 | Cons. | 0.92 | 1.01 | 0.91 | 0.44 | 0.92 | 1.01 | 0.91 | 0.48 |
| 2006 | DSV | 1.00 | Cons. | 1.00 | Cons. | 1.00 | 1.00 | ||||||||||||
| 2007 | DSV | 0.94 | 0.93 | 1.01 | 0.93 | Decr. | 1.01 | 1.00 | 1.01 | 1.00 | Cons. | 1.12 | 1.09 | 1.03 | 0.93 | 1.00 | 0.99 | 1.01 | 0.88 |
| 2008 | DSV | 0.92 | 1.08 | 0.86 | 1.00 | Cons. | 1.02 | 1.00 | 1.02 | 1.00 | Cons. | 0.94 | 1.08 | 0.87 | 1.00 | 1.01 | 1.11 | 0.92 | 0.97 |
| 2009 | DSV | 0.58 | 0.67 | 0.87 | 0.67 | Incr. | 0.58 | 0.68 | 0.86 | 0.68 | Incr. | 0.62 | 0.66 | 0.95 | 0.66 | 0.68 | 0.66 | 1.02 | 0.64 |
| 2010 | DSV | 1.53 | 1.50 | 1.02 | 1.00 | Cons. | 1.44 | 1.48 | 0.97 | 1.00 | Cons. | 1.44 | 1.45 | 1.00 | 0.95 | 1.33 | 1.44 | 0.92 | 0.93 |
| 2011 | DSV | 0.96 | 0.81 | 1.19 | 0.81 | Incr. | 0.96 | 0.82 | 1.18 | 0.82 | Incr. | 0.96 | 0.83 | 1.16 | 0.78 | 0.96 | 0.81 | 1.18 | 0.76 |
| 2012 | DSV | 1.03 | 1.24 | 0.83 | 1.00 | Cons. | 1.01 | 1.22 | 0.82 | 1.00 | Cons. | 1.04 | 1.16 | 0.90 | 0.91 | 1.03 | 1.14 | 0.90 | 0.86 |
| 2013 | DSV | 1.01 | 1.00 | 1.01 | 1.00 | Cons. | 1.01 | 1.00 | 1.01 | 1.00 | Cons. | 1.00 | 0.94 | 1.07 | 0.85 | 1.00 | 0.98 | 1.02 | 0.84 |
| 2014 | DSV | 0.95 | 0.87 | 1.10 | 0.87 | Incr. | 0.94 | 0.91 | 1.03 | 0.91 | Incr. | 0.97 | 0.93 | 1.05 | 0.79 | 0.96 | 0.92 | 1.04 | 0.78 |
| 2015 | DSV | 1.06 | 1.05 | 1.01 | 0.91 | Incr. | 1.07 | 1.08 | 0.99 | 0.98 | Incr. | 1.05 | 1.12 | 0.94 | 0.88 | 1.06 | 1.16 | 0.92 | 0.90 |
| 2006 | KÜHNE | 1.00 | Cons. | 1.00 | Cons. | 0.72 | 0.74 | ||||||||||||
| 2007 | KÜHNE | 1.12 | 1.00 | 1.12 | 1.00 | Cons. | 1.12 | 1.00 | 1.12 | 1.00 | Cons. | 1.02 | 0.99 | 1.04 | 0.71 | 1.02 | 0.99 | 1.03 | 0.72 |
| 2008 | KÜHNE | 1.60 | 1.00 | 1.60 | 1.00 | Cons. | 1.57 | 1.00 | 1.57 | 1.00 | Cons. | 1.60 | 1.25 | 1.28 | 0.89 | 1.55 | 1.25 | 1.24 | 0.91 |
| 2009 | KÜHNE | 0.81 | 1.00 | 0.81 | 1.00 | Cons. | 0.84 | 1.00 | 0.84 | 1.00 | Cons. | 0.83 | 1.01 | 0.82 | 1.00 | 0.93 | 1.00 | 0.93 | 0.91 |
| 2010 | KÜHNE | 1.10 | 1.00 | 1.10 | 1.00 | Cons. | 1.09 | 1.00 | 1.09 | 1.00 | Cons. | 1.03 | 1.11 | 0.93 | 1.00 | 0.98 | 1.10 | 0.89 | 1.00 |
| 2011 | KÜHNE | 1.23 | 1.00 | 1.23 | 1.00 | Cons. | 1.29 | 1.00 | 1.29 | 1.00 | Cons. | 1.20 | 0.84 | 1.43 | 0.84 | 1.23 | 0.81 | 1.52 | 0.81 |
| 2012 | KÜHNE | 1.06 | 1.00 | 1.06 | 1.00 | Cons. | 1.05 | 1.00 | 1.05 | 1.00 | Cons. | 1.03 | 1.16 | 0.89 | 0.97 | 1.01 | 1.20 | 0.84 | 0.98 |
| 2013 | KÜHNE | 1.02 | 1.00 | 1.02 | 1.00 | Cons. | 1.02 | 1.00 | 1.02 | 1.00 | Cons. | 1.09 | 0.89 | 1.23 | 0.86 | 1.09 | 0.89 | 1.22 | 0.87 |
| 2014 | KÜHNE | 1.21 | 1.00 | 1.21 | 1.00 | Cons. | 1.21 | 1.00 | 1.21 | 1.00 | Cons. | 1.20 | 0.91 | 1.31 | 0.79 | 1.20 | 0.92 | 1.31 | 0.80 |
| 2015 | KÜHNE | 1.13 | 1.00 | 1.13 | 1.00 | Cons. | 1.14 | 1.00 | 1.14 | 1.00 | Cons. | 1.17 | 0.93 | 1.25 | 0.74 | 1.16 | 0.93 | 1.25 | 0.74 |
| 2006 | PANALP. | 1.00 | Cons. | 1.00 | Cons. | 1.00 | 1.00 | ||||||||||||
| 2007 | PANALP. | 1.15 | 1.00 | 1.15 | 1.00 | Cons. | 1.15 | 1.00 | 1.15 | 1.00 | Cons. | 1.12 | 1.00 | 1.12 | 1.00 | 1.12 | 1.00 | 1.12 | 1.00 |
| 2008 | PANALP. | 1.00 | 1.00 | 1.00 | 1.00 | Cons. | 1.03 | 1.00 | 1.03 | 1.00 | Cons. | 0.91 | 1.00 | 0.91 | 1.00 | 0.87 | 1.00 | 0.87 | 1.00 |
| 2009 | PANALP. | 0.59 | 1.00 | 0.59 | 1.00 | Cons. | 0.68 | 1.00 | 0.68 | 1.00 | Cons. | 0.89 | 1.00 | 0.89 | 1.00 | 0.92 | 1.00 | 0.92 | 1.00 |
| 2010 | PANALP. | 1.00 | 1.00 | 1.00 | 1.00 | Cons. | 1.00 | 1.00 | 1.00 | 1.00 | Cons. | 0.70 | 1.00 | 0.70 | 1.00 | 0.68 | 1.00 | 0.68 | 1.00 |
| 2011 | PANALP. | 2.32 | 1.00 | 2.32 | 1.00 | Cons. | 2.82 | 1.00 | 2.82 | 1.00 | Cons. | 1.14 | 1.00 | 1.14 | 1.00 | 1.16 | 1.00 | 1.16 | 1.00 |
| 2012 | PANALP. | 1.00 | 1.00 | 1.00 | 1.00 | Cons. | 1.00 | 1.00 | 1.00 | 1.00 | Cons. | 0.87 | 1.00 | 0.87 | 1.00 | 0.87 | 1.00 | 0.87 | 1.00 |
| 2013 | PANALP. | 1.00 | 1.00 | 1.00 | 1.00 | Cons. | 1.00 | 1.00 | 1.00 | 1.00 | Cons. | 1.07 | 1.00 | 1.07 | 1.00 | 1.05 | 1.00 | 1.05 | 1.00 |
| 2014 | PANALP. | 0.99 | 1.00 | 0.99 | 1.00 | Cons. | 0.99 | 1.00 | 0.99 | 1.00 | Cons. | 1.12 | 1.00 | 1.12 | 1.00 | 1.12 | 1.00 | 1.12 | 1.00 |
| 2015 | PANALP. | 1.00 | 1.00 | 1.00 | 1.00 | Cons. | 0.98 | 1.00 | 0.98 | 1.00 | Cons. | 1.04 | 1.00 | 1.04 | 1.00 | 1.05 | 1.00 | 1.05 | 1.00 |
References
- Abbasi, M.; Nilsson, F. Developing environmentally sustainable logistics Exploring themes and challenges from a logistics service providers’ perspective. Transp. Res. Part D 2016, 46, 273–283. [Google Scholar] [CrossRef]
- Govindan, K.; Soleimani, H. A review of reverse logistics and closed-loop supply chains: A Journal of Cleaner Production focus. J. Clean. Prod. 2017, 142, 371–384. [Google Scholar] [CrossRef]
- Colicchia, C.; Marchet, G.; Melacini, M.; Perotti, S. Building environmental sustainability: Empirical evidence from Logistics Service Providers. J. Clean. Prod. 2013, 59, 197–209. [Google Scholar] [CrossRef]
- Kamga, C.; Yazici, A. Achieving environmental sustainability beyond technological improvements: Potential role of high-speed rail in the United States of America. Transp. Res. Part D 2014, 31, 148–164. [Google Scholar] [CrossRef]
- Davarzani, H.; Fahimnia, B.; Bell, M.; Sarkis, J. Greening ports and maritime logistics: A review. Transp. Res. Part D 2016, 48, 473–487. [Google Scholar] [CrossRef]
- Brix-Asala, C.; Hahn, R.; Seuring, S. Reverse logistics and informal valorisation at the Base of the Pyramid: A case study on sustainability synergies and trade-offs. Eur. Manag. J. 2016, 34, 414–423. [Google Scholar] [CrossRef]
- Lee, C.K.M.; Lee Lam, J.S. Managing reverse logistics to enhance sustainability of industrial marketing. Ind. Mark. Manag. 2012, 41, 589–598. [Google Scholar] [CrossRef]
- Deutsche Post DHL. Smart Logistics—2015 Annual Report; Deutsche Post AG: Bonn, Germany, 2016. [Google Scholar]
- Kühne + Nagel. Annual Report 2015—Tradition and Innovation; Kühne + Nagel: Schindellegi, Switzerland, 2016. [Google Scholar]
- A.P. Moeller Maersk A/S. Annual Report 2015; A.P. Moeller Maersk A/S: Copenhagen, Denmark, 2016. [Google Scholar]
- Higgins, C.; Coffey, B. Improving how sustainability reports drive change: A critical discourse analysis. J. Clean. Prod. 2016, 136, 18–29. [Google Scholar] [CrossRef]
- Kuzey, C.; Uyar, C. Determinants of sustainability reporting and its impact on firm value: Evidence from the emerging market of Turkey. J. Clean. Prod. 2017, 143, 27–39. [Google Scholar] [CrossRef]
- Eroglu, C.; Kurt, A.C.; Elwakil, O.S. Stock market reaction to quality, safety, and sustainability awards in logistics. J. Bus. Logist. 2016, 37, 329–345. [Google Scholar] [CrossRef]
- Busse, C.; Kach, A.P.; Bode, C. Sustainability and the False Sense of Legitimacy: How Institutional Distance Augments Risk in Global Supply Chains. J. Bus. Logist. 2016, 37, 312–328. [Google Scholar] [CrossRef]
- Tate, W.L.; Dooley, K.J.; Ellram, L.M. Transaction cost and institutional drivers of supplier adoption of environmental practices. J. Bus. Logist. 2011, 32, 6–16. [Google Scholar] [CrossRef]
- Dijkema, G.P.J.; Ferra, P.; Herder, P.M.; Heitor, M. Trends and opportunities framing innovation for sustainability in the learning society. Technol. Forecast. Soc. Chang. 2006, 73, 215–227. [Google Scholar] [CrossRef]
- Heiskala, M.; Jokinen, J.-P.; Tinnilä, M. Crowdsensing-based transportation services—An analysis from business model and sustainability viewpoints. Res. Transp. Bus. Manag. 2016, 18, 38–48. [Google Scholar] [CrossRef]
- Grandia, J. Finding the missing link: Examining the mediating role of sustainable public procurement behavior. J. Clean. Prod. 2016, 124, 183–190. [Google Scholar] [CrossRef]
- Al-Rawahy, K.H. Engineering Education and Sustainable Development: The Missing Link. Procedia Soc. Behav. Sci. 2013, 102, 392–401. [Google Scholar] [CrossRef]
- Kuhn, M.A.; Kuhn, P.; Villeval, M.C. Decision-Environment Effects on Intertemporal Financial Choices: How Relevant are Resource-Depletion Models? J. Econ. Behav. Organ. 2017, 137, 72–89. [Google Scholar] [CrossRef]
- Rimos, S.; Hoadley, A.F.A.; Brennan, D.J. Environmental consequence analysis for resource depletion. Process Saf. Environ. Prot. 2014, 9, 849–861. [Google Scholar] [CrossRef]
- Siano, A.; Vollero, A.; Conte, F.; Amabile, S. ‘More than words’: Expanding the taxonomy of greenwashing after the Volkswagen scandal. J. Bus. Res. 2017, 71, 27–37. [Google Scholar] [CrossRef]
- Mahoney, L.S.; Thorne, L.; Cecil, L.; LaGore, W. A research note on standalone corporate social responsibility reports: Signaling or greenwashing? Crit. Perspect. Account. 2013, 24, 350–359. [Google Scholar] [CrossRef]
- Charnes, A.; Cooper, W.W.; Rhodes, E.L. Measuring the efficiency of decision making units. Eur. J. Oper. Res. 1978, 2, 429–444. [Google Scholar] [CrossRef]
- Banker, R.D.; Charnes, A.; Cooper, W.W. Some models for estimating technical and scale inefficiencies in data envelopment analysis. Manag. Sci. 1984, 30, 1078–1092. [Google Scholar] [CrossRef]
- Marchetti, D.; Wanke, P. Brazil’s rail freight transport: Efficiency analysis using two-stage DEA and cluster-driven public policies. Socio-Econ. Plan. Sci. 2016. [Google Scholar] [CrossRef]
- Olfat, L.; Amiri, M.; Soufi, J.B.; Pishdar, M. A dynamic network efficiency measurement of airports performance considering sustainable development concept: A fuzzy dynamic network-DEA approach. J. Air Transp. Manag. 2016, 57, 272–290. [Google Scholar] [CrossRef]
- Wanke, P.; Barros, C.P.; Nwaogbe, O.R. Assessing productive efficiency in Nigerian airports using Fuzzy-DEA. Transp. Policy 2016, 49, 9–19. [Google Scholar] [CrossRef]
- Zhao, Y.; Triantis, K.; Murray-Tuite, P.; Edara, P. Performance measurement of a transportation network with a downtown space reservation system: A network-DEA approach. Transp. Res. Part E 2011, 47, 1140–1159. [Google Scholar] [CrossRef]
- Min, H.; Joo, S.J. Benchmarking the operational efficiency of third party logistics providers using data envelopment analysis. Supply Chain Manag. Int. J. 2006, 11, 259–265. [Google Scholar] [CrossRef]
- Malmquist, S. Index numbers and indifference surfaces. Trab. Estad. Investig. Oper. 1953, 42, 209–242. [Google Scholar] [CrossRef]
- Grifell-Tatje, E.; Lovell, C.A.K.; Pastor, J.T. A quasi-Malmquist productivity index. J. Product. Anal. 1998, 10, 7–20. [Google Scholar] [CrossRef]
- Wang, Y.-M.; Lan, Y.-X. Measuring Malmquist productivity index: A new approach based on double frontiers data envelopment analysis. Math. Comput. Model. 2011, 54, 2760–2771. [Google Scholar] [CrossRef]
- Örkcü, H.H.; Baklikci, C.; Dogan, M.; Genc, A. An evaluation of the operational efficiency of Turkish airports using data envelopment analysis and the Malmquist productivity index: 2009–2014 case. Transp. Policy 2016, 48, 92–104. [Google Scholar] [CrossRef]
- Ahn, Y.-H.; Min, H. Evaluating the multi-period operating efficiency of international airports using data envelopment analysis and the Malmquist productivity index. J. Air Transp. Manag. 2014, 39, 12–22. [Google Scholar] [CrossRef]
- De Nicola, A.; Gitto, S.; Mancuso, P. Airport quality and productivity changes: A Malmquist index decomposition assessment. Transp. Res. Part E 2013, 58, 67–75. [Google Scholar] [CrossRef]
- Pires, H.M.; Fernandes, E. Malmquist financial efficiency analysis for airlines. Transp. Res. Part E 2012, 48, 1049–1055. [Google Scholar] [CrossRef]
- Arabi, B.; Munisamy, S.; Emrouznejad, A.; Shadman, F. Power industry restructuring and eco-efficiency changes: A new slacks-based model in Malmquist-Luenberger Index measurement. Energy Policy 2014, 68, 132–145. [Google Scholar] [CrossRef]
- Chang, D.-S.; Kuo, L.R.; Chen, Y. Industrial changes in corporate sustainability performance—An empirical overview using data envelopment analysis. J. Clean. Prod. 2013, 56, 147–155. [Google Scholar] [CrossRef]
- Lin, E.Y.-Y.; Chen, P.-Y.; Chen, C.-C. Measuring green productivity of country: A generalized metafrontier Malmquist productivity index approach. Energy 2013, 55, 340–353. [Google Scholar]
- Von Carlowitz, H.-C. Sylvicultura Oeconomica; J.F. Braun: Leipzig, Germany, 1713. [Google Scholar]
- Meadows, D.H.; Meadows, D.L.; Randers, J.; Behrens, W.W. The Limits to Growth; Universe Books: New York, NY, USA, 1972. [Google Scholar]
- Brundtlandt, G.M. Our Common Future; World Commission on Environment and Development: New York, NY, USA, 1988. [Google Scholar]
- Kates, R.W.; Clark, W.C.; Corell, R.; Hall, M.; Jaeger, C.C.; Lowe, I.; McCarthy, J.J.; Schellnhuber, H.J.; Bolin, B.; Dickson, N.M.; et al. Sustainability Science. Science 2001, 292, 641–642. [Google Scholar] [CrossRef] [PubMed]
- Holden, E.; Linnerud, K.; Banister, D. Sustainable development: Our Common Future revisited. Glob. Environ. Chang. 2014, 26, 130–139. [Google Scholar] [CrossRef]
- Sneddon, C.; Howarth, R.B.; Norgaard, R.B. Sustainable development in a post-Brundtland world. Ecol. Econ. 2006, 57, 253–268. [Google Scholar] [CrossRef]
- Robinson, J. Squaring the circle? Some thoughts on the idea of sustainable development. Ecol. Econ. 2004, 48, 369–384. [Google Scholar] [CrossRef]
- Brockhaus, S.; Fawcett, S.E.; Knemeyer, A.M.; Fawcett, A.M. Motivations for environmental and social consciousness: Reevaluating the sustainability-based view. J. Clean. Prod. 2017, 143, 933–947. [Google Scholar] [CrossRef]
- Chang, R.-D.; Zuo, J.; Zhao, Z.-Y.; Zillante, G.; Gan, X.-L.; Soebarto, V. Evolving theories of sustainability and firms: History, future directions and implications for renewable energy research. Renew. Sustain. Energy Rev. 2017, 72, 48–56. [Google Scholar] [CrossRef]
- European Commission. Reducing Emissions from Transport. Available online: http://ec.europa.eu/clima/policies/transport/index_en.htm (accessed on 9 February 2017).
- European Environmental Agency (EEA). Greenhouse Gas Emissions from Transport. Available online: http://www.eea.europa.eu/data-and-maps/indicators/transport-emissions-of-greenhouse-gases/transport-emissions-of-greenhouse-gases-6 (accessed on 9 February 2017).
- Levallois, C. Can de-growth be considered a policy option? A historical note on Nicholas Georgescu-Roegen and the Club of Rome. Ecol. Econ. 2010, 69, 2271–2278. [Google Scholar] [CrossRef]
- European Commission. Roadmap to a Single European Transport. Area—Towards a Competitive and Resource Efficient Transport System; COM(2011)144 Final; European Commission: Brussels, Belgium, 2011. [Google Scholar]
- Oltean-Dumbrava, C.; Watts, G.; Miah, A. Towards a more sustainable surface transport infrastructure: A case study of applying multi criteria analysis techniques to assess the sustainability of transport noise reducing devices. J. Clean. Prod. 2016, 112, 2922–2934. [Google Scholar] [CrossRef]
- Zheng, Y.; Liao, H.; Yang, X. Stochastic Pricing and Order Model with Transportation Mode Selection for Low-Carbon Retailers. Sustainability 2016, 8, 48. [Google Scholar] [CrossRef]
- Postorino, M.N.; Mantecchini, L. A transport carbon footprint methodology to assess airport carbon emissions. J. Air Transp. Manag. 2014, 37, 76–86. [Google Scholar] [CrossRef]
- Jevons, W.S. The Coal Question: An Inquiry Concerning the Progress of the Nation, and the Probable Exhaustion of Our Coal Mines; Macmillan: London, UK, 1865. [Google Scholar]
- Klumpp, M. To Green or Not to Green: A Political, Economic and Social Analysis for the Past Failure of Green Logistics. Sustainability 2016, 8, 441. [Google Scholar] [CrossRef]
- Sorrell, S. Jevons’ Paradox revisited: The evidence for backfire from improved energy efficiency. Energy Policy 2009, 37, 1456–1469. [Google Scholar] [CrossRef]
- Alcott, B. Jevons’ paradox. Ecol. Econ. 2005, 54, 9–21. [Google Scholar] [CrossRef]
- Deutsche Bahn AG. 2015 Integrated Report—More Quality, More Customers, More Success; Deutsche Bahn AG: Berlin, Germany, 2016. [Google Scholar]
- Elkington, J. Cannibals with Forks—The Triple Bottom Line of 21st Century Business; Capstone: Oxford, UK, 1997. [Google Scholar]
- Akhtar, P.; Tse, Y.K.; Khan, Z.; Rao-Nicholson, R. Data-driven and adaptive leadership contributing to sustainability: Global agri-food supply chains connected with emerging markets. Int. J. Prod. Econ. 2015, 181, 392–401. [Google Scholar] [CrossRef]
- Formentini, M.; Taticchi, P. Corporate sustainability approaches and governance mechanisms in sustainable supply chain management. J. Clean. Prod. 2016, 112, 1920–1933. [Google Scholar] [CrossRef]
- Hansen, T.; Coenen, L. The geography of sustainability transitions: Review, synthesis and reflections on an emergent research field. Environ. Innov. Soc. Trans. 2015, 17, 92–109. [Google Scholar] [CrossRef]
- Alibeyg, A.; Contreras, I.; Fernández, E. Hub network design problems with profits. Transp. Res. Part E 2016, 96, 40–59. [Google Scholar] [CrossRef]
- Li, Y.; Chen, H.; Prins, C. Adaptive large neighborhood search for the pickup and delivery problem with time windows, profits, and reserved requests. Eur. J. Oper. Res. 2016, 252, 27–38. [Google Scholar] [CrossRef]
- Shahraeeni, M.; Ahmed, S.; Malek, K.; Van Drimmelen, B.; Kjeang, E. Life cycle emissions and cost of transportation systems: Case study on diesel and natural gas for light duty trucks in municipal fleet operations. J. Nat. Gas Sci. Eng. 2015, 24, 26–34. [Google Scholar] [CrossRef]
- Köllen, T. Reconceptualizing Profit-Orientation in Management: A Karmic View on ‘Return on Investment’ Calculations. Philos. Manag. 2016, 15, 7–20. [Google Scholar] [CrossRef]
- Arena, M.; Conte, A.; Melancini, M. Linking environmental accounting to reward systems: The case of the Environmental Profit and Loss Account. J. Clean. Prod. 2015, 108, 625–636. [Google Scholar] [CrossRef]
- Shipman, A.S.; Byrne, C.L.; Mumford, M.D. Leader vision formation and forecasting: The effects of forecasting extent, resources, and timeframe. Leadersh. Q. 2010, 21, 439–456. [Google Scholar] [CrossRef]
- Emerson, J. The Blended Value Proposition: Integrating Social and Financial Returns. Calif. Manag. Rev. 2003, 45, 35–51. [Google Scholar] [CrossRef]
- Gambhir, A.; Tse, L.K.C.; Tong, D.; Martinez-Botas, R. Reducing China’s road transport sector CO2 emissions to 2050: Technologies, costs and decomposition analysis. Appl. Energy 2015, 157, 905–917. [Google Scholar] [CrossRef]
- Mwangi, J.K.; Lee, W.-J.; Chang, Y.-C.; Chen, C.-Y.; Wang, L.-C. An overview: Energy saving and pollution reduction by using green fuel blends in diesel engines. Appl. Energy 2015, 159, 214–236. [Google Scholar] [CrossRef]
- Walmsley, M.R.; Walmsley, T.G.; Atkins, M.J.; Kamp, P.J.J.; Neale, J.R.; Chand, A. Carbon Emissions Pinch Analysis for emissions reductions in the New Zealand transport sector through to 2050. Energy 2015, 92, 569–576. [Google Scholar] [CrossRef]
- Gross, W.F.; Hayden, C.; Butz, C. About the impact of rising oil price on logistics networks and transportation greenhouse gas emission. Logist. Res. 2012, 4, 147–156. [Google Scholar] [CrossRef]
- Rahman, S.; Serletis, A. The asymmetric effects of oil price and monetary policy shocks: A nonlinear VAR approach. Energy Econ. 2010, 32, 1460–1466. [Google Scholar] [CrossRef]
- Wilford, A.L. Internal control reporting and accounting standards: A cross-country comparison. J. Account. Public Policy 2016, 35, 276–302. [Google Scholar] [CrossRef]
- Jones, S.; Finley, A. Have IFRS made a difference to intra-country financial reporting diversity? Br. Account. Rev. 2011, 43, 22–38. [Google Scholar] [CrossRef]
- OECD. OECD Data—Exchange Rates. Available online: https://data.oecd.org/conversion/exchange-rates.htm (accessed on 9 February 2017).
- Wang, Z.; He, W. CO2 emissions efficiency and marginal abatement costs of the regional transportation sectors in China. Transp. Res. Part D 2017, 50, 83–97. [Google Scholar] [CrossRef]
- Voytenko, Y.; McCormick, K.; Evans, J.; Schliwa, G. Urban living labs for sustainability and low carbon cities in Europe: Towards a research agenda. J. Clean. Prod. 2016, 123, 45–54. [Google Scholar] [CrossRef]
- Chavez-Baeza, C.; Sheinbaum-Pardo, C. Sustainable passenger road transport scenarios to reduce fuel consumption, air pollutants and GHG (greenhouse gas) emissions in the Mexico City Metropolitan Area. Energy 2014, 66, 624–634. [Google Scholar] [CrossRef]
- Manjunath, A.; Gross, G. Towards a meaningful metric for the quantification of GHG emissions of electric vehicles (EVs). Energy Policy 2017, 102, 423–429. [Google Scholar] [CrossRef]
- Reichert, A.; Holz-Rau, C.; Scheiner, J. GHG emissions in daily travel and long-distance travel in Germany—Social and spatial correlates. Transp. Res. Part D 2016, 49, 25–43. [Google Scholar] [CrossRef]
- World Resources Institute/World Business Council for Sustainable Development. The Greenhouse Gas. Protocol—A Corporate Accounting and Reporting Standard; World Resources Institute/World Business Council for Sustainable Development: Washington, DC, USA; Geneva, Switzerland, 2004. [Google Scholar]
- Luthra, S.; Garg, D.; Haleem, A. An analysis of interactions among critical success factors to implement green supply chain management towards sustainability: An Indian perspective. Resour. Policy 2015, 46, 37–50. [Google Scholar] [CrossRef]
- Lehtonen, M. The environmental-social interface of sustainable development: Capabilities, social capital, institutions. Ecol. Econ. 2004, 49, 199–214. [Google Scholar] [CrossRef]
- Miller, J.W.; Saldanha, J.P. A new look at the longitudinal relationship between motor carrier financial performance and safety. J. Bus. Logist. 2016, 37, 284–306. [Google Scholar] [CrossRef]
- Grund, C. Gender pay gaps among highly educated professionals—Compensation components do matter. Labour Econ. 2015, 34, 118–126. [Google Scholar] [CrossRef]
- Buchanan, T. The Influence of Gender Role Attitudes on Perceptions of Women’s Work Performance and the Importance of Fair Pay. Sociol. Spectr. 2014, 34, 203–221. [Google Scholar] [CrossRef]
- Turker, D.; Altuntas, C. Sustainable supply chain management in the fast fashion industry: An analysis of corporate reports. Eur. Manag. J. 2014, 32, 837–849. [Google Scholar] [CrossRef]
- Panalpina World Transport (Holding) Ltd. 2015 Annual Report; Panalpina World Transport (Holding) Ltd.: Basel, Switzerland, 2016. [Google Scholar]
- Al-Shaer, H.; Zaman, M. Board gender diversity and sustainability reporting quality. J. Contemp. Account. Econ. 2016, 12, 210–222. [Google Scholar] [CrossRef]
- Perryman, A.A.; Fernando, G.D.; Tripathy, A. Do gender differences persist? An examination of gender diversity on firm performance, risk, and executive compensation. J. Bus. Res. 2016, 69, 579–586. [Google Scholar] [CrossRef]
- Wells, P. Diversity, scale and sustainability in human systems: Towards a research agenda. J. Clean. Prod. 2013, 47, 232–235. [Google Scholar] [CrossRef]
- Panalpina World Transport (Holding) Ltd. 2012 Annual Report; Panalpina World Transport (Holding) Ltd.: Basel, Switzerland, 2013. [Google Scholar]
- Kühne + Nagel. Annual Report 2014—Global. Customer-Oriented. Innovative; Kühne + Nagel: Schindellegi, Switzerland, 2015. [Google Scholar]
- Kühne + Nagel. Annual Report 2013—Continuity and Further Development; Kühne + Nagel: Schindellegi, Switzerland, 2014. [Google Scholar]
- Kühne + Nagel. Annual Report 2012—People. Network. Objectives; Kühne + Nagel: Schindellegi, Switzerland, 2013. [Google Scholar]
- Kühne + Nagel. Annual Report 2011—Network and Product Portfolio—Kühne. + Nagel Accelerates Expansion; Kühne + Nagel: Schindellegi, Switzerland, 2012. [Google Scholar]
- Kühne + Nagel. Annual Report 2010; Kühne + Nagel: Schindellegi, Switzerland, 2011. [Google Scholar]
- Kühne + Nagel. Annual Report 2009; Kühne + Nagel: Schindellegi, Switzerland, 2010. [Google Scholar]
- Kühne + Nagel. Annual Report 2008; Kühne + Nagel: Schindellegi, Switzerland, 2009. [Google Scholar]
- Kühne + Nagel. Annual Report 2007; Kühne + Nagel: Schindellegi, Switzerland, 2008. [Google Scholar]
- Kühne + Nagel. Annual Report 2006; Kühne + Nagel: Schindellegi, Switzerland, 2007. [Google Scholar]
- Deutsche Bahn AG 2015. 2014 Integrated Report—Integrated Thinking. Sustainable Action. Long-Term Success; Deutsche Bahn AG: Berlin, Germany, 2015. [Google Scholar]
- Deutsche Bahn AG. 2013 Integrated Report—DB2020: Our Compass, Even in Challenging Times; Deutsche Bahn AG: Berlin, Germany, 2014. [Google Scholar]
- Deutsche Bahn AG. Our Future: Sustainably Successful—Deutsche Bahn. 2012 Annual Report; Deutsche Bahn AG: Berlin, Germany, 2013. [Google Scholar]
- Deutsche Bahn AG. DB Mobility Logistics—2011 Annual Report; Deutsche Bahn AG: Berlin, Germany, 2012. [Google Scholar]
- Deutsche Bahn AG. 2010 Annual Report; Deutsche Bahn AG: Berlin, Germany, 2011. [Google Scholar]
- Deutsche Bahn AG. 2009 Annual Report; Deutsche Bahn AG: Berlin, Germany, 2010. [Google Scholar]
- Deutsche Bahn AG. 2008 Annual Report; Deutsche Bahn AG: Berlin, Germany, 2009. [Google Scholar]
- Deutsche Bahn AG. 2007 Annual Report; Deutsche Bahn AG: Berlin, Germany, 2008. [Google Scholar]
- Deutsche Bahn AG. 2006 Annual Report; Deutsche Bahn AG: Berlin, Germany, 2007. [Google Scholar]
- Deutsche Post DHL. When You Think of Logistics—2014 Annual Report; Deutsche Post AG: Bonn, Germany, 2015. [Google Scholar]
- Deutsche Post DHL. Tailor Made—2013 Annual Report; Deutsche Post AG: Bonn, Germany, 2014. [Google Scholar]
- Deutsche Post DHL. Pioneering Future Markets—2012 Annual Report; Deutsche Post AG: Bonn, Germany, 2013. [Google Scholar]
- Deutsche Post DHL. Simply Grow—2011 Annual Report; Deutsche Post AG: Bonn, Germany, 2012. [Google Scholar]
- Deutsche Post DHL. Being Your Choice—2010 Annual Report; Deutsche Post AG: Bonn, Germany, 2011. [Google Scholar]
- Deutsche Post DHL. Showing Respect, Delivering Results—2009 Annual Report; Deutsche Post AG: Bonn, Germany, 2010. [Google Scholar]
- Deutsche Post DHL. Delivering on the Future—2008 Annual Report; Deutsche Post AG: Bonn, Germany, 2009. [Google Scholar]
- Deutsche Post DHL. Roadmap to Value—2007 Annual Report; Deutsche Post AG: Bonn, Germany, 2008. [Google Scholar]
- Deutsche Post DHL. Building on Our Strategic Strengths—2006 Annual Report; Deutsche Post AG: Bonn, Germany, 2007. [Google Scholar]
- DSV A/S. 2015 Annual Report; DSV A/S: Hedehusene, Denmark, 2016. [Google Scholar]
- DSV A/S. 2014 Annual Report; DSV A/S: Hedehusene, Denmark, 2015. [Google Scholar]
- DSV A/S. 2013 Annual Report; DSV A/S: Hedehusene, Denmark, 2014. [Google Scholar]
- DSV A/S. 2012 Annual Report; DSV A/S: Hedehusene, Denmark, 2013. [Google Scholar]
- DSV A/S. 2011 Annual Report; DSV A/S: Hedehusene, Denmark, 2012. [Google Scholar]
- DSV A/S. 2010 Annual Report; DSV A/S: Hedehusene, Denmark, 2011. [Google Scholar]
- DSV A/S. 2009 Annual Report; DSV A/S: Hedehusene, Denmark, 2010. [Google Scholar]
- DSV A/S. 2008 Annual Report; DSV A/S: Hedehusene, Denmark, 2009. [Google Scholar]
- DSV A/S. 2007 Annual Report; DSV A/S: Hedehusene, Denmark, 2008. [Google Scholar]
- DSV A/S. 2006 Annual Report; DSV A/S: Hedehusene, Denmark, 2007. [Google Scholar]
- Panalpina World Transport (Holding) Ltd. 2014 Annual Report; Panalpina World Transport (Holding) Ltd.: Basel, Switzerland, 2015. [Google Scholar]
- Panalpina World Transport (Holding) Ltd. 2013 Annual Report; Panalpina World Transport (Holding) Ltd.: Basel, Switzerland, 2014. [Google Scholar]
- Panalpina World Transport (Holding) Ltd. 2011 Annual Report; Panalpina World Transport (Holding) Ltd.: Basel, Switzerland, 2012. [Google Scholar]
- Panalpina World Transport (Holding) Ltd. 2010 Annual Report—A Passion for Solutions; Panalpina World Transport (Holding) Ltd.: Basel, Switzerland, 2011. [Google Scholar]
- Panalpina World Transport (Holding) Ltd. 2009 Annual Report—A Passion for Solutions; Panalpina World Transport (Holding) Ltd.: Basel, Switzerland, 2010. [Google Scholar]
- Panalpina World Transport (Holding) Ltd. 2008 Annual Report—A Passion for Solutions; Panalpina World Transport (Holding) Ltd.: Basel, Switzerland, 2009. [Google Scholar]
- Panalpina World Transport (Holding) Ltd. 2007 Annual Report—A Passion for Solutions; Panalpina World Transport (Holding) Ltd.: Basel, Switzerland, 2008. [Google Scholar]
- Panalpina World Transport (Holding) Ltd. 2006 Annual Report—A Passion for Solutions; Panalpina World Transport (Holding) Ltd.: Basel, Switzerland, 2007. [Google Scholar]
- Koopmans, T.C. Analysis of Production as an Efficient Combination of Activities. In Activity Analysis of Production and Allocation: Proceedings of a Conference; Koopmans, T.C., Ed.; Wiley: New York, NY, USA, 1951; pp. 33–97. [Google Scholar]
- Debreu, G. The Coefficient of Resource Utilization. Econometrica 1951, 19, 273–292. [Google Scholar] [CrossRef]
- Farrell, M.J. The Measurement of Productive Efficiency. J. R. Stat. Soc. Ser. A 1957, 120, 253–290. [Google Scholar] [CrossRef]
- Diewert, W.E. Functional Forms for Profit and Transformation Functions. J. Econ. Theory 1973, 6, 284–316. [Google Scholar] [CrossRef]
- Karsak, E.E.; Karadayi, M.A. Imprecise DEA framework for evaluating health care performance of districts. Kybernetes 2017, 46, 706–727. [Google Scholar] [CrossRef]
- Bolli, T.; Olivares, M.; Bonaccorsi, A.; Daraio, C.; Aracil, A.D.; Lepori, B. The differential effects of competitive funding on the production frontier and the efficiency of universities. Econ. Educ. Rev. 2016, 52, 91–104. [Google Scholar] [CrossRef]
- Shwartz, M.; Burgess, J.F.; Zhu, J. A DEA based composite measure of quality and its associated data uncertainty interval for health care provider profiling and pay-for-performance. Eur. J. Oper. Res. 2016, 253, 489–502. [Google Scholar] [CrossRef]
- Hollingsworth, B. Non-Parametric and Parametric Applications Measuring Efficiency in Health Care. Health Care Manag. Sci. 2003, 6, 203–218. [Google Scholar] [CrossRef] [PubMed]
- Bessent, A.M.; Bessent, E.W.; Charnes, A.; Cooper, W.W.; Thorogood, N. Evaluation of educational program proposals by means of DEA. Educ. Adm. Q. 1983, 19, 82–107. [Google Scholar] [CrossRef]
- Cooper, W.W.; Lawrence, M.S.; Tone, K. Data Envelopment Analysis—A Comprehensive Text with Models, Applications, References and DEA-Solver Software; Springer: New York, NY, USA, 2007. [Google Scholar]
- Ding, L.; Yang, Q.; Sun, L.; Tong, J.; Wang, Y. Evaluation of the Capability of Personal Software Process based on Data Envelopment Analysis. In Unifying the Software Process Spectrum; Li, M., Boehm, B., Osterweil, L.J., Eds.; Springer: Berlin/Heidelberg, Germany, 2006; pp. 235–248. [Google Scholar]
- Caves, D.W.; Christensen, L.R.; Diewert, W. The Economic Theory of Index Numbers and the Measurement of Input, Output, and Productivity. Econometrica 1982, 50, 1393–1414. [Google Scholar] [CrossRef]
- Thanassoulis, E.; Shiraz, R.K.; Maniadakis, N. A cost Malmquist productivity index capturing group performance. Eur. J. Oper. Res. 2015, 241, 796–805. [Google Scholar] [CrossRef]
- Emrouznejad, A.; Yang, G. A framework for measuring global Malmquist-Luenberger productivity index with CO2 emissions on Chinese manufacturing industries. Energy 2016, 115, 840–856. [Google Scholar] [CrossRef]
- Sueyoshi, T.; Goto, M. DEA environmental assessment in time horizon: Radial approach for Malmquist index measurement on petroleum companies. Energy Econ. 2015, 51, 329–345. [Google Scholar] [CrossRef]
- Cook, W.D.; Zhu, J. Classifying inputs and outputs in data envelopment analysis. Eur. J. Oper. Res. 2007, 180, 692–699. [Google Scholar] [CrossRef]
- Banker, R.D.; Morey, R.C. Efficiency analysis for exogenously fixed inputs and outputs. Oper. Res. 1985, 34, 513–521. [Google Scholar] [CrossRef]
- Feng, C.; Chu, F.; Ding, J.; Bi, G.; Liang, L. Carbon Emissions Abatement (CEA) allocation and compensation schemes based on DEA. Omega 2015, 53, 78–89. [Google Scholar] [CrossRef]
- Jain, R.K.; Natarajan, R. A DEA study of airlines in India. Asia Pac. Manag. Rev. 2015, 20, 285–292. [Google Scholar] [CrossRef]
- DSV A/S. 2016 Annual Report; DSV A/S: Hedehusene, Denmark, 2017. [Google Scholar]
- Dolinayova, A.; L’och, M.; Camaj, J. Liberalization of the railway freight market in the context of a sustainable transport system. Transp. Res. Procedia 2016, 14, 916–925. [Google Scholar] [CrossRef]
- Bundesnetzagentur. Railway Market. Analysis 2015; Bundesnetzagentur für Elektrizität, Gas, Telekommunikation, Post und Eisenbahnen: Bonn, Germany, 2015. [Google Scholar]
- Nikitinas, V.; Dailydka, S. The models of management of railway companies in the European Union: Holding, the German Experience. Procedia Eng. 2016, 134, 80–88. [Google Scholar] [CrossRef]
- European Commission. Transport: Commission Urges Germany to Comply with EU Rules on the Separation of Accounts in Rail; Press Release as of 20 June 2013; European Commission: Brussels, Belgium, 2013. [Google Scholar]
- Wang, Z.; Lu, M. An empirical study of direct rebound effect for road freight transport in China. Appl. Energy 2014, 133, 274–281. [Google Scholar] [CrossRef]
- Winebrake, J.J.; Green, E.H.; Comer, B.; Corbett, J.J.; Froman, S. Estimating the direct rebound effect for on-road freight transportation. Energy Policy 2012, 48, 252–259. [Google Scholar] [CrossRef]
- Matos, F.J.F.; Silva, F.J.F. The rebound effect on road freight transport: Empirical evidence from Portugal. Energy Policy 2011, 39, 2833–2841. [Google Scholar] [CrossRef]
- Wieland, A.; Handfield, R.B.; Durach, C.F. Mapping the landscape of future research themes in supply chain management. J. Bus. Logist. 2016, 37, 205–212. [Google Scholar] [CrossRef]
- Fawcett, S.E.; Waller, M.A. Supply chain game changers—Mega, nano, and virtual trends—And forces that impede supply chain design. J. Bus. Logist. 2014, 35, 157–164. [Google Scholar] [CrossRef]
- Brockhaus, S.; Kersten, W.; Knemeyer, A.M. Where do we go from here? Progressing sustainability implementation efforts across supply chains. J. Bus. Logist. 2013, 34, 167–182. [Google Scholar] [CrossRef]
- Simoes, P.; Marques, R.C. Influence of regulation on the productivity of waste utilities—What can we learn with the Portuguese experience? Waste Manag. 2012, 32, 1266–1275. [Google Scholar] [CrossRef] [PubMed]
- Vlontzos, G.; Pardalos, P.M. Assess and prognosticate green house gas emissions from agricultural production of EU countries, by implementing, DEA Window analysis and artificial neural networks. Renew. Sustain. Energy Rev. 2017, 76, 155–162. [Google Scholar] [CrossRef]


| Assets (mil. Euro) | Revenue (mil. Euro) | EBIT (mil. Euro) | Dividend Volume (mil. Euro) | GHG Emissions Scope 2 (mil. tonnes CO2) | Employment (FTE) | Women in Management (%) | |
|---|---|---|---|---|---|---|---|
| Min | 1243.02 | 3942.79 | −1979.00 | 0.00 | 38,200.00 | 13,773.00 | 10.00 |
| Max | 56,059.00 | 60,545.00 | 2965.00 | 1087.00 | 23,400,000.00 | 463,350.00 | 20.70 |
| Arith. Mean | 19,124.60 | 23,200.88 | 952.48 | 337.39 | 6,385,365.49 | 161,728.16 | 13.92 |
| Median | 4636.40 | 15,266.49 | 443.16 | 198.81 | 3,260,383.79 | 68,964.50 | 13.50 |
| Std.Dev. | 20,478.07 | 19,354.80 | 1078.47 | 343.51 | 8,289,207.12 | 167,365.53 | 3.84 |
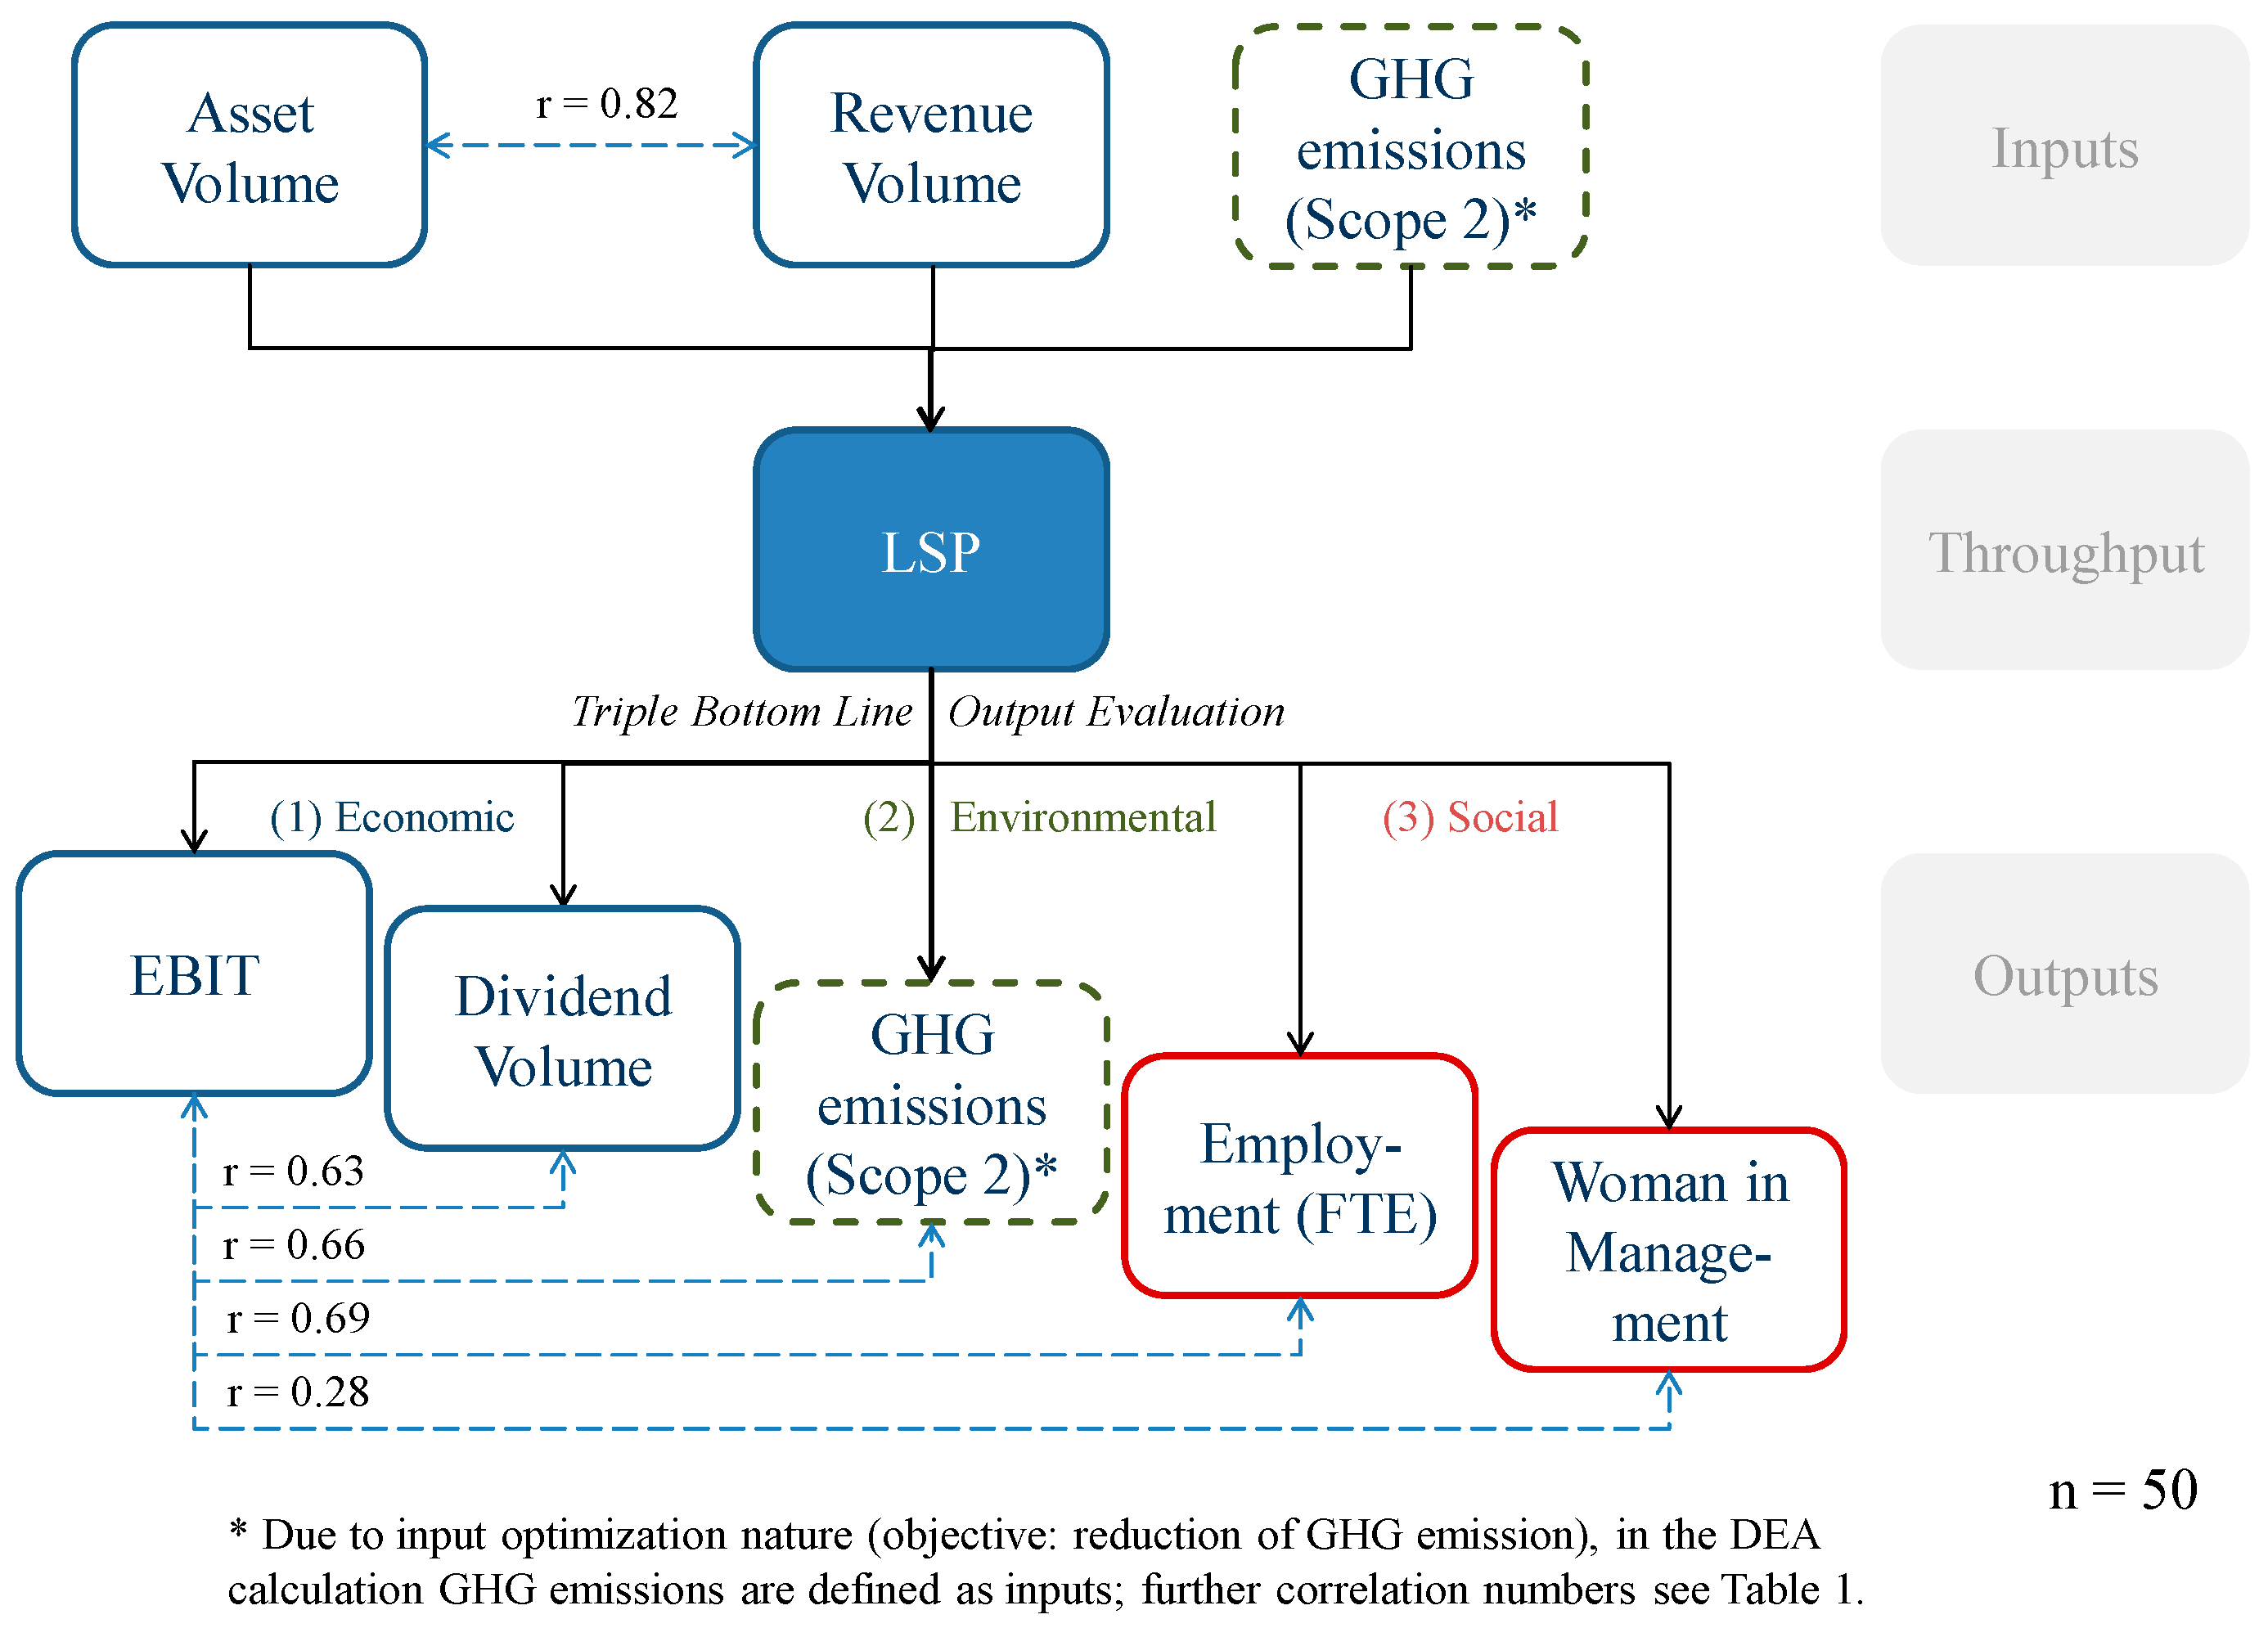
| Correl. Assets | 1.00 | 0.82 | 0.79 | 0.64 | 0.90 | 0.83 | 0.30 |
| Correl. Revenue | 1.00 | 0.72 | 0.92 | 0.51 | 0.99 | 0.34 | |
| Correl. EBIT | 1.00 | 0.63 | 0.66 | 0.69 | 0.28 | ||
| Correl. Dividend | 1.00 | 0.28 | 0.89 | 0.29 | |||
| Correl. GHG | 1.00 | 0.52 | 0,09 | ||||
| Correl. Employment | 1.00 | 0.36 | |||||
| Correl. Women in M. | 1.00 | ||||||
| VRS | (Variable Returns to Scale) | CRS | (Constant Returns to Scale) | |
|---|---|---|---|---|
| Weighting Inputs/Outputs 1 | 2 Inputs | 1 Input | 2 Inputs | 1 Input |
| 0% Weighting—Run | (I) | (II) | (III) | (IV) |
| Arithm. Mean | 99.75% | 99.75% | 99.36% | 98.87% |
| Median | 100.00% | 100.00% | 100.00% | 100.00% |
| Minimum | 87.60% | 87.60% | 74.20% | 71.50% |
| St. Dev. | 1.74% | 1.74% | 3.68% | 4.62% |
| 5% Weighting—Run | (V) | (VI) | (VII) | (VIII) |
| Arithm. Mean | 99.49% | 99.56% | 98.01% | 97.76% |
| Median | 100.00% | 100.00% | 100.00% | 100.00% |
| Minimum | 79.10% | 79.30% | 71.40% | 69.10% |
| St. Dev. | 2.97% | 2.90% | 5.42% | 5.89% |
| 10% Weighting—Run | (IX) | (X) | (XI) | (XII) |
| Arithm. Mean | 98.80% | 99.09% | 85.49% | 87.09% |
| Median | 100.00% | 100.00% | 194.75% | 94.00% |
| Minimum | 72.90% | 72.80% | 43.30% | 45.80% |
| St. Dev. | 4.35% | 4.10% | 17.14% | 15.41% |
| 15% Weighting—Run | (XIII) | (XIV) | (XV) | (XVI) |
| Arithm. Mean | 97.57% | 98.31% | 72.12% | 73.93% |
| Median | 100.00% | 100.00% | 78.60% | 76.50% |
| Minimum | 66.60% | 67.70% | 28.30% | 31.00% |
| St. Dev. | 6.30% | 5.50% | 24.93% | 22.18% |
| Year | Deutsche Bahn Score | Deutsche Bahn Scale | Deutsche Post DHL Score | Deutsche Post DHL Scale | DSV Score | DSV Scale | Kühne + Nagel Score | Kühne + Nagel Scale | Panalpina Score | Panalpina Scale |
|---|---|---|---|---|---|---|---|---|---|---|
| 2006 | 1.00 | Constant | 1.00 | Constant | 1.00 | Constant | 1.00 | Constant | 1.00 | Constant |
| 2007 | 1.00 | Constant | 1.00 | Constant | 0.93 | Decreasing | 1.00 | Constant | 1.00 | Constant |
| 2008 | 1.00 | Constant | 1.00 | Constant | 1.00 | Constant | 1.00 | Constant | 1.00 | Constant |
| 2009 | 1.00 | Constant | 1.00 | Constant | 0.67 | Increasing | 1.00 | Constant | 1.00 | Constant |
| 2010 | 1.00 | Constant | 1.00 | Constant | 1.00 | Constant | 1.00 | Constant | 1.00 | Constant |
| 2011 | 0.99 | Decreasing | 1.00 | Constant | 0.81 | Increasing | 1.00 | Constant | 1.00 | Constant |
| 2012 | 1.00 | Constant | 1.00 | Constant | 1.00 | Constant | 1.00 | Constant | 1.00 | Constant |
| 2013 | 0.86 | Decreasing | 1.00 | Constant | 1.00 | Constant | 1.00 | Constant | 1.00 | Constant |
| 2014 | 0.88 | Decreasing | 1.00 | Constant | 0.87 | Increasing | 1.00 | Constant | 1.00 | Constant |
| 2015 | 0.87 | Decreasing | 1.00 | Constant | 0.91 | Increasing | 1.00 | Constant | 1.00 | Constant |
© 2017 by the author. Licensee MDPI, Basel, Switzerland. This article is an open access article distributed under the terms and conditions of the Creative Commons Attribution (CC BY) license (http://creativecommons.org/licenses/by/4.0/).
Share and Cite
Klumpp, M. Do Forwarders Improve Sustainability Efficiency? Evidence from a European DEA Malmquist Index Calculation. Sustainability 2017, 9, 842. https://doi.org/10.3390/su9050842
Klumpp M. Do Forwarders Improve Sustainability Efficiency? Evidence from a European DEA Malmquist Index Calculation. Sustainability. 2017; 9(5):842. https://doi.org/10.3390/su9050842
Chicago/Turabian StyleKlumpp, Matthias. 2017. "Do Forwarders Improve Sustainability Efficiency? Evidence from a European DEA Malmquist Index Calculation" Sustainability 9, no. 5: 842. https://doi.org/10.3390/su9050842
APA StyleKlumpp, M. (2017). Do Forwarders Improve Sustainability Efficiency? Evidence from a European DEA Malmquist Index Calculation. Sustainability, 9(5), 842. https://doi.org/10.3390/su9050842