1. Introduction
In the context of climate change, mean temperatures are increasing, in particular extreme temperatures, with heat waves becoming more frequent, more intense, and longer lasting. In many cities, extreme heat waves have drastically increased. In an urban center this effect may be up to 10 °C warmer, due to different local environments and atmospheric conditions [
1,
2,
3,
4,
5].
A microclimatic phenomenon called Urban Heat Island (UHI) occurs in the metropolitan areas proportionally to the population size and density of a city. It consists of a significant difference in temperature compared to the rural and/or suburban areas. In particular, some authors have found an increase in average temperatures of 1–2 °C, and sometimes of 5–8 °C [
6,
7,
8,
9,
10]. Currently, increasing industrialization and urbanization have increased this phenomenon and it has recently also been detected in small cities [
11,
12,
13].
Decadal variability and a general tendency for average annual conditions to be warmer and drier characterized the Mediterranean during 1860–2005. Many studies suggest that anthropogenic forcing has characterized aspects of the Mediterranean climate during this period [
14,
15]. In general, observational evidence shows trends in some locations of urban heat islands with a similar or greater magnitude. Increasing greenhouse gas and further urbanization of the global population, which is expected throughout the 21st century, has forced climate change and consequently UHI [
16].
UHI is the important reason that leads to the different spatial distribution of heat waves in a city. This phenomenon is much more relevant in summer and is most readily detected at night [
1,
2,
7]. Moreover, there are many factors that increase the urban heat island in cities, such as: highly absorptive construction materials, low-albedo asphalt pavements, dense vehicular traffic, reduction of green spaces and evaporation surfaces [
17,
18].
Therefore, the location and climate of the surrounding cities and meteorological conditions play an important role in determining the UHI magnitude [
19].
The human responses to climate change are very important through mitigation and adaptation, which can require global, regional and local approaches [
1,
20,
21].
There are various approaches to detect climate variations on local scale. Common methods include the use of climate data and their analysis with satellite imagery or mathematical modelling that compares a climate variable or an indicator between two locations [
2,
22,
23,
24,
25,
26].
Many UHI studies have been conducted using data from satellites, in particular the association of land use on temperatures using Corine Land Cover maps (CLC). In 1985, the Corine programme was initiated in the European Union. CLC was finalized in the early 1990s as part of the European Commission programme to COoRdinate INformation on the Environment (CORINE). It provides consistent, reliable and comparable information on land cover across Europe. The CLC spatial and temporal analysis allows us to define the variations in land cover, directly linked to the UHI phenomena. The CLC system is chosen because of its availability of a harmonized and standardized collection of land cover data, availability of land cover data for a wide range of applications and users, and possibility of a comparison and correlation of land cover classes [
27,
28,
29,
30].
The implementation of the CLC focused mainly on identification and mapping of land cover and land cover changes for more than 25 European countries. CLC has largely been used by planners, policy makers and researchers [
31].
The present study provides an assessment of the local climate variability in recent years and in a long time period versus land cover changes, focusing on the case of Matera city. It can represent a methodological approach to support territorial planning and to improve the assessment of urban-industrial expansion, in terms of development of sustainable practices shaping urban and rural environments.
2. Materials and Methods
2.1. Study Area
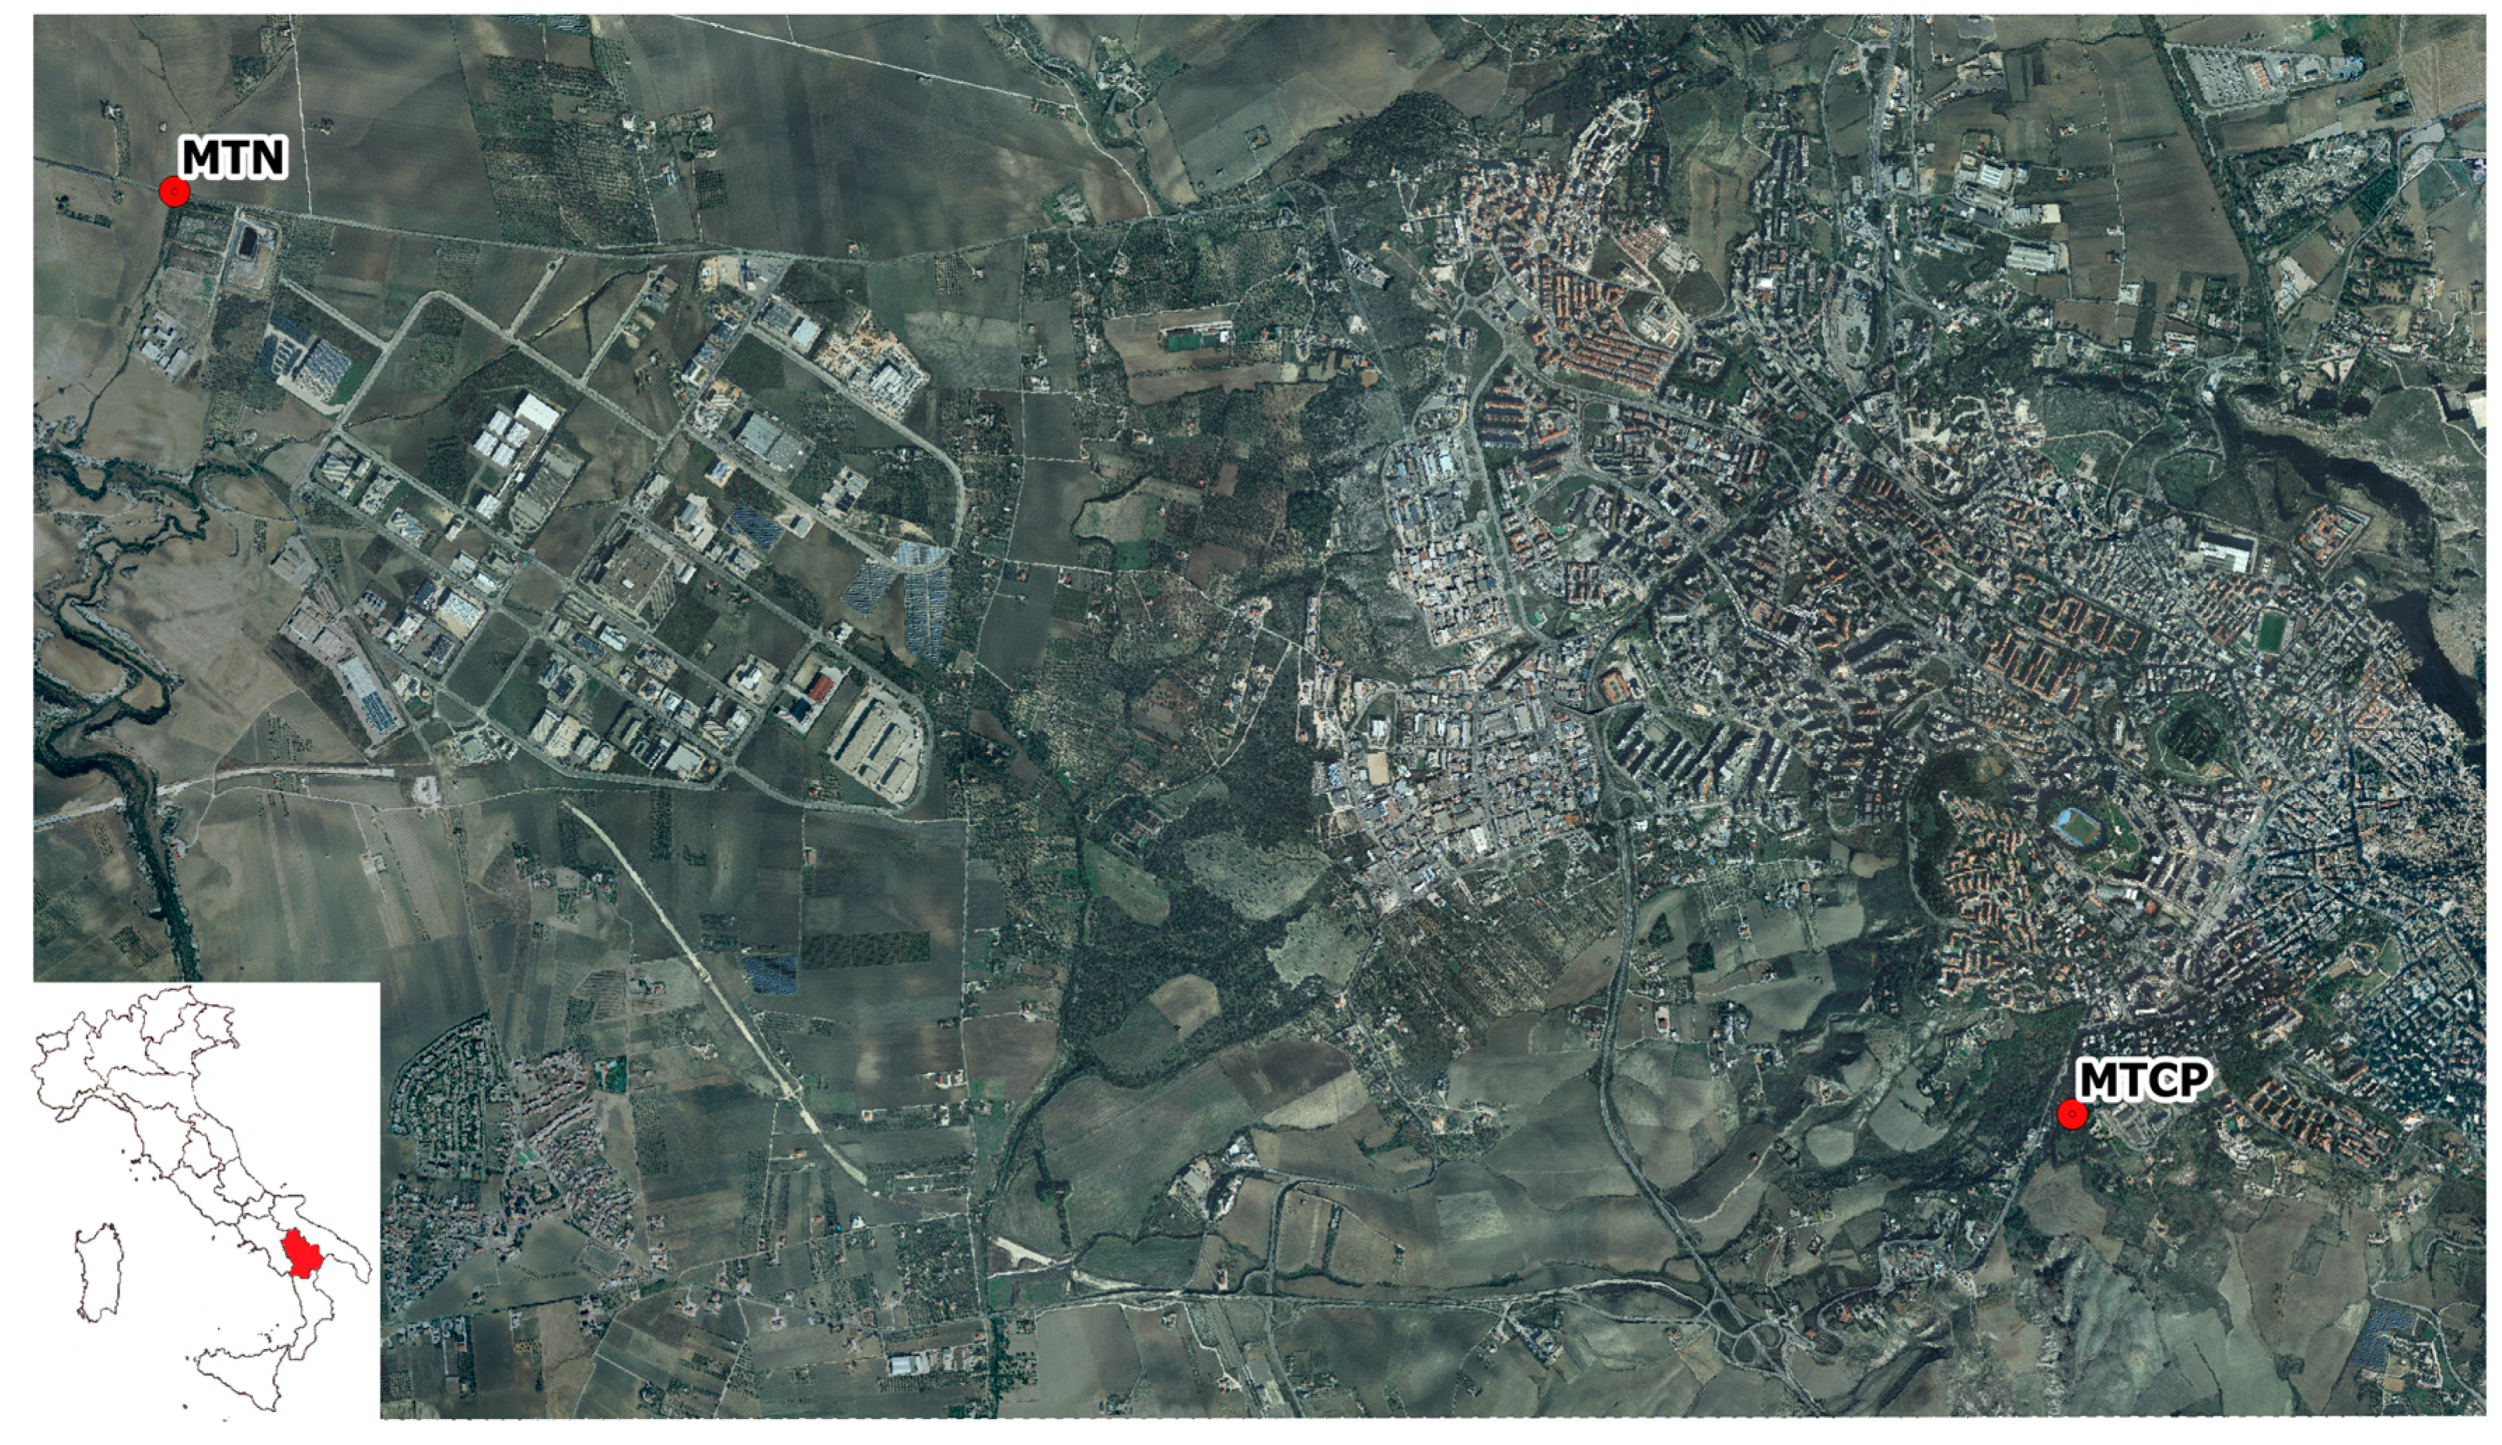
This research focuses on two meteorological stations located in the city of Matera (Basilicata region, Southern Italy).
This zone has a typical Mediterranean climate with mild winters and hot and humid summers.
The urban area of Matera stretches over an area of approximately 390 km2 and has a population of 60,500 inhabitants.
In the Mediterranean area, Matera represents a significant example of vernacular architecture. The structure of the city is articulated by a vertical succession of dug layers sometimes excavated or partly excavated and partly built, according to the original shape and height of the calcarenitic slope. The caves have different types of shapes and an irregular development [
32,
33]. We chose Matera because of its demographic, touristic and economic development. Moreover, Matera has been awarded the international title of the 2019 European Capital of Culture. Matera has attracted more visitors which has caused an increase in fluctuating population, especially in the summer, of approximately 300% from 2000 to 2015.
In this study two meteorological stations were selected: Matera North (MTN) and Matera Civil Protection (MTCP), see
Figure 1.
Table 1 shows the principal characteristics for each station.
2.2. Data
In this study, the maximum temperatures measured in both stations were used. MTN is a historical monitoring station managed by the regional agency for development and innovation in agriculture (Italian acronym—ALSIA). It is located outside the urban area, characterized by the presence of industrial sectors (small and medium enterprises, landfill, etc.). For this station we analyzed daily data from 1989 to 1999 and hourly data from 2000 to 2015. MTCP is a station managed by the National Civil Protection Department located in a park in a residential area (suburban background).
For the MTN and MTCP sites, data of temperature collected each 15 min for the period 2000–2015 are available. For the MTN site, daily data of temperature (minimum and maximum) for the period 1989–1999 are also available.
Furthermore, the distribution of land cover within the meteorological stations was used to develop an understanding of the effect of industrial constructions on maximum temperatures and the relative heat waves during the last 15 years. In order to evaluate the correlation between the increase of maximum temperatures and the land cover changes, the Corine Land Cover (CLC) data in this study with a geometric accuracy of 100 meters were used.
2.3. Data Analysis Procedure
This study is divided into two steps. The first part involves the comparison and the analysis of temperature data detected in the period 2000–2015. Particularly, for both the sites, we determine the series of daily maximum values and the series of daily minimum values. An
h-scatterplot (with
h = 0) was used for representing the differences. In order to evaluate the statistical significance of observed differences, we apply a paired t-test at monthly scale. We determine the differences matrix
in which the generic element is defined as
with
i = 1,
…,
n (
n = 12 months) and
j = 1,
…,
m (
m = 16 years). A
t-test
, confidence level α=5% and freedom degrees = 11 or 15) applied for each row and for each column is able to point out the significant differences between the two sites in terms of interannual variability and seasonality.
The second part includes analysis of thermal anomalies in the period 1989–2012 for the summer season, associated with land cover changes.
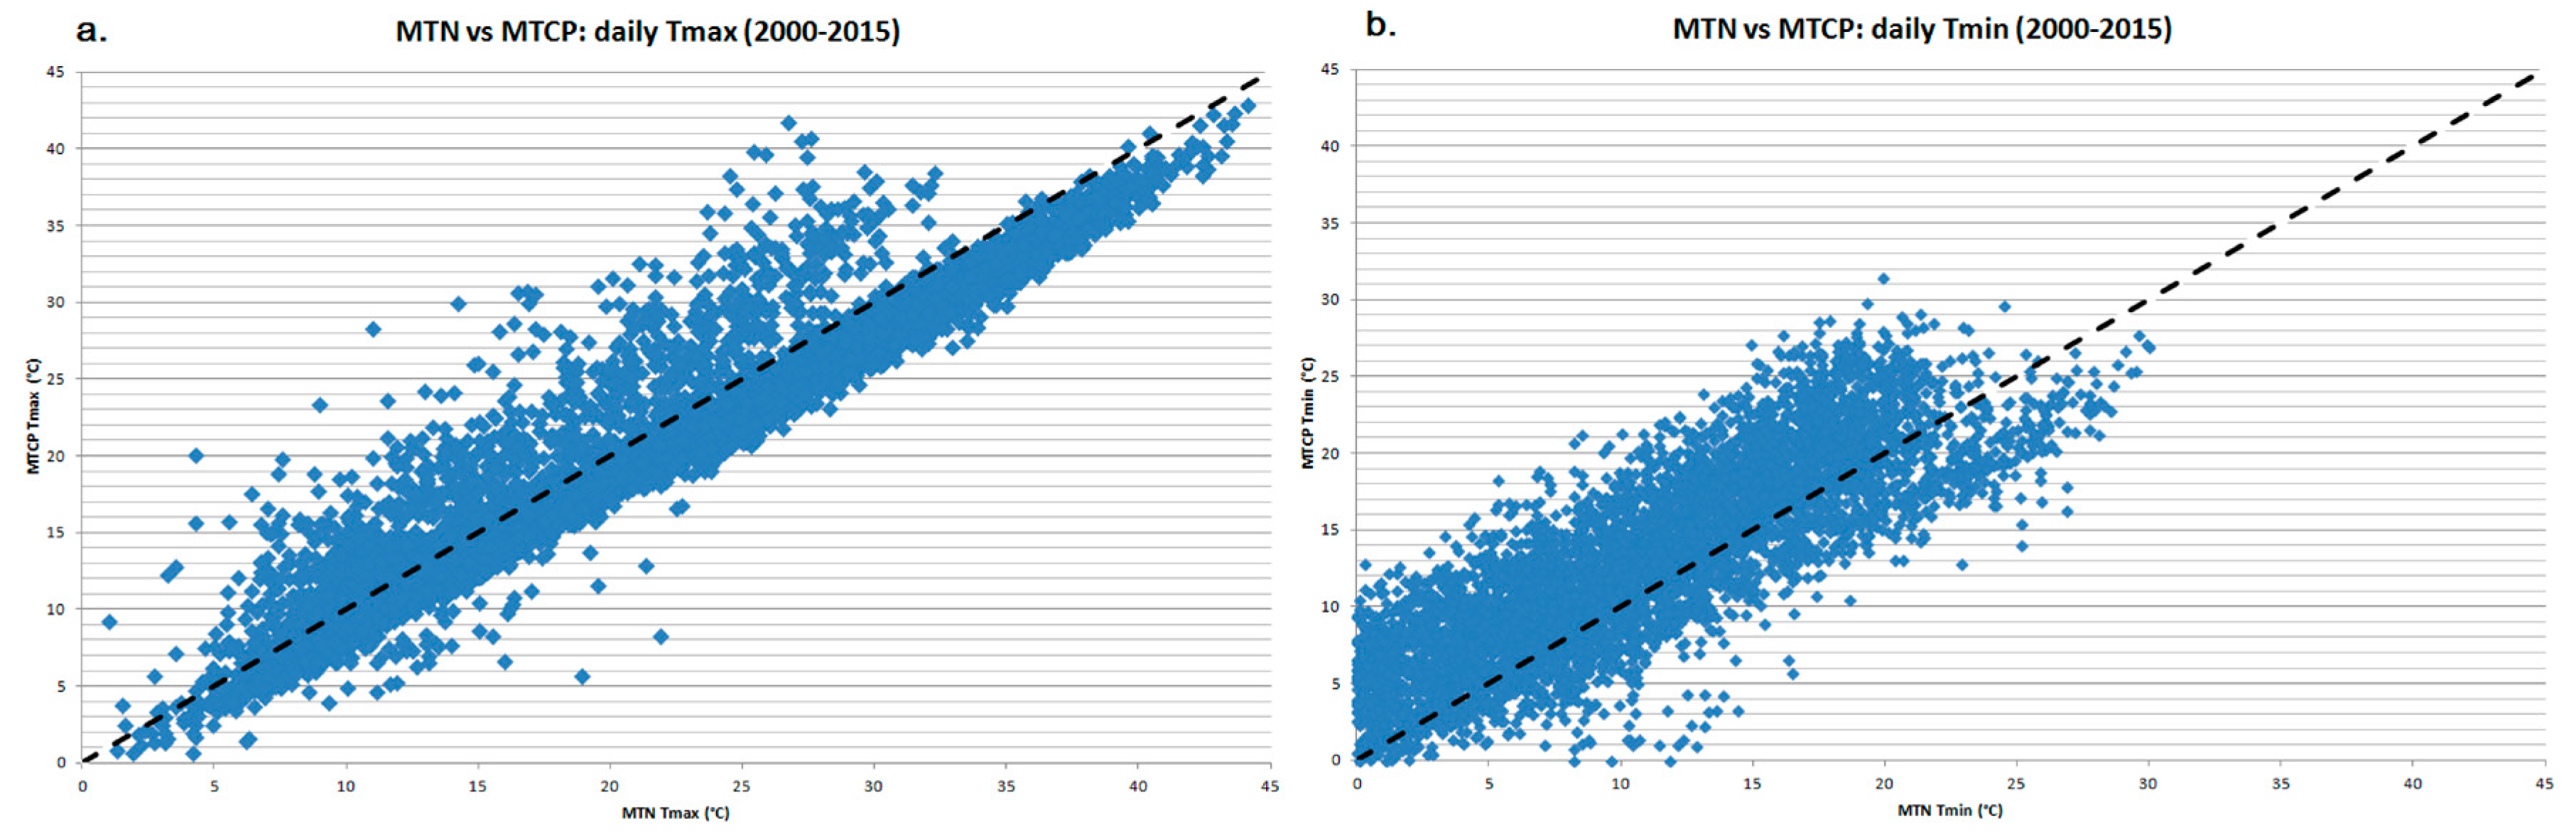
In
Figure 2,
h-scatterplots for minimum and maximum temperatures are shown; as you can see, the main differences between the two stations are observed for maximum temperatures. This behaviour is confirmed by
t-test results (
Table 2).
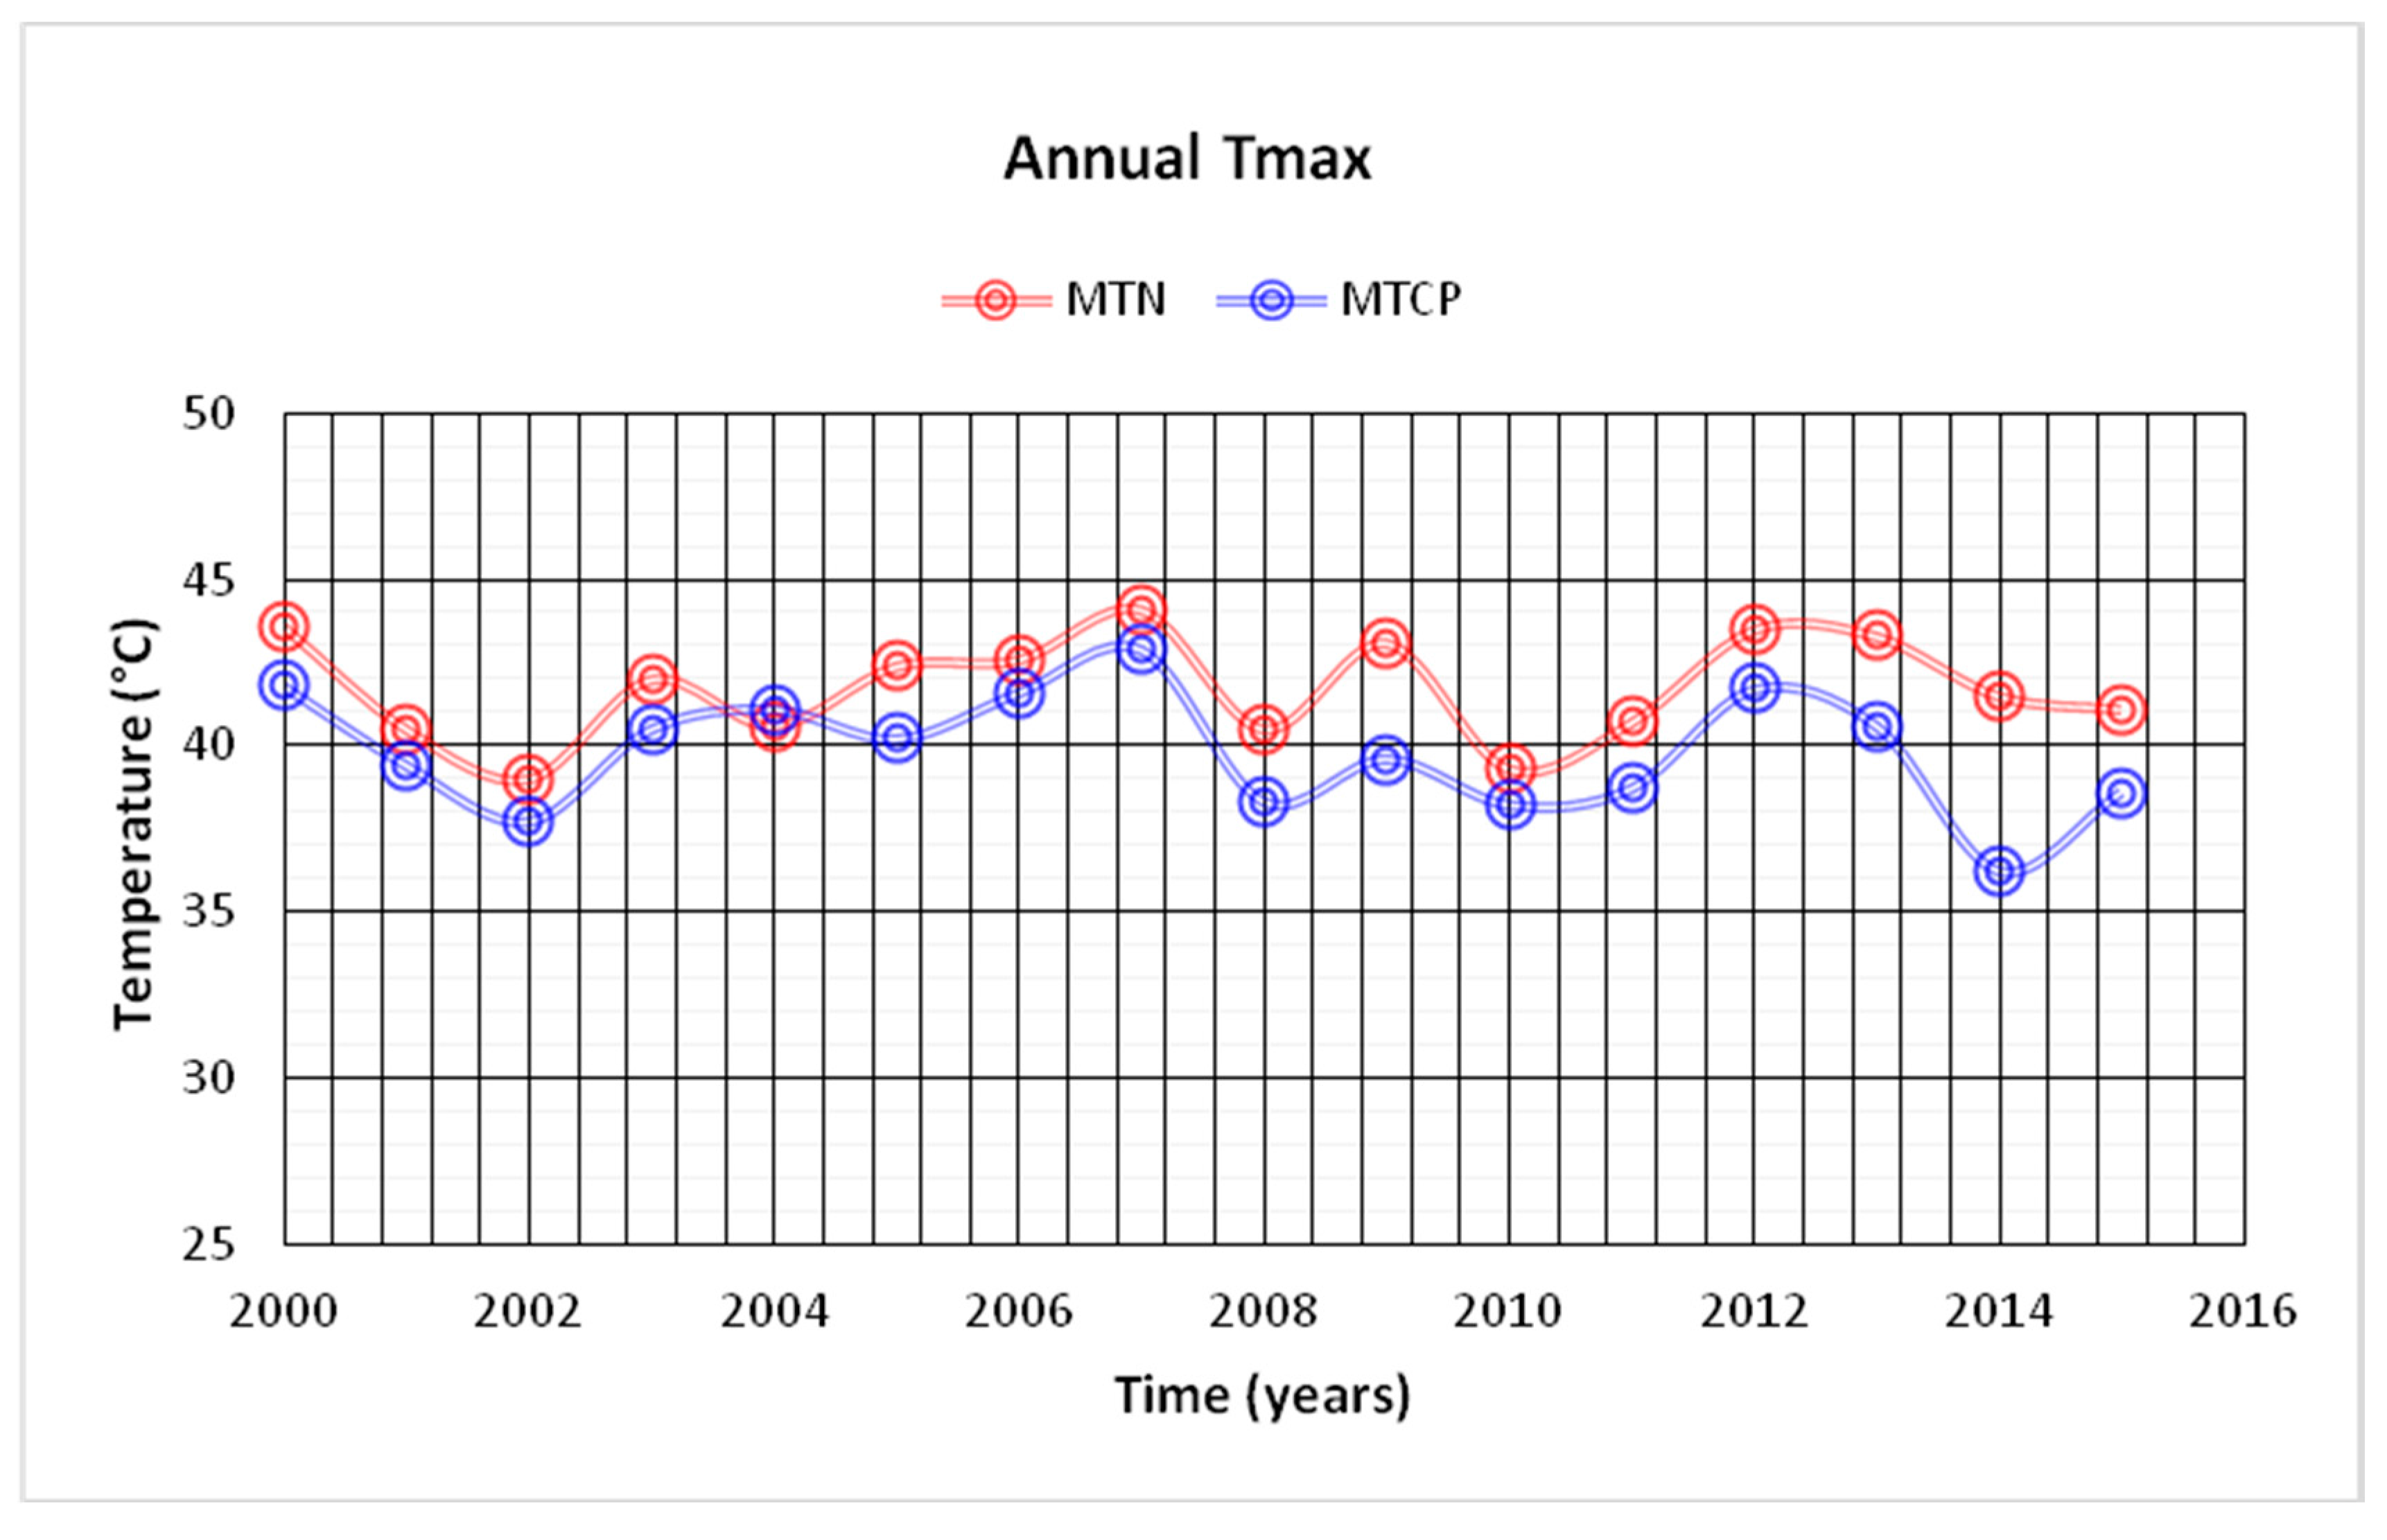
In particular, the MTN station presents annual average maximum temperatures greater than those of the MTCP station in the 2000–2015 period (
Figure 2).
3. Results
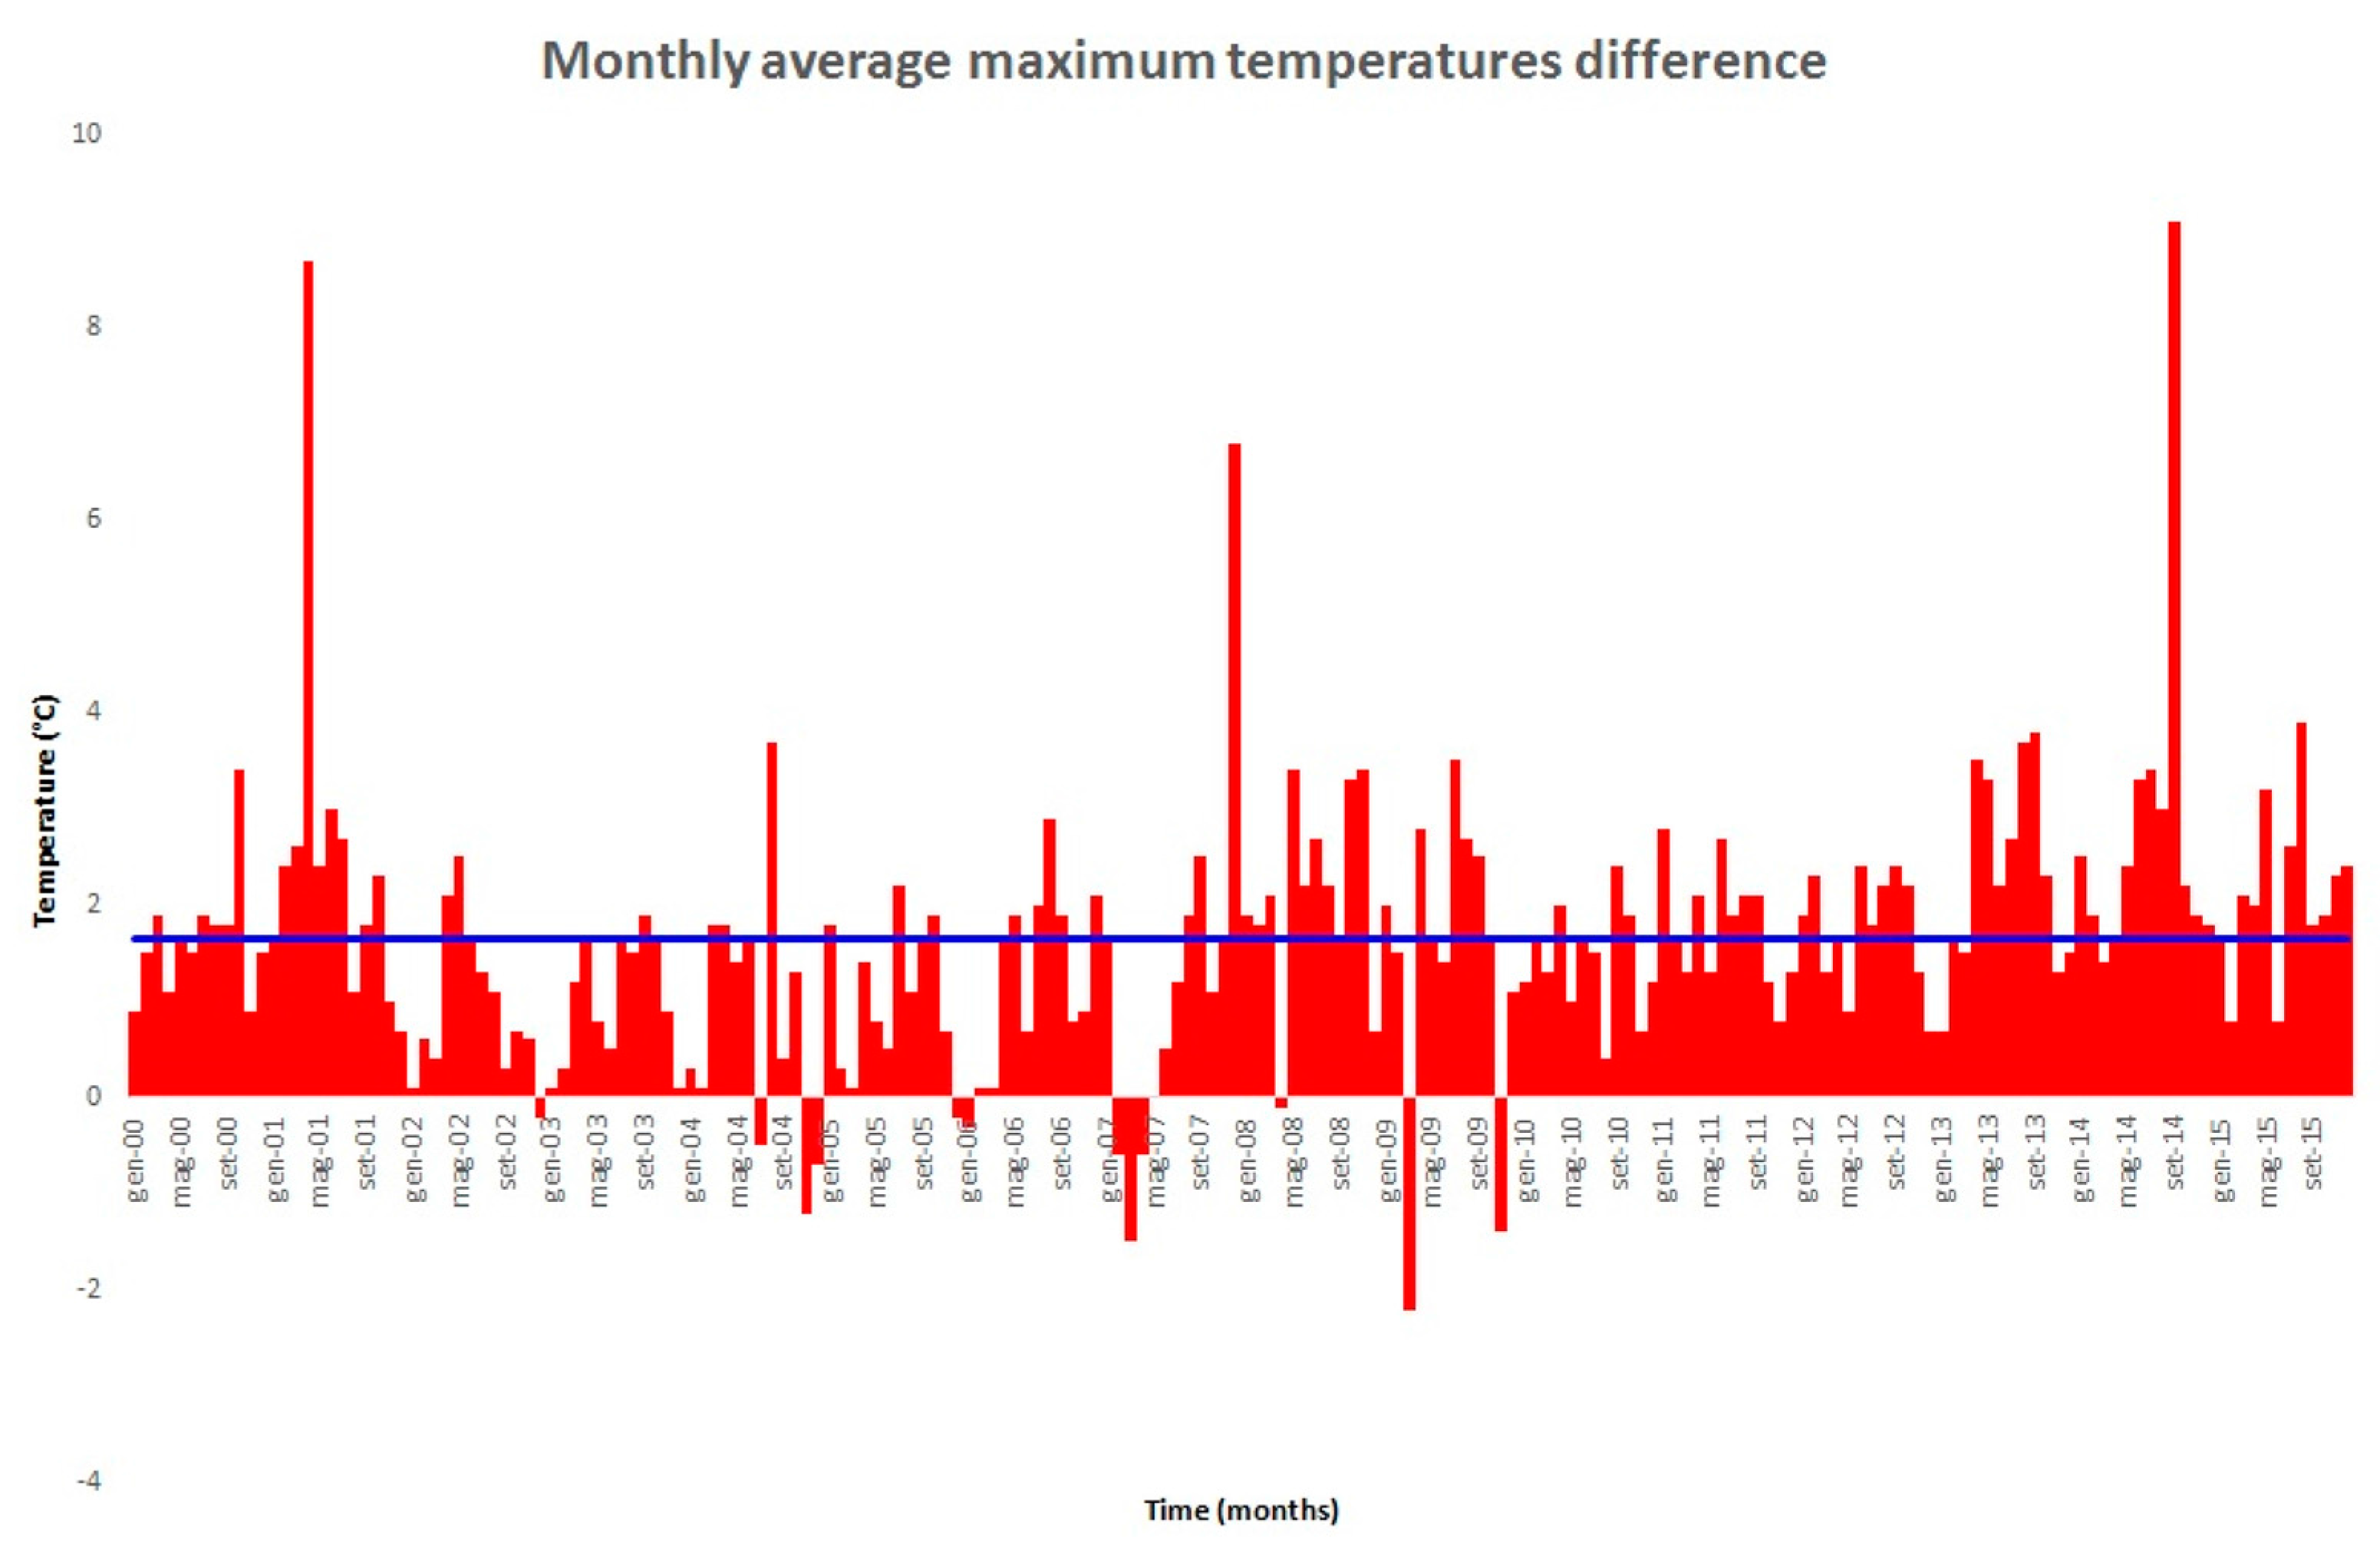
The MTN station presents annual average maximum temperatures greater than those of the MTCP station in the 2000–2015 period (
Figure 3). For the same time period, the differences of monthly average maximum temperatures between both stations show almost always positive values (
Figure 4) with a mean value of 2 °C.
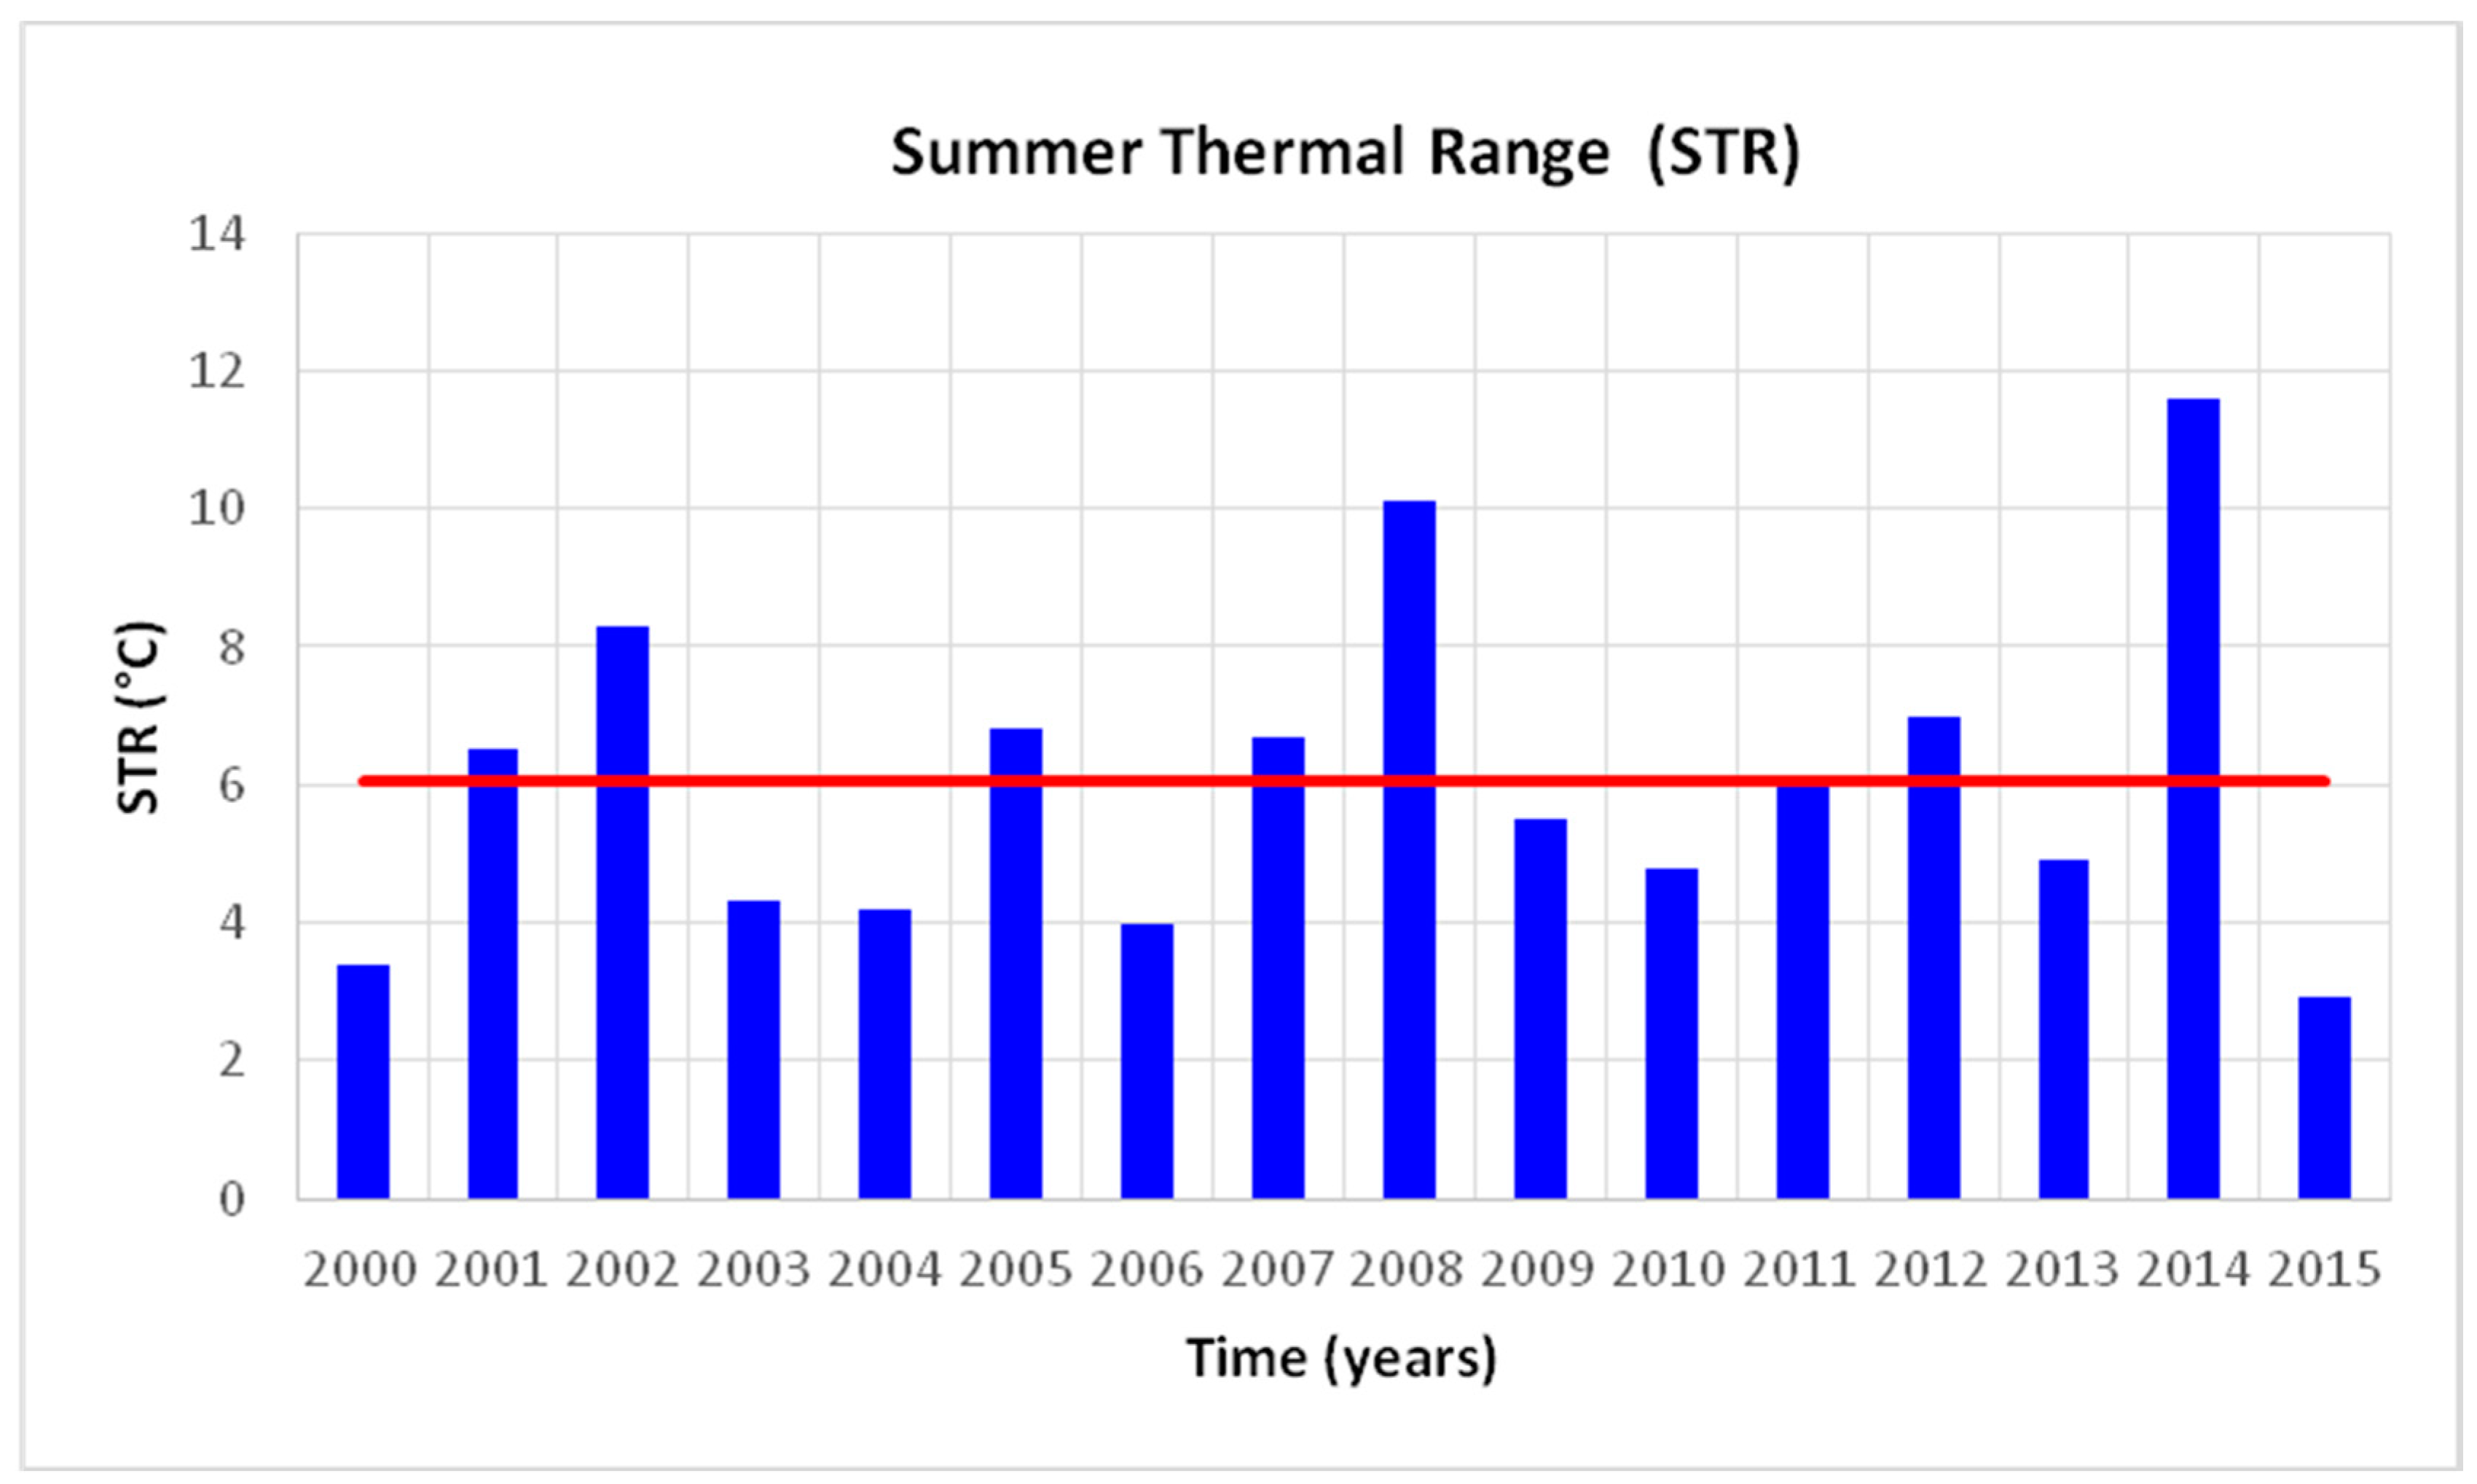
In confirmation of this trend,
Figure 5 shows the Summer Thermal Range (STR) obtained from the maximum and the minimum temperature differences between MTN and MTCP stations. In this case, the mean value of the range is 6 °C.
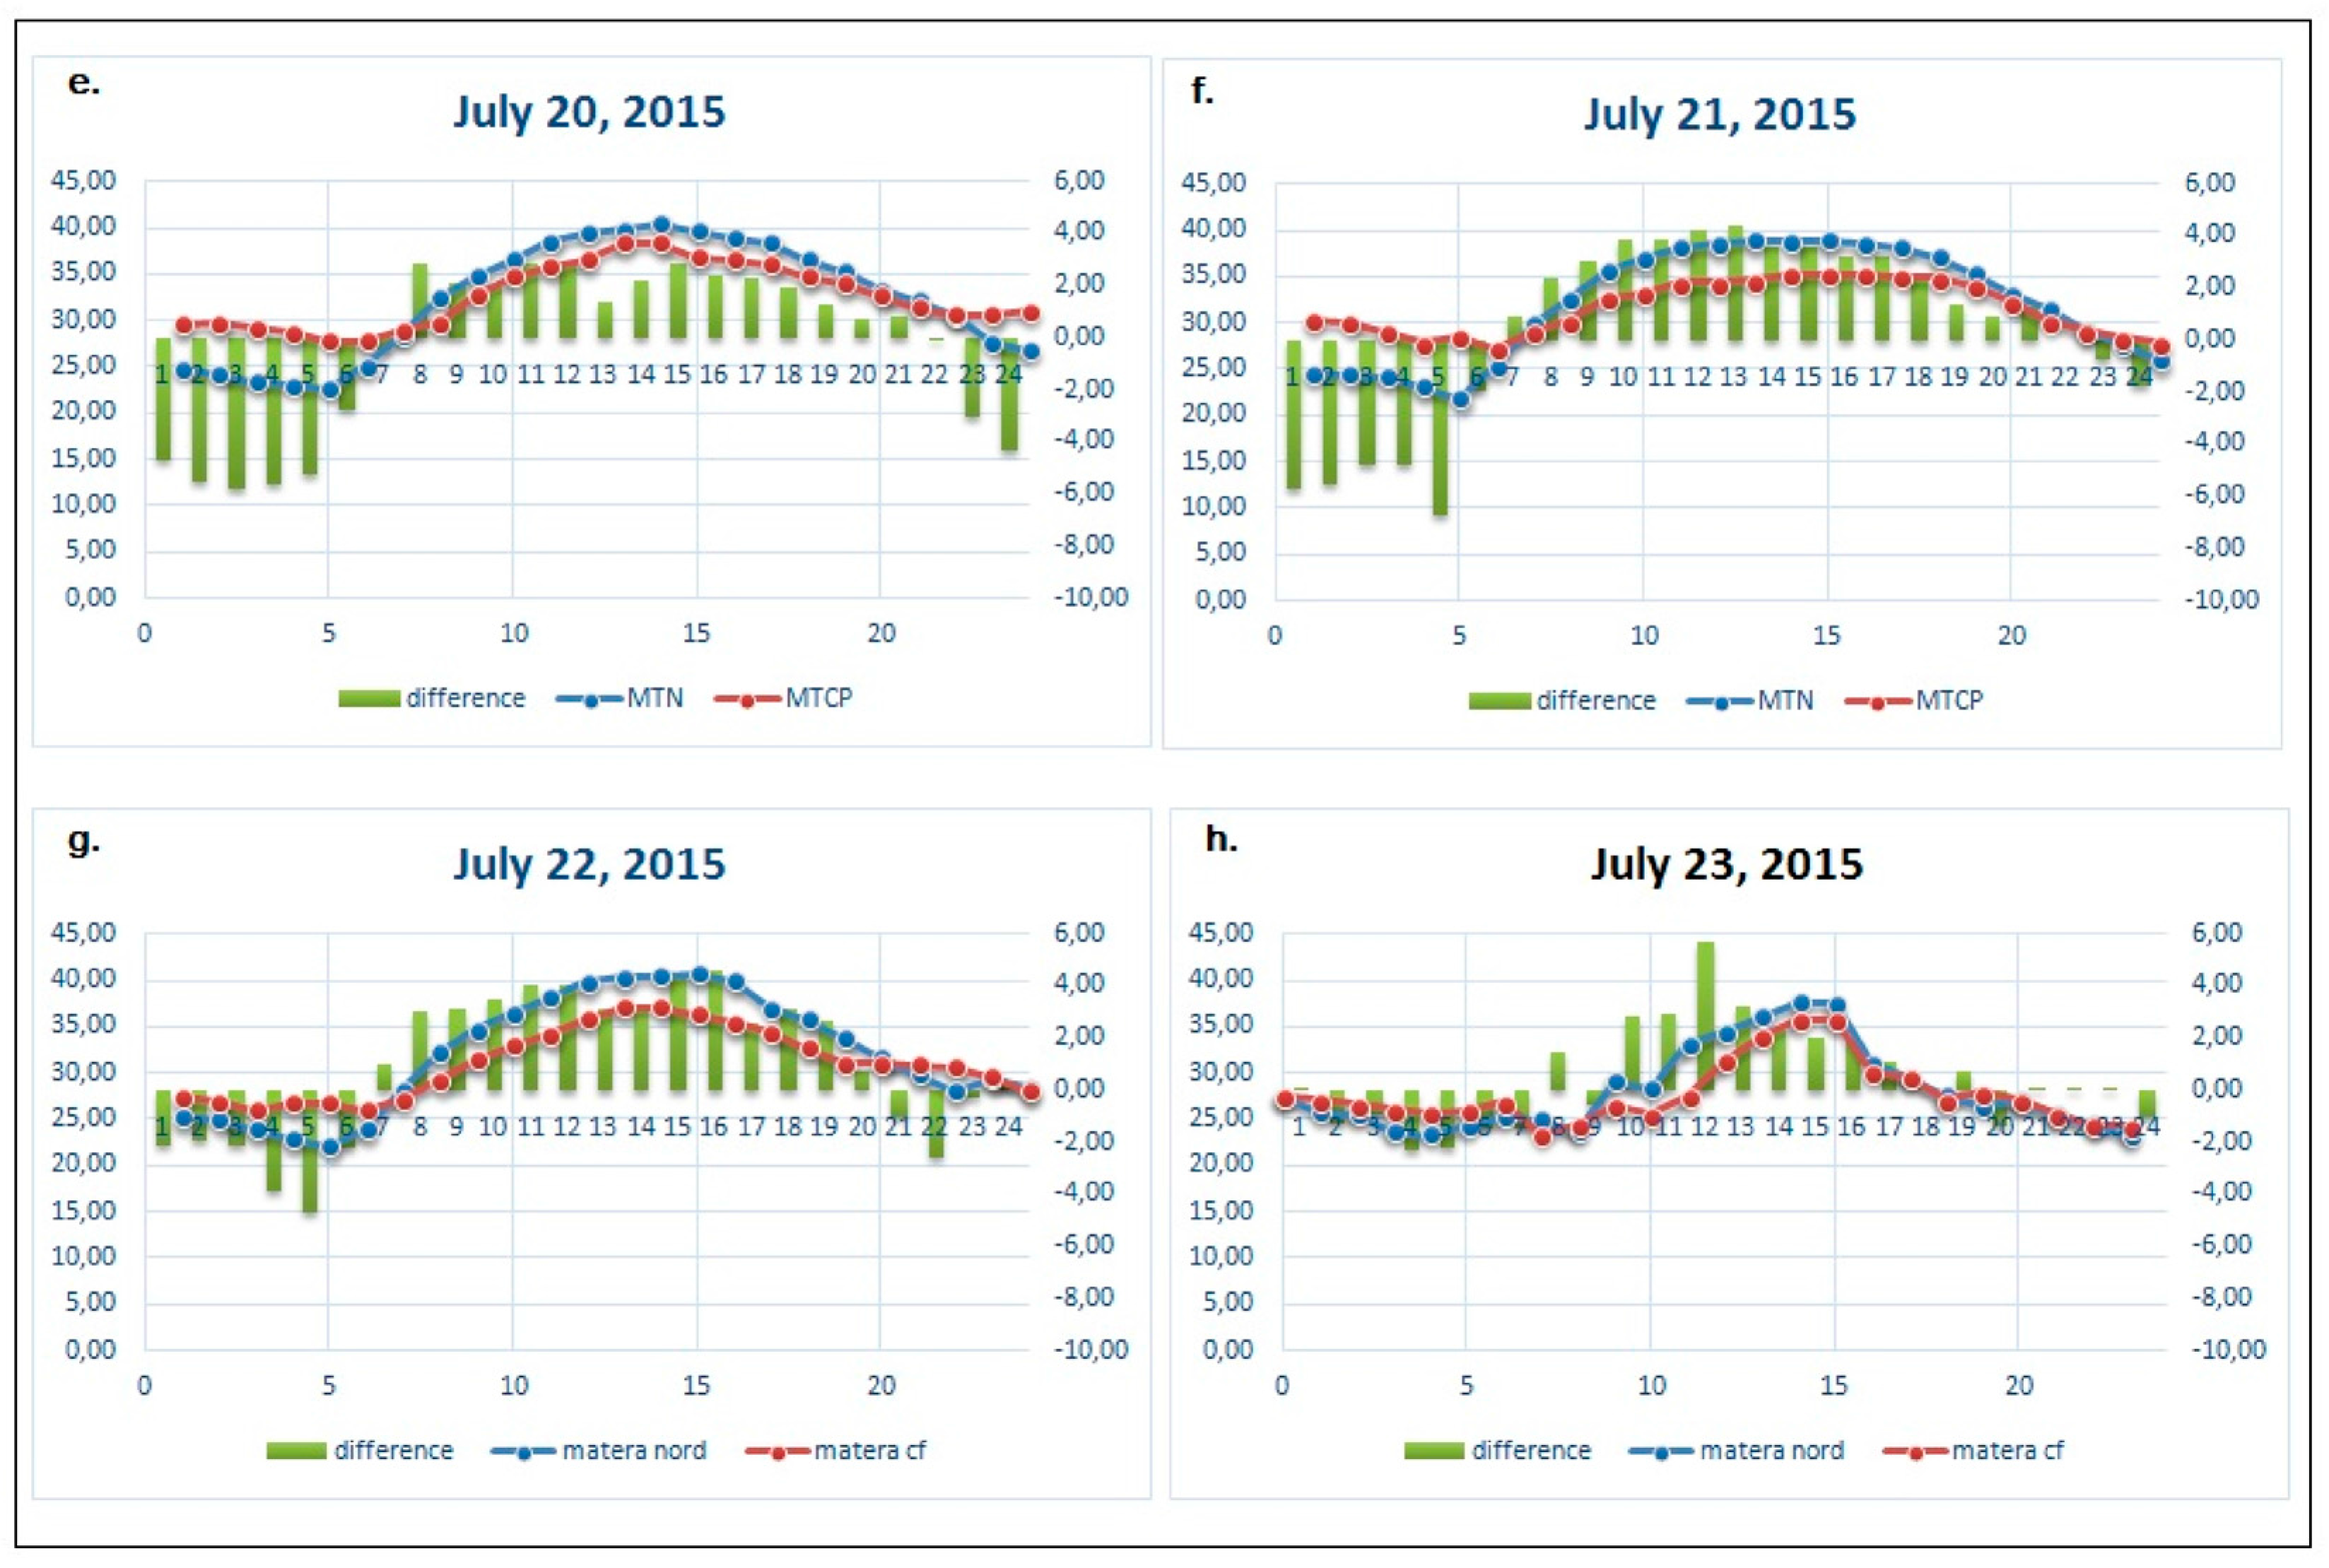
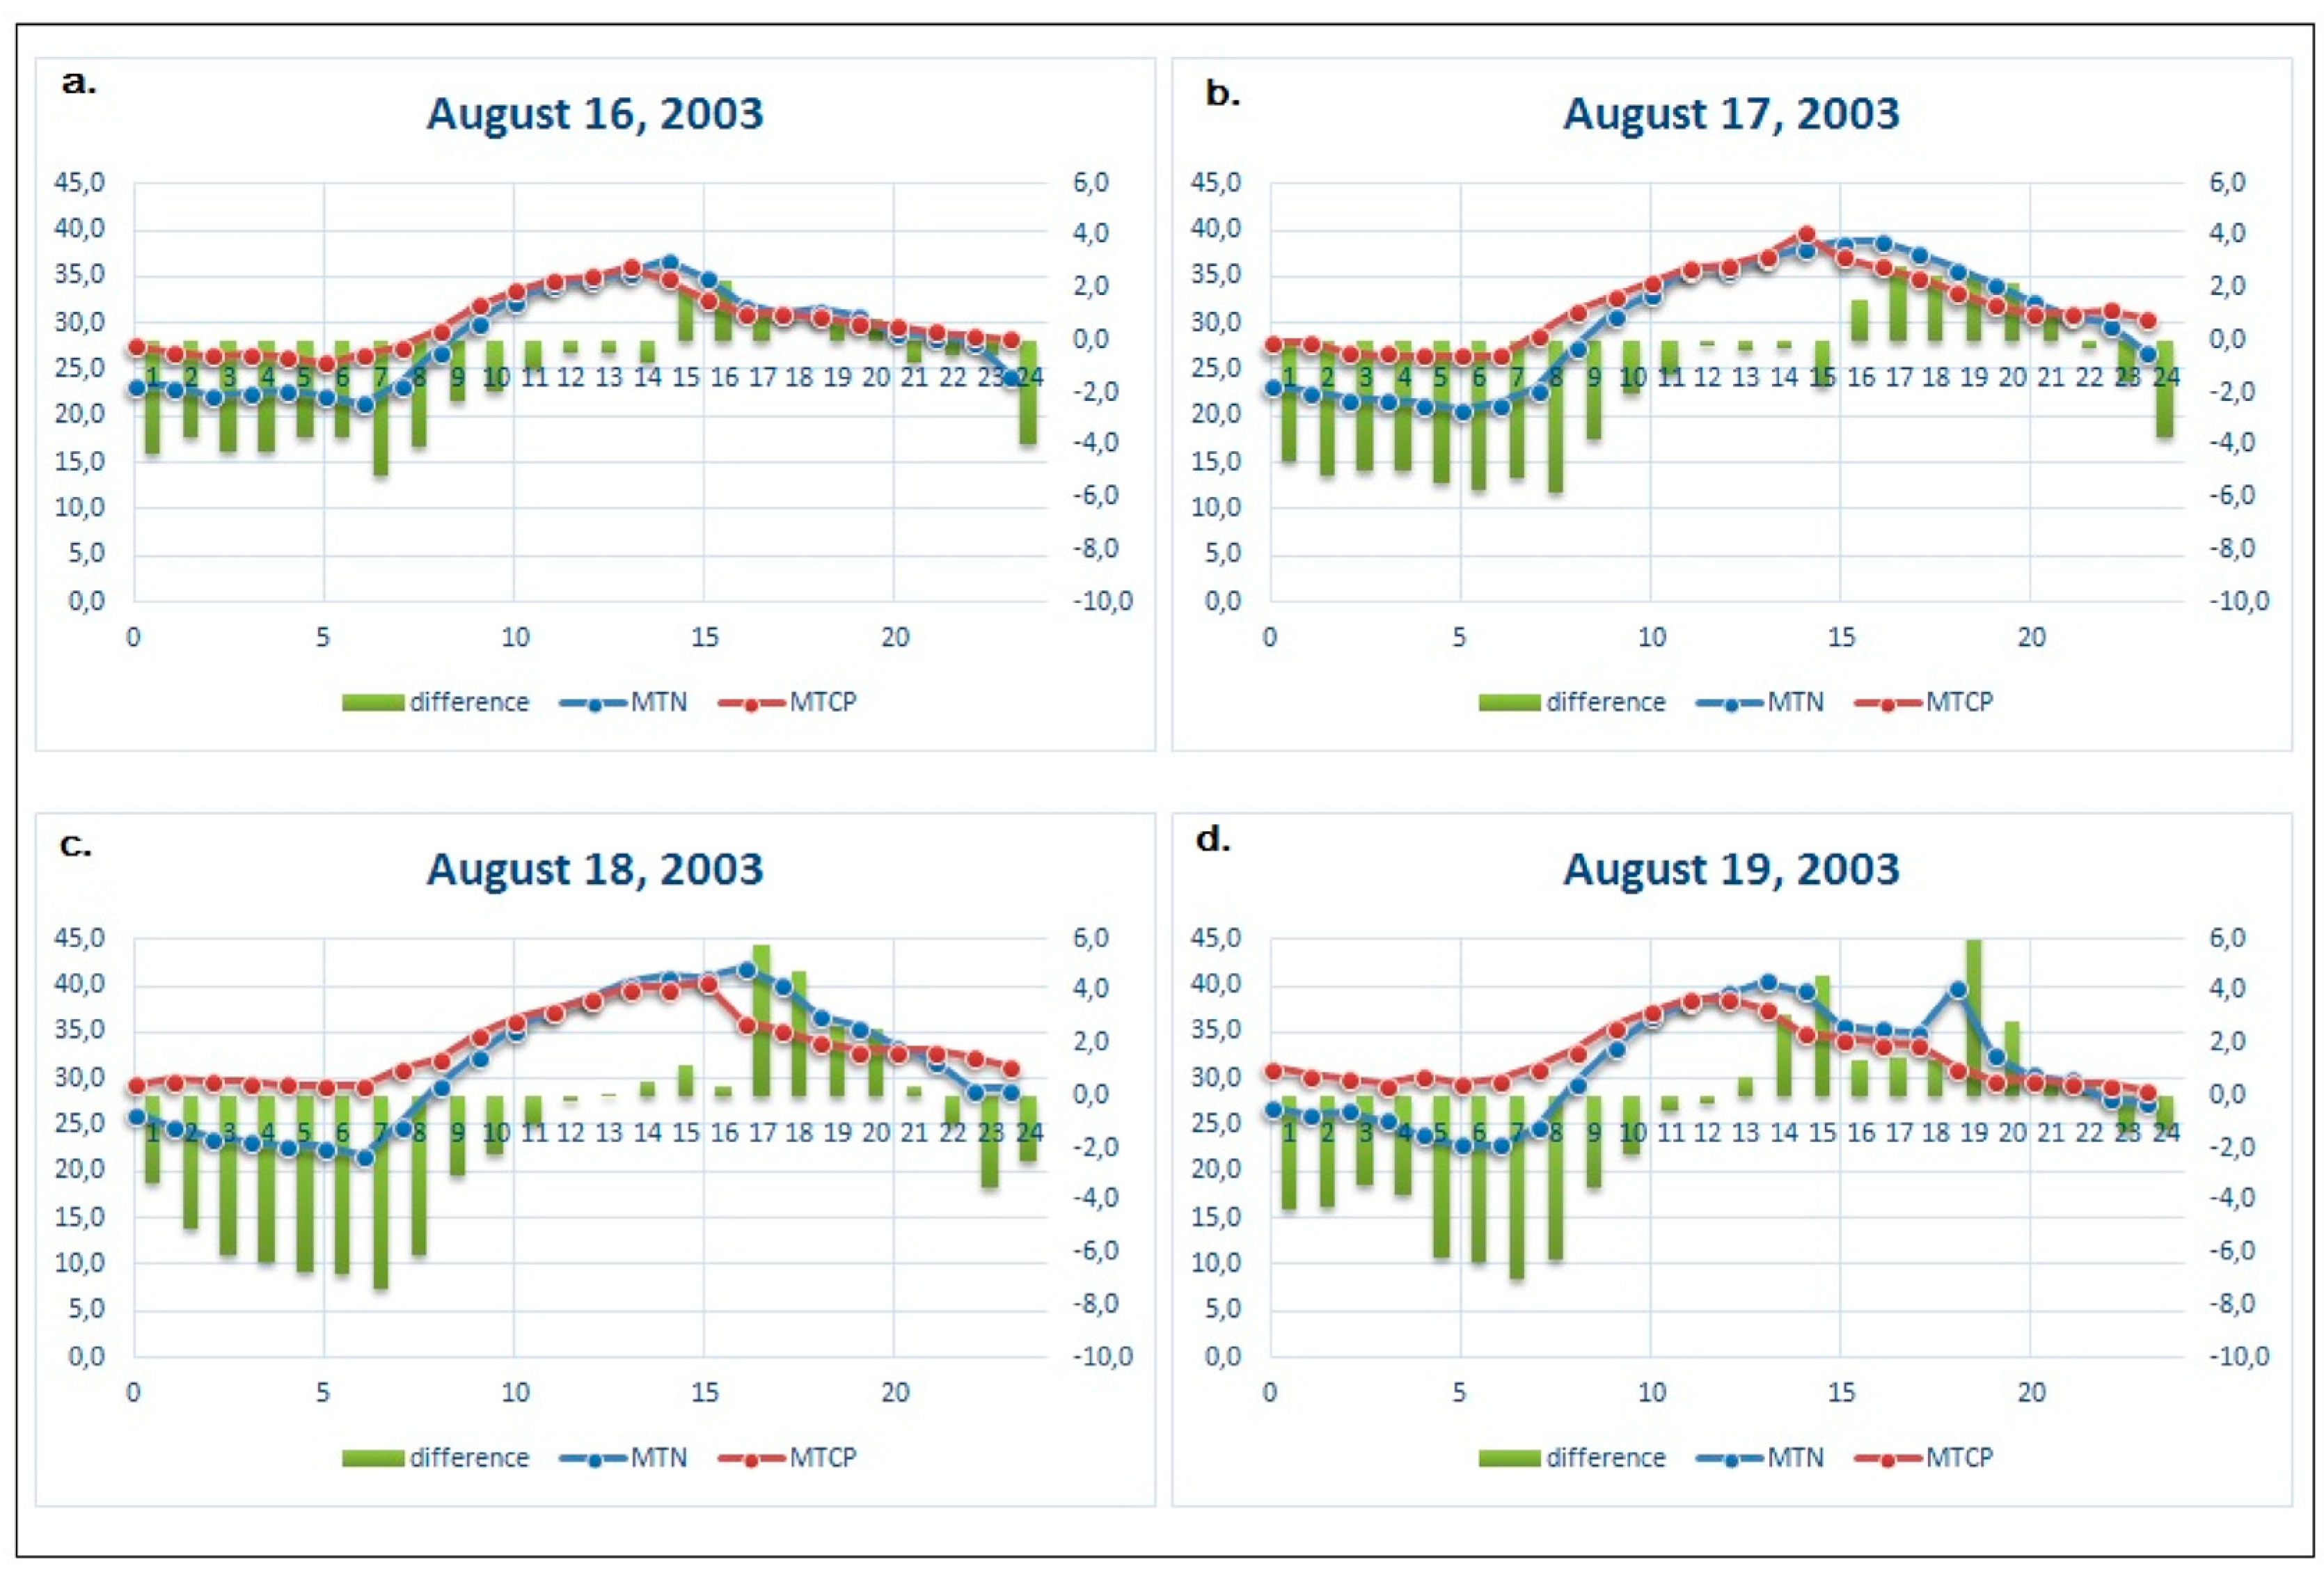
The analysis of hourly maximum temperatures was performed for both stations during the summer season in order to detect the daily trend and the differences between stations.
Figure 6 and
Figure 7 showed two years (2003 and 2015) as examples to highlight the daily behaviour of MTN and MTCP stations.
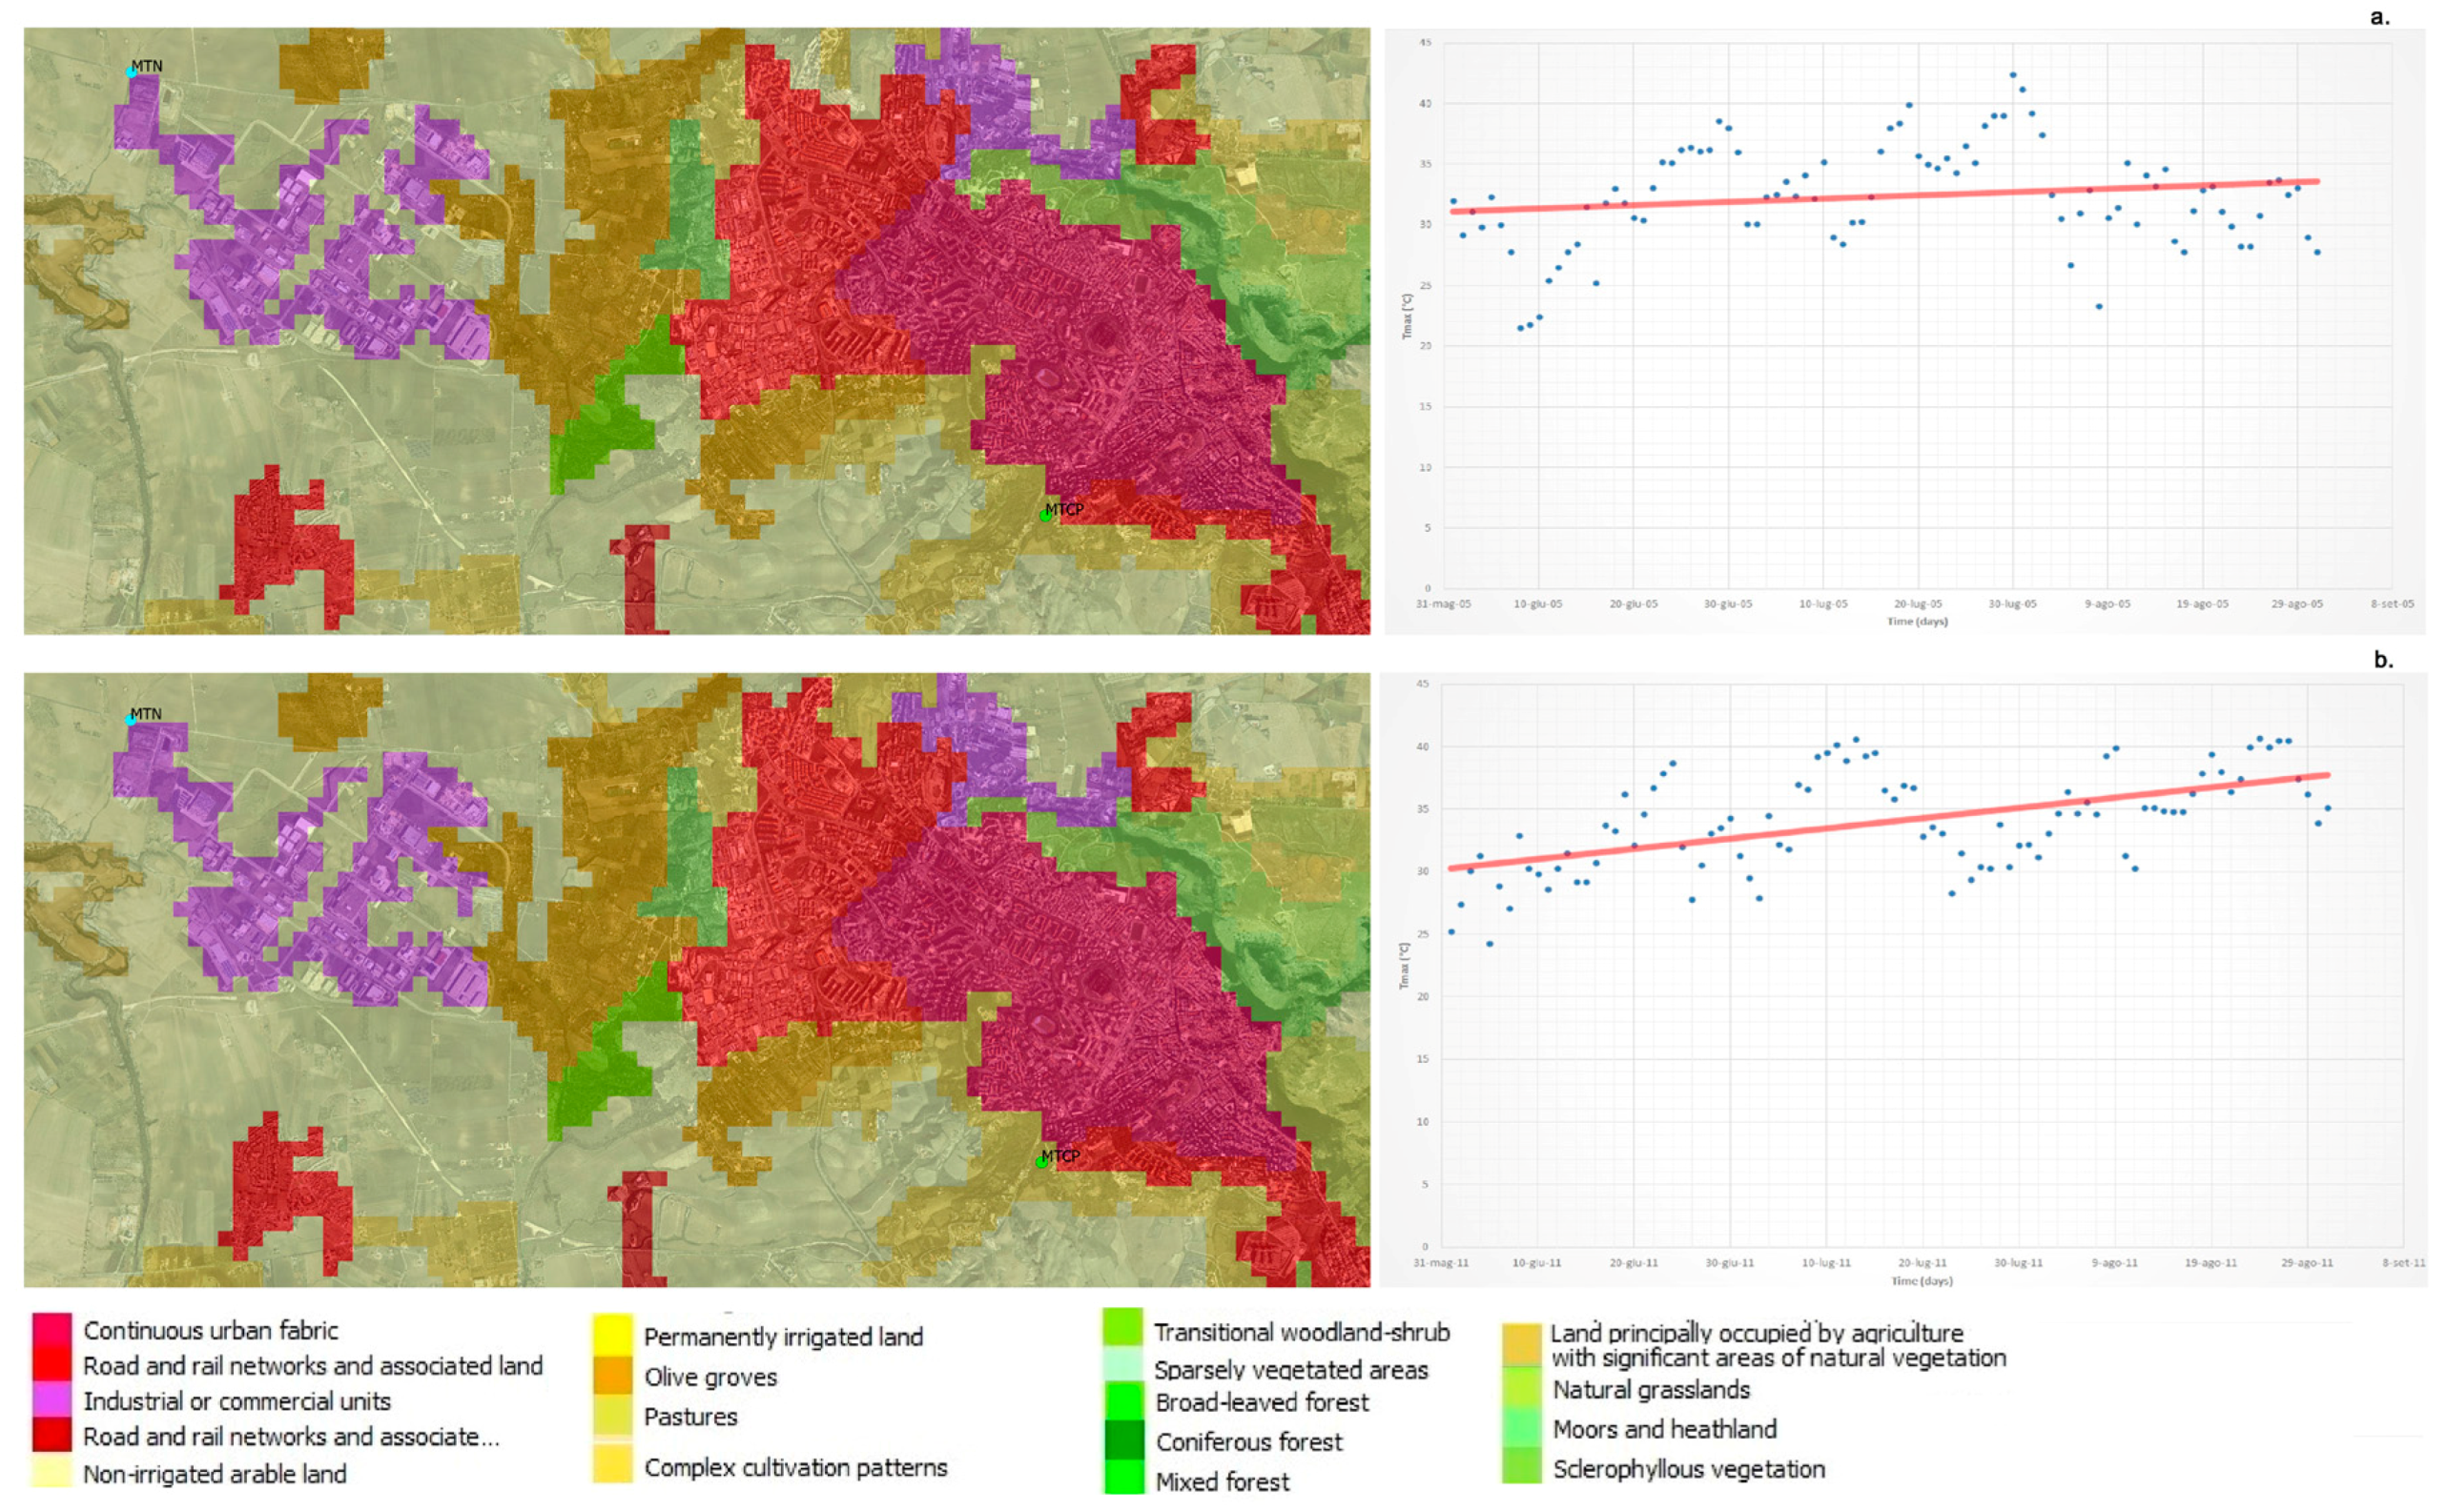
Moreover, a map with the overlap of Corine Land Cover maps (1990–2000–2006–2012) and the orthophoto was created for the study area in order to detect the variation of land use.
Figure 8 and
Figure 9 show the correspondence between the settlement development and trend of maximum temperatures for four years (1989–1999–2005–2011).
In the last 15 years, the development of building activities was predominant in industrial areas. A significant share of the maximum temperature growth in the MTN station is explained by the most dynamic behaviour of industrial districts in these zones.
The results show that it is possible to detect the existence of a difference of thermal behaviour between MTN and MTCP stations, for the maximum temperatures. This difference is also evident on annual data (
Figure 3) with a deviation ranging from 1 to 3 °C and with just two exceptions (5.3 °C in 2014 and −0.5 °C in 2004); the mean value is less than 2 °C.
For monthly data, the differences of average maximum temperatures between both stations are amplified with a positive difference in about 94% of cases (
Figure 4).
Moreover, the Summer Thermal Range obtained from the maximum and the minimum temperature differences between MTN and MTCP stations presents a higher mean value equal to about 6 °C (
Figure 5).
Hourly data were studied for both stations in order to analyse the daily changes in temperature. From the analysis of hourly temperatures (
Figure 6 and
Figure 7), it is possible to observe that the trend varies depending on the daily period. Particularly in daylight hours, the MTN station showed the maximum temperature (industrial activities influence). In contrast, the nocturnal period (23:00–07:00) presents a temperature lower than the suburban station (MTCP), when the industrial structures are not active.
4. Discussion and Conclusions
Analysing
Figure 8 and
Figure 9 it is possible to note the behaviour of the summer maximum temperatures in relation to the change of land use. In particular, the first two CLC (1990–2000) present an increasing trend with temperatures ranging between 14.7 and 33.4 °C.
The CLC of 2006 also presents an increasing trend of maximum temperatures, but with values shifted upwards and varying between 21.5 and 42.4 °C. This does not occur in the period before 2000, probably due to the absence of the industrial settlement. This is confirmed in the CLC of 2012, with summer maximum temperatures ranging between 24.3 and 40.7 °C, always with an increasing trend.
The comparative analysis of land use variations with a trend of summer maximum temperatures demonstrates the important role played by the industrial activity on climate change. This effect (MTN) is more evident in daylight hours rather than in the nocturnal period, when the industrial structures are active.
In conclusion, the present study analysed the impact of human activities, in particular industrial, on the climate variability in the Mediterranean area. In accordance with the available data, we compared the trend of the temperatures in a station close to an industrial area, with respect to another station located in a suburban area, in the 2000–2015 period.
The existence of industrial districts and their rapid settlement development suggests that they have an important potential for climate variability in those zones in which they are present.
The presence of industrial structures (MTN) showed a clear increase in summer maximum temperatures. In this regard, the land use variations were analysed with Corine Land Cover maps in the 1990–2012 period.
The study concerns temperature and land use changes observed in a limited area and the methodological approach allows us to quantify the effects of urban-industrial expansion in this zone. The results are encouraging and they suggest that it would be valuable to test the procedure in other sites for developing an effective tool for territorial sustainable planning. In particular, the procedure may support local administrations in rural-urban contexts for monitoring, quantifying and, successively, forecasting the impacts of the spread of anthropogenic activities.
Acknowledgments
We would like to gratefully acknowledge the participation, support and for providing the data used in this paper, the Dr. Emanuele Scalcione, by the regional agency for development and innovation in agriculture, and Carlo Glisci by National Civil Protection Department. The study was carried out in the framework of the project Smart Basilicata in Smart Cities and Communities and Social Innovation (MIUR n.84/Ric 2012, PON 2007–2013).
Author Contributions
All authors contributed equally to this work in all its phases: conception and the design of the project, its execution, analysis and interpretation of data. All authors read and approved the final manuscript for submission.
Conflicts of Interest
The authors declare no conflict of interest.
References
- Alavipanah, S.; Wegmann, M.; Qureshi, S.; Weng, Q.; Koellner, T. The role of vegetation in mitigating urban land surface temperatures: A case study of Munich, Germany during the warm season. Sustainability 2015, 7, 4689–4706. [Google Scholar] [CrossRef]
- Tam, B.Y.; Gough, W.A.; Mohsin, T. The impact of urbanization and the urban heat island effect on day to day temperature variation. Urban Clim. 2015, 12, 1–10. [Google Scholar] [CrossRef]
- Luber, G.; McGeehin, M. Climate change and extreme heat events. Am. J. Prev. Med. 2015, 35, 429–435. [Google Scholar] [CrossRef] [PubMed]
- Gough, W.A.; Hu, Y. Day-to-day temperature variability for four urban areas in China. Urban Clim. 2016, 17, 80–88. [Google Scholar] [CrossRef]
- Scheitlin, K.N.; Dixon, P.G. Diurnal temperature range variability due to land cover and airmass types in the Southeast. J. Appl. Meteorol. Climatol. 2010, 49, 879–888. [Google Scholar] [CrossRef]
- Zhou, Y.; Shepherd, J.M. Atlanta’s urban heat island under extreme heat conditions and potential mitigation strategies. Nat. Hazard 2010, 52, 639–668. [Google Scholar] [CrossRef]
- Zhao, L.; Lee, X.; Smith, R.B.; Oleson, K. Strong contributions of local background climate to urban heat islands. Nature 2014, 511, 216–219. [Google Scholar] [CrossRef] [PubMed]
- Su, Y.F.; Foody, G.M.; Cheng, K.S. Spatial non-stationarity in the relationships between land cover and surface temperature in an urban heat island and its impacts on thermally sensitive populations. Landsc. Urban Plan. 2012, 107, 172–180. [Google Scholar] [CrossRef]
- Chang, C.R.; Li, M.H.; Chang, S.D. A preliminary study on the local cool-island intensity of Taipei city parks. Landsc. Urban Plan. 2007, 80, 386–395. [Google Scholar] [CrossRef]
- Cao, X.; Onishi, A.; Chen, J.; Imura, H. Quantifying the cool island intensity of urban parks using ASTER and IKONOS data. Landsc. Urban Plan. 2010, 96, 224–231. [Google Scholar] [CrossRef]
- Landsberg, H.E. International Geophysics Series: The Urban Climate; Academic Press: New York, USA, 1981; Volume 28. [Google Scholar]
- Ivajnšič, D.; Kaligarič, M.; Žiberna, I. Geographically weighted regression of the urban heat island of a small city. Appl. Geogr. 2014, 53, 341–353. [Google Scholar] [CrossRef]
- Cardoso, R.D.S.; Dorigon, L.P.; Teixeira, D.C.F.; Amorim, M.C.D.C.T. Assessment of Urban Heat Islands in Small-and Mid-Sized Cities in Brazil. Climate 2017, 5, 14. [Google Scholar] [CrossRef]
- Mariotti, A.; Pan, Y.; Zeng, N.; Alessandri, A. Long-term climate change in the Mediterranean region in the midst of decadal variability. Clim. Dyn. 2015, 44, 1437–1456. [Google Scholar] [CrossRef]
- Parker, D.E. Urban heat island effects on estimates of observed climate change. Clim. Chang. 2010, 1, 123–133. [Google Scholar] [CrossRef]
- McCarthy, M.P.; Best, M.J.; Betts, R.A. Climate change in cities due to global warming and urban effects. Geophys. Res. Lett. 2010, 37. [Google Scholar] [CrossRef]
- Wijeyesekera, D.C.; Nazari, M.; Binti, N.A.R.; Lim, S.M.; Masirin, M.I.M.; Zainorabidin, A.B.; Walsh, J. Investigation into the urban heat island effects from asphalt pavements. OIDA Int. J. Sustain. Dev. 2012, 5, 97–118. [Google Scholar]
- Mobaraki, A. Strategies for Mitigating Urban Heat Island Effects in Cities: Case of Shiraz City Center. Ph.D. Thesis, Eastern Mediterranean University (EMU), Famagusta, Cyprus, 2012. [Google Scholar]
- Theeuwes, N.E.; Steeneveld, G.J.; Ronda, R.J.; Holtslag, A.A. A diagnostic equation for the daily maximum urban heat island effect for cities in northwestern Europe. Int. J. Climatol. 2017, 37, 443–454. [Google Scholar] [CrossRef]
- Taleghani, M.; Tenpierik, M.; van den Dobbelsteen, A.; Sailor, D.J. Heat mitigation strategies in winter and summer: Field measurements in temperate climates. Build. Environ. 2014, 81, 309–319. [Google Scholar] [CrossRef]
- Cioffi, F.; Conticello, F.; Lall, U.; Marotta, L.; Telesca, V. Large scale climate and rainfall seasonality in a Mediterranean Area: Insights from a non-homogeneous Markov model applied to the Agro-Pontino plain. Hydrol. Process. 2017, 31, 668–686. [Google Scholar] [CrossRef]
- Gough, W.A. Theoretical considerations of a day-to-day temperature variability applied to Toronto and Calgary, Canada data. Theor. Appl. Climatol. 2008, 94, 97–105. [Google Scholar] [CrossRef]
- Huang, L.; Zhao, D.; Wang, J.; Zhu, J.; Li, J. Scale impacts of land cover and vegetation corridors on urban thermal behavior in Nanjing, China. Theor. Appl. Climatol. 2008, 94, 241–257. [Google Scholar] [CrossRef]
- Mohsin, T.; Gough, W.A. Trend analysis of long-term temperature time series in the Greater Toronto Area (GTA). Theor. Appl. Climatol. 2010, 101, 311–327. [Google Scholar] [CrossRef]
- Blasi, M.G.; Liuzzi, G.; Masiello, G.; Serio, C.; Telesca, V.; Venafra, S. Surface parameters from seviri observations through a kalman filter approach: Application and evaluation of the scheme to the southern Italy. Tethys J. Weather Clim. West. Mediterr. 2016, 13, 1–19. [Google Scholar] [CrossRef]
- Copertino, V.A.; Di Pietro, M.; Scavone, G.; Telesca, V. Comparison of algorithms to retrieve land surface temperature from Landsat-7 ETM+ IR data in the Basilicata Ionian band. Tethys 2012, 9, 25–34. [Google Scholar] [CrossRef]
- Scavone, G.; Sánchez, J.M.; Telesca, V.; Caselles, V.; Copertino, V.A.; Pastore, V.; Valor, E. Pixel-oriented land use classification in energy balance modelling. Hydrol. Process. 2014, 28, 25–36. [Google Scholar] [CrossRef]
- Honjo, T.; Takakura, T. Analysis of temperature distribution of urban green spaces using remote sensing data. J. Jpn. Instit. Landsc. Arch. 1986, 49, 299–304. [Google Scholar] [CrossRef]
- Stathopoulou, M.; Cartalis, C. Daytime urban heat islands from Landsat ETM+ and Corine land cover data: An application to major cities in Greece. Sol. Energy 2007, 81, 358–368. [Google Scholar] [CrossRef]
- Bajocco, S.; De Angelis, A.; Perini, L.; Ferrara, A.; Salvati, L. The impact of land use/land cover changes on land degradation dynamics: A Mediterranean case study. Environ. Manag. 2012, 49, 980–989. [Google Scholar] [CrossRef] [PubMed]
- Diaz-Pacheco, J.; Gutiérrez, J. Exploring the limitations of CORINE Land Cover for monitoring urban land-use dynamics in metropolitan areas. J. Land Use Sci. 2014, 9, 243–259. [Google Scholar] [CrossRef]
- Mecca, I. In situ experimentations for the compatibility and durability of the restorations: The case study of the Sassi of Matera. VITRUVIO-Int. J. Archit. Technol. Sustain. 2016, 1, 35–48. [Google Scholar] [CrossRef]
- Vellinga, M. The noble vernacular. J. Archit. 2013, 18, 570–590. [Google Scholar] [CrossRef]
© 2017 by the authors. Licensee MDPI, Basel, Switzerland. This article is an open access article distributed under the terms and conditions of the Creative Commons Attribution (CC BY) license (http://creativecommons.org/licenses/by/4.0/).


