


Abstract
Natural disasters always generate an overwhelming amount of debris. Reusing and recycling waste from disasters are essential for sustainable debris management. Before recycling the debris, it is necessary to sort this mixed waste. To perform the sorting process efficiently, a Temporary Disaster Debris Management Site (TDDMS) is required, and the selection of TDDMS is a multi-criteria decision-making problem due to its numerous regional and municipal constraints. This paper provides a two-phase framework for sustainable debris management during the response phase of disasters. In the first phase, a methodology for TDDMS selection is proposed that consists of Analytical Network Process (ANP) and a fuzzy Technique for Order Preference by Similarity to Ideal Solution (TOPSIS). In the second phase, a debris allocation optimization model is developed to allocate the debris from disaster-affected regions to the selected TDDMS. A city prone to hurricane damage is selected to illustrate the proposed framework. For the debris allocation purpose, five TDDMS are chosen, among which three sites are selected using the proposed methodology. To illustrate the utilization of the proposed study, a numerical example with two different scenarios is provided. Numerical outcomes prove that the model results in a sustainable debris management system for disasters.
1. Introduction
In the last few decades, the frequency of disasters has rapidly increased. Hurricane Katrina (2005), the Haitian earthquake (2010), the Indian Ocean tsunami (2004) and the Japanese tsunami (2011) are a few large-scale disasters that have occurred since the start of the 21st century. Such large-scale disasters create thousands of tons of waste [1]. For example, the 8.9 scale earthquake and tsunami in Japan (2011) generated 28 million tons of waste [2,3]. Disaster waste may consist of recyclable materials like plastic goods, metals, vehicle bodies, electronic appliances and concrete debris. Recycling and reusing these materials are helpful from an environmental and economic perspective of sustainability. According to Brown and Milke [4], after any disaster, the following seven factors determine the feasibility of a recycling program: waste volume, existing disaster-related regulations, environmental and health hazards, the areal extent of waste, the degree of mixing of waste, availability of funds and the priorities of the community.
Disaster waste recycling reduces landfill use and results in more job opportunities for the local people [4]. To achieve high recycling rates for disaster debris processing, the mixed waste needs to be separated into the categories of plastics, paper, wood and metals. Mega-disasters such as the Indian Ocean tsunami (2004) and the Japanese tsunami (2011) produced such a mixed and massive amount of waste that it would be impractical to employ an on-site waste separation system [5]. The process of waste separation can be performed proficiently at Temporary Disaster Debris Management Site (TDDMS), which may increase the overall efficiency of the disaster waste recycling program. In addition to this, the Federal Emergency Management Agency (FEMA) specified the following advantages of a dedicated TDDMS [6]:
- It provides the flexibility of operations, for example in addition to temporary storage, TDDMS can be used as a collection center for public use.
- TDDMS acts as a buffer zone between affected regions and recycling plants to handle the huge amount of disaster waste.
- It expedites the disaster waste collection process.
- TDDMS is established at a location central to the affected region, which decreases the hauling time from collection points.
After the selection of TDDMS, disaster waste is allocated from affected regions to the selected sites. The debris removal operation is performed in two phases: debris clearance and debris removal [6]. The debris clearance phase includes clearance of the blocked paths to provide access to the relief distribution agencies, while the debris collection phase involves collection and transportation of the debris from disaster-affected regions to the selected TDDMS [7]. The complex and dynamic nature of disasters imposes a high degree of uncertainty regarding the amount estimation of disaster waste, in accordance to which the size of TDDMS is decided. In this research, a fuzzy possibilistic programming approach is employed to cope with uncertainty regarding the estimation of disaster waste.
With regard to the matters enumerated, the goal of this research is to propose a two-phase optimization model for waste management during the response phase of a disaster. In the first phase, a TDDMS selection methodology that not only considers the installation costs, but also the regional and municipal conditions is suggested. In the second phase, a fuzzy possibilistic optimization model is presented for the allocation of debris to the selected sites.
The rest of the paper is organized as follows: problem definition, notation, assumptions and preliminary definitions are given in Section 3. The proposed model framework is discussed in Section 4. A solution methodology is developed in Section 5. The application of the proposed framework is provided in Section 6. Finally, the paper is concluded in Section 7.
2. Literature Review
Disaster debris management comes under the umbrella of the humanitarian supply chain [8]. A humanitarian supply chain consists of four phases: mitigation, preparedness, response and recovery [9]. The mitigation phase includes actions performed to reduce the severity of a disaster [10,11]; the preparedness phase consists of activities that increase a community’s ability to respond in case a disaster occurs [12,13,14,15,16]; the response phase addresses immediate threats after a disaster [17,18,19]; and the recovery phase consists of restoring the infrastructure to return a community to a near-normal condition [20,21]. According to Altay and Green [22], among all four phases of the humanitarian supply chain, the recovery phase is the area that is in dire need of more research. The recovery phase includes operations like disaster debris estimation, debris removal, temporary disaster debris management site selection, infrastructure restoration and disaster waste contract management. Particularly, very little research has been done on the development of methodologies associated with TDDMS selection [23]. Viewing this need, in this paper, a methodology has been proposed for TDDMS selection during the response phase of a disaster.
To analyze the current research of the TDDMS selection problem, the following studies should be mentioned. The first research work was done by Onan et al. [24] in which a framework for determining the location of a temporary disaster debris management site was proposed. With the objective of minimizing the cost and risk of hazardous waste exposure, they considered the factors of planning for the collection and transportation of disaster waste. Fetter and Rakes [25] developed an MILP model for locating a disaster waste management site with the objective of minimizing the overall cost considering recycling revenue. Hu and Sheu [26] discussed a reverse logistics system for disaster waste management with the consideration of a temporary storage site, where the concept of temporary storage was very similar to the TDDMS. The objectives of that study were the minimization of total logistical cost, risk penalty and psychological cost. Lorca et al. [8] provided a decision support tool for post-disaster debris operations that optimizes and balances the environmental cost, debris removal duration, land usage and recycled waste amount. The concept of TDDMS was considered for disaster waste separation in the proposed decision support tool. Tabata et al. [27] provided an environmental and economic evaluation of pre-disaster plans for disaster waste management using the concept of TDDMS. In this study, temporary disaster waste management site selection criteria were based on the cost and capacity of the temporary site. In all of the aforementioned studies, the decision to select TDDMS was mostly based on cost minimization. However, before selecting a TDDMS, the site must satisfy the laws of regional, municipal and environmental protection agencies [28]. After receiving approval from these management bodies, the potential TDDMS should be used for disaster debris management purposes.
Cheng and Thompson [29], Grzeda et al. [28] and Kim et al. [30] proposed methodologies for the selection of TDDMS after evaluating the potential locations on the basis of environmental management bodies’ laws. Kim et al. [30] suggested a two-phase TDDMS selection methodology. In the first phase, the characteristics of potentially available alternates were extracted by using the Geographic Information System (GIS), and suitable regions for debris management sites were defined. In the second phase, hauling distances from waste collection points to the selected temporary debris management sites were minimized. This study differs from the proposed research work in two aspects. First, the selection of debris management sites was made by simple GIS data analysis, and no specific quantitative multi-criteria decision-making evaluation technique was used. Second, for debris allocation, contrary to the post-disaster uncertain environment, all input parameters were considered deterministic. Another TDDMS selection methodology was proposed by Cheng and Thompson [29]. In their study, the authors first performed a land suitability analysis to determine the potential locations, and then, they used the Boolean logic technique to select the suitable temporary disaster debris management sites. A similar methodology for TDDMS selection was developed by Grzeda et al. [28]. They first provided a detailed explanation of the evaluation criteria required for waste management site selection from the environmental, social, technical and legal points of view, and then, they implemented their findings to select potential temporary disaster debris management sites in Hamilton County, Indiana. In the first stage, they used GIS to capture the characteristics of potential debris management sites, while in the next stage, binomial cluster analysis was implemented to locate the most suitable debris management sites. The proposed research work provides a new methodology for TDDMS selection adopting similar evaluation criteria used by Grzeda et al. [28].
All of these studies except Kim et al. [30] proposed TDDMS selection in the pre-disaster scenario. There is a great deal of uncertainty in terms of the place and time of occurrence of a disaster, and any preferred TDDMS in the pre-disaster phase may be inaccessible after the occurrence of a disaster due to damaged infrastructure. Considering this uncertainty, in this study, a framework for TDDMS selection in the post-disaster scenario has been proposed. Furthermore, an optimization model with a fuzzy possibilistic approach to minimize total debris transportation cost between affected regions and selected temporary disaster debris management sites is developed. Table 1 represents the research contribution of this study to the existing literature on the TDDMS selection problem.
Table 1.
Summary of the literature related to the Temporary Disaster Debris Management Site (TDDMS) selection methodology.
This research contributes to the existing literature of response phase disaster debris management in the following aspects:
- Introducing an integrated model for TDDMS selection and debris allocation during the response phase of a disaster considering all of the regional and municipal constraints.
- Proposing a multi-criteria decision-making methodology for the selection of TDDMS. The multi-criteria decision-making methodology is a combination of Analytical Network Process (ANP) and fuzzy TOPSIS. ANP is used to obtain the evaluation criteria weights, and fuzzy TOPSIS is used to obtain a final ranking of the available alternatives.
- The environment after the occurrence of a disaster is uncertain. To deal with this uncertainty, a fuzzy possibilistic debris allocation model is proposed in which all of the input parameters are considered uncertain.
3. Model Formulation
3.1. Problem Definition
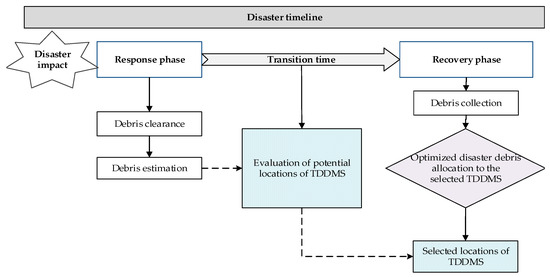
In large-scale disasters such as a tsunami, thousands of tons of highly mixed waste are generated that consist of concrete rubble, electronic appliances, plastics goods and vegetative waste. This waste may also include chemicals, heavy metals and asbestos, which are extremely harmful to human health. To effectively recycle, this mixed waste needs to be separated into recyclable and non-recyclable materials. This waste separation process is performed at TDDMS. However, the selection of a suitable TDDMS is a complex task, because the selected site must satisfy the laws of regional, municipal and environmental protection agencies. In addition to satisfying these constraints, the selected TDDMS should be located at a minimum possible distance to minimize transportation cost and time. The role of TDDMS for waste management in the response phase of a disaster is shown in Figure 1.
Figure 1.
Role of TDDMS in disaster waste management.
3.2. Model Notation
Indices:
- index of available alternatives
- index for evaluation criteria
- e
- index of disaster affected regions
- t
- index of potential locations for temporary disaster debris management sites
Parameters:
- B
- pairwise comparison decision matrix without interdependence among evaluation criteria
- M
- pairwise comparison decision matrix with interdependence among evaluation criteria
- wl
- local priority weights of evaluation criteria
- wj
- relative importance weight of evaluation criterion j obtained from ANP
- total number of evaluation criteria in ANP
- the largest eigenvalue of pairwise comparison matrix in ANP
- fuzzy matrix of performance ratings
- fuzzy performance ratings for alternate i with respect to criteria j
- set of available alternatives i
- set of evaluation criteria j
- fuzzy weighted normalized decision matrix
- Fuzzy Positive Ideal Solution (FPIS)
- Fuzzy Negative Ideal Solution (FNIS)
- distance of alternate i from its FPIS
- distance of alternate i from its FNIS
- coefficient of closeness to the positive ideal solution
- total quantity of disaster waste available in disaster affected region e (tons)
- per ton disaster waste transportation cost from disaster affected region e to TDDMS t ($/ton)
- capacity of temporary disaster debris management site t (tons)
Decision variable:
- total quantity of disaster waste transported from disaster affected region e to TDDMS t (tons)
3.3. Assumptions
- The occurrence of a large-scale disaster (tsunami or hurricane) is considered in this model. For small-scale disasters, the amount of debris is less, and no dedicated waste separation site is needed as on-site waste separation is performed. This assumption ensures that the amount of debris is too large and waste separation can only be performed at dedicated TDDMS locations.
- There are enough financial resources to successfully perform TDDMS selection and debris allocation operation. For debris management operations, such as collection, transportation and the installation of the TDDMS facility, millions of dollars are required. This assumption ensures that enough donations or government funds are available to perform all of the response phase waste management operations smoothly.
- The transportation distances between affected regions and potential temporary disaster debris management sites are known. As the potential sites are already identified, their respective distances and per ton debris transportation costs among disaster affected regions are also known.
3.4. Preliminaries
This section provides some definitions of the fuzzy set theory helpful in understanding the proposed model [31,32,33,34].
Definition 1.
A fuzzy set in a universe of discourse Y is characterized by a membership function which is associated with each element y in Y is a real number in the interval [0, 1].
Definition 2.
A triangular fuzzy number can be defined by a triplet . The membership function is defined as follows:
Definition 3.
A linguistic variable is the one that has a value in the form of linguistic terms [35]. The concept of linguistic variable is useful in complex situations, where either complete information is not available or the situation is too complex to describe.
Definition 4.
Let and are two triangular fuzzy numbers. The distance between these two points can be calculated by the vertex method as follows:
Definition 5.
A weighted normalized fuzzy matrix can be obtained by multiplying each performance rating of the fuzzy matrix by the weight .
where i = set of available alternatives {i = 1, 2, … m} j = set of evaluation criteria {j = 1, 2, … n}
4. Proposed Model Framework
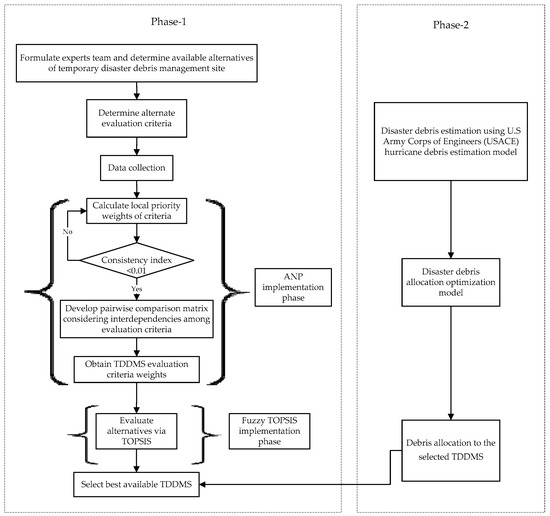
The proposed methodology to solve the debris management site selection problem during the response phase of a disaster is shown in Figure 2. It consists of two phases: the TDDMS selection phase and the debris allocation phase. In the first phase, a methodology for TDDMS selection is proposed. In the second phase, a debris allocation optimization model is developed to minimize the debris transportation cost between TDDMS and affected regions. The details of these phases are provided in Section 4.1 and Section 4.2.
Figure 2.
Proposed framework for selection of temporary disaster debris management site and debris allocation to the selected TDDMS.
4.1. Phase-1 Temporary Disaster Debris Management Site Selection
In the first phase of the proposed framework, TDDMS are selected among available alternatives after evaluating each alternative based on the defined evaluation criteria.
4.1.1. Expert Team Formation and Data Collection
In the first step, a decision-making team consisting of experts from geological and humanitarian organizations was formed. This team developed a set of possible candidate waste management site locations. Each possible TDDMS was evaluated on the basis of seven primary evaluation criteria, using a combination of ANP and the fuzzy TOPSIS technique. These evaluation criteria were developed on the basis of a thorough literature review and expert advice. Details of each evaluation criterion are provided in Table 2.
Table 2.
Temporary disaster waste management site evaluation criteria details.
4.1.2. ANP Technique Implementation
After defining the evaluation criteria and potential locations, criteria weights are calculated. Because TDDMS evaluation criteria are interdependent, the Analytical Network Process (ANP) technique, which is capable of handling feedback and interdependencies among evaluation criteria, is used. ANP not only provides a flexible network structure, but is also capable of handling interdependencies between decision levels and attributes by obtaining composite weights [36,37]. In this study, the ANP technique proposed by Saaty and Takizawa [38] is used. In this methodology, using the preference scale provided in Table 3, local priority weights for evaluation criteria are obtained by assuming that there is no relationship among TDDMS evaluation criteria. After that, a pairwise comparison matrix of TDDMS evaluation criteria is developed by considering all possible relationships among evaluation criteria. Finally, interdependence priorities of the TDDMS evaluation criteria are obtained by synthesizing the results of both of the previous steps. A detailed solution methodology of ANP is provided in Section 5.1.
Table 3.
Preference scale for pairwise comparison.
4.1.3. Fuzzy TOPSIS Implementation
After obtaining criteria weights from ANP, the fuzzy TOPSIS technique is implemented to get a final ranking of the available alternatives. For TOPSIS, an evaluation matrix is developed by evaluating each alternate with respect to all criteria. In the evaluation matrix, terms are expressed in the form of linguistic variables because TOPSIS is being used in combination with fuzzy set theory. These linguistic variables are converted into fuzzy numbers using Table 4. Then, a weighted normalized decision matrix is developed by using the weights calculated from ANP. In the next stage, Fuzzy Positive Ideal Solution (FPIS) and Fuzzy Negative Ideal Solution (FNIS) are calculated. Finally, the coefficient of closeness (cci), which provides a final ranking, is calculated. The solution methodology of fuzzy TOPSIS is provided in Section 5.2.
Table 4.
Linguistic variables and fuzzy numbers.
4.2. Phase-2 Temporary Disaster Debris Management Site Selection
From Phase-1, the finalized locations of TDDMS are obtained. In the next phase, debris from disaster affected regions is allocated to the selected TDDMS locations with the objective of minimizing total debris transportation cost.
4.2.1. Debris Estimation after the Occurrence of Disaster
The amount of debris is estimated after the occurrence of a disaster in the response phase as shown in Figure 1. For the estimation of debris generated by the disaster, the U.S. Army Corps of Engineers (USACE) hurricane debris estimation model is used [6]. This debris estimation method has been recommended in previous studies, such as Lorca et al. [8], Fetter and Rakes [25] and Phillips [39]. This model generates debris amounts based on estimated population. In addition to the population, other inputs of the model are hurricane intensity, vegetation characteristics, precipitation characteristics and commercial density. Further details of the USACE hurricane debris estimation model input parameters are provided in Table A1, Table A2, Table A3 and Table A4 of Appendix A. The total amount of debris generated in an affected region can be estimated using Equation (4) as follows:
where
Q = H × C × V × R × S
- C
- hurricane intensity
- H
- number of households
- V
- vegetation characteristics of the affected region
- R
- commercial density of the affected region
- S
- precipitation characteristic
4.2.2. Debris Allocation to the Selected Temporary Disaster Debris Management Sites
The environment after the occurrence of a disaster is very uncertain. In this kind of situation, we cannot obtain any exact information. Keeping this in view, fuzzy possibilistic programming has been used. Fuzzy possibilistic programming is the most suitable for situations where we have no previous data and the available information is poorly known [40]. In possibility programming, each poorly known parameter has its own possibility distribution. These possibility distributions represent the possible degree of occurrence of each poorly-known parameter [41].
In addition to this, after the occurrence of a disaster, resources are always scarce and managers have to utilize them efficiently. Transportation cost is one of the major expenses in humanitarian operations that accounts for around 80 percent of the total cost [42]. Keeping in mind its importance, the objective of debris transportation cost minimization is considered in this optimization model. This model efficiently allocates the amount of debris from each affected region to the selected locations of TDDMS with a minimum total transportation cost in the uncertain environment of the response phase.
Objective function:
subject to:
The objective function of the debris allocation model that minimizes the total transportation cost is depicted by Equation (5). Equation (6) enforces that the quantity of debris transported from an affected region to a TDDMS should not exceed the capacity of the TDDMS. Equation (7) ensures that all waste from disaster-affected regions is collected. Equation (8) shows the non-negativity nature of decision variables.
Data collection is performed to solve the model and generate useful results. Suppose is a triangular fuzzy parameter, then the first step is to estimate its most likely value, . The most likely value of each parameter is picked from various sources, and all required calculations are done beforehand. Thereafter, two random numbers n1 and n2 are generated between 0.2 and 0.8 using a uniform distribution, and the pessimistic and the optimistic value of a fuzzy number are estimated using Equations (9) and (10), respectively [43].
To solve the proposed fuzzy possibilistic optimization model, it is de-fuzzified and converted into its equivalent form of the crisp model. This de-fuzzification methodology is based on the Lai and Hwang [44] approach. Assume a general form of fuzzy linear programming model as follows:
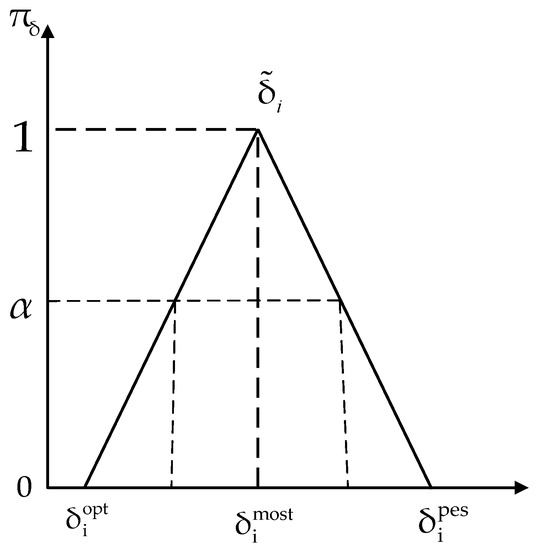
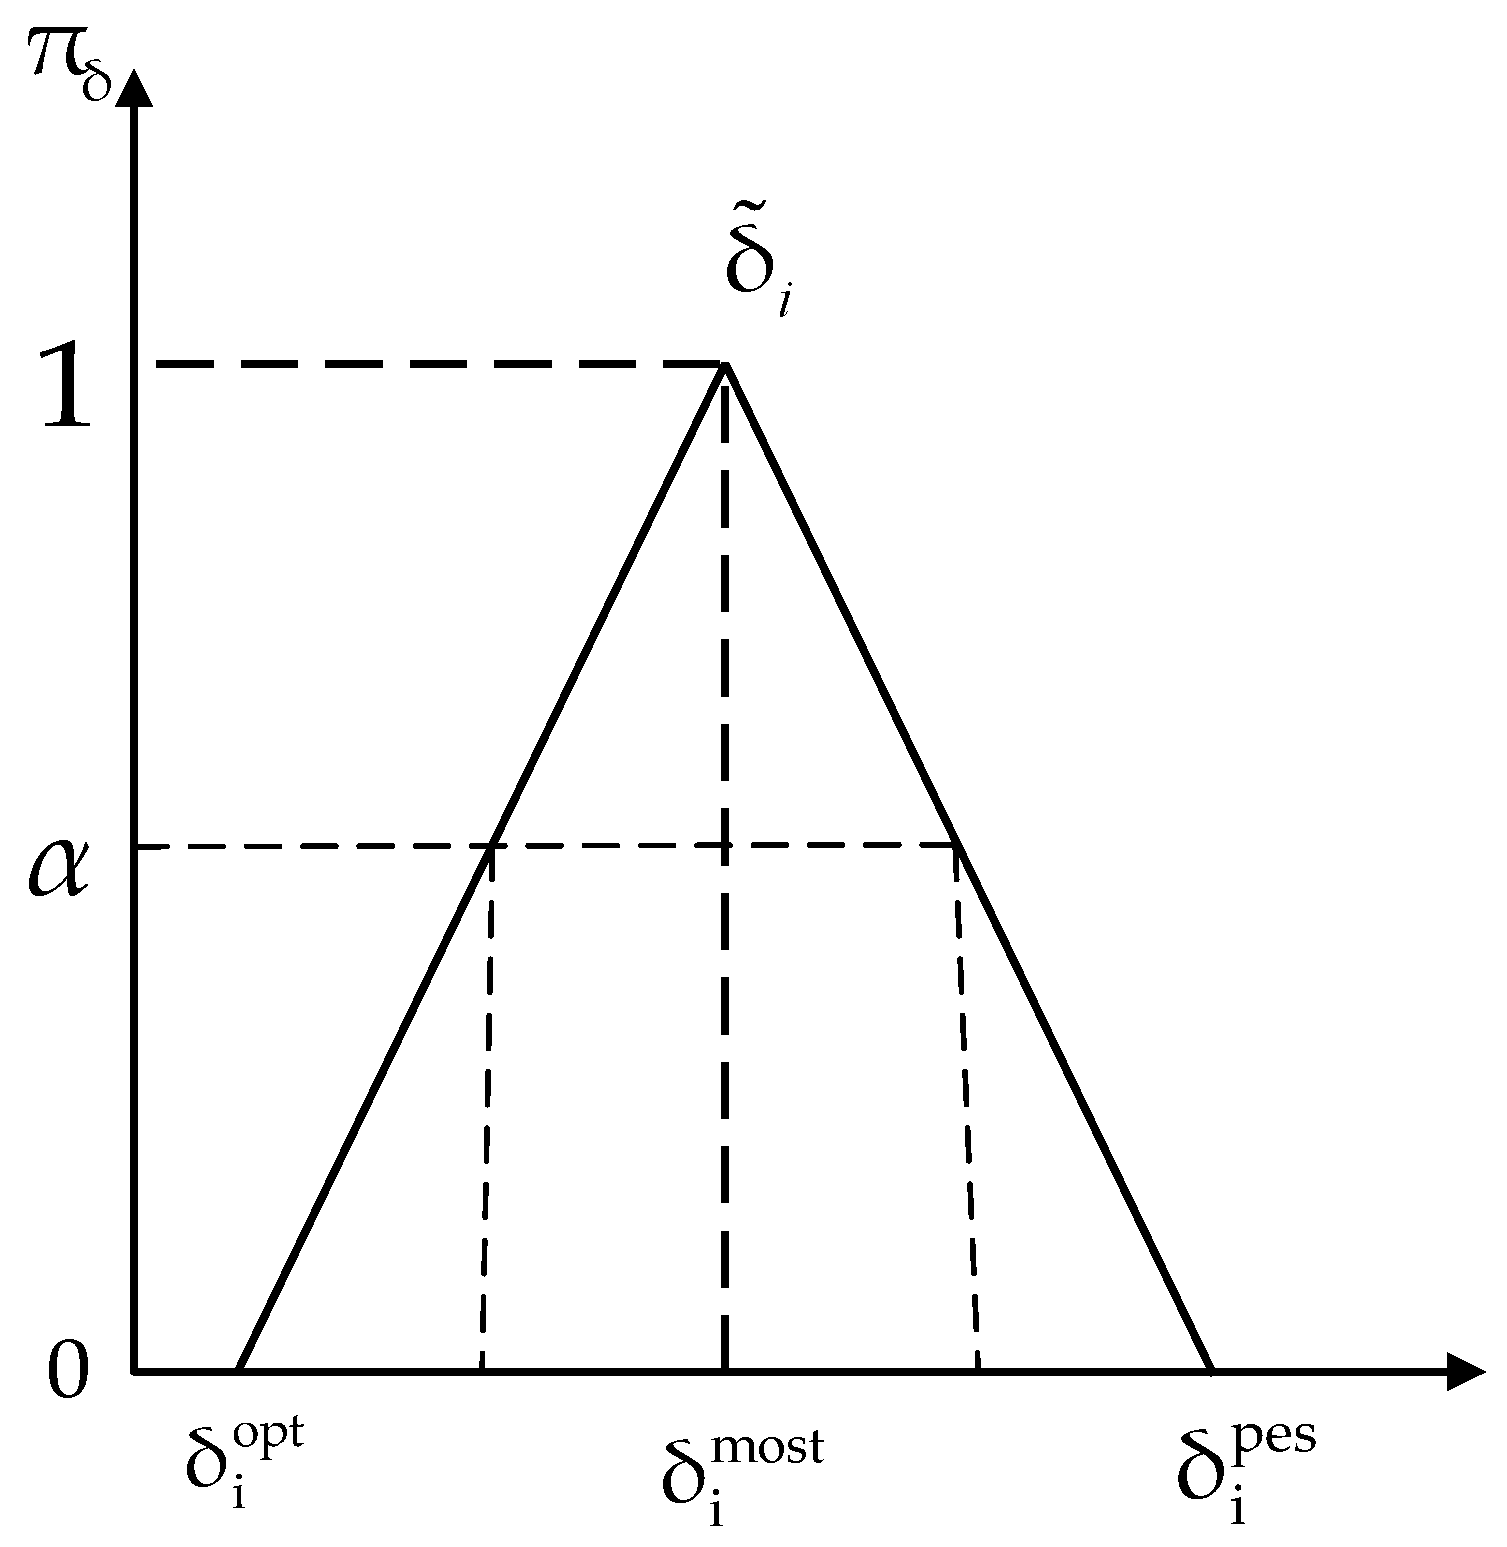
For instance, all i are imprecise parameters following a triangular possibility distribution as shown in Figure 3, where , and are the most possible value, most pessimistic value and most optimistic value for the imprecise parameter, and is the possibility distribution. When normalized, and . Equation (11) can also be written as follows:
where , and The objective function assumed in Equation (11) is an imprecise objective function following a triangular possibility distribution. For de-fuzzification of the imprecise objective function, the solution approach proposed by Lai and Hwang [44] is implemented. According to this approach, if α is the minimal acceptable possibility for an imprecise objective function, then we can obtain its crisp equivalent form using Equation (12) as follows:
where are the most optimistic and pessimistic values of acceptable events with a confidence level of α. In Equation (12), to minimize the uncertainty of the information, a minimum possibility of acceptable events is set.
Figure 3.
Triangular possibility distribution of .
The concept was further modified by Jiménez et al. [45] using the “expected interval” and “expected value” of a fuzzy number, which was originally developed by Dubois and Prade [46]. For more detailed information regarding the de-fuzzification process, readers are referred to consult Jiménez et al. [45]. According to Jiménez et al. [45], if is a triangular fuzzy number, then its Expected Interval (EI) and Expected Value (EV) can be calculated using Equations (14) and (15) as follows:
The uncertain objective function of transportation cost minimization model is converted into the crisp form by using Equation (15), while uncertain constraints are converted into the equivalent crisp form using Equation (14), where α represents the confidence level decided by the decision maker based on the available information and perception. To generate various solutions, the decision maker may vary the value of α from 0–1 [43]. Equations (16)–(19) represent the complete equivalent crisp model.
such that:
After converting the fuzzy possibilistic model into equivalent crisp form, the results are obtained.
5. Solution Methodology
The main objective of this study is to propose a methodology to support the decision makers during the response phase. In the post-disaster scenario, obtaining accurate information is very difficult, and historical data are not available. To deal with such an uncertain environment, expert opinion is of utmost importance. Thus, in such situations, solution methodologies that use a subjective approach are very effective. Therefore, the solution methodology proposed in this research is a combination of multi-criteria decision-making techniques and an optimization technique that requires expert input.
In view of the aforementioned points, ANP and fuzzy TOPSIS are applied for TDDMS selection, and fuzzy possibilistic programming is used for debris allocation due to the following reasons:
- Using full ANP to obtain the best suitable locations of TDDMS is impractical due to the large number of pairwise comparisons. For example, if there are p number of evaluation criteria and q number of alternatives, then to run a full ANP solution, p·q (q-1)/2 pairwise comparisons will be performed. Therefore, to avoid a large number of pairwise comparisons, fuzzy TOPSIS is used to obtain the final ranking of TDDMS alternates.
- The proposed model is developed for the response phase, which is highly chaotic in nature. As data collection of evaluation criteria for the available TDDMS alternates is a time-consuming process, using a stochastic approach is not suitable. For such situations, the fuzzy set theory seems a more realistic approach that allows the decision makers to incorporate incomplete and unquantifiable information of TDDMS in a post-disaster scenario.
- Since the post-disaster situation is very chaotic, obtaining accurate information in such an environment is very difficult. This research takes advantage of using fuzzy possibilistic programming to tackle the imprecise nature of the available information. The advantage of using fuzzy possibilistic programming over a stochastic approach is that it does not require a large set of data points.
Details of the proposed solution methodology are provided below.
5.1. ANP Solution Methodology
To determine the relationship of interdependence among evaluation criteria and to obtain the relative importance of evaluation criteria, the ANP technique is used. The advantage of ANP is that it can model problems in which relationships between decision attributes are not distinct and an attribute may be affected directly or indirectly by other attributes. The ANP technique consists of the following steps:
- Step 1
- Without assuming the dependence relationship among evaluation criteria, a pairwise comparison decision matrix is developed by using a 1–9 preference scale shown in Table 3. A pairwise comparison of all of the criteria can be depicted in the form of a matrix as follows:This matrix provides local priority vector “wl”.
- Step 2
- The consistency test is performed in this step. When decision makers develop many pairwise comparisons, they may lose track of the previous responses. Therefore, a Consistency Index (CI) is calculated using Equation (21) to make the responses consistent [47].Finally, the Consistency Ratio (CR) is calculated by dividing CI with the Random Index (RI). The value of the CR should be less than 10%. If the CR value is higher than 10%, then subjective judgments need to be revised by the decision makers.
- Step 3
- In this step, criteria weights with the consideration of interdependence among the evaluation criteria are obtained. For this purpose, a pairwise comparison matrix M considering interdependence among evaluation criteria is developed by asking the questions: Which criterion will affect criterion l more, m or n, and how much more will it affect if?
- Step 4
- To obtain the interdependence priorities of the evaluation criteria, the results obtained in Step 2 and Step 4 are synthesized as follows:
5.2. Fuzzy TOPSIS Solution Methodology
TOPSIS is used in several fields to rank the available alternatives. Even though TOPSIS is a very useful technique, it has some drawbacks. The major issue with TOPSIS is that the performance ratings and weights are taken as crisp values. As a result, this technique is unable to handle the uncertainty associated with decision maker’s perception of the crisp values [32]. Because the performance ratings are judgments made by human beings, an exact numerical value cannot accurately represent the real situation. To handle the uncertainty and ambiguity associated with performance ratings, using a fuzzy set theory seems a more realistic approach that allows the decision maker to incorporate incomplete and unquantifiable information into the decision model [34].
The concept of fuzzy TOPSIS was developed by Chen [34] with linguistic variables instead of numerical values. In almost all of the studies on fuzzy TOPSIS, the Triangular Membership Function (TMF) is used as it is the most appropriate membership function to use when the information is subjective and incomplete. In addition to this, the triangular fuzzy number is easy to use and calculate [34,48]. In light of the fuzzy set theory definitions summarized in Section 3.4, the fuzzy TOPSIS procedure is as follows:
- Step 1
- Choose a linguistic variable from expert opinions for every alternative with respect to criteria and develop the matrix as follows:In the above matrix:set of available alternatesset of evaluation criteriaset of performance ratingsThe fuzzy linguistic variable already has a value that belongs to [0, 1]; therefore, it does not require normalization. Thus, the matrix can be directly named as the normalized decision matrix.
- Step 2
- Calculate the weighted normalized decision matrix by multiplying each column of the normalized decision matrix with the associated weight obtained from Equation (3).
- Step 3
- Calculate the FPIS and FNIS using Equations (25) and (26) as follows:where and , { j = 1, 2, ... n}.In Equations (25) and (26), j′ is associated with the benefit criteria and j″ is associated with the cost criteria.
- Step 4
- Obtain the distance of each alternate from its FPIS and FNIS using Equations (27) and (28) as follows:where is the distance between two fuzzy numbers calculated from Equation (2).
- Step 5
- Calculate the coefficient of closeness (cci) to the positive ideal solution as follows:
6. Numerical Example
Karachi, the most populated city in Pakistan, has been chosen as a case study for this research. It is the largest city of the country and the seventh most populous city in the world. The area of Karachi is 3527 km2 with an estimated population of 10,052,000 persons. This city is located on the Arabian Sea coastline. A hurricane disaster is considered in this numerical example.
Karachi is divided into 18 towns on the basis of population density. We obtained the population information for each town from Karachi Metropolitan Corporation (KMC). Based on the population and using the United States Army Corps of Engineers (USACE) debris estimation model, amounts of disaster waste are estimated. A “low precipitation” and a hurricane of “Category 2” are considered. Other inputs of USACE debris estimation model are used in accordance with the available information.
6.1. Phase-1 Temporary Disaster Debris Management Site Selection
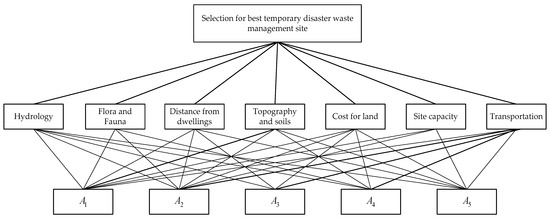
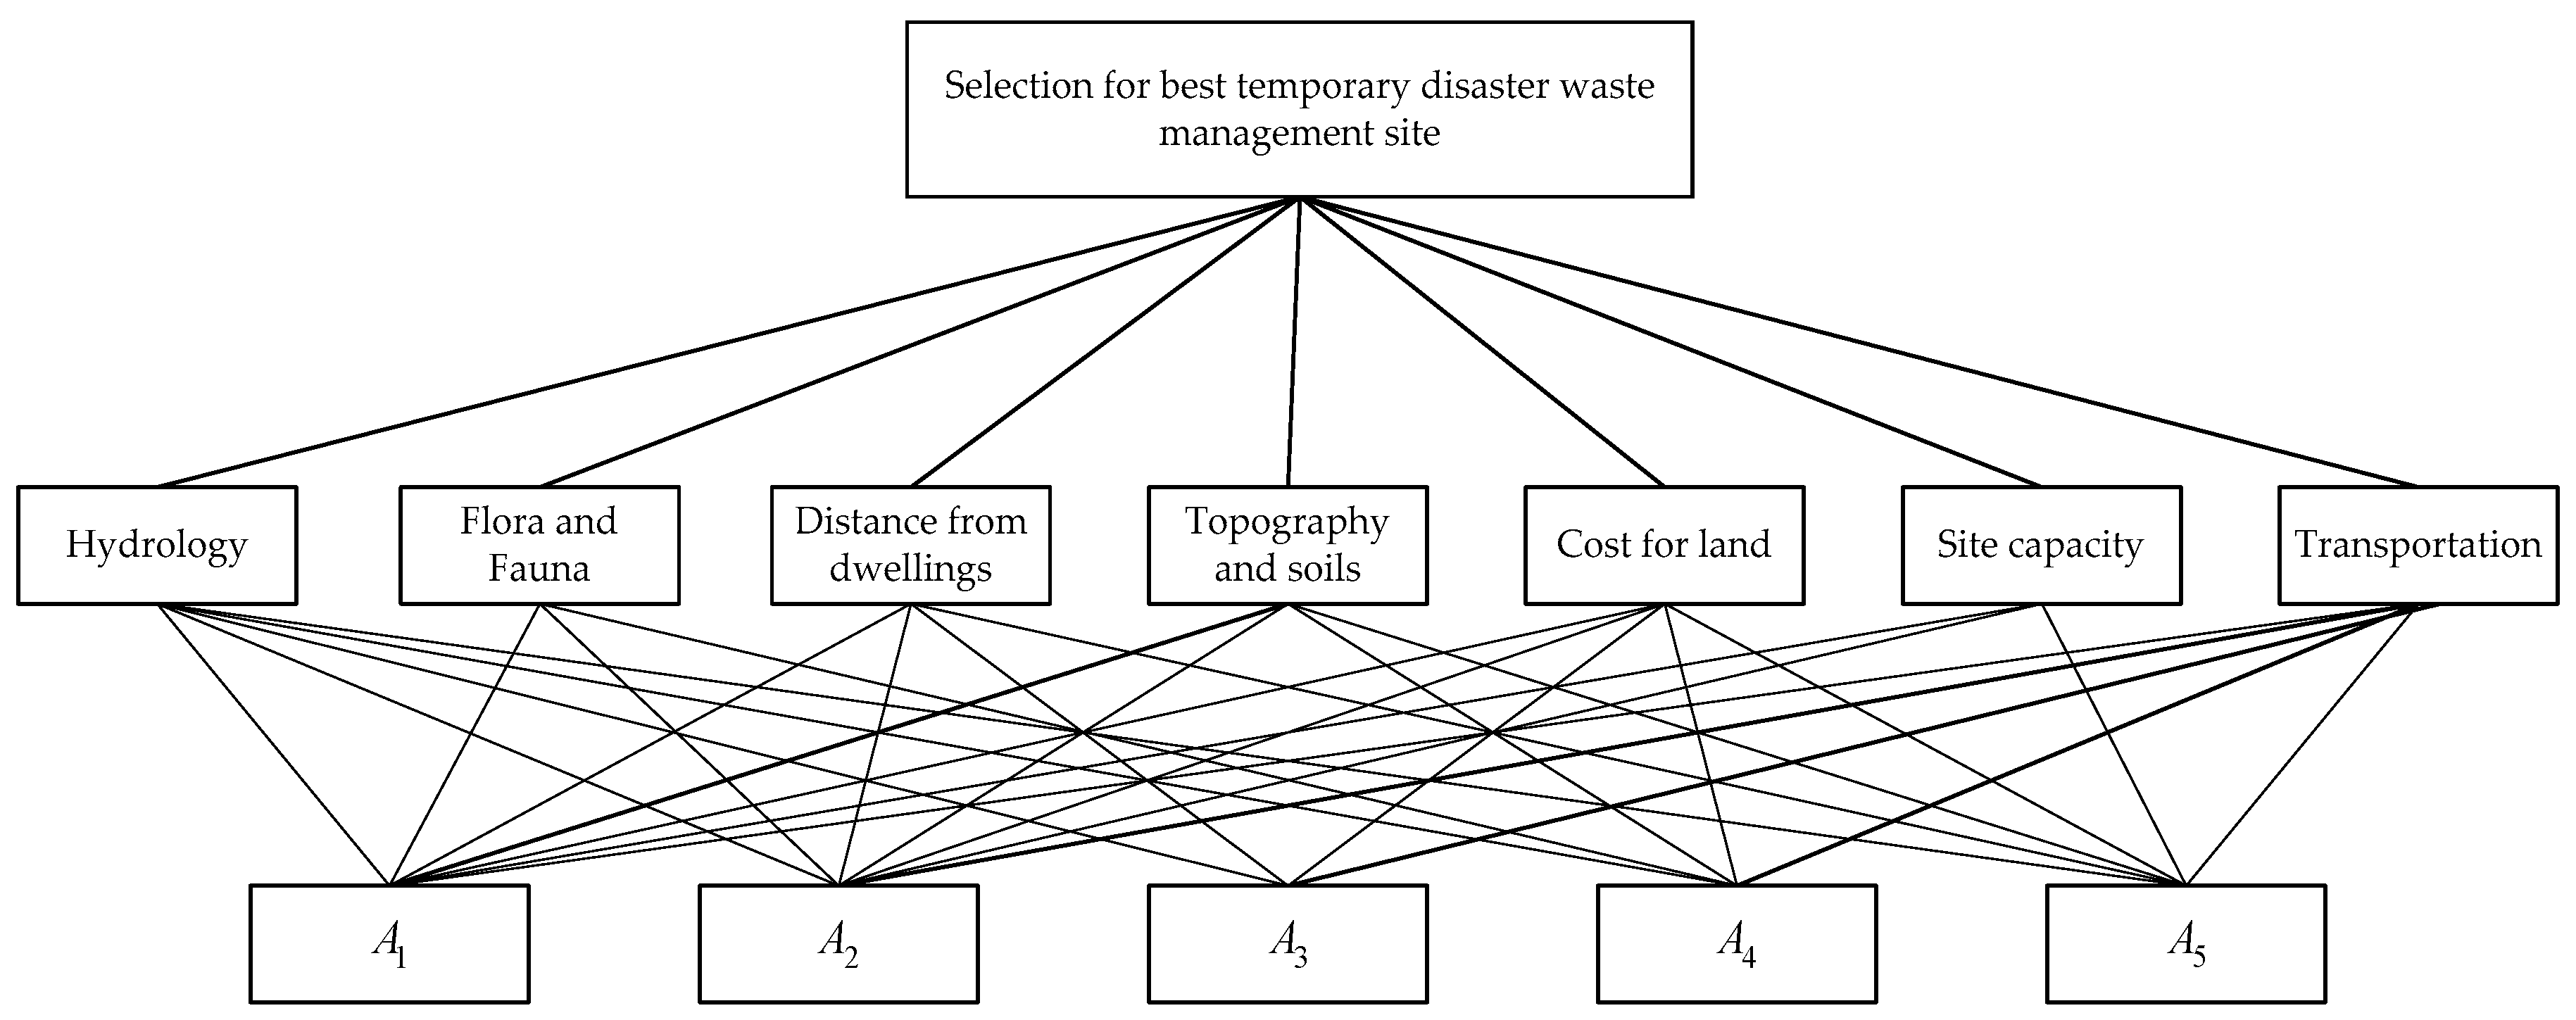
Five sites named Gharo (A1), Gadap (A2), Hub (A3), Noriabad (A4) and Sajawal (A5) are selected as potential candidates for TDDMS. In the selection of the potential disaster waste management sites, expert opinions and information obtained from geological surveys of Pakistan are the major sources. Further, in consultation with the experts and from the literature review, seven evaluation criteria, hydrology, distance from dwellings, the costs of land, transportation, flora and fauna, topography and soil and site capacity, are defined. Further details of each criterion are mentioned in Table 2. Storage capacities of all of the possible candidate TDDMS are provided in Table 5.
Table 5.
Candidate TDDMS sites with their storage capacities.
To find the best alternative, each candidate site is evaluated on the basis of seven evaluation criteria provided in Table 2. The decision hierarchy structure with evaluation criteria and the available alternates is shown in Figure 4.
Figure 4.
The decision hierarchy for selection of temporary disaster debris management site.
6.1.1. Calculating the Weights for Each Evaluation Criterion Using ANP
- Step 1
- To define the relative importance of each criterion, experts develop a preference scale, which is shown in Table 3. By using this scale, individual pairwise comparisons are made as shown in Table 6.Table 6. Pairwise comparison.
- Step 2
- In this step, the pairwise comparison table is normalized. This normalized eigenvector represents the local priority of these criteria because it was assumed that all of the evaluation criteria are independent of each other. In addition to this, while making the pairwise comparison table, it is quite possible that one may lose track of the previous responses. To check this factor, the CR is calculated. To make the weights consistent, the value of the CR should be less than 0.1. Our CR value is 0.051425. The local priority weights of each criterion and the values of the CI, RI and CR are shown in Table 7.Table 7. Local criteria weights and consistency analysis. CI, Consistency Index; RI, Random Index; CR, Consistency Ratio.
- Step 3
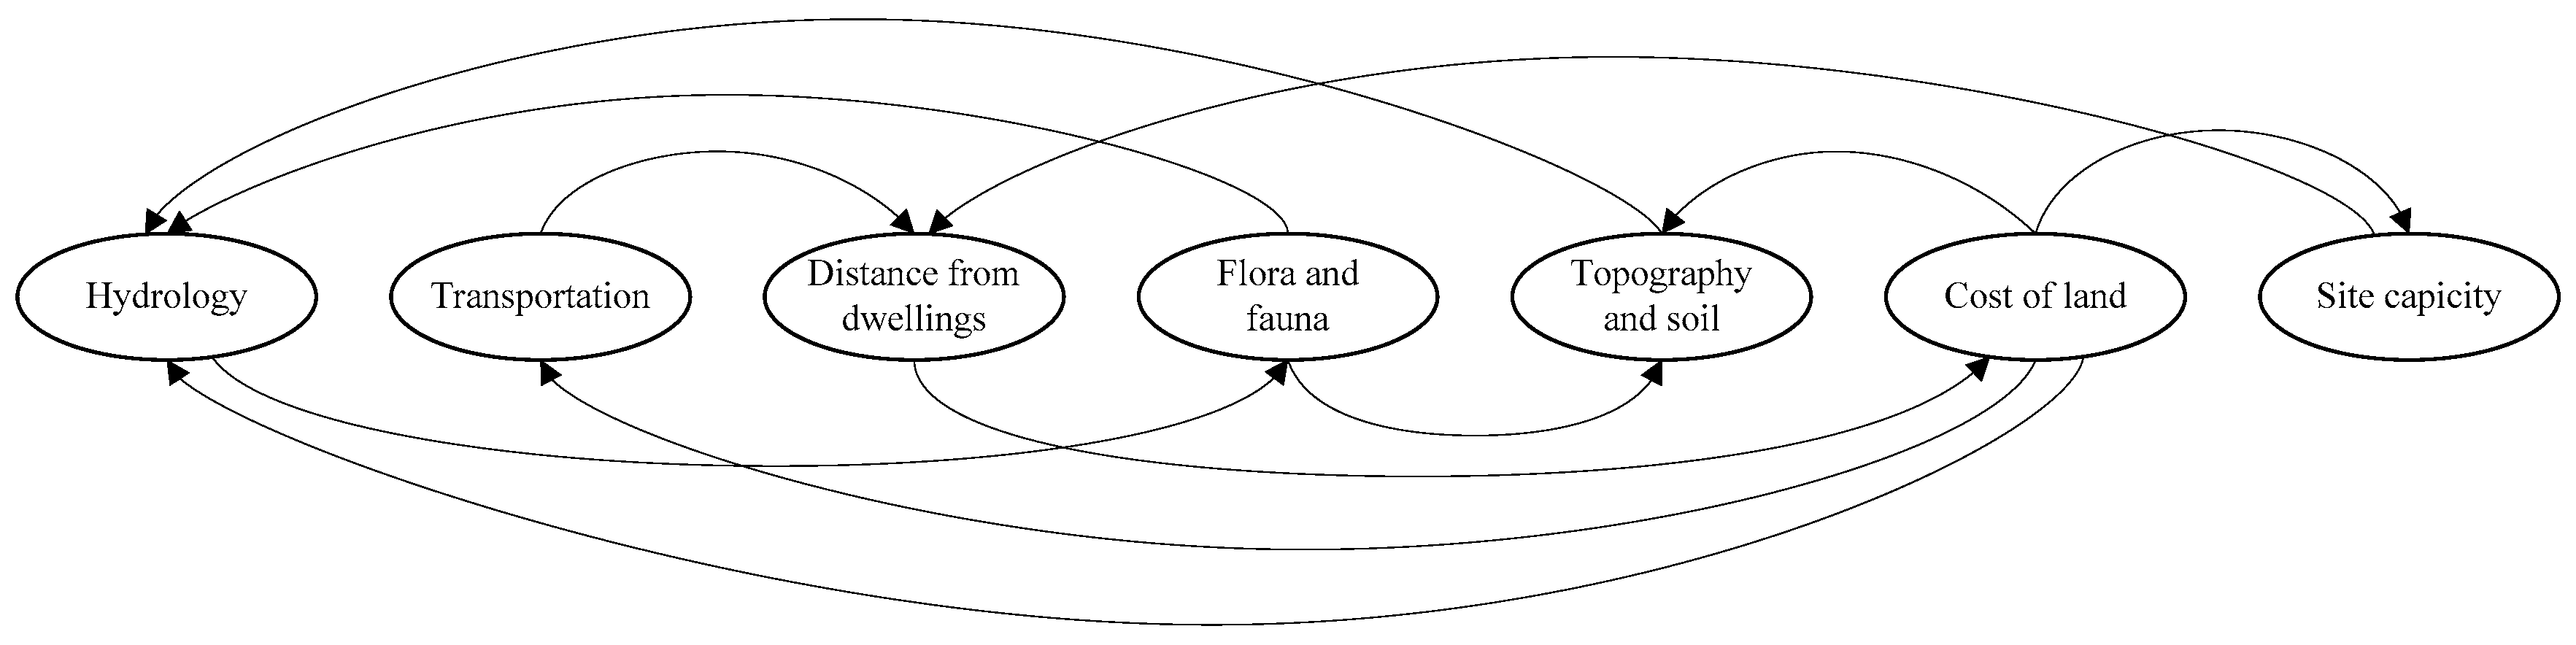
- In this step, the interdependence among the evaluation criteria is analyzed, and the degree of relative impact is defined. For this purpose, the expert team examined the effect of all TDDMS evaluation criteria on each other using a pairwise comparison. For example, while selecting a TDDMS, given the evaluation criterion “hydrology”, which other evaluation criteria contribute, and how much do they contribute? The zero value represents that there is no dependence between two evaluation criteria. The degree of relative impact of all evaluation criteria is provided in Table 8.Table 8. Degree of relative impact for all TDDMS evaluation criteria.
- Step 4
- Finally, weights for TDDMS evaluation criteria considering interdependence are calculated by synthesizing the obtained results in Step 2 and Step 3 as follows:
The relationship of the dependence among TDDMS evaluation criteria is represented schematically in Figure 5.
Figure 5.
Relationship among evaluation criteria.
6.1.2. Fuzzy TOPSIS Implementation to Determine the Final Ranking of Available Alternatives
In this stage, the fuzzy TOPSIS method is used to rank the available alternatives. For this purpose, a fuzzy evaluation matrix is constructed. In the fuzzy evaluation matrix, each alternative is evaluated with respect to the evaluation criteria as shown in Table 9. This matrix contains linguistic terms that are not written mathematically. Thus, to convert these linguistic variables into numerical values, the triangular fuzzy number is used. In this study, linguistic variables are converted into the triangular fuzzy numbers using Table 4.
Table 9.
Fuzzy evaluation matrix for available alternates.
In the next phase, a fuzzy weighted normalized decision matrix is determined. Because the fuzzy triangular number already has a value that belongs to [0, 1], it does not require the normalized decision matrix. The weighted normalized decision matrix is obtained by multiplying each column of the evaluation criteria with the weight calculated from ANP in Phase-1. The resulting weighted normalized decision matrix is shown in Table 10.
Table 10.
Weighted normalized decision matrix.
After the weighted normalized decision matrix is obtained, the next step is to determine the distance of each alternate from its FPIS and FNIS. The value of FPIS and FNIS is and for benefit criteria, while and for cost criteria. In our model, “costs of land” and “transportation” criteria are cost criteria, and the rest of the five criteria, hydrology, distance from dwellings, flora and fauna, topography and soil and site capacity, are benefit criteria. The next step is to calculate the values of and by using Equations (27) and (28). Finally, the values of the coefficient of closeness (cci) for all alternatives, which are shown in Table 11, are determined by using Equation (29).
Table 11.
Fuzzy TOPSIS results.
The results obtained after implementing fuzzy TOPSIS are shown in Table 11. The last column of Table 11 shows values of cci. As the value of cci approaches one, an alternate moves closer to the fuzzy positive ideal solution and away from its fuzzy negative ideal solution. Based on the values of cci, the ranking of the alternates in descending order is A5, A3, A2, A4 and A1. The alternate A5 has the highest cci value; thus, it is the best available alternate among all. Similarly, A3 and A2 are the second and third best alternates, respectively. According to the total amount of disaster debris, the best three sites A5, A3 and A2 are selected for disaster debris storage.
6.2. Phase-2 Disaster Debris Allocation Optimization Model
In the second phase, a fuzzy possibilistic debris allocation model is proposed. From the first phase, using the multi-criteria decision-making techniques ANP and fuzzy TOPSIS, a descending order of available alternates is obtained. In accordance with the estimate of the amount of debris, the top three TDDMS, named Hub (A3), Sajawal (A5) and Gadap (A2), are selected for debris allocation. The selected locations of TDDMS with their debris storage capacities are listed in Table 12.
Table 12.
Selected temporary sites and their storage capacities.
The most likely values of parameters, the amount of debris in each disaster-affected town and debris transportation costs ($/ton) between affected regions and selected TDDMS locations are given in Table 13 and Table 14, respectively.
Table 13.
Amount of debris in disaster-affected regions.
Table 14.
Transportation cost between disaster-affected regions and selected temporary sites ($/ton).
6.3. Results and Discussion
In this model, the parameters debris amount, the capacity of TDDMS and debris transportation cost are considered uncertain. A triangular possibility distribution based on the study by Lai and Hwang [44] was used for each uncertain parameter to obtain the results. After converting the fuzzy possibilistic model into its equivalent crisp form, the most likely, pessimistic and optimistic values for each uncertain parameter were utilized. This debris allocation optimization model was solved using Lingo 16.0 optimization software (LINDO SYSTEMS Inc., Chicago, USA) on a PC with a processor of 3.40 GHz, Core i7 and 8.0 GB RAM.
In the proposed framework for TDDMS selection and debris allocation, importance weights of TDDMS evaluation criteria are very sensitive values that may totally change the final results. As an explanation of how a change of importance weights for TDDMS evaluation criteria may change the results, two different scenarios are provided below.
6.3.1. Scenario-1
In Scenario-1, original values of criteria importance weight that we obtain after implementing ANP are used. The values of criteria importance weight are provided in Table 15. In this scenario, evaluation criteria are arranged in descending order according to their importance weight as follows: the costs of land, distance from dwellings, site capacity, hydrology, transportation, flora and fauna and topography and soil.
Table 15.
TDDMS evaluation criteria weights for Scenario-1.
Using the importance weights provided in Table 15, the following ranking of the TDDMS alternates is obtained in descending order: A5, A3, A2, A4 and A1. At the α-value of 0.8, a total of 4,283,552 tons of debris is generated. According to the total amount of the debris top three sites, A5, A3 and A2 are selected for debris allocation from disaster-affected regions. Capacities of TDDMS and debris transportation cost per ton between selected locations of TDDMS and disaster-affected regions are provided in Table 12 and Table 14, respectively. By using the provided information and at an α-value of 0.8, we obtain that total amounts of debris transported to TDDMS-Hub (A3), TDDMS-Gadap (A2) and TDDMS-Sajawal (A5) are 1,980,000 tons, 1,115,552 tons and 1,188,000 tons, respectively. Detailed results regarding the amounts of debris allocated from disaster-affected regions to each selected TDDMS are provided in Table 16.
Table 16.
Allocated amounts of debris from each affected region to selected TDDMS for Scenario-1.
6.3.2. Scenario-2
To depict how TDDMS evaluation criteria importance weights can change the ranking of available alternates, another scenario is studied. In this scenario, the importance weight of criterion “hydrology” is interchanged with “site capacity”, and the importance weights of criterion “transportation” and “distance from dwellings” are interchanged. Because the sum of importance weights of all criteria must be equal to one, i.e., to develop a new scenario, the interchange of weights is the best option. Interchanged importance weights of criteria are provided in Table 17.
Table 17.
TDDMS evaluation criteria weights for Scenario-2.
According to these importance weights, by implementing the TOPSIS technique, we obtained the following ranking of TDDMS alternates in descending order: A5, A4, A3, A2 and A1. The α-value in the second scenario is 0.8 (similar to Scenario-1), thus a total 4,283,552 tons of debris are generated. According to the total amount of debris and the capacities of TDDMS, the top three sites TDDMS-Sajawal (A5), TDDMS-Noriabad (A4) and TDDMS-Hub (A3) are selected to allocate debris from disaster-affected regions. Debris storage capacities of selected TDDMS and per ton debris transportation costs between affected regions and TDDMS are provided in Table 18.
Table 18.
Debris transportation costs between disasters-affected regions and selected TDDMS ($/ton).
The total debris transported from all disaster-affected regions to TDDMS-Hub (A3), TDDMS-Noriabad (A4) and TDDMS-Sajawal (A5) is 1,980,000 tons, 1,115,552 tons and 1,188,000 tons, respectively. Detailed results for Scenario-2, obtained from the fuzzy possibilistic debris allocation optimization model, are provided in Table 19.
Table 19.
Allocated amounts of debris from each affected region to selected TDDMS for Scenario-2.
By comparing the detailed results of both scenarios provided in Table 16 and Table 19, it is observed that both results are different from each other. This difference shows that the weights of TDDMS evaluation criteria are of utmost importance and need to be developed very carefully. In addition to the criteria weight, another parameter that is very sensitive is the α-value. The value of α is decided by the decision maker, based on the available information and perception. The environment after the occurrence of a disaster is very uncertain. In such situations, fuzzy possibilistic programming enables the decision maker to include the accuracy probability of the collected information (α). In this research, the results are obtained at α = 0.8.
7. Conclusions
This study proposed a two-phase framework for sustainable disaster debris management in a post-disaster scenario. In the first phase, the best suitable locations of TDDMS among available alternatives were selected using a combination of multi-criteria decision-making techniques: ANP and fuzzy TOPSIS. In the second phase of the framework, a debris allocation optimization model was developed in which fuzzy possibilistic programming was used to deal with the high degree of uncertainty during the post-disaster environment. Using these techniques, the model obtained a sustainable supply chain network by which one can select suitable locations and optimize the debris allocation. Hence, the disaster waste can be recycled in an efficient way that would increase the sustainability of a disaster-affected region. One of the goals of this study was to propose a methodology for TDDMS selection considering all regional and municipal constraints. The advantage of the proposed methodology is that it enables the decision makers to incorporate qualitative data of TDDMS in the model, which is its major contribution to the debris management literature. The numerical study proved that the qualitative TDDMS data are very important for sustainable debris management. One of the limitations of this study is that it does not consider all of the processing stages of sustainable debris management. In addition to TDDMS, a complete sustainable debris management process includes debris recycling, incineration and landfilling. Hence, designing a supply chain network by including debris recycling, incineration and landfilling can be a possible extension of this research. Another immediate extension of this research is to determine the minimum number of resources (excavators, cranes, trucks, labor, etc.) required to finish the debris collection process in a certain time span. The reason is, after the occurrence of a disaster, regional governments would be under pressure to complete the debris collection operations in a minimal time span. Further, during debris management, there exist different types of hazardous wastes, which require special handling techniques. While implementing this provided debris management framework, managers must follow the guidelines proposed by environmental protection agencies. For example, many electronic appliances contain ozone-depleting refrigerants and compressor oils. Before recycling these appliances, these refrigerants must be extracted by certified technicians. Furthermore, future works can be considered based on a real scenario for debris management during response phase operations. This paper can be used for any further extension with some other real data, and the results may be different from these results.
Author Contributions
Muhammad Salman Habib developed the concept and drafted the manuscript, and Biswajit Sarkar supervised the overall work.
Conflicts of Interest
The authors declare no conflict of interest.
Appendix A
For the estimation of debris generated by the disaster, U.S. Army Corps of Engineers (USACE) hurricane debris estimation model has been used [6]. This model generates debris amount based on estimated population. In addition to the population, other inputs of the model are hurricane intensity, vegetation characteristics, precipitation characteristics and commercial density. The formula to calculate the amount of debris in cubic yards is shown below.
where:
Q = H × C × V × R × S
- C
- hurricane intensity
- H
- number of households
- V
- vegetation characteristics of the affected region
- R
- commercial density of the affected region
- S
- precipitation characteristic
The values of each input parameter decided by USACE debris estimation model are provided in Table A1, Table A2, Table A3 and Table A4.
Table A1.
Hurricane intensity parameter values.
Table A2.
Vegetation characteristic parameter values.
Table A3.
Population density parameter values.
Table A4.
Precipitation characteristic parameter values.
References
- Helbing, D.; Ammoser, H.; Kühnert, C. Disasters as extreme events and the importance of network interactions for disaster response management. In Extreme Events in Nature and Society; Springer: New York, NY, USA, 2006; pp. 319–348. [Google Scholar]
- Ide, K. Treatment of disaster waste generated by the great east japan earthquake. In Proceedings of the 15th Asian Regional Conference on Soil Mechanics and Geotechnical Engineering (15ARC), Fukoka, Japan, 9–13 November 2015; Volume 2, pp. 135–142. [Google Scholar]
- Naoki, W.; Etsuko, K. Optimal ordering policy in dual-sourcing supply chain considering supply disruptions and demand information. Ind. Eng. Manag. Syst. 2015, 14, 129–158. [Google Scholar]
- Brown, C.; Milke, M. Recycling disaster waste: Feasibility, method and effectiveness. Resour. Conserv. Recycl. 2016, 106, 21–32. [Google Scholar] [CrossRef] [Scilit]
- Brown, C.O. Disaster Waste Management: A Systems Approach. Ph.D. Thesis, Department of Civil and Natural Resources-Engineering, University of Canterbury, Christchurch, New Zealand, 2012. [Google Scholar]
- FEMA. Public Assistance Debris Management Guide; Federal Emergency Management Agency (FEMA): Washington, DC, USA, 2007. [Google Scholar]
- Karunasena, G.; Amaratunga, D.; Haigh, R.; Lill, I. Post disaster waste management strategies in developing countries: Case of sri lanka. Int. J. Strateg. Prop. Manag. 2009, 13, 171–190. [Google Scholar] [CrossRef] [Scilit]
- Lorca, Á.; Çelik, M.; Ergun, Ö.; Keskinocak, P. A decision-support tool for post-disaster debris operations. Procedia Eng. 2015, 107, 154–167. [Google Scholar] [CrossRef] [Scilit]
- Habib, M.S.; Lee, Y.H.; Memon, M.S. Mathematical models in humanitarian supply chain management: A systematic literature review. Math. Probl. Eng. 2016, 2016, 20. [Google Scholar] [CrossRef] [Scilit]
- Ben-Tal, A.; Chung, B.D.; Mandala, S.R.; Yao, T. Robust optimization for emergency logistics planning: Risk mitigation in humanitarian relief supply chains. Transp. Res. B Methodol. 2011, 45, 1177–1189. [Google Scholar] [CrossRef] [Scilit]
- Jotshi, A.; Gong, Q.; Batta, R. Dispatching and routing of emergency vehicles in disaster mitigation using data fusion. Socio-Econ. Plan. Sci. 2009, 43, 1–24. [Google Scholar] [CrossRef] [Scilit]
- Rawls, C.G.; Turnquist, M.A. Pre-positioning of emergency supplies for disaster response. Transp. Res. B Methodol. 2010, 44, 521–534. [Google Scholar] [CrossRef] [Scilit]
- Rawls, C.G.; Turnquist, M.A. Pre-positioning planning for emergency response with service quality constraints. OR Spectr. 2011, 33, 481–498. [Google Scholar] [CrossRef] [Scilit]
- Hong, X.; Lejeune, M.A.; Noyan, N. Stochastic network design for disaster preparedness. IIE Trans. 2015, 47, 329–357. [Google Scholar] [CrossRef] [Scilit]
- Chang, M.-S.; Tseng, Y.-L.; Chen, J.-W. A scenario planning approach for the flood emergency logistics preparation problem under uncertainty. Transp. Res. E Logist. Transp. Rev. 2007, 43, 737–754. [Google Scholar] [CrossRef] [Scilit]
- Woon-Seek, L.; Byung Soo, K.; Prudensy Febreine, O. A stock pre-positioning model to maximize the total expected relief demand of disaster areas. Ind. Eng. Manag. Syst. 2014, 13, 297–303. [Google Scholar]
- Apte, A.; Heidtke, C.; Salmeron, J. Casualty collection points optimization: A study for the district of columbia. Interfaces 2015, 45, 149–165. [Google Scholar] [CrossRef] [Scilit]
- Chou, J.S.; Tsai, C.F.; Chen, Z.Y.; Sun, M.H. Biological-based genetic algorithms for optimized disaster response resource allocation. Comput. Ind. Eng. 2014, 74, 52–67. [Google Scholar] [CrossRef] [Scilit]
- Wilson, D.T.; Hawe, G.I.; Coates, G.; Crouch, R.S. A multi-objective combinatorial model of casualty processing in major incident response. Eur. J. Oper. Res. 2013, 230, 643–655. [Google Scholar] [CrossRef] [Scilit]
- Sharkey, T.C.; Cavdaroglu, B.; Nguyen, H.; Holman, J.; Mitchell, J.E.; Wallace, W.A. Interdependent network restoration: On the value of information-sharing. Eur. J. Oper. Res. 2015, 244, 309–321. [Google Scholar] [CrossRef] [Scilit]
- Çelik, M.; Ergun, Ö.; Keskinocak, P. The post-disaster debris clearance problem under incomplete information. Oper. Res. 2015, 63, 65–85. [Google Scholar] [CrossRef] [Scilit]
- Altay, N.; Green, W.G.I. Or/ms research in disaster operations management. Eur. J. Oper. Res. 2006, 175, 475–493. [Google Scholar] [CrossRef] [Scilit]
- Grzeda, S. Use of Binomial Cluster Analysis in the Identification of Temporary Disaster Debris Management Sites. Ph.D. Thesis, School of Engineering and Applied Science—The George Washington University, Washington, DC, USA, 20 May 2012. [Google Scholar]
- Onan, K.; Ülengin, F.; Sennaroğlu, B. An evolutionary multi-objective optimization approach to disaster waste management: A case study of istanbul, Turkey. Expert Syst. Appl. 2015, 42, 8850–8857. [Google Scholar] [CrossRef] [Scilit]
- Fetter, G.; Rakes, T. Incorporating recycling into post-disaster debris disposal. Socio-Econ. Plan. Sci. 2012, 46, 14–22. [Google Scholar] [CrossRef] [Scilit]
- Hu, Z.-H.; Sheu, J.-B. Post-disaster debris reverse logistics management under psychological cost minimization. Transp. Res. B Methodol. 2013, 55, 118–141. [Google Scholar] [CrossRef] [Scilit]
- Tabata, T.; Wakabayashi, Y.; Tsai, P.; Saeki, T. Environmental and economic evaluation of pre-disaster plans for disaster waste management: Case study of Minami-Ise, Japan. Waste Manag. 2017, 61, 386–396. [Google Scholar] [CrossRef] [Scilit] [PubMed]
- Grzeda, S.; Mazzuchi, T.A.; Sarkani, S. Temporary disaster debris management site identification using binomial cluster analysis and gis. Disasters 2014, 38, 398–419. [Google Scholar] [CrossRef] [Scilit] [PubMed]
- Cheng, C.; Thompson, R.G. Application of boolean logic and gis for determining suitable locations for temporary disaster waste management sites. Int. J. Disaster Risk Reduct. 2016, 20, 78–92. [Google Scholar] [CrossRef] [Scilit]
- Kim, J.; Deshmukh, A.; Hastak, M. Selecting a temporary debris management site for effective debris removal. In Proceedings of the 10th International Conference of the International Institute for Infrastructure Resilience and Reconstruction (I3R2), Purdue University, West Lafayette, IN, USA, 20–22 May 2014. [Google Scholar]
- MujiyaUlkhaq, M.; Rizal, L.N.; Pradita, Y.A. Evaluating service quality of korean restaurants: A fuzzy analytic hierarchy approach. Ind. Eng. Manag. Syst. 2016, 15, 77–91. [Google Scholar]
- Dağdeviren, M.; Yavuz, S.; Kılınç, N. Weapon selection using the ahp and topsis methods under fuzzy environment. Expert Syst. Appl. 2009, 36, 8143–8151. [Google Scholar] [CrossRef] [Scilit]
- Sajjad, S.; Navid, K.; Abdulrasoul, T. Causes of delay in khuzestan steel company construction projects. Ind. Eng. Manag. Syst. 2016, 15, 335–344. [Google Scholar]
- Chen, C.-T. Extensions of the topsis for group decision-making under fuzzy environment. Fuzzy Sets Syst. 2000, 114, 1–9. [Google Scholar] [CrossRef] [Scilit]
- Zadeh, L.A. The concept of a linguistic variable and its application to approximate reasoning—I. Inf. Sci. 1975, 8, 199–249. [Google Scholar] [CrossRef] [Scilit]
- Janghyeok, Y.; Mujin, K.; Doyeon, K.; Jonghwa, K.; Hyunseok, P. Monitoring the change of technological impacts of technology sectors using patent information: The case of Korea. Ind. Eng. Manag. Syst. 2015, 14, 58–72. [Google Scholar]
- Shyur, H.-J.; Shih, H.-S. A hybrid mcdm model for strategic vendor selection. Math. Comput. Model. 2006, 44, 749–761. [Google Scholar] [CrossRef] [Scilit]
- Saaty, T.L.; Takizawa, M. Dependence and independence: From linear hierarchies to nonlinear networks. Eur. J. Oper. Res. 1986, 26, 229–237. [Google Scholar] [CrossRef] [Scilit]
- Phillips, B.D. Disaster Recovery, 2nd ed.; CRC Publishers, Taylor & Francis Group: Boca Raton, FL, USA, 2015; pp. 110–112. [Google Scholar]
- Selim, H.; Ozkarahan, I. A supply chain distribution network design model: An interactive fuzzy goal programming-based solution approach. Int. J. Adv. Manuf. Technol. 2008, 36, 401–418. [Google Scholar] [CrossRef] [Scilit]
- Pishvaee, M.S.; Torabi, S.A. A possibilistic programming approach for closed-loop supply chain network design under uncertainty. Fuzzy Sets Syst. 2010, 161, 2668–2683. [Google Scholar] [CrossRef] [Scilit]
- Jahre, M.; Persson, G.; Kovács, G.; Spens, K.M. Humanitarian logistics in disaster relief operations. Int. J. Phys. Distrib. Logist. Manag. 2007, 37, 99–114. [Google Scholar]
- Mari, S.; Lee, Y.; Memon, M. Sustainable and resilient garment supply chain network design with fuzzy multi-objectives under uncertainty. Sustainability 2016, 8, 1038. [Google Scholar] [CrossRef] [Scilit]
- Lai, Y.-J.; Hwang, C.-L. A new approach to some possibilistic linear programming problems. Fuzzy Sets. Syst. 1992, 49, 121–133. [Google Scholar] [CrossRef] [Scilit]
- Jiménez, M.; Arenas, M.; Bilbao, A.; Rodrı´guez, M.V. Linear programming with fuzzy parameters: An interactive method resolution. Eur. J. Oper. Res. 2007, 177, 1599–1609. [Google Scholar] [CrossRef] [Scilit]
- Dubois, D.; Prade, H. The mean value of a fuzzy number. Fuzzy Sets Syst. 1987, 24, 279–300. [Google Scholar] [CrossRef] [Scilit]
- Taylor, B.W. Introduction to Management Science, 11th ed.; Pearson Publishers: Saddle River, NJ, USA, 2012; pp. 422–430. [Google Scholar]
- Kahraman, C.; Beskese, A.; Ruan, D. Measuring flexibility of computer integrated manufacturing systems using fuzzy cash flow analysis. Inform. Sci. 2004, 168, 77–94. [Google Scholar] [CrossRef] [Scilit]

© 2017 by the authors. Licensee MDPI, Basel, Switzerland. This article is an open access article distributed under the terms and conditions of the Creative Commons Attribution (CC BY) license (http://creativecommons.org/licenses/by/4.0/).