3. Methods and Data
To compare our results with those of other studies of mega-FTAs, we use the same method, data, and trade liberalization scenario as Akahori and Yamamoto [
18] to measure the potential impact on GHG emissions of trade liberalization under the TPP. First, the GTAP model is used to estimate the changes in the economic variables of interest, such as the levels of sectoral fuel consumption, caused by the TPP. Second, the GTAP results, the GTAP CO
2 emissions database, and the GTAP non-CO
2 emissions database are used to estimate the potential impact of GHG emissions caused by the TPP.
To estimate the economic impact of the TPP, we use the static version of the GTAP model with standard closure and the GTAP 8.1 database for 2007. If the model used is the dynamic version of the GTAP model and a single period involves more than two years, the results should be converted to average annual values (Tassone et al. [
20]). As the model used in this study is not dynamic and does not contain an explicit time dimension, we cannot attach a time dimension to the changes. The changes are interpreted as the differences between two equilibria; the original equilibrium in 2007 and the alternative equilibrium associated with the policy change. Antweiler et al. [
21] decomposed the impact of trade on pollution into a scale effect, a composition effect, and a technique effect. The scale effect captures the impact of the change in the size of each economy. If the TPP increases the real GDP in each economy, the scale effect may increase GHG emissions. The composition effect captures the impact of the change in the industrial structure of each economy. As the TPP may have both positive and negative effects on the output of each industrial sector, the composition effect may have positive or negative effects on GHG emissions. The technique effect captures the impact of introducing cleaner production methods (e.g., biofuel production and utilization as a substitute for gasoline; Le et al. [
22]). Although the technique effect is likely to decrease GHG emissions, it is difficult to properly assume such technical progress. As we do not assume any technical change that has a GHG reduction effect, our results capture the scale and composition effects of the TPP and cannot capture the technique effect.
Our trade liberalization scenario assumes the complete removal of all import tariffs among the TPP members. While it is unlikely that all TPP members would simultaneously remove all import tariffs across all sectors, our scenario provides an upper bound on the possible economic impact of the TPP.
Table 2 shows the regions and sectors we use in our analysis. In order to compare our results with the results for other mega-FTAs such as the Regional Comprehensive Economic Partnership (RCEP), we combine the 129 countries and regions in GTAP 8.1 into 26 regions. We retain the original 57 industries in the database.
We measure the environmental impact of the TPP by focusing only on GHG emissions as the form of environmental load because of data-availability limitations. We use the GTAP CO2 emissions database and the GTAP non-CO2 emissions database to measure the impact of the TPP on GHG emissions.
The GTAP CO
2 emissions database provides detailed emissions data from the combustion of fossil fuels only, with CO
2 emissions calculated by multiplying the amount of fuel consumed by the emission coefficients [
4]. We assume that these emission coefficients remain unchanged following trade liberalization, and that the levels of CO
2 emissions will, therefore, change by the same proportion as the levels of sectoral fuel consumption. Thus, we calculate the post-TPP levels of CO
2 emissions by multiplying the initial level of CO
2 emissions for each sector by the corresponding change in sectoral fuel consumption from the GTAP model results. For example, CO
2 emissions produced by coal use in the electricity sector are calculated by multiplying the initial levels of CO
2 emissions resulting from coal use in the electricity sector by the change in coal use in the electricity sector derived from the GTAP results.
The GTAP non-CO
2 emissions database enables us to measure methane (CH
4), nitrous oxide (N
2O), and fluorinated GHGs (or F-gases) (namely, tetrafluorocarbon, hydrofluorocarbons, and sulfur hexafluoride) [
5]. In this database, the levels of each type of non-CO
2 emission are associated with output, endowment use, and input use by industry and private households [
23]. We assume that the levels of non-CO
2 gases change by the same proportion as the corresponding GTAP variables. This assumption allows us to calculate the post-TPP level of non-CO
2 gases by multiplying the initial level of non-CO
2 emissions by the corresponding sectoral changes derived from the GTAP results. For example, the paddy rice sector emits CH
4. We then calculate the post-TPP level of CH
4 emissions from land use in the paddy rice sector by multiplying the initial CH
4 emissions by the change in land use for paddy rice derived from the GTAP results.
Data on anthropogenic fossil fuel combustion CO
2 and all non-CO
2 GHG emissions are provided in
Table 3. All emission figures are converted to millions of metric tons (Mt) of CO
2 equivalent. Globally, about 70% of all GHG emissions are from CO
2 emissions and about 30% are from non-CO
2 emissions. Of the TPP members, the US is the largest GHG emitter, and Japan is the second largest GHG emitter.
To measure the environmental efficiency of the macroeconomy, we introduce the emission intensity index (see [
14]). The emission intensity indices of GHGs are calculated in terms of GHG emissions per unit of GDP output. A decrease in an emission intensity index means that environmental efficiency has improved.
4. Results
Under the assumption of the complete removal of all import tariffs among the TPP members, all members are likely to experience an increase in total exports and imports. In terms of real GDP, the US and Peru are likely to experience a slight decrease. Across the countries in the TPP, on average, real GDP, total exports and imports increase by 0.06%, 1.33%, and 1.56%, respectively (
Table 4). Non-TPP economies are likely to experience a decrease in real GDP. In percentage terms, the increases are the highest in Vietnam: 1.39% in GDP, 10.55% in total exports, and 15.22% in total imports.
When comparing our results with the previous studies’ results, we found the following in common. Areerat et al. [
12] also showed that the real GDP of the US and Peru decrease slightly. Burfisher et al. [
6], Kawasaki [
8], Lee and Itakura [
10], Petri et al. [
11], and Areerat et al. [
12] also showed that Vietnam has the highest real GDP growth rate. Petri et al. [
11] also showed that the TPP increases total exports in all TPP members.
In this study, we focus only on the impact of tariff elimination. Thus, our results for real GDP are relatively small when compared with the results of other studies that include the reduction of NTMs (non-tariff measures) such as Kawasaki [
8] and Petri et al. [
11]. While the maximum percentage change in GDP for our study is 1.39%, the maximum percentage change in GDP by the simulations that incorporate NTMs ranges from 2.66% (Lee and Itakura [
10]) to 20.6% (Kawasaki [
8]).
In
Table 5,
Table 6 and
Table 7, we focus on Japan and the US as the two largest TPP members (in terms of real GDP), Australia and New Zealand, given that they have the highest and second highest growth rates in non-CO
2 emissions, and China, India, and the European Union (EU) as key non-TPP member economies throughout the following discussion.
Table 5 shows the changes in the sectoral output for a year in percentage terms. Among the TPP participants, farm output (defined as the agricultural sectors “paddy rice” to “wool, silkworm cocoons,” which correspond to sectors 1–12 in
Table 2) declines in Japan, but increases in Australia, New Zealand, and the US. In percentage terms, the declines in output from the wheat sector (−77.55%) and the paddy rice sector (−37.30%) are the two largest sectoral output changes in Japan. In contrast, the rate of growth in paddy rice production is the highest or second highest of all sectors in Australia (193.46%), New Zealand (17.49%), and the US (56.41%). Livestock sector output decreases in Japan, but increases in Australia, New Zealand, and the US. Output in the electricity sector, one of the largest sources of CO
2 emissions, increases in Japan, but decreases in Australia, New Zealand, and the US.
Lee and Itakura [
10] showed that farm sector outputs decrease in Japan and increase in the US. Burfisher et al. [
6] also showed that farm sector outputs decrease in Japan and increase in Australia, New Zealand, and the US. Compared with the results of RCEP [
18] and FTAAP [
19], the impact of the TPP on the paddy rice sector output is smaller than that of the RCEP and the FTAAP.
Table 6 shows the impact of the TPP on GHG emissions. The figures in the table are changes in the GHG emissions for a year in Mt of CO
2 equivalent. In the following tables, the figures in parentheses are percentage deviations from the initial period, calculated as the amount of change divided by the initial amount. The TPP increases total TPP member and global GHG emissions by 17.79 Mt CO
2 eq. (0.17%) and 22.79 Mt CO
2 eq. (0.06%), respectively. As for our main research question, these results indicate that the TPP is likely to increase both TPP member and global GHG emissions. The main reason for increasing TPP member and global GHG emissions is non-CO
2 emissions growth in Australia (7.05 Mt CO
2 eq.) and the US (8.38 Mt CO
2 eq.). However, the magnitude of the change is relatively small (only a 0.17% increase) when compared with the original level of emissions in
Table 3. Note that because of the assumptions in our analysis these changes in the GHG emissions reflect only the composition and scale effects. If some technical change that has a GHG reducing effect is assumed and the technique effect is incorporated, GHG emissions might decline.
Total TPP member and global CO2 emissions increase by 2.99 Mt CO2 eq. (0.04%) and 6.62 Mt CO2 eq. (0.02%), respectively. Total TPP member and global non-CO2 emissions increase by 14.80 Mt CO2 eq. (0.71%) and 16.17 Mt CO2 eq. (0.16%), respectively. Among the non-TPP members, the total GHG emissions of China, India, and the EU increase by 1.01 Mt CO2 eq. (0.01%), 0.34 Mt CO2 eq. (0.02%), and 0.66 Mt CO2 eq. (0.01%), respectively.
Focusing on individual economy results, Japan experiences the largest increase in CO2 emissions (2.38 Mt CO2 eq.) among TPP members. In terms of non-CO2 emissions, Japan experiences the largest decrease (−5.97 Mt CO2 eq.), and the US and Australia experience the largest and the second largest increases (8.38 Mt CO2 eq. and 7.05 Mt CO2 eq.) among the TPP members. Among non-TPP members, China also experiences the largest change in CO2 (2.76 Mt CO2 eq.) and non-CO2 emissions (−1.75 Mt CO2 eq.). In percentage terms, Australia has the largest increase in non-CO2 emissions (4.93%) and New Zealand has the second largest increase in non-CO2 emissions (3.91%), while Japan has the largest decrease in non-CO2 emissions (−6.70%).
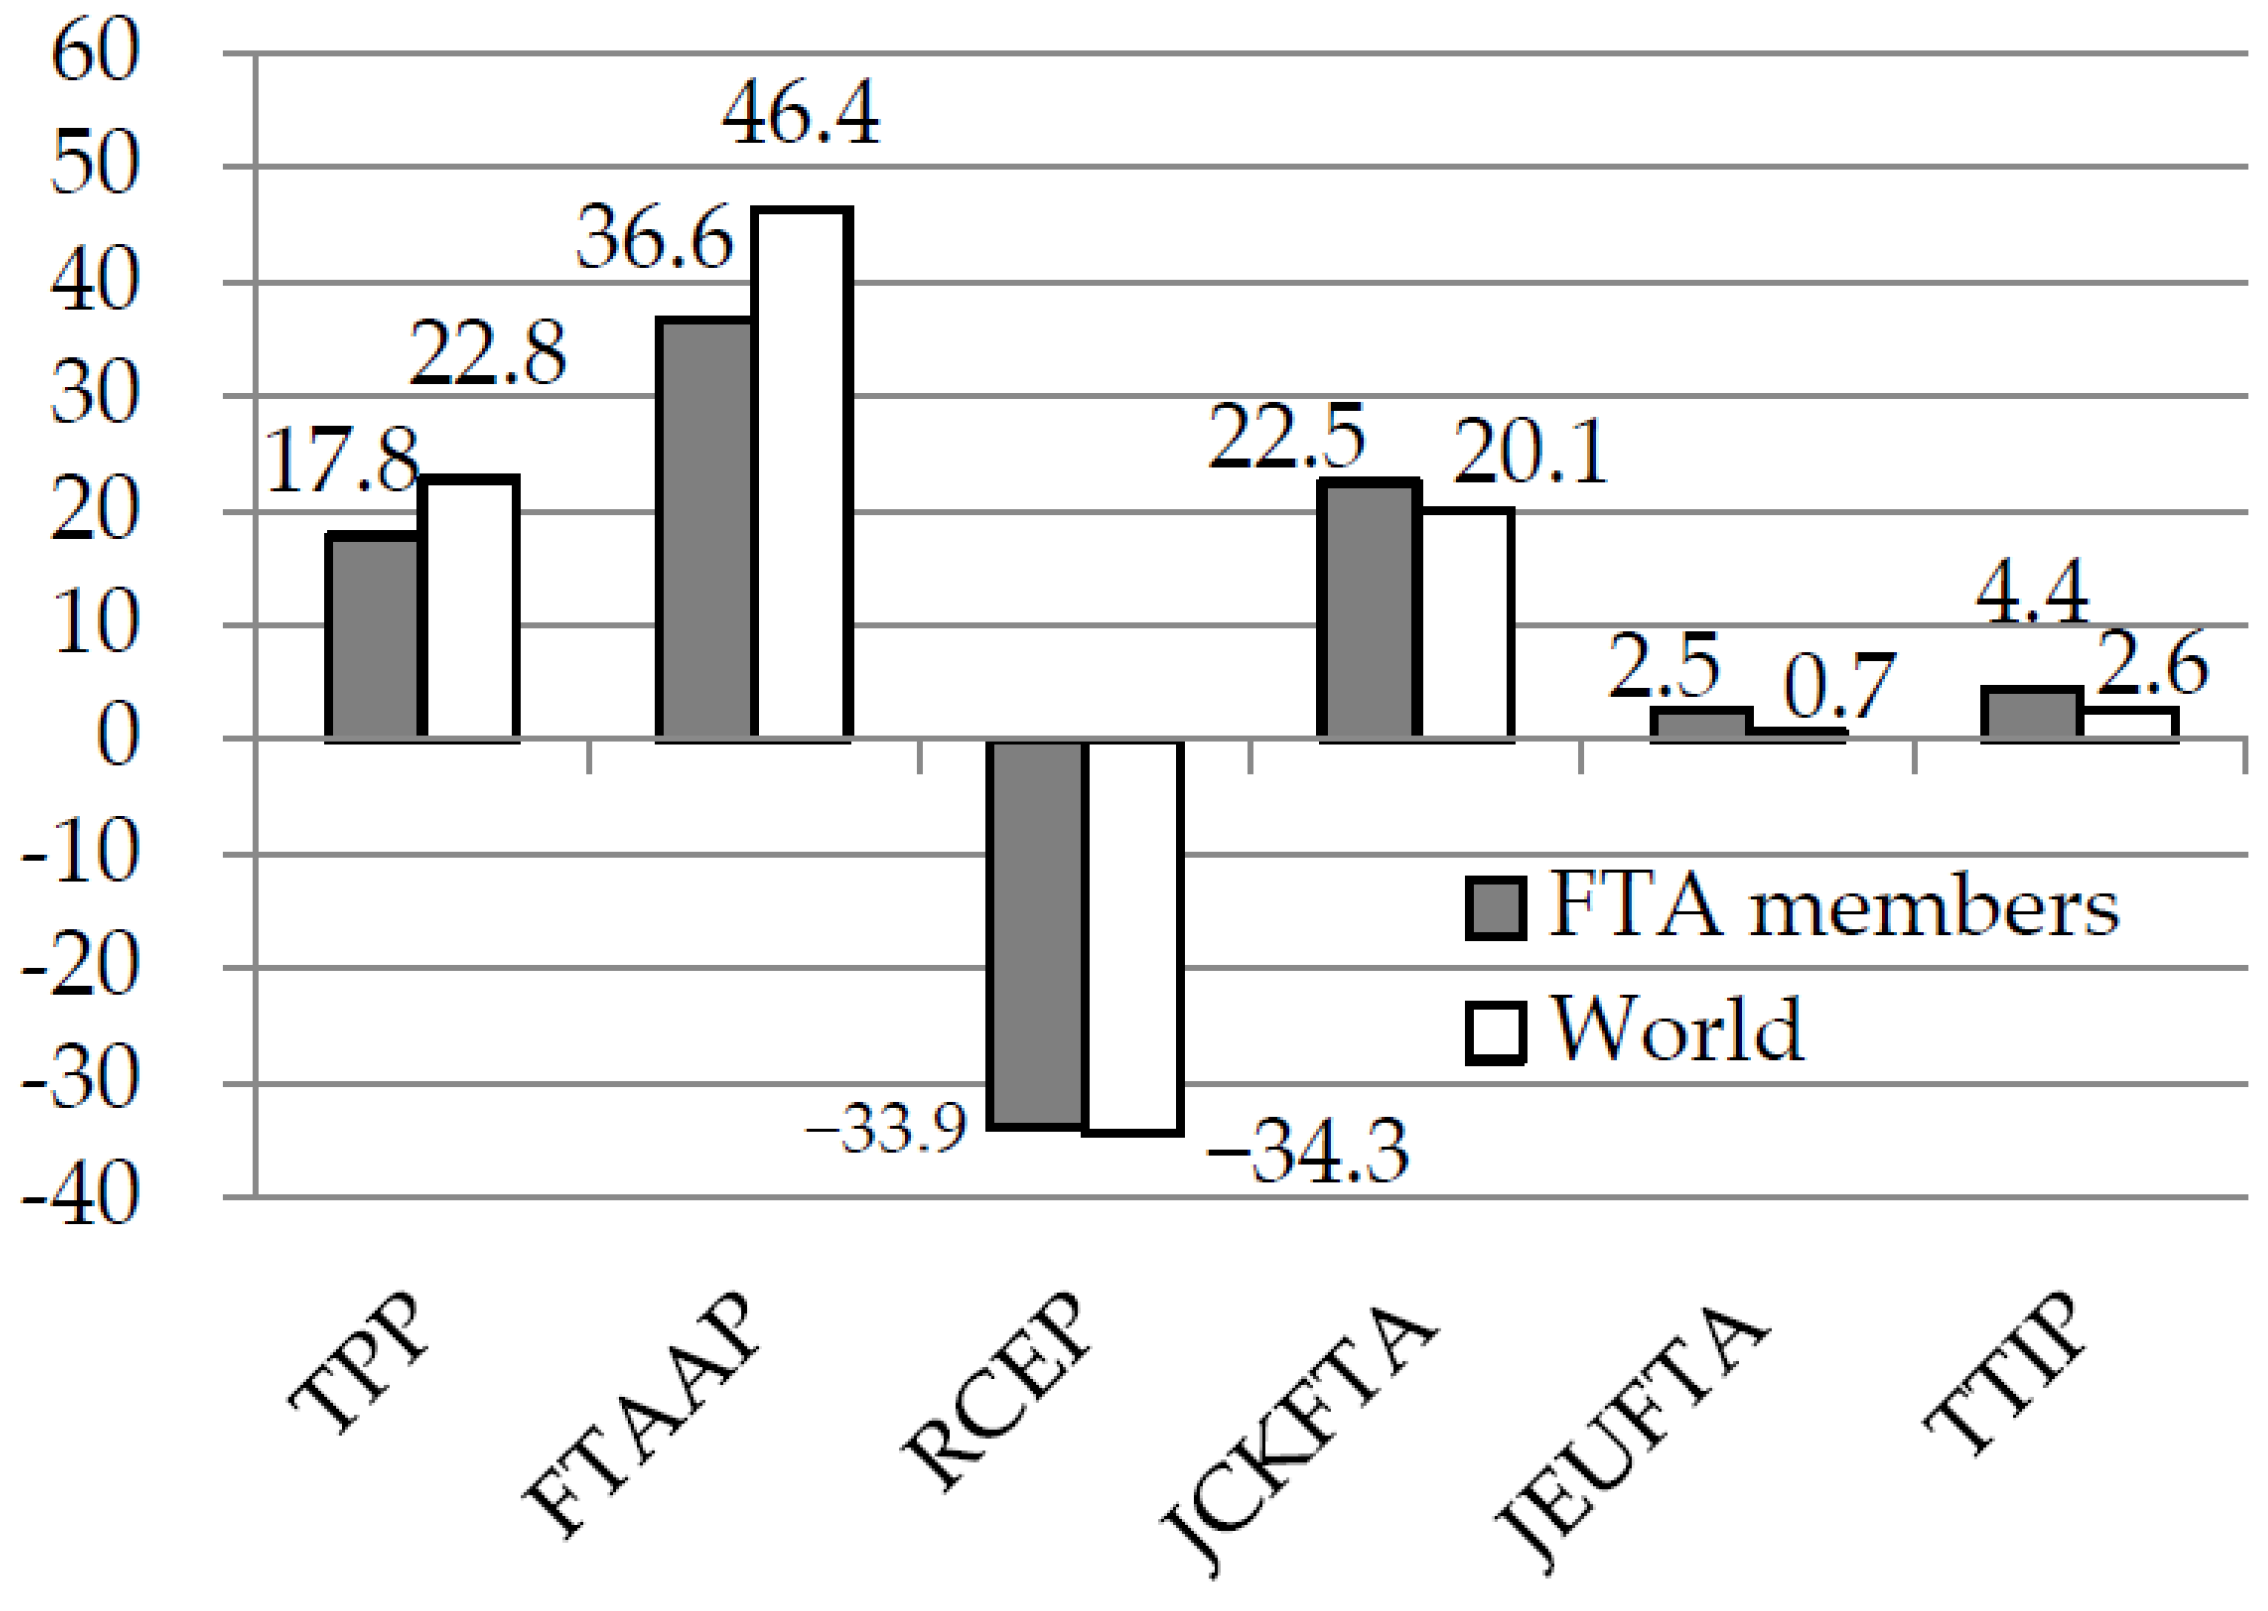
In
Figure 1, we compare the environmental impact of the TPP and that of other mega-FTAs, including TPP, FTAAP, RCEP, JCKFTA, the Japan–EU FTA (JEUFTA), and the Transatlantic Trade and Investment Partnership (TTIP). We estimate the results for other mega-FTAs using the same model as used in this study. The trade liberalization scenarios for the mega-FTAs are the complete removal of all import tariffs among each FTA member. Among the four Asia–Pacific mega-FTAs (TPP, FTAAP [
19], RCEP [
18], and JCKFTA), only RCEP shows a decrease in GHG emissions. This is mainly because of the large decrease in CO
2 emissions from the Indian electricity sector. As of the end of January 2017, India had joined the RCEP, but not the TPP. Thus, whether India chooses to participate in the Asia–Pacific mega-FTA will have a significant impact on GHG emissions in the Asia–Pacific region and the world. Among the three FTAs that increase GHG emissions (TPP, FTAAP, and JCKFTA), the TPP shows the smallest increase in FTA members’ GHG emissions and the second smallest increase in global GHG emissions.
Table 7 shows the five sectors that contribute most to the absolute changes in CO
2, CH
4, and N
2O emissions. We omitted F-gases from the table because relatively few sectors emit these GHGs. In terms of CO
2 emissions, the electricity sector is shown for all economies except the EU.
Regarding the CH
4 emissions of the top five sectors, the paddy rice sector experiences the largest decrease in Japan (−1.36 Mt CO
2 eq.). Australia and the US also include the paddy rice sector in their top five sectors. In percentage terms, CH
4 emissions from the raw milk sector decrease the most in Japan (−25.93%). These results arise mainly because of the large decrease in output from the paddy rice sector and livestock sectors in Japan and the large increase in output from the rice sector and livestock sectors in Australia, New Zealand, and the US, as shown in
Table 5. While all economies in
Table 7 have a cattle, sheep, goats, and horses sector, all economies in
Table 7 other than China, have a raw milk sector.
Regarding the N
2O emissions of the top five sectors, in percentage terms, the paddy rice sector shows the largest change in Japan (−37.30%), Australia (193.46%), and the US (56.41%). These results are also a result of the large decrease in output from the paddy rice sector in Japan and the large increase in output from the paddy rice sector in Australia and the US, as shown in
Table 5. All economies in
Table 7 other than the EU include the cattle, sheep, goats, and horses sector in their top five N
2O-emitting sectors.
Regarding CH4 emissions, three or more of the top five emitting sectors in each economy are farming-related sectors. Regarding N2O emissions, all of the top five emitting sectors in each economy are farming-related sectors.
To measure the environmental efficiency of the macroeconomy, the emission intensity indices of GHGs are calculated in terms of GHG emissions per unit of GDP output. The changes in the GHG emissions intensity indexes are shown in
Table 8. The GHG emissions intensity index of all TPP members increases by 0.11%, suggesting that the TPP could reduce the overall environmental efficiency of TPP members’ macroeconomies in terms of GHG emissions. As shown in
Table 7, this is attributable mainly to the significant increase in non-CO
2 emissions from the agricultural sectors in Australia and the US.


