
Eco-Efficiency Evaluation Considering Environmental Stringency


Abstract
:1. Introduction
2. Proposed Method
2.1. Input Decomposition
2.2. Operational Efficiency
2.3. Environmental Efficiency
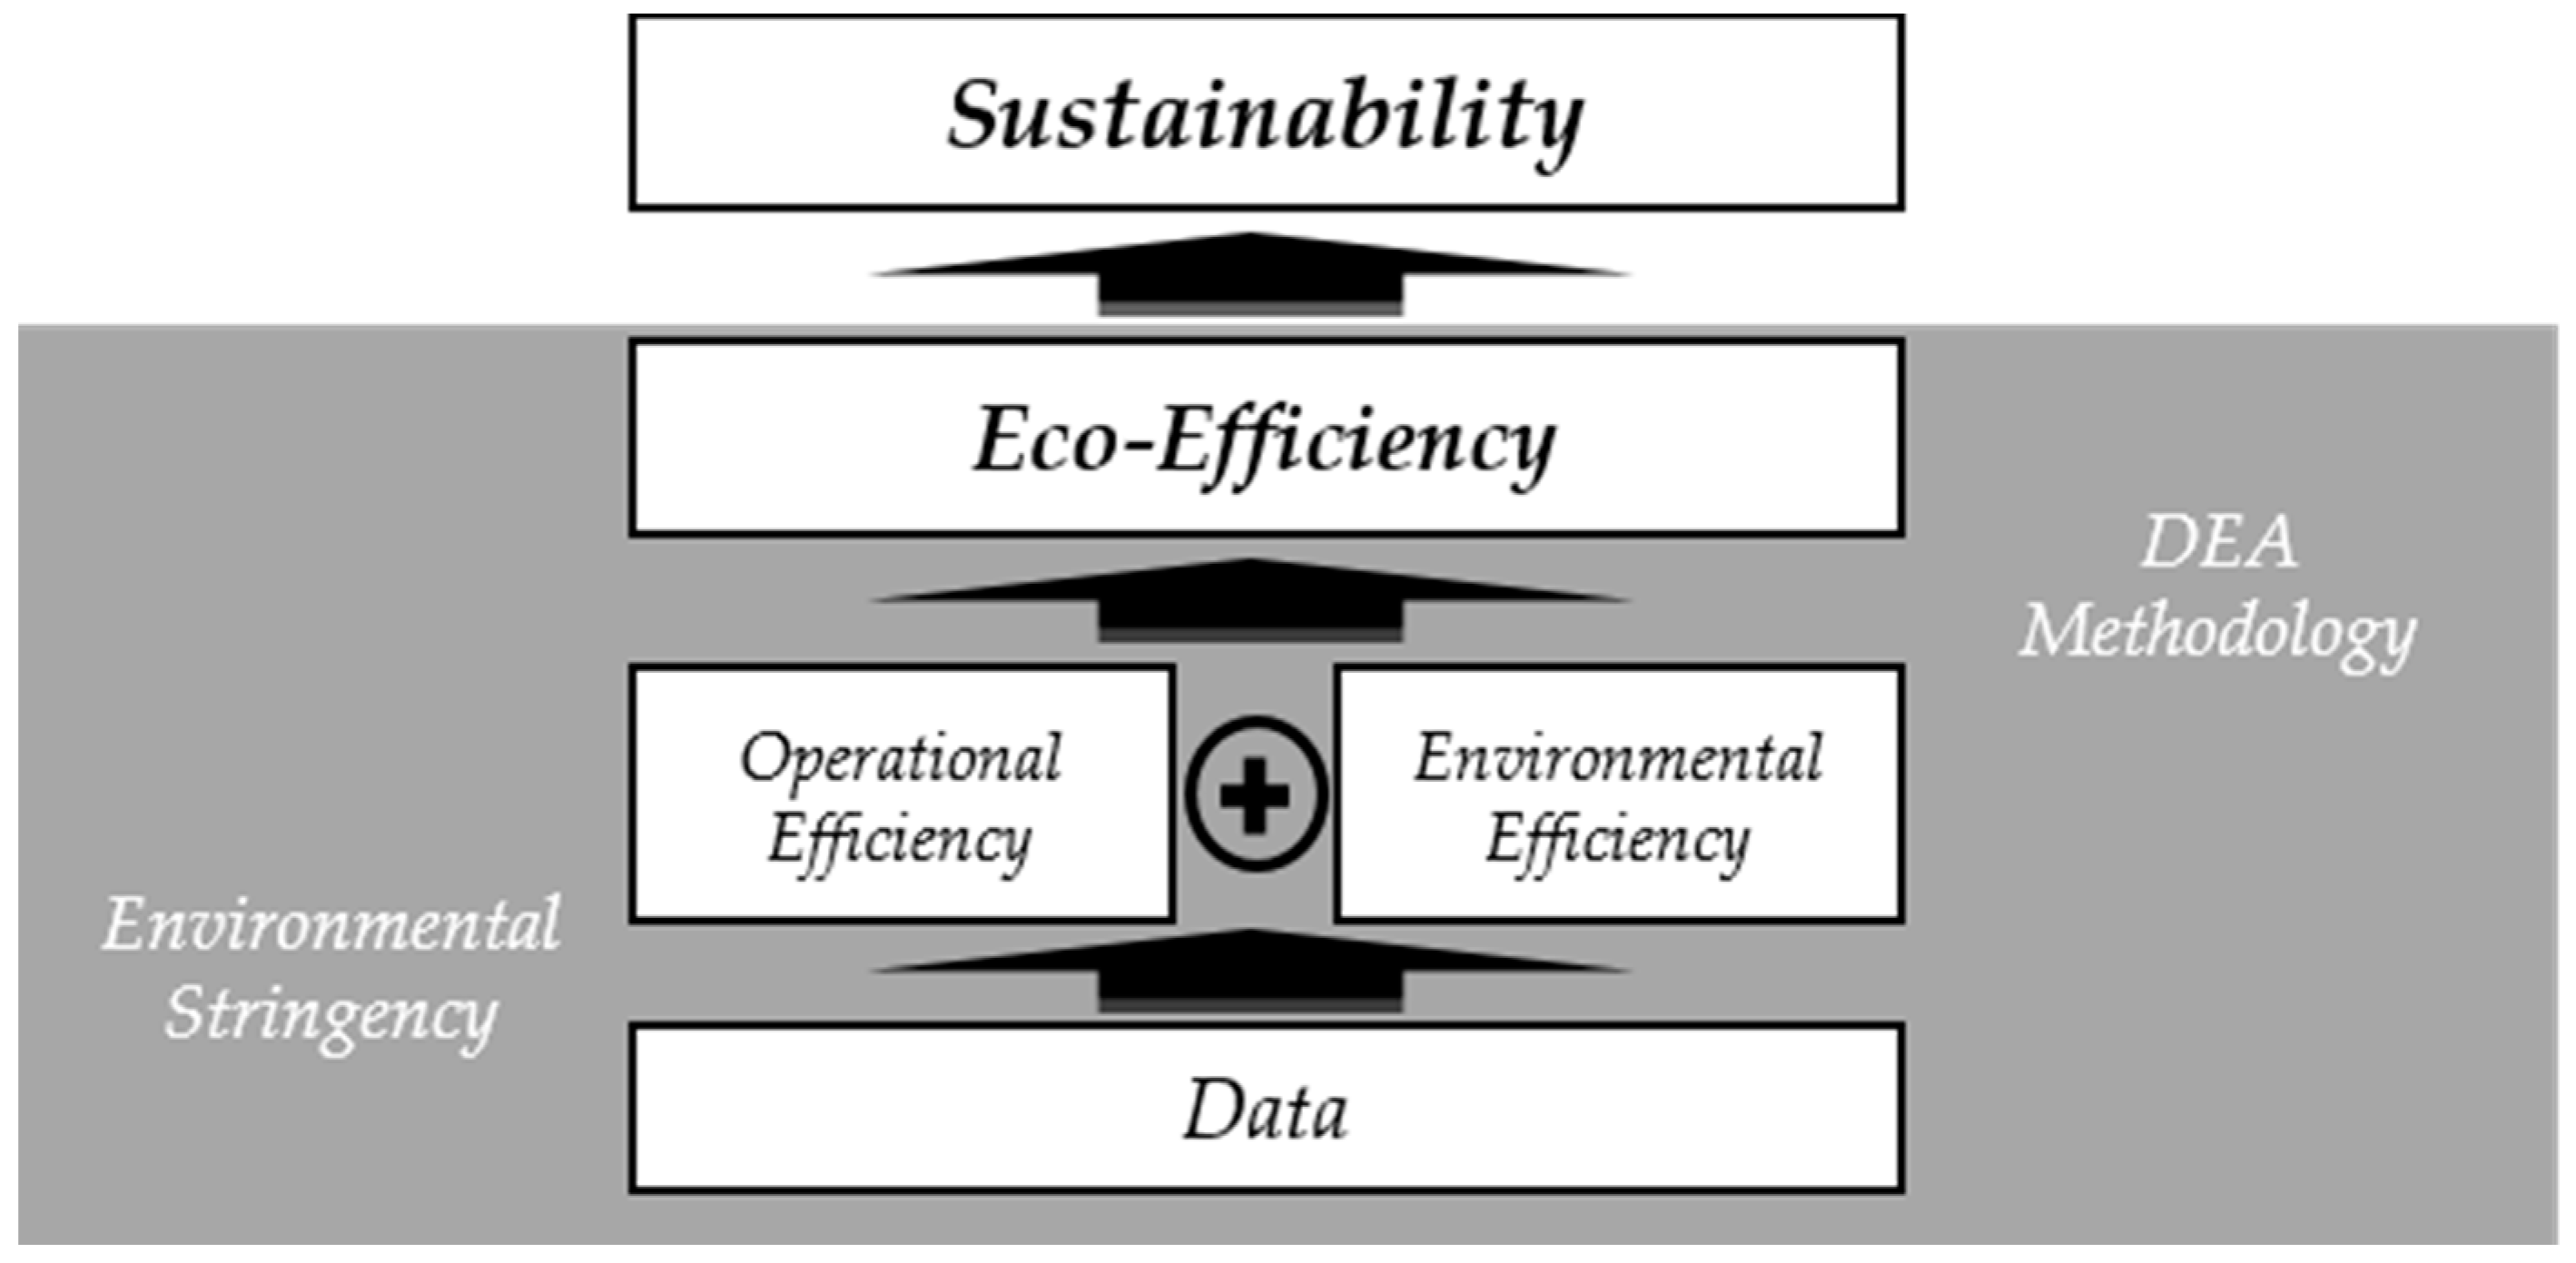
2.4. A Model for Eco-Efficiency
3. Illustrated Example
3.1. Subsection Model (6) with δ = 1
3.2. Operational Efficiency and Environmental Efficience
3.3. Eco-Efficiency
4. Conclusions
Acknowledgments
Author Contributions
Conflicts of Interest
Abbreviations
| DEA | Data Envelopment Analysis | xij | amount of operational input i for DMU j |
| DMU | Decision Making Unit | zkj | amount of environmental input k for DMU j |
| LCI | Life Cycle Inventory | yrj | amount of output r for DMU j |
| MOLP | Multiple Objective Linear Programming | vi | non-negative weight for operational inputs i |
| CRS | Constant Return to Scale | wk | non-negative weight for environmental input k |
| ARII | Type II Assurance Region | ur | non-negative weight for output r |
| FYM | Farmyard Manure | δ | degree of environmental stringency |
| OE | Operational Efficiency | ||
| EE | Environmental Efficiency |
References
- Schaltegger, S.; Sturm, A. Ökologische Rationalität: Ansatzpunkte Zur ausgestaltung von ökologieorientierten Managementinstrumenten. Die Unternehm. 1990, 44, 273–290. [Google Scholar]
- DeSimone, L.D.; Popoff, F. Eco-efficiency: The Business Link to Sustainable Development; MIT Press: Cambridge, MA, USA, 2000. [Google Scholar]
- Charnes, A.; Cooper, W.W.; Rhodes, E. Measuring the efficiency of decision making units. Eur. J. Oper. Res. 1978, 2, 429–444. [Google Scholar] [CrossRef]
- Bevilacqua, M.; Braglia, M. Environmental efficiency analysis for ENI oil refineries. J. Clean. Prod. 2002, 10, 85–92. [Google Scholar] [CrossRef]
- Dyckhoff, H.; Allen, K. Measuring ecological efficiency with data envelopment analysis (DEA). Eur. J. Oper. Res. 2001, 132, 312–325. [Google Scholar] [CrossRef]
- Korhonen, P.J.; Luptacik, M. Eco-efficiency analysis of power plants: An extension of data envelopment analysis. Eur. J. Oper. Res. 2004, 154, 437–446. [Google Scholar] [CrossRef]
- Liang, L.; Wu, D.; Hua, Z. MES-DEA modelling for analysing anti-industrial pollution efficiency and its application in Anhui province of China. Int. J. Glob. Energy Issues 2004, 22, 88–98. [Google Scholar] [CrossRef]
- Mahdiloo, M.; Saen, R.F.; Lee, K.H. Technical, environmental and eco-efficiency measurement for supplier selection: An extension and application of data envelopment analysis. Int. J. Prod. Econ. 2015, 168, 279–289. [Google Scholar] [CrossRef]
- Murty, M.; Kumar, S.; Paul, M. Environmental regulation, productive efficiency and cost of pollution abatement: A case study of the sugar industry in India. J. Environ. Manag. 2006, 79, 1–9. [Google Scholar] [CrossRef] [PubMed]
- Pasurka, C.A. Decomposing electric power plant emissions within a joint production framework. Energy Econ. 2006, 28, 26–43. [Google Scholar] [CrossRef]
- Picazo-Tadeo, A.J.; Reig-Martinez, E.; Hernandez-Sancho, F. Directional distance functions and environmental regulation. Resour. Energy Econ. 2005, 27, 131–142. [Google Scholar] [CrossRef]
- Ramanathan, R. Combining indicators of energy consumption and CO2 emissions: A cross-country comparison. Int. J. Glob. Energy Issues 2002, 17, 214–227. [Google Scholar] [CrossRef]
- Song, M.; Zhang, L.; An, Q.; Wang, Z.; Li, Z. Statistical analysis and combination forecasting of environmental efficiency and its influential factors since China entered the WTO: 2002–2010–2012. J. Clean. Prod. 2013, 42, 42–51. [Google Scholar] [CrossRef]
- Sueyoshi, T.; Goto, M.; Ueno, T. Performance analysis of US coal-fired power plants by measuring three DEA efficiencies. Energy Policy 2010, 38, 1675–1688. [Google Scholar] [CrossRef]
- Triantis, K.; Otis, P. Dominance-based measurement of productive and environmental performance for manufacturing. Eur. J. Oper. Res. 2004, 154, 447–464. [Google Scholar] [CrossRef]
- Watanabe, M.; Tanaka, K. Efficiency analysis of Chinese industry: A directional distance function approach. Energy Policy 2007, 35, 6323–6331. [Google Scholar] [CrossRef]
- Wu, J.; An, Q.; Yao, X.; Wang, B. Environmental efficiency evaluation of industry in China based on a new fixed sum undesirable output data envelopment analysis. J. Clean. Prod. 2014, 74, 96–104. [Google Scholar] [CrossRef]
- Yang, H.; Pollitt, M. Incorporating both undesirable outputs and uncontrollable variables into DEA: The performance of Chinese coal-fired power plants. Eur. J. Oper. Res. 2009, 197, 1095–1105. [Google Scholar] [CrossRef]
- Zaim, O. Measuring environmental performance of state manufacturing through changes in pollution intensities: A DEA framework. Ecol. Econom. 2004, 48, 37–47. [Google Scholar] [CrossRef]
- Zhang, B.; Bi, J.; Fan, Z.; Yuan, Z.; Ge, J. Eco-efficiency analysis of industrial system in China: A data envelopment analysis approach. Ecol. Econom. 2008, 68, 306–316. [Google Scholar] [CrossRef]
- Zhou, P.; Ang, B.W. Linear programming models for measuring economy-wide energy efficiency performance. Energy Policy 2008, 36, 2911–2916. [Google Scholar] [CrossRef]
- Zhou, P.; Ang, B.W.; Poh, K.L. Measuring environmental performance under different environmental DEA technologies. Energy Econom. 2008, 30, 1–14. [Google Scholar] [CrossRef]
- Färe, R.; Grosskopf, S.; Lovell, C.K.; Pasurka, C. Multilateral productivity comparisons when some outputs are undesirable: A nonparametric approach. Rev. Econ. Stat. 1989, 71, 90–98. [Google Scholar] [CrossRef]
- Färe, R.; Grosskopf, S. Modeling undesirable factors in efficiency evaluation: Comment. Eur. J. Oper. Res. 2004, 157, 242–245. [Google Scholar] [CrossRef]
- Seiford, L.M.; Zhu, J. Modeling undesirable factors in efficiency evaluation. Eur. J. Oper. Res. 2002, 142, 16–20. [Google Scholar] [CrossRef]
- Liu, W.; Meng, W.; Li, X.; Zhang, D. DEA models with undesirable inputs and outputs. Ann. Oper. Res. 2010, 173, 177–194. [Google Scholar] [CrossRef]
- Pang, J.; Chen, X.; Zhang, Z.; Li, H. Measuring Eco-Efficiency of Agriculture in China. Sustainability 2016, 8, 398. [Google Scholar] [CrossRef]
- Pelletier, N.; Arsenault, N.; Tyedmers, P. Scenario modeling potential eco-efficiency gains from a transition to organic agriculture: Life cycle perspectives on Canadian canola, corn, soy, and wheat production. Environ. Manag. 2008, 42, 989–1001. [Google Scholar] [CrossRef] [PubMed]
- Mohammadi, A.; Rafiee, S.; Jafari, A.; Dalgaard, T.; Knudsen, M.T.; Keyhani, A.; Mousavi-Avval, S.H.; Hermansen, J.E. Potential greenhouse gas emission reductions in soybean farming: A combined use of life cycle assessment and data envelopment analysis. J. Clean. Prod. 2013, 54, 89–100. [Google Scholar] [CrossRef]
- Masuda, K. Measuring eco-efficiency of wheat production in Japan: A combined application of life cycle assessment and data envelopment analysis. J. Clean. Prod. 2016, 126, 373–381. [Google Scholar] [CrossRef]
- Picazo-Tadeo, A.J.; Gomez-Limon, J.A.; Reig-Martinez, E. Assessing farming eco-efficiency: A data envelopment analysis approach. J. Environ. Manag. 2011, 92, 1154–1164. [Google Scholar] [CrossRef] [PubMed]
- Li, J.C.; Li, J.Y.; Zheng, F.T. Unified efficiency measurement of electric power supply companies in China. Sustainability 2014, 6, 779–793. [Google Scholar] [CrossRef]
- Song, X.; Hao, Y.; Zhu, X. Analysis of the environmental efficiency of the Chinese transportation sector using an undesirable output slacks-based measure data envelopment analysis model. Sustainability 2015, 7, 9187–9206. [Google Scholar] [CrossRef]
- Hu, J.-L.; Kao, C.-H. Efficient energy-saving targets for APEC economies. Energy Policy 2007, 35, 373–382. [Google Scholar] [CrossRef]
- Hu, J.-L.; Wang, S.-C. Total-factor energy efficiency of regions in China. Energy Policy 2006, 34, 3206–3217. [Google Scholar] [CrossRef]
- Ramanathan, R. A holistic approach to compare energy efficiencies of different transport modes. Energy Policy 2000, 28, 743–747. [Google Scholar] [CrossRef]
- Charnes, A.; Cooper, W.W. Programming with linear fractional functionals. Naval Res. Logist. Q. 1962, 9, 181–186. [Google Scholar] [CrossRef]
- Golany, B.; Roll, Y. An application procedure for DEA. Omega 1989, 17, 237–250. [Google Scholar] [CrossRef]
- Cook, W.D.; Tone, K.; Zhu, J. Data envelopment analysis: Prior to choosing a model. Omega 2014, 44, 1–4. [Google Scholar] [CrossRef]
- Dyson, R.G.; Thanassoulis, E. Reducing weight flexibility in data envelopment analysis. J. Oper. Res. Soc. 1988, 39, 563–576. [Google Scholar] [CrossRef]
- Roll, Y.; Golany, B. Alternate methods of treating factor weights in DEA. Omega 1993, 21, 99–109. [Google Scholar] [CrossRef]


| Operational Inputs | Traditional Inputs | Labor (h) |
| Machinery (h) | ||
| Water (m3) | ||
| Seed (kg) | ||
| Energy | Diesel (L) | |
| Electricity (kWh) | ||
| Environmental Inputs | Chemicals | Herbicides (kg) |
| Insecticides (kg) | ||
| K2O (kg) | ||
| Fertilizers | Urea (kg) | |
| P2O5 (kg) | ||
| FYM (kg) | ||
| Undesirable Outputs | CH4 (kg) | |
| (direct gas emission) | N2O (kg) |
| DMU | Labor (h) | Machinery (h) | Water (m3) | Diesel (L) | Electricity (kWh) | Seed (kg) | Herbicides (kg) | Insecticides (kg) | Urea (kg) | P2O5 (kg) | K2O (kg) | FYM (kg) | CH4 (kg) | N2O (kg) | Soybean (kg) | Straw (kg) |
|---|---|---|---|---|---|---|---|---|---|---|---|---|---|---|---|---|
| 1 | 169 | 16 | 2016 | 70 | 0 | 60 | 4 | 1.5 | 110 | 46 | 0 | 0 | 9.3 | 3.2 | 3500 | 4312 |
| 2 | 142 | 15 | 2150 | 65 | 0 | 60 | 3 | 0.5 | 55 | 23 | 0 | 2500 | 8.4 | 3.1 | 3000 | 3889 |
| 3 | 197 | 22 | 3360 | 88 | 1953 | 70 | 2 | 1 | 96 | 69 | 0 | 2500 | 8.4 | 3.2 | 3000 | 3889 |
| 4 | 254 | 35 | 2722 | 122 | 1286 | 70 | 3 | 2 | 110 | 46 | 0 | 7500 | 9.5 | 3.4 | 3600 | 4397 |
| 5 | 138 | 32 | 2464 | 111 | 1432 | 100 | 2 | 2.5 | 78 | 23 | 0 | 2222 | 0 | 3.2 | 3000 | 3889 |
| 6 | 152 | 28 | 2419 | 98 | 0 | 60 | 3 | 2 | 110 | 46 | 0 | 2000 | 0 | 3.7 | 3150 | 4016 |
| 7 | 148 | 28 | 2419 | 109 | 703 | 60 | 3 | 3 | 110 | 46 | 0 | 563 | 0 | 3.2 | 4150 | 4862 |
| 8 | 213 | 27 | 4838 | 109 | 1406 | 100 | 1 | 2 | 137 | 115 | 0 | 1250 | 9.3 | 3.3 | 3500 | 4312 |
| 9 | 159 | 18 | 2822 | 76 | 0 | 80 | 0 | 2 | 76 | 46 | 0 | 0 | 7.1 | 3.1 | 2300 | 3296 |
| 10 | 137 | 28 | 2822 | 96 | 0 | 70 | 3 | 3.5 | 76 | 46 | 0 | 0 | 0 | 3.4 | 2300 | 3296 |
| 11 | 272 | 26 | 2016 | 105 | 0 | 63 | 3 | 2 | 103 | 115 | 0 | 750 | 9.3 | 3.2 | 3500 | 4312 |
| 12 | 185 | 31 | 2419 | 126 | 1406 | 60 | 3 | 4.5 | 82 | 92 | 0 | 1500 | 0 | 3.6 | 3400 | 4227 |
| 13 | 228 | 35 | 1344 | 119 | 781 | 80 | 3 | 5 | 82 | 92 | 0 | 7500 | 8.4 | 3.4 | 3000 | 3889 |
| 14 | 264 | 22 | 1890 | 91 | 0 | 100 | 3 | 2 | 100 | 72 | 0 | 0 | 7.1 | 3.2 | 2315 | 3309 |
| 15 | 200 | 45 | 4032 | 150 | 1758 | 80 | 0 | 1.5 | 92 | 0 | 0 | 16,667 | 9.8 | 3.6 | 3750 | 4524 |
| 16 | 289 | 32 | 3528 | 115 | 2179 | 75 | 3 | 1.5 | 114 | 115 | 0 | 7500 | 0 | 3.4 | 3250 | 4100 |
| 17 | 282 | 35 | 3024 | 130 | 1758 | 60 | 3 | 2.5 | 105 | 92 | 0 | 4500 | 0 | 3.3 | 3500 | 4312 |
| 18 | 209 | 24 | 2621 | 83 | 1524 | 80 | 3 | 1 | 92 | 0 | 0 | 6000 | 7.7 | 3.3 | 2600 | 3550 |
| 19 | 268 | 33 | 7258 | 119 | 2901 | 80 | 3 | 8 | 92 | 0 | 0 | 12,500 | 8.4 | 3.5 | 3000 | 3889 |
| 20 | 210 | 55 | 3024 | 168 | 1538 | 60 | 0 | 1 | 64 | 46 | 0 | 10,000 | 9.3 | 3.4 | 35,007 | 4312 |
| 21 | 139 | 27 | 1260 | 108 | 732 | 60 | 3 | 4.5 | 114 | 115 | 0 | 9375 | 0 | 3.9 | 3500 | 4312 |
| 22 | 179 | 23 | 4536 | 109 | 1154 | 80 | 5 | 0.5 | 69 | 0 | 0 | 4000 | 0 | 3.8 | 4000 | 4735 |
| 23 | 200 | 40 | 2822 | 131 | 820 | 70 | 3 | 3.5 | 114 | 115 | 0 | 1111 | 8.6 | 3.2 | 3115 | 3986 |
| 24 | 245 | 29 | 2016 | 106 | 1172 | 80 | 3 | 1.5 | 87 | 46 | 0 | 3750 | 9.3 | 3.3 | 3500 | 4312 |
| 25 | 222 | 31 | 3226 | 93 | 1289 | 80 | 3 | 8 | 0 | 0 | 0 | 11,000 | 10.6 | 3.3 | 4200 | 4904 |
| 26 | 263 | 54 | 5443 | 175 | 2175 | 70 | 3 | 3.5 | 92 | 0 | 0 | 12,500 | 8.6 | 3.5 | 3100 | 3974 |
| 27 | 285 | 64 | 5443 | 203 | 2175 | 70 | 3 | 2.5 | 92 | 0 | 0 | 25,000 | 8.4 | 3.9 | 3000 | 3889 |
| 28 | 124 | 17 | 2419 | 69 | 0 | 55 | 3 | 0.5 | 78 | 23 | 25 | 0 | 0 | 3.5 | 3200 | 4058 |
| 29 | 215 | 15 | 5645 | 88 | 3282 | 70 | 0 | 1 | 87 | 46 | 0 | 0 | 9.3 | 3.1 | 3500 | 4312 |
| 30 | 134 | 14 | 4838 | 76 | 1406 | 70 | 0 | 1.5 | 69 | 0 | 0 | 0 | 6.6 | 3.1 | 2000 | 3043 |
| 31 | 137 | 17 | 2016 | 64 | 1318 | 60 | 3 | 3 | 78 | 23 | 0 | 833 | 0 | 3.1 | 3300 | 4143 |
| 32 | 201 | 17 | 3024 | 68 | 879 | 60 | 3 | 0.5 | 110 | 46 | 0 | 0 | 0 | 3.2 | 3600 | 4397 |
| 33 | 159 | 38 | 3528 | 128 | 2051 | 70 | 3 | 2.5 | 110 | 46 | 0 | 7500 | 9.3 | 3.4 | 3500 | 4312 |
| 34 | 269 | 50 | 2016 | 160 | 732 | 60 | 3 | 5.5 | 64 | 46 | 0 | 0 | 10.6 | 3.1 | 4200 | 4904 |
| 35 | 223 | 10 | 4838 | 65 | 2813 | 60 | 3 | 4.5 | 64 | 46 | 0 | 1500 | 8.4 | 3.1 | 3000 | 3889 |
| 36 | 145 | 24 | 3360 | 101 | 2075 | 60 | 0 | 3 | 64 | 46 | 0 | 0 | 7.5 | 3.1 | 2500 | 3466 |
| 37 | 176 | 29 | 4032 | 108 | 1172 | 70 | 3 | 2 | 64 | 46 | 0 | 2083 | 0 | 3.6 | 3500 | 4312 |
| 38 | 183 | 29 | 3629 | 100 | 1450 | 60 | 3 | 10.6 | 48 | 35 | 0 | 208 | 0 | 3.1 | 2800 | 3720 |
| 39 | 167 | 23 | 6048 | 93 | 3076 | 60 | 3 | 2.5 | 50 | 69 | 0 | 0 | 0 | 3.5 | 3000 | 3889 |
| 40 | 238 | 26 | 4032 | 95 | 879 | 55 | 3 | 2.5 | 64 | 46 | 0 | 0 | 9 | 3.1 | 3330 | 4168 |
| 41 | 290 | 34 | 6048 | 117 | 3516 | 90 | 3 | 6 | 197 | 92 | 0 | 0 | 9.3 | 3.4 | 3500 | 4312 |
| 42 | 206 | 24 | 3528 | 93 | 2051 | 60 | 3 | 5 | 128 | 92 | 0 | 3000 | 10.2 | 3.3 | 4000 | 4735 |
| 43 | 350 | 21 | 4032 | 120 | 1538 | 60 | 4 | 5 | 159 | 92 | 0 | 3000 | 9.1 | 3.4 | 3400 | 4227 |
| 44 | 133 | 31 | 3024 | 100 | 1154 | 75 | 3 | 6.5 | 96 | 69 | 0 | 0 | 9.3 | 3.2 | 3500 | 4312 |
| 45 | 169 | 25 | 3528 | 92 | 1025 | 70 | 3 | 3.5 | 0 | 0 | 0 | 6250 | 0 | 3.7 | 4000 | 4735 |
| 46 | 157 | 34 | 2822 | 108 | 820 | 70 | 3 | 3 | 110 | 46 | 0 | 3750 | 8 | 3.3 | 2800 | 3720 |
| 47 | 239 | 35 | 2822 | 120 | 1641 | 70 | 3 | 3.6 | 156 | 46 | 0 | 15,000 | 0 | 4.3 | 4000 | 4735 |
| 48 | 170 | 21 | 3360 | 89 | 855 | 60 | 3 | 1.5 | 115 | 0 | 150 | 0 | 9.3 | 3.2 | 3500 | 4312 |
| 49 | 220 | 50 | 3110 | 146 | 1582 | 80 | 3 | 4 | 135 | 81 | 13 | 10,000 | 9.3 | 3.5 | 3500 | 4312 |
| 50 | 277 | 29 | 4838 | 117 | 2813 | 60 | 1.25 | 4.5 | 110 | 46 | 0 | 0 | 9.9 | 3.2 | 3800 | 4566 |
| 51 | 186 | 48 | 2952 | 165 | 1791 | 65 | 1.5 | 3 | 92 | 0 | 0 | 21,429 | 0 | 4.3 | 3700 | 4481 |
| 52 | 189 | 20 | 2688 | 81 | 781 | 60 | 0 | 1.5 | 64 | 46 | 0 | 0 | 7.8 | 3.1 | 2666 | 3606 |
| 53 | 104 | 35 | 4838 | 124 | 2110 | 60 | 3 | 3 | 83 | 23 | 0 | 12,000 | 7.7 | 3.5 | 2600 | 3550 |
| 54 | 170 | 19 | 2520 | 75 | 1465 | 60 | 3 | 2 | 92 | 0 | 0 | 0 | 7.9 | 3.2 | 2700 | 3635 |
| 55 | 112 | 20 | 3226 | 101 | 2110 | 70 | 2 | 3 | 92 | 0 | 125 | 0 | 9.1 | 3.2 | 3400 | 4227 |
| 56 | 144 | 25 | 2112 | 106 | 1074 | 60 | 3.5 | 0.3 | 110 | 46 | 0 | 1500 | 0 | 3.7 | 3570 | 4371 |
| 57 | 179 | 15 | 3024 | 86 | 1978 | 60 | 0 | 1.5 | 92 | 0 | 100 | 0 | 8.4 | 3.2 | 3000 | 3889 |
| 58 | 215 | 30 | 3024 | 109 | 769 | 55 | 3 | 3 | 123 | 138 | 0 | 22,500 | 0 | 3.9 | 3500 | 4312 |
| 59 | 146 | 34 | 3629 | 134 | 1846 | 70 | 3 | 2.5 | 87 | 46 | 0 | 15,000 | 0 | 4.1 | 3800 | 4566 |
| 60 | 162 | 40 | 4657 | 147 | 2369 | 70 | 3 | 2.5 | 87 | 46 | 0 | 15,000 | 9.3 | 3.6 | 3500 | 4312 |
| 61 | 245 | 34 | 3528 | 119 | 1410 | 70 | 3 | 3 | 92 | 0 | 100 | 10,000 | 8.4 | 3.4 | 3000 | 3889 |
| 62 | 196 | 9 | 2016 | 61 | 513 | 100 | 3 | 2.5 | 32 | 23 | 0 | 417 | 0 | 3.4 | 2500 | 3466 |
| 63 | 187 | 19 | 2957 | 79 | 1934 | 70 | 2 | 2.5 | 137 | 115 | 0 | 0 | 8 | 3.3 | 2800 | 3720 |
| 64 | 163 | 21 | 2880 | 88 | 1465 | 70 | 3 | 3 | 115 | 0 | 50 | 2500 | 9.4 | 3.3 | 3570 | 4371 |
| 65 | 243 | 21 | 3024 | 86 | 824 | 55 | 3 | 3 | 123 | 138 | 0 | 5000 | 9.7 | 3.4 | 3700 | 4481 |
| 66 | 196 | 22 | 3326 | 103 | 2175 | 70 | 3 | 2.5 | 137 | 115 | 0 | 0 | 8 | 3.3 | 2800 | 3720 |
| 67 | 178 | 26 | 2150 | 100 | 0 | 60 | 3.5 | 0.3 | 110 | 46 | 0 | 1500 | 0 | 3.6 | 3000 | 3889 |
| 68 | 214 | 33 | 2688 | 132 | 1367 | 70 | 3.5 | 3 | 110 | 46 | 0 | 7500 | 0 | 3.9 | 3500 | 4312 |
| 69 | 169 | 27 | 2520 | 92 | 1282 | 70 | 3.5 | 0.5 | 92 | 0 | 50 | 7500 | 0 | 3.9 | 3600 | 4397 |
| 70 | 208 | 28 | 2464 | 104 | 1432 | 70 | 3 | 3 | 123 | 138 | 0 | 20,000 | 8 | 3.8 | 2800 | 3720 |
| 71 | 165 | 37 | 4032 | 124 | 1758 | 70 | 3 | 2 | 77 | 0 | 0 | 15,000 | 0 | 4 | 3500 | 4312 |
| 72 | 261 | 32 | 3528 | 124 | 2179 | 70 | 3 | 1.5 | 114 | 115 | 0 | 7500 | 0 | 3.8 | 2900 | 3804 |
| 73 | 283 | 38 | 3024 | 138 | 1758 | 70 | 3 | 1.5 | 69 | 0 | 100 | 5000 | 9.4 | 3.2 | 3550 | 4354 |
| 74 | 167 | 37 | 3276 | 136 | 1904 | 70 | 3 | 1 | 92 | 0 | 0 | 7500 | 7.7 | 3.4 | 2600 | 3550 |
| 75 | 211 | 31 | 2903 | 122 | 1477 | 60 | 0 | 1 | 46 | 0 | 50 | 10,000 | 9.1 | 3.3 | 3400 | 4227 |
| 76 | 155 | 36 | 3780 | 129 | 1030 | 70 | 3 | 2.5 | 69 | 0 | 0 | 10,000 | 0 | 3.4 | 3800 | 4566 |
| 77 | 154 | 30 | 2520 | 96 | 1007 | 70 | 3 | 2 | 110 | 46 | 0 | 7500 | 0 | 3.4 | 3300 | 4143 |
| 78 | 176 | 28 | 6451 | 119 | 2344 | 80 | 3 | 2.5 | 92 | 0 | 50 | 0 | 7.7 | 3.2 | 2600 | 3550 |
| 79 | 195 | 18 | 3629 | 89 | 1846 | 80 | 3 | 6 | 119 | 69 | 0 | 10,000 | 8.9 | 3.5 | 3300 | 4143 |
| 80 | 144 | 21 | 3226 | 93 | 1641 | 70 | 2 | 3 | 137 | 115 | 0 | 0 | 0 | 3.8 | 3900 | 4651 |
| 81 | 108 | 29 | 1613 | 98 | 820 | 60 | 3.5 | 1.5 | 64 | 46 | 0 | 7500 | 0 | 3.8 | 3700 | 4481 |
| 82 | 279 | 27 | 3360 | 116 | 916 | 90 | 4 | 4.5 | 160 | 115 | 0 | 15,000 | 8.9 | 3.7 | 3300 | 4143 |
| 83 | 309 | 12 | 2822 | 55 | 820 | 80 | 1 | 1 | 128 | 92 | 0 | 0 | 9.5 | 3.2 | 3600 | 4397 |
| 84 | 95 | 12 | 4704 | 66 | 0 | 60 | 3.5 | 2.5 | 87 | 46 | 50 | 10,000 | 0 | 3.4 | 3400 | 4227 |
| 85 | 141 | 25 | 2268 | 105 | 0 | 60 | 2 | 1.5 | 174 | 92 | 0 | 0 | 0 | 3.3 | 3200 | 4058 |
| 86 | 152 | 27 | 2100 | 103 | 0 | 60 | 0 | 2.5 | 91 | 115 | 0 | 12,500 | 0 | 3.9 | 3150 | 4016 |
| 87 | 127 | 19 | 2520 | 82 | 0 | 65 | 3 | 4.5 | 114 | 115 | 0 | 9375 | 8.5 | 3.5 | 3050 | 3931 |
| 88 | 121 | 21 | 2016 | 84 | 1172 | 60 | 3 | 2 | 46 | 0 | 0 | 10,000 | 0 | 3.8 | 3100 | 3974 |
| 89 | 213 | 6 | 2688 | 47 | 1074 | 70 | 2 | 1.5 | 105 | 92 | 0 | 0 | 0 | 3.2 | 2000 | 3043 |
| 90 | 171 | 17 | 4032 | 69 | 2344 | 70 | 3 | 1 | 92 | 0 | 0 | 0 | 0 | 3.5 | 2500 | 3466 |
| 91 | 192 | 18 | 6451 | 87 | 328 | 75 | 3 | 1 | 64 | 46 | 0 | 18,667 | 0 | 4 | 3000 | 3889 |
| 92 | 217 | 6 | 2688 | 48 | 1074 | 70 | 3 | 1.5 | 105 | 92 | 0 | 0 | 6.6 | 3.2 | 2000 | 3043 |
| 93 | 199 | 19 | 3629 | 72 | 2110 | 60 | 3 | 2 | 64 | 46 | 0 | 0 | 8.4 | 3.1 | 3000 | 3889 |
| 94 | 211 | 16 | 2520 | 58 | 1007 | 60 | 3 | 1.5 | 110 | 46 | 0 | 0 | 0 | 3.2 | 3200 | 4058 |
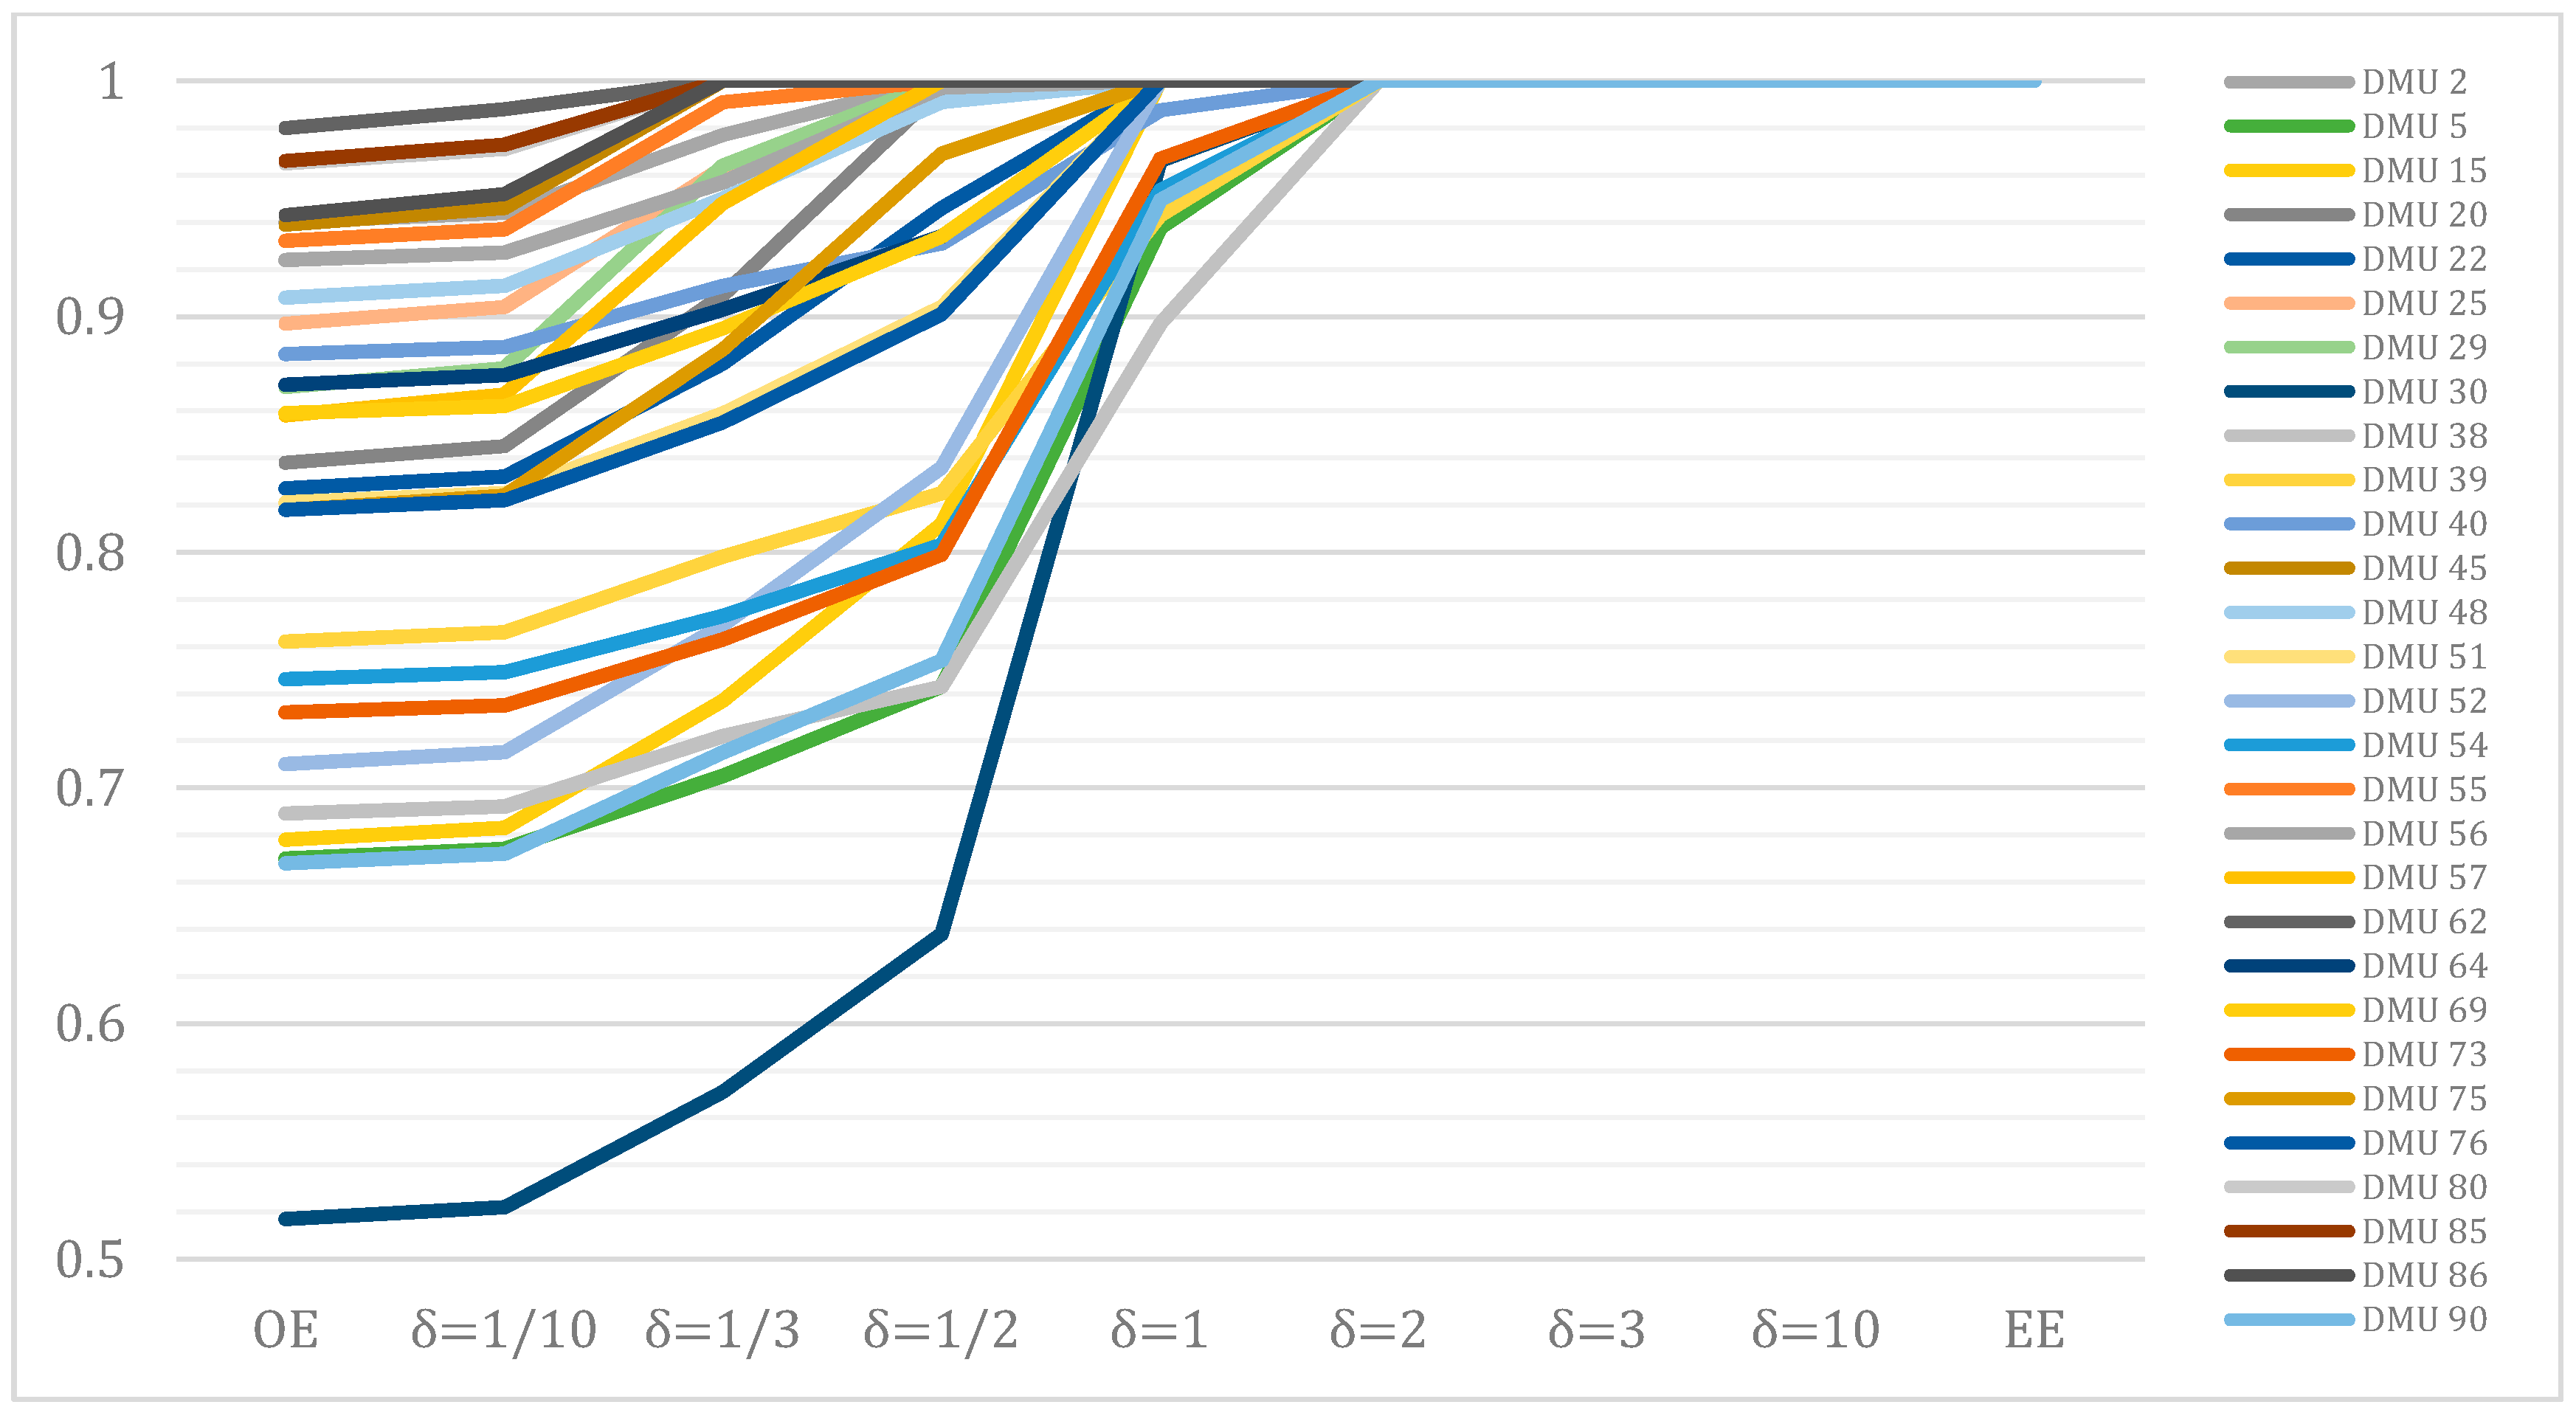
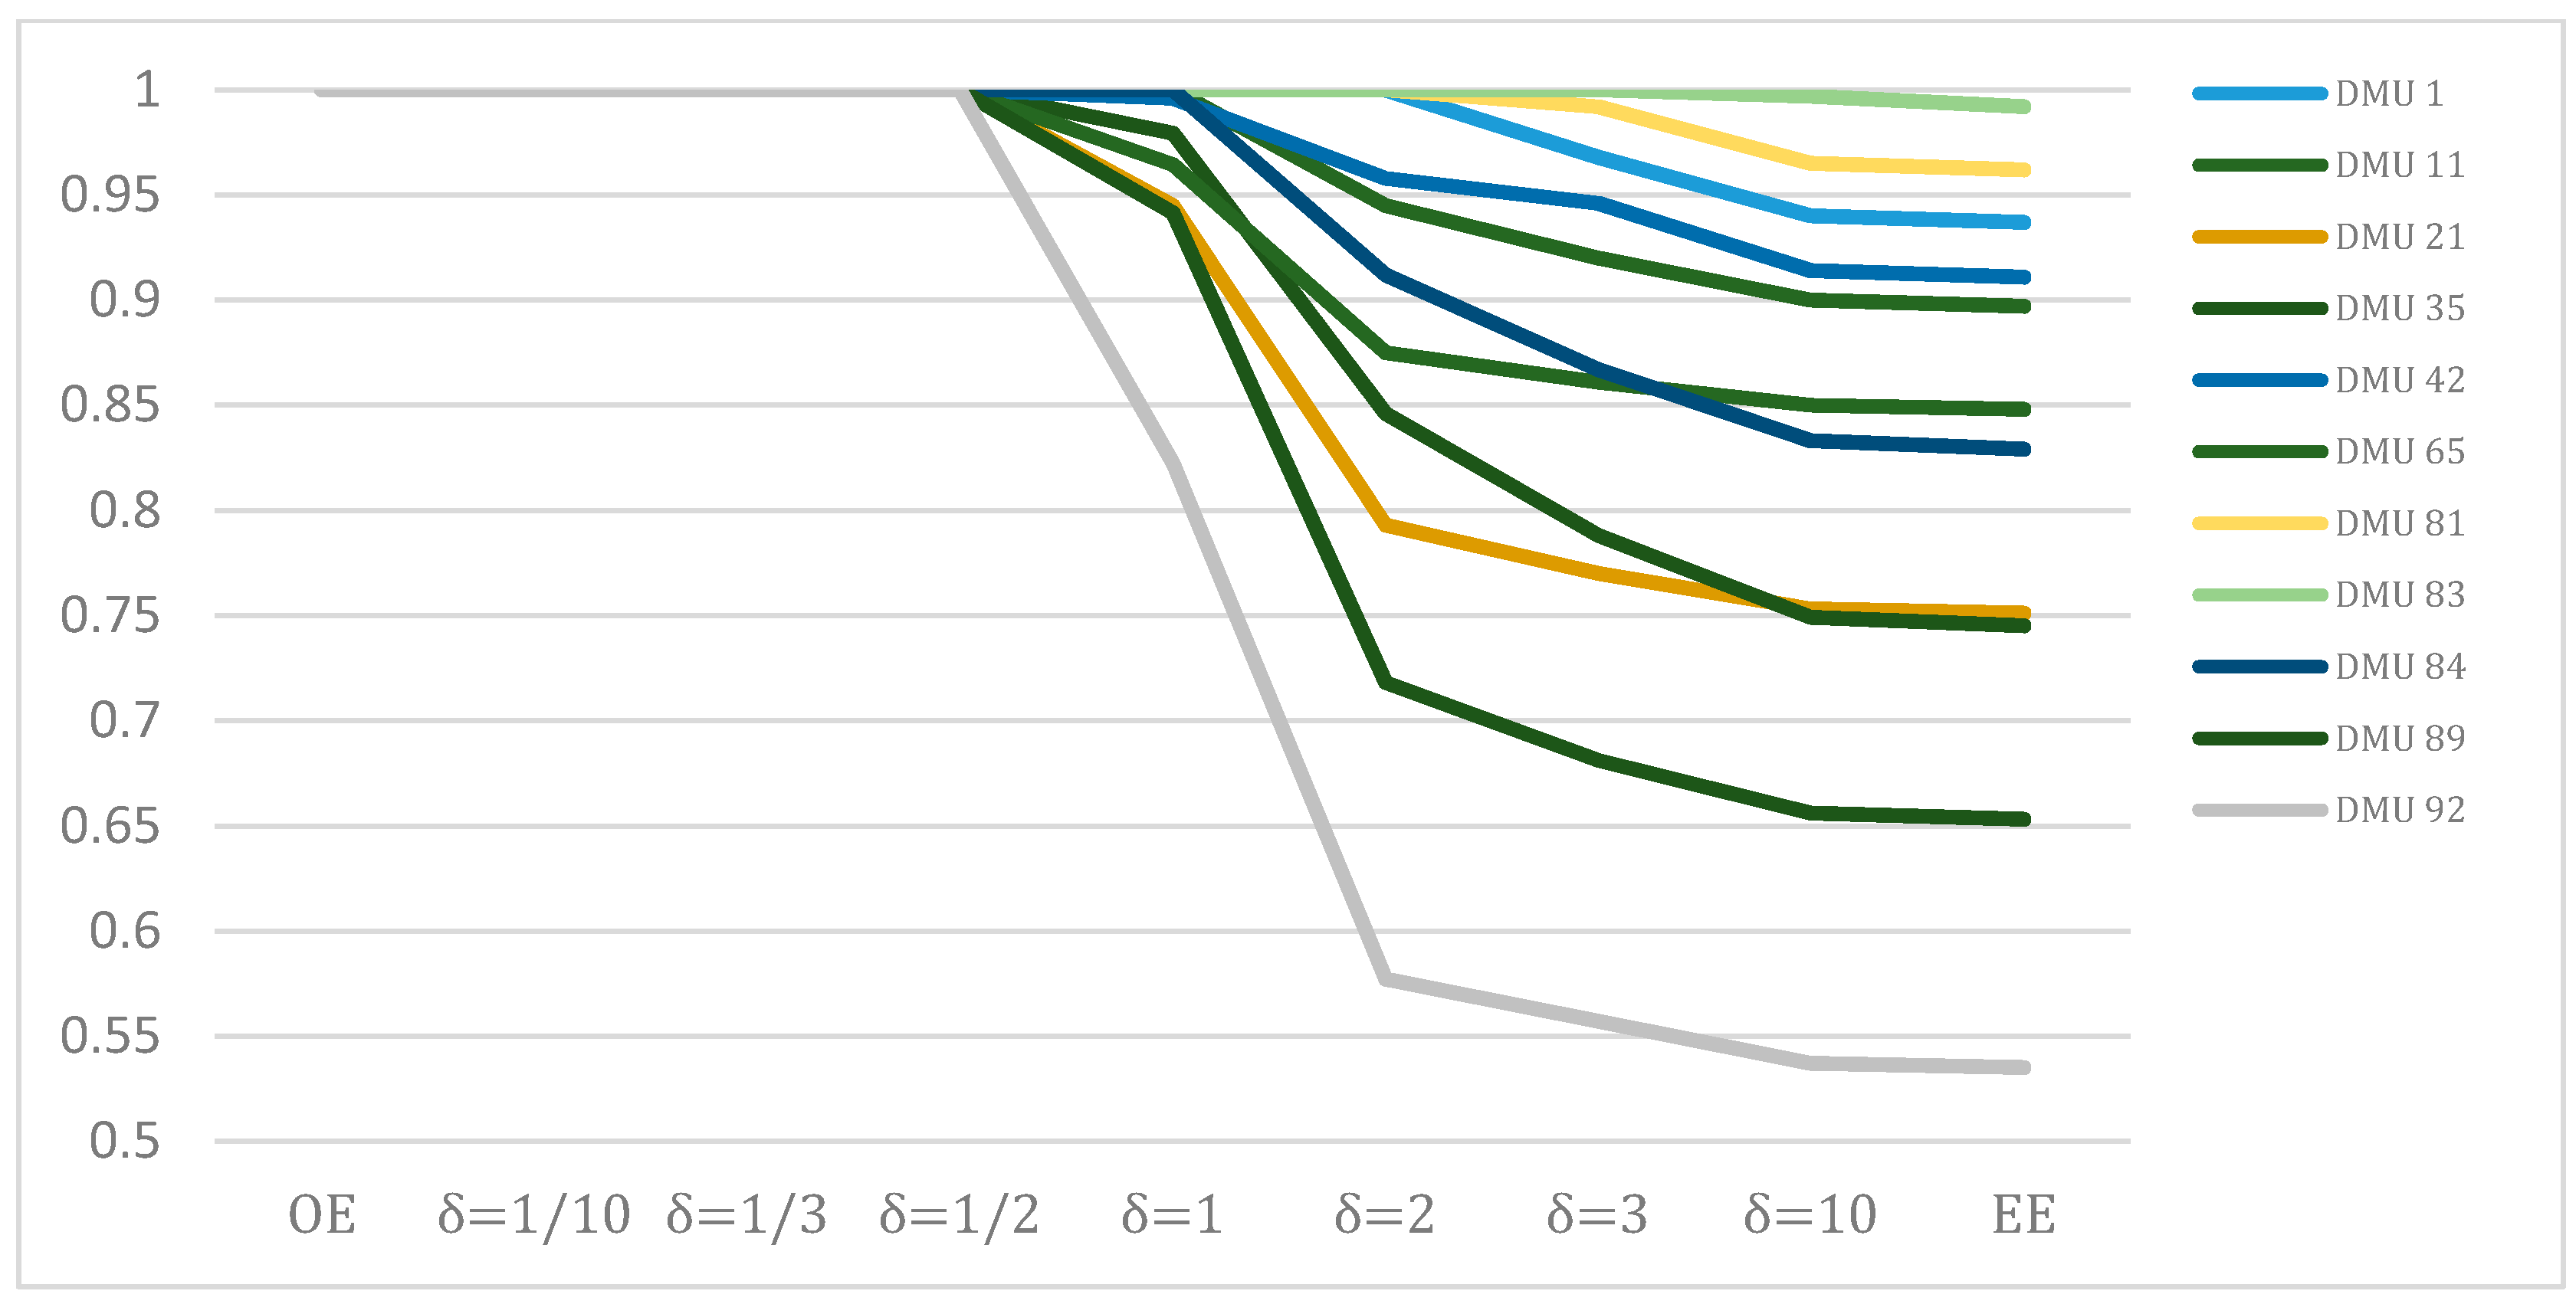
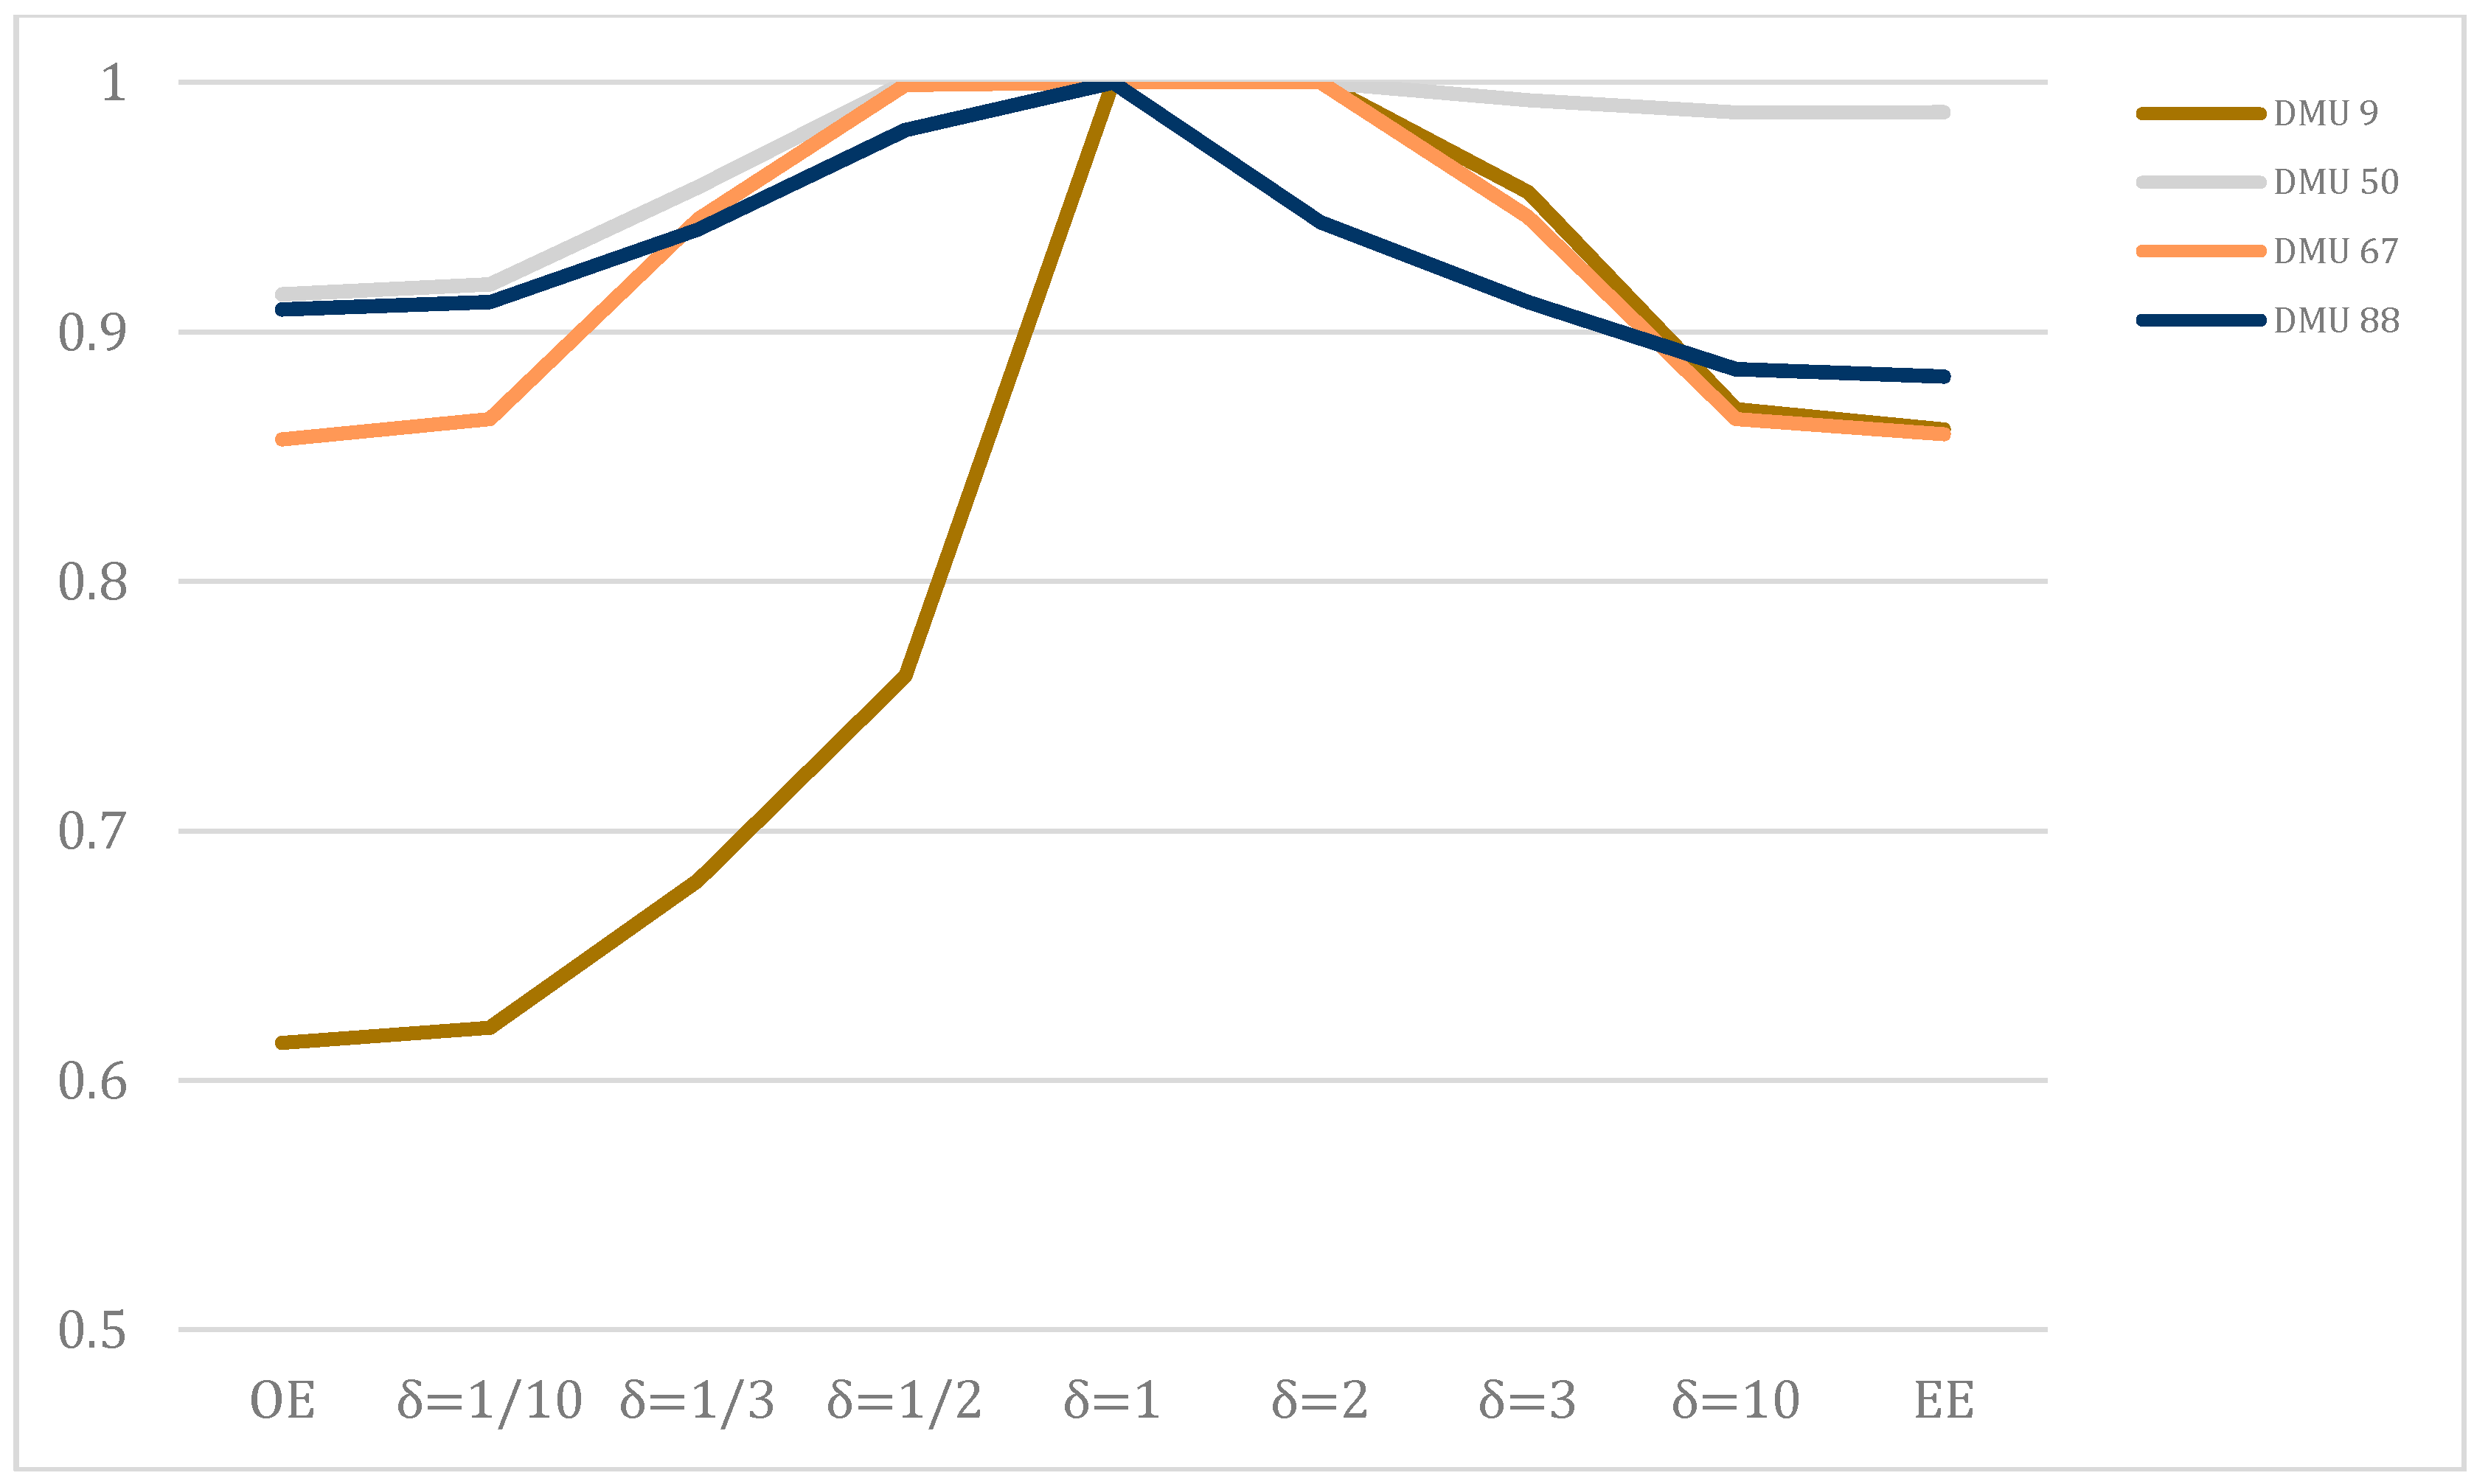
| DMU | Model (6) (δ = 1) | OE | δ = 1/10 | δ = 1/3 | δ = 1/2 | δ = 1 | δ = 2 | δ = 3 | δ = 10 | EE |
|---|---|---|---|---|---|---|---|---|---|---|
| 1 | 1 | 1 | 1 | 1 | 1 | 1 | 1 | 0.968 | 0.94 | 0.937 |
| 2 | 1 | 0.94 | 0.944 | 0.977 | 1 | 1 | 1 | 1 | 1 | 1 |
| 3 | 0.836 | 0.706 | 0.709 | 0.732 | 0.759 | 0.823 | 0.834 | 0.832 | 0.824 | 0.823 |
| 4 | 0.888 | 0.76 | 0.761 | 0.773 | 0.786 | 0.86 | 0.882 | 0.88 | 0.875 | 0.874 |
| 5 | 1 | 0.67 | 0.674 | 0.705 | 0.743 | 0.938 | 1 | 1 | 1 | 1 |
| 6 | 1 | 0.901 | 0.908 | 0.976 | 1 | 0.981 | 0.827 | 0.8 | 0.774 | 0.772 |
| 7 | 1 | 1 | 1 | 1 | 1 | 1 | 1 | 1 | 1 | 1 |
| 8 | 0.97 | 0.625 | 0.63 | 0.673 | 0.731 | 0.914 | 0.939 | 0.921 | 0.895 | 0.892 |
| 9 | 1 | 0.615 | 0.621 | 0.68 | 0.762 | 1 | 1 | 0.956 | 0.869 | 0.861 |
| 10 | 1 | 0.642 | 0.645 | 0.68 | 0.719 | 0.918 | 0.879 | 0.82 | 0.765 | 0.76 |
| 11 | 1 | 1 | 1 | 1 | 1 | 1 | 0.945 | 0.92 | 0.9 | 0.897 |
| 12 | 0.895 | 0.818 | 0.819 | 0.83 | 0.845 | 0.88 | 0.871 | 0.866 | 0.854 | 0.852 |
| 13 | 0.903 | 0.804 | 0.806 | 0.831 | 0.86 | 0.832 | 0.702 | 0.684 | 0.67 | 0.669 |
| 14 | 0.783 | 0.706 | 0.707 | 0.719 | 0.733 | 0.727 | 0.644 | 0.624 | 0.609 | 0.607 |
| 15 | 1 | 0.678 | 0.683 | 0.737 | 0.812 | 1 | 1 | 1 | 1 | 1 |
| 16 | 0.823 | 0.659 | 0.661 | 0.673 | 0.686 | 0.774 | 0.823 | 0.823 | 0.823 | 0.823 |
| 17 | 0.872 | 0.84 | 0.843 | 0.848 | 0.854 | 0.869 | 0.862 | 0.861 | 0.86 | 0.86 |
| 18 | 0.923 | 0.605 | 0.607 | 0.632 | 0.665 | 0.832 | 0.788 | 0.776 | 0.765 | 0.764 |
| 19 | 0.704 | 0.572 | 0.575 | 0.599 | 0.624 | 0.688 | 0.703 | 0.702 | 0.701 | 0.701 |
| 20 | 1 | 0.838 | 0.845 | 0.909 | 0.997 | 1 | 1 | 1 | 1 | 1 |
| 21 | 1 | 1 | 1 | 1 | 1 | 0.945 | 0.793 | 0.77 | 0.753 | 0.751 |
| 22 | 1 | 0.827 | 0.832 | 0.88 | 0.946 | 1 | 1 | 1 | 1 | 1 |
| 23 | 0.745 | 0.643 | 0.644 | 0.651 | 0.659 | 0.716 | 0.745 | 0.745 | 0.745 | 0.745 |
| 24 | 0.983 | 0.821 | 0.823 | 0.847 | 0.871 | 0.956 | 0.963 | 0.942 | 0.92 | 0.917 |
| 25 | 1 | 0.897 | 0.904 | 0.963 | 1 | 1 | 1 | 1 | 1 | 1 |
| 26 | 0.797 | 0.635 | 0.638 | 0.659 | 0.685 | 0.789 | 0.785 | 0.781 | 0.777 | 0.777 |
| 27 | 0.78 | 0.614 | 0.616 | 0.64 | 0.666 | 0.762 | 0.716 | 0.707 | 0.7 | 0.699 |
| 28 | 1 | 1 | 1 | 1 | 1 | 1 | 1 | 1 | 1 | 1 |
| 29 | 1 | 0.87 | 0.878 | 0.964 | 1 | 1 | 1 | 1 | 1 | 1 |
| 30 | 1 | 0.517 | 0.522 | 0.571 | 0.638 | 0.966 | 1 | 1 | 1 | 1 |
| 31 | 1 | 1 | 1 | 1 | 1 | 1 | 1 | 1 | 1 | 1 |
| 32 | 1 | 1 | 1 | 1 | 1 | 1 | 1 | 1 | 1 | 1 |
| 33 | 0.841 | 0.747 | 0.748 | 0.758 | 0.769 | 0.824 | 0.834 | 0.831 | 0.828 | 0.828 |
| 34 | 1 | 1 | 1 | 1 | 1 | 1 | 1 | 1 | 1 | 1 |
| 35 | 1 | 1 | 1 | 1 | 1 | 0.98 | 0.846 | 0.788 | 0.749 | 0.745 |
| 36 | 1 | 0.629 | 0.634 | 0.68 | 0.739 | 0.976 | 0.984 | 0.966 | 0.95 | 0.948 |
| 37 | 0.964 | 0.769 | 0.772 | 0.797 | 0.814 | 0.915 | 0.959 | 0.956 | 0.953 | 0.953 |
| 38 | 1 | 0.689 | 0.692 | 0.722 | 0.743 | 0.897 | 1 | 1 | 1 | 1 |
| 39 | 1 | 0.762 | 0.766 | 0.798 | 0.825 | 0.943 | 1 | 1 | 1 | 1 |
| 40 | 1 | 0.884 | 0.887 | 0.913 | 0.931 | 0.988 | 1 | 1 | 1 | 1 |
| 41 | 0.834 | 0.623 | 0.625 | 0.64 | 0.658 | 0.778 | 0.83 | 0.813 | 0.798 | 0.796 |
| 42 | 1 | 1 | 1 | 1 | 1 | 0.996 | 0.958 | 0.946 | 0.914 | 0.911 |
| 43 | 0.881 | 0.866 | 0.869 | 0.881 | 0.881 | 0.864 | 0.799 | 0.784 | 0.753 | 0.75 |
| 44 | 1 | 0.819 | 0.823 | 0.868 | 0.926 | 0.985 | 0.913 | 0.87 | 0.835 | 0.832 |
| 45 | 1 | 0.939 | 0.946 | 1 | 1 | 1 | 1 | 1 | 1 | 1 |
| 46 | 0.666 | 0.63 | 0.631 | 0.64 | 0.65 | 0.666 | 0.663 | 0.662 | 0.661 | 0.661 |
| 47 | 0.901 | 0.845 | 0.846 | 0.855 | 0.864 | 0.882 | 0.847 | 0.835 | 0.825 | 0.824 |
| 48 | 1 | 0.908 | 0.913 | 0.95 | 0.991 | 1 | 1 | 1 | 1 | 1 |
| 49 | 0.77 | 0.639 | 0.64 | 0.651 | 0.663 | 0.737 | 0.77 | 0.77 | 0.77 | 0.77 |
| 50 | 1 | 0.915 | 0.919 | 0.958 | 1 | 1 | 1 | 0.993 | 0.988 | 0.988 |
| 51 | 1 | 0.821 | 0.825 | 0.859 | 0.904 | 1 | 1 | 1 | 1 | 1 |
| 52 | 1 | 0.71 | 0.715 | 0.769 | 0.836 | 1 | 1 | 1 | 1 | 1 |
| 53 | 0.83 | 0.721 | 0.723 | 0.748 | 0.769 | 0.773 | 0.651 | 0.636 | 0.625 | 0.623 |
| 54 | 1 | 0.746 | 0.749 | 0.773 | 0.803 | 0.954 | 1 | 1 | 1 | 1 |
| 55 | 1 | 0.932 | 0.937 | 0.991 | 1 | 1 | 1 | 1 | 1 | 1 |
| 56 | 1 | 0.924 | 0.927 | 0.957 | 0.997 | 1 | 1 | 1 | 1 | 1 |
| 57 | 1 | 0.858 | 0.867 | 0.948 | 1 | 1 | 1 | 1 | 1 | 1 |
| 58 | 0.92 | 0.918 | 0.92 | 0.92 | 0.92 | 0.872 | 0.781 | 0.77 | 0.762 | 0.761 |
| 59 | 0.932 | 0.837 | 0.838 | 0.853 | 0.869 | 0.923 | 0.901 | 0.881 | 0.864 | 0.862 |
| 60 | 0.837 | 0.741 | 0.743 | 0.756 | 0.771 | 0.822 | 0.829 | 0.824 | 0.82 | 0.819 |
| 61 | 0.78 | 0.628 | 0.631 | 0.655 | 0.681 | 0.766 | 0.78 | 0.779 | 0.776 | 0.775 |
| 62 | 1 | 0.98 | 0.988 | 1 | 1 | 1 | 1 | 1 | 1 | 1 |
| 63 | 0.781 | 0.693 | 0.696 | 0.725 | 0.747 | 0.771 | 0.741 | 0.723 | 0.707 | 0.705 |
| 64 | 1 | 0.871 | 0.875 | 0.903 | 0.934 | 1 | 1 | 1 | 1 | 1 |
| 65 | 1 | 1 | 1 | 1 | 1 | 0.965 | 0.875 | 0.861 | 0.85 | 0.848 |
| 66 | 0.75 | 0.647 | 0.649 | 0.663 | 0.673 | 0.721 | 0.727 | 0.714 | 0.703 | 0.701 |
| 67 | 1 | 0.857 | 0.865 | 0.945 | 0.999 | 1 | 1 | 0.946 | 0.865 | 0.859 |
| 68 | 0.766 | 0.733 | 0.734 | 0.739 | 0.744 | 0.764 | 0.752 | 0.746 | 0.741 | 0.74 |
| 69 | 1 | 0.859 | 0.862 | 0.895 | 0.934 | 1 | 1 | 1 | 1 | 1 |
| 70 | 0.656 | 0.635 | 0.636 | 0.65 | 0.656 | 0.64 | 0.605 | 0.597 | 0.588 | 0.587 |
| 71 | 0.958 | 0.737 | 0.74 | 0.769 | 0.808 | 0.946 | 0.933 | 0.926 | 0.92 | 0.919 |
| 72 | 0.695 | 0.602 | 0.603 | 0.615 | 0.627 | 0.685 | 0.695 | 0.695 | 0.695 | 0.695 |
| 73 | 1 | 0.732 | 0.735 | 0.763 | 0.799 | 0.967 | 1 | 1 | 1 | 1 |
| 74 | 0.798 | 0.544 | 0.546 | 0.569 | 0.599 | 0.757 | 0.742 | 0.733 | 0.726 | 0.726 |
| 75 | 1 | 0.818 | 0.824 | 0.886 | 0.969 | 1 | 1 | 1 | 1 | 1 |
| 76 | 1 | 0.818 | 0.822 | 0.855 | 0.901 | 1 | 1 | 1 | 1 | 1 |
| 77 | 0.855 | 0.787 | 0.788 | 0.801 | 0.815 | 0.852 | 0.837 | 0.828 | 0.821 | 0.82 |
| 78 | 0.883 | 0.511 | 0.512 | 0.53 | 0.555 | 0.76 | 0.883 | 0.883 | 0.883 | 0.883 |
| 79 | 0.853 | 0.762 | 0.765 | 0.789 | 0.812 | 0.839 | 0.767 | 0.75 | 0.719 | 0.716 |
| 80 | 1 | 0.965 | 0.971 | 1 | 1 | 1 | 1 | 1 | 1 | 1 |
| 81 | 1 | 1 | 1 | 1 | 1 | 1 | 1 | 0.992 | 0.965 | 0.962 |
| 82 | 0.715 | 0.606 | 0.607 | 0.623 | 0.639 | 0.696 | 0.701 | 0.694 | 0.679 | 0.678 |
| 83 | 1 | 1 | 1 | 1 | 1 | 1 | 1 | 1 | 0.997 | 0.992 |
| 84 | 1 | 1 | 1 | 1 | 1 | 1 | 0.912 | 0.867 | 0.833 | 0.829 |
| 85 | 1 | 0.966 | 0.973 | 1 | 1 | 1 | 1 | 1 | 1 | 1 |
| 86 | 1 | 0.943 | 0.952 | 1 | 1 | 1 | 1 | 1 | 1 | 1 |
| 87 | 1 | 0.927 | 0.932 | 0.986 | 1 | 0.914 | 0.723 | 0.696 | 0.669 | 0.666 |
| 88 | 1 | 0.909 | 0.912 | 0.941 | 0.981 | 1 | 0.944 | 0.912 | 0.885 | 0.882 |
| 89 | 1 | 1 | 1 | 1 | 1 | 0.942 | 0.718 | 0.681 | 0.656 | 0.653 |
| 90 | 1 | 0.668 | 0.672 | 0.715 | 0.754 | 0.95 | 1 | 1 | 1 | 1 |
| 91 | 1 | 0.683 | 0.686 | 0.715 | 0.749 | 0.954 | 0.961 | 0.942 | 0.928 | 0.926 |
| 92 | 1 | 1 | 1 | 1 | 1 | 0.823 | 0.577 | 0.557 | 0.537 | 0.535 |
| 93 | 1 | 0.82 | 0.822 | 0.847 | 0.864 | 0.958 | 0.987 | 0.972 | 0.958 | 0.957 |
| 94 | 1 | 0.988 | 0.993 | 1 | 1 | 0.976 | 0.912 | 0.9 | 0.89 | 0.889 |
| Model (6) with δ = 1 | OE | δ = 1/10 | δ = 1/3 | δ = 1/2 | δ = 1 | δ = 2 | δ = 3 | δ = 10 | EE | |
|---|---|---|---|---|---|---|---|---|---|---|
| No. of DMUs | 57 | 16 | 16 | 22 | 30 | 35 | 40 | 35 | 34 | 34 |
© 2017 by the authors. Licensee MDPI, Basel, Switzerland. This article is an open access article distributed under the terms and conditions of the Creative Commons Attribution (CC BY) license (http://creativecommons.org/licenses/by/4.0/).
Share and Cite
Lee, P.; Park, Y.-J. Eco-Efficiency Evaluation Considering Environmental Stringency. Sustainability 2017, 9, 661. https://doi.org/10.3390/su9040661
Lee P, Park Y-J. Eco-Efficiency Evaluation Considering Environmental Stringency. Sustainability. 2017; 9(4):661. https://doi.org/10.3390/su9040661
Chicago/Turabian StyleLee, Pyoungsoo, and You-Jin Park. 2017. "Eco-Efficiency Evaluation Considering Environmental Stringency" Sustainability 9, no. 4: 661. https://doi.org/10.3390/su9040661
APA StyleLee, P., & Park, Y.-J. (2017). Eco-Efficiency Evaluation Considering Environmental Stringency. Sustainability, 9(4), 661. https://doi.org/10.3390/su9040661