
Sustainability Assessment of Refining Enterprises Using a DEA-Based Model


Abstract
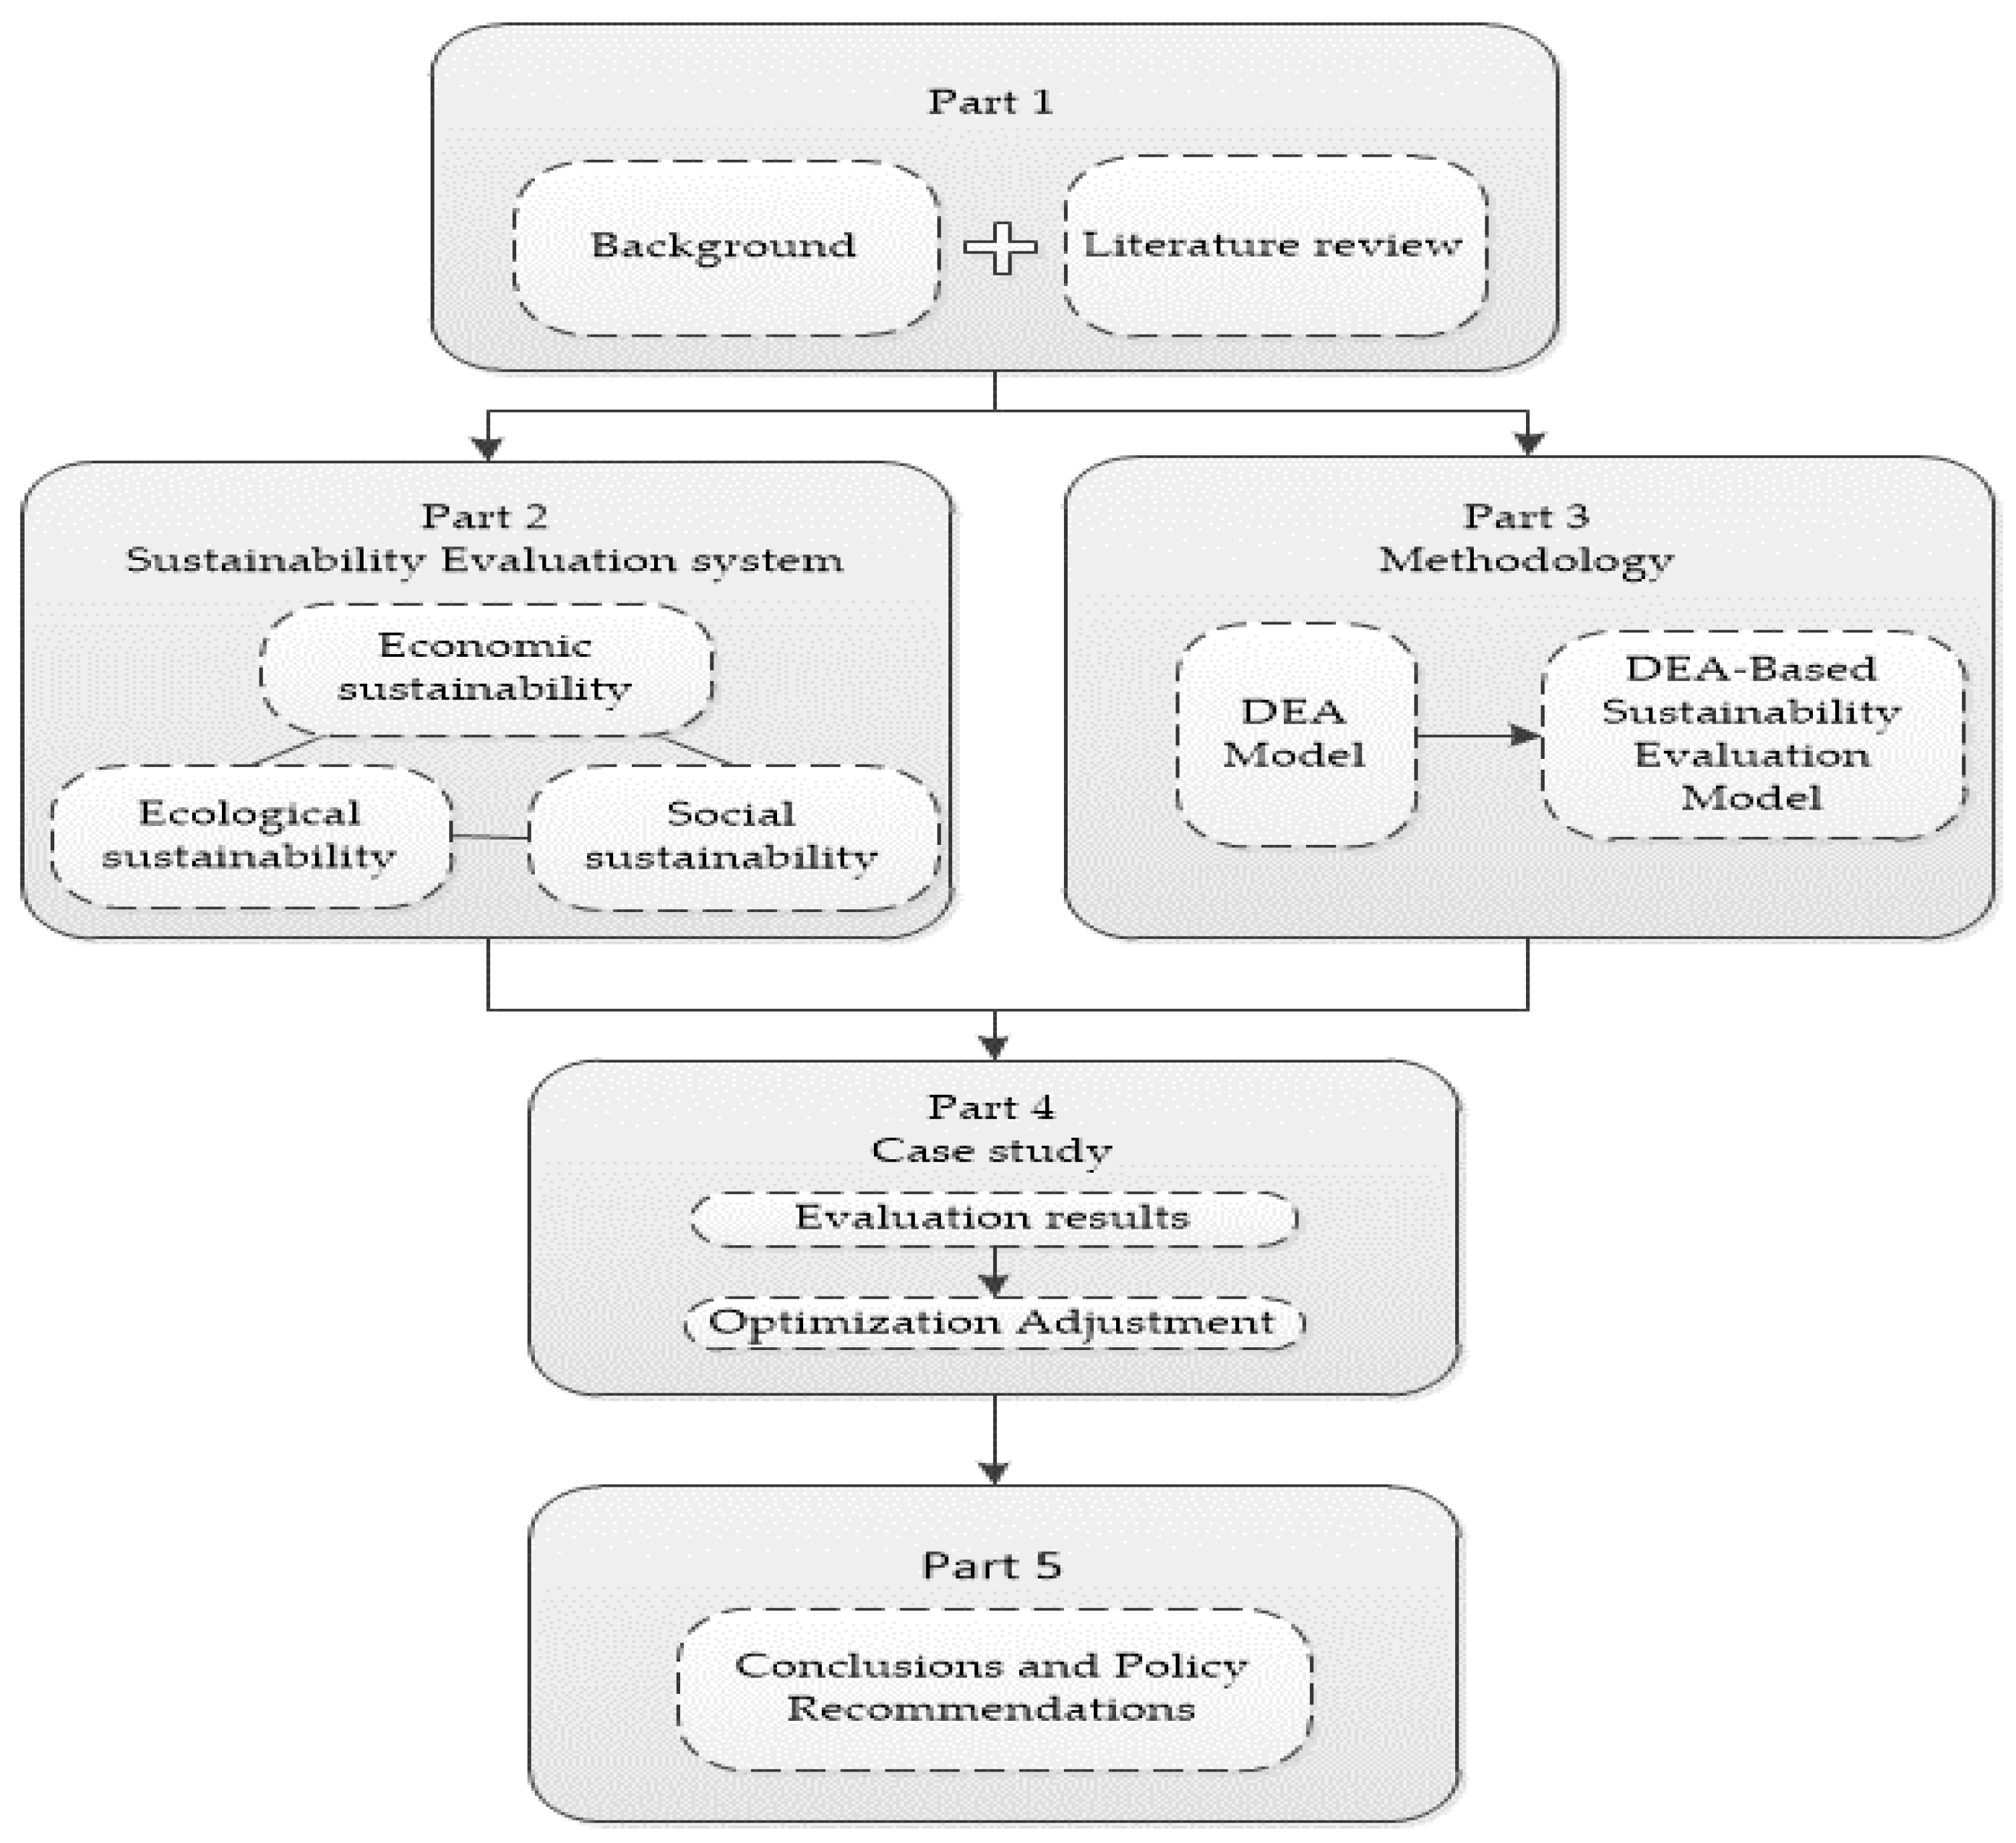
:1. Introduction
2. Establishment of a Refining Enterprise Sustainability Evaluation Index
2.1. Selection Princple
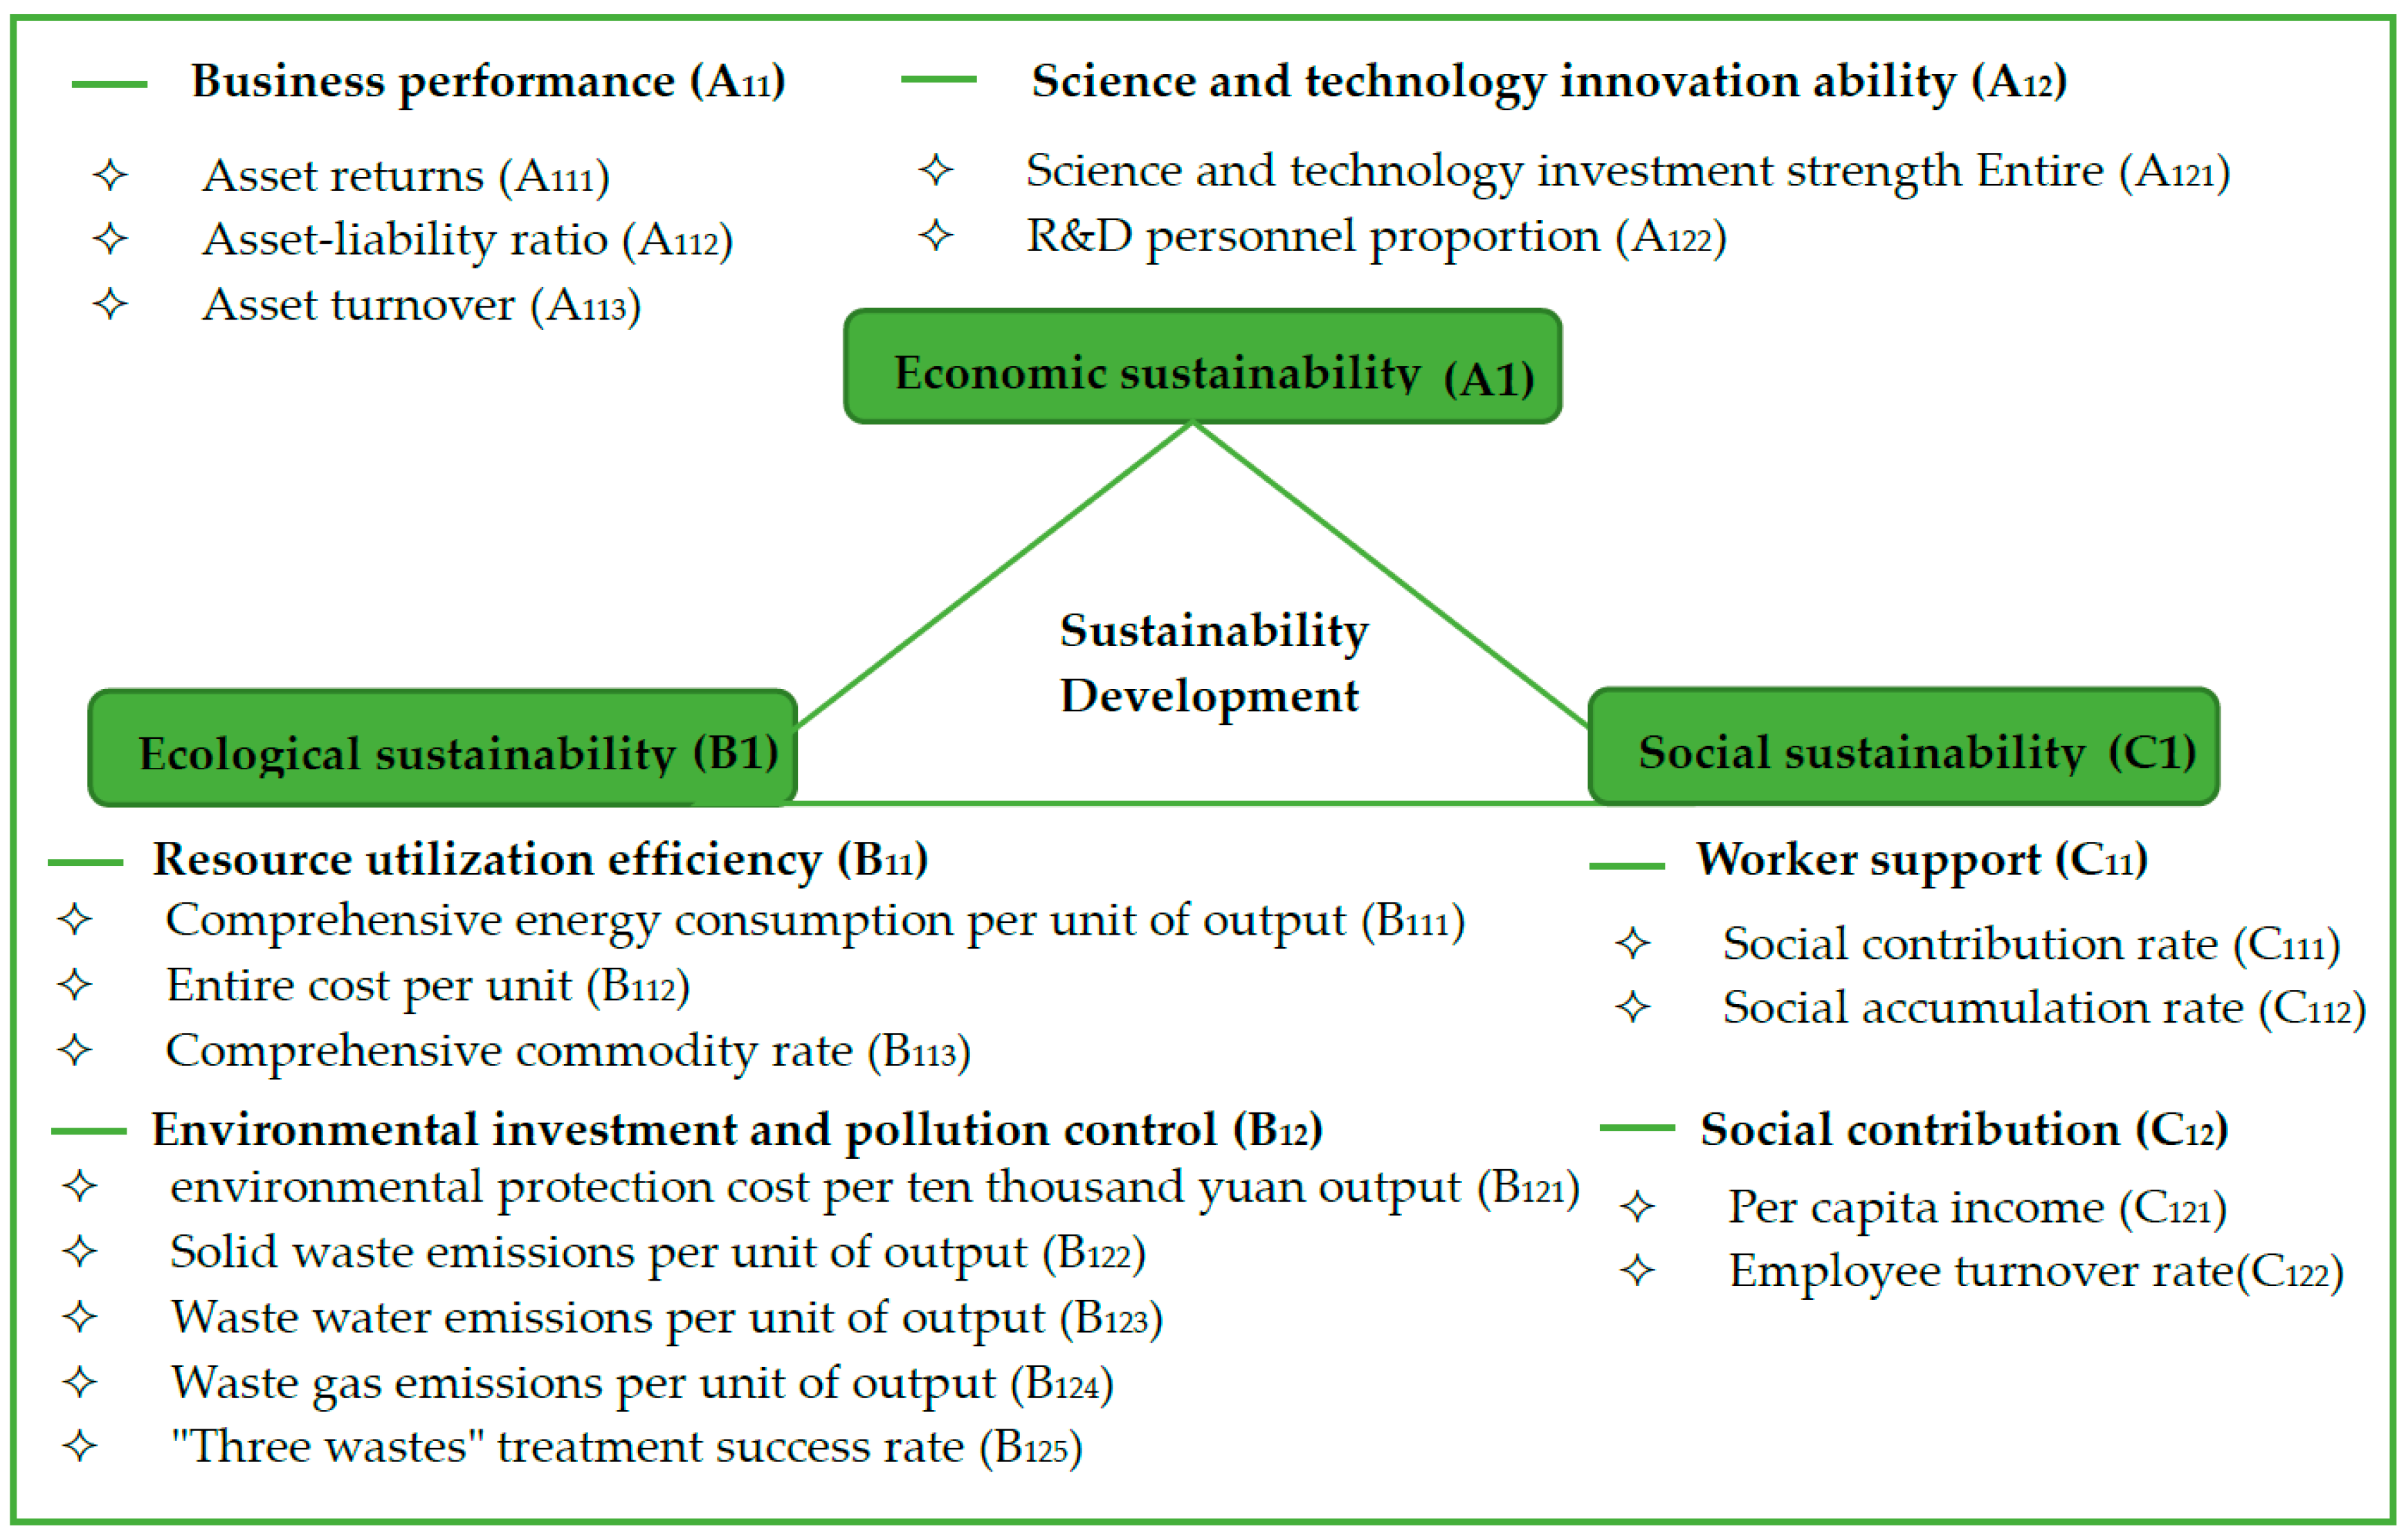
2.2. Sustainability Index System Establishment
2.2.1. Economic Sustainability Index
- (1)
- The business performance evaluation index refers to the enterprise management benefit and operator performance during certain operation period, which can reflect the present situation of an enterprise, and its evaluation indexes mainly include the return on assets, asset–liability ratio, and asset turnover [34]. Return on assets is the ratio of the earnings before interest and tax over the average total assets during a certain period, which can measure the comprehensive efficiency of economic resources of an enterprise; asset–liability ratio refers to the ratio of current debt and total assets, which serves as a measure of the debt level and business risk of enterprise; and asset turnover is the ratio of the current main business income and average total assets, which can be used to measure the asset operation efficiency.
- (2)
- Scientific research and innovation ability is generally used to evaluate an enterprise’s sustainability potential, as it can guarantee the vitality of an enterprise. Selected indexes include R&D investment strength and R&D personnel proportion [35]. R&D investment intensity refers to the ratio of current R&D investment to sales revenue, and the proportion of R&D personnel refers to the ratio of current R&D personnel to the average total staff during that period.
2.2.2. Ecological Sustainability Index
- (1)
- Resource utilization efficiency refers to the utilization degree of raw materials, fuels, and auxiliary materials in the process of production. The evaluation index includes the comprehensive energy consumption per unit of output, entire cost per unit, and comprehensive commodity rate [38]. Comprehensive energy consumption per unit of output reflects the energy consumption of oil refinery enterprises in the process of production. Lower values indicate higher efficiency. The entire cost per unit is the ratio of the total operation cost to the crude oil processing capacity, which reflects the costs of enterprise when processing per unit of raw materials. The comprehensive commodity rate is the ratio of crude oil products over the crude oil processing capacity, and it reflects the refining efficiency of crude oil resources.
- (2)
- The environmental protection investment and pollution control index can comprehensively reflect the investment in enterprise environmental protection, the control ability of “three wastes” emissions, and the treatment ability of “three wastes” [39]. Evaluation indexes include environmental protection investment per 10 thousand yuan output, solid waste emissions per unit of output, wastewater emissions per unit of output, waste gas emissions per unit of output, and the standard volume of “three wastes” emission. The environmental protection investment per 10 thousand yuan output refers to the average environmental protection cost per 10 thousand yuan of output during certain period; solid waste/water/gas emissions per unit of output refers to the ratio of solid waste/water/gas emissions over the total enterprise output; and “three wastes” disposal rate refers to the average of the disposal rates of waste solid, water, and gas.
2.2.3. Social Sustainability Evaluation Index
- (1)
- Social contribution ability intuitively reflects the contribution of an enterprise to the society, which can be expressed by the social contribution rate and the social accumulation rate [42]. The former concept is the ratio of an enterprise’s contribution to society to its average total assets, and thus it can measure the capacity of an enterprise to contribute to the society with all the assets. The latter concept refers to the ratio of the total fiscal revenue to the contribution to the society, and it can measure the support degree of an enterprise to the social public welfare.
- (2)
- The worker protection ability mainly refers to the guarantee of enterprises towards workers concerning their basic life demand and stable employment. Good corporate culture requires the unity of the workers, so that the guarantee of basic life demand and employment is provided. It is generally evaluated by the income per capita and the employee turnover rate [43]. Income per capita is the ratio of the current total wages to the total number of employees, which can reflect the level of the employees’ basic needs. The employee turnover rate is the ratio of the number of leaving employees to the total number of employees during a certain period, which represents employment stability.
3. Methodology
3.1. DEA Model
3.2. The DEA-Based Sustainbility Evaluation Model
4. Results and Discussion
5. Conclusions and Policy Recommendations
5.1. Conclusions
5.2. Policy Recommendations
- (1)
- Active measures should be taken to reduce total cost per unit. This can be achieved by separating each cost or expense, and corresponding financial indexes can then be established to formulate a suitable index system. The transparency of individual costs should be improved, and corresponding control and supervision is critical. Cost assessment should be completed on a regular basis, and an evaluation mechanism linked to performance should be designed.
- (2)
- Investment in science and technology should be enhanced to maintain continuous innovation. Critical technologies should be mastered before they become dominant in the future, and so should the relevant intellectual property rights. The gradual demonstration and modification should be highlighted, and special attention must be paid to the popularization and commercial application of those technologies.
- (3)
- Energy conservation and emission reduction should be implemented to achieve clean production. From the energy conservation prospect, technology and operation management levels should be enhanced, which can be implemented by reducing heat loss through technological innovation based on designed value. From an emission reduction perspective, emphasis should be placed on the source of pollutants, which should be reduced from the very beginning by process optimization. Meanwhile, the recycling of “three wastes” and the reuse of wastewater is emergent.
- (4)
- Social contribution rates and employee benefits should increase. While continuously improving social contributions and social accumulation rates, refining enterprises should also be actively involved in public welfare and shoulder more social responsibilities.
Acknowledgments
Author Contributions
Conflicts of Interest
References
- Luan, W.; Lu, L.; Li, X.; Ma, C. Weight Determination of Sustainable Development Indicators Using a Global Sensitivity Analysis Method. Sustainability 2017, 9, 303. [Google Scholar] [CrossRef]
- Abdul-Manan, A.F.N.; Arfaj, A.; Babiker, H. Oil refining in a CO2 constrained world: Effects of carbon pricing on refineries globally. Energy 2017, 121, 264–275. [Google Scholar] [CrossRef]
- Walls, W.D. Petroleum refining industry in China. Energy Policy 2010, 38, 2110–2115. [Google Scholar] [CrossRef]
- Xu, H.F. Review and trend of world oil refining industry in 2014. Int. J. Pet. Econ. 2015, 23, 47–53. (In Chinese) [Google Scholar]
- Hua, Y.W. Petrochemical industry make green development action in 2020 by reducing the energy consumption and carbon dioxide emissions. Chin. J. Pet. Chem. Eng. 2016, 2016, 78. (In Chinese) [Google Scholar]
- Dong, K.; Sun, R.; Li, H.; Zheng, S.; Yuan, B.; Chung, K. Weaker demand outlook, heightened regulations create uncertainty for Chinese refiners. Oil Gas J. 2016, 114, 63–67. [Google Scholar]
- Bandyopadhyay, M.; Dutta, A.; Dikshit, A.K.; Ray, S. Environmental impact assessment and its minimization in a refinery for sustainable development. Interdiscip. Environ. Rev. 2001, 3, 156–167. [Google Scholar] [CrossRef]
- Büyüközkan, G.; Karabulut, Y. Energy project performance evaluation with sustainability perspective. Energy 2017, 119, 549–560. [Google Scholar] [CrossRef]
- Li, H.; Sun, R.; Lee, W.J.; Lee, W.; Dong, K.; Guo, R. Assessing Risk in Chinese Shale Gas Investments Abroad: Modelling and Policy Recommendations. Sustainability 2016, 8, 708. [Google Scholar] [CrossRef]
- Anvaripour, B.; Sa’idi, E.; Nabhani, N.; Jaderi, F. Risk Analysis of Crude Distillation Unit’s assets in Abadan Oil Refinery Using Risk Based Maintenance. TJEAS J. 2013, 3, 1888–1892. [Google Scholar]
- Calabrese, A.; Costa, R.; Levialdi, N.; Menichini, T. A fuzzy Analytic Hierarchy Process method to support materiality assessment in sustainability reporting. J. Clean. Prod. 2016, 121, 248–264. [Google Scholar] [CrossRef]
- Arce, M.E.; Saavedra, Á.; Míguez, J.L.; Granada, E. The use of grey-based methods in multi-criteria decision analysis for the evaluation of sustainable energy systems: A review. Renew. Sustain. Energy Rev. 2015, 47, 924–932. [Google Scholar] [CrossRef]
- Dong, X.; Guo, J.; Höök, M.; Pi, G. Sustainability assessment of the natural gas industry in China using principal component analysis. Sustainability 2015, 7, 6102–6118. [Google Scholar] [CrossRef]
- Chen, X.; Gong, Z. DEA Efficiency of Energy Consumption in China’s Manufacturing Sectors with Environmental Regulation Policy Constraints. Sustainability 2017, 9, 210. [Google Scholar] [CrossRef]
- Li, J.Q.; Zhang, Z.X.; Li, Y.C.; Li, Y. Comprehensive appraisement analysis on sustainable development of oil-refining enterprise. J. Univ. Pet. 2003, 27, 121–124. (In Chinese) [Google Scholar]
- Lv, H.Y.; Wang, Y.Q. Sustainability evaluation system of refineries. Bord. Econ. Cult. 2007, 2017, 38–39. (In Chinese) [Google Scholar]
- Dong, K.; Sun, R.; Jiang, H.; Li, H. Integrated Evaluation of Circular Economy Method for Chinese Petroleum Refining Industry. Oxid. Commun. 2017, 39, 3998–4013. [Google Scholar]
- Sexton, T.R. The methodology of data envelopment analysis. New Dir. Eval. 1986, 1986, 7–29. [Google Scholar] [CrossRef]
- Mardani, A.; Zavadskas, E.K.; Streimikiene, D.; Jusoh, A.; Khoshnoudi, M. A comprehensive review of data envelopment analysis (DEA) approach in energy efficiency. Renew. Sustain. Energy Rev. 2016, 70, 1298–1322. [Google Scholar] [CrossRef]
- Norman, M.; Stoker, B. Data Envelopment Analysis: The Assessment of Performance; John Wiley & Sons: Hoboken, NJ, USA, 1991. [Google Scholar]
- Singh, R.K.; Murty, H.R.; Gupta, S.K.; Dikshit, A.K. An overview of sustainability assessment methodologies. Ecol. Indic. 2012, 15, 281–299. [Google Scholar] [CrossRef]
- Malana, N.M.; Malano, H.M. Benchmarking productive efficiency of selected wheat areas in Pakistan and India using data envelopment analysis. Irrig. Drain. 2006, 55, 383–394. [Google Scholar] [CrossRef]
- Rossi, P.H.; Lipsey, M.W.; Freeman, H.E. Evaluation: A Systematic Approach; Sage Publications: Thousand Oaks, CA, USA, 2003. [Google Scholar]
- Yuan, Q.M.; Qiu, J. An Evaluation Research on Tianjin Marine Economy Sustainable Development via PCA and DEA. In Applied Mechanics and Materials; Trans Tech Publications: Zurich, Switzerland, 2014; Volume 448, pp. 4065–4070. [Google Scholar]
- Cooper, W.W.; Seiford, L.M.; Zhu, J. Data envelopment analysis. In Handbook on Data Envelopment Analysis; Springer: New York, NY, USA, 2004; pp. 1–39. [Google Scholar]
- Johnstone, N.; Managi, S.; Rodríguez, M.C.; Haščič, I.; Fujii, H.; Souchier, M. Environmental policy design, innovation and efficiency gains in electricity generation. Energy Econ. 2017, 63, 106–115. [Google Scholar] [CrossRef]
- Yagi, M.; Fujii, H.; Hoang, V.; Managi, S. Environmental efficiency of energy, materials, and emissions. J. Environ. Manag. 2015, 161, 206–218. [Google Scholar] [CrossRef] [PubMed]
- Fujii, H.; Managi, S. Optimal production resource reallocation for CO2 emissions reduction in manufacturing sectors. Glob. Environ. Chang. 2015, 35, 505–513. [Google Scholar] [CrossRef]
- Basiron, Y.; Weng, C.K. The oil palm and its sustainability. J. Oil Palm Res. 2004, 16, 1–10. [Google Scholar]
- Venetoulis, J.; Talberth, J. Refining the ecological footprint. Environ. Dev. Sustain. 2008, 10, 441–469. [Google Scholar] [CrossRef]
- Goodland, R. The concept of environmental sustainability. Annu. Rev. Ecol. Syst. 1995, 26, 1–24. [Google Scholar] [CrossRef]
- Siche, J.R.; Agostinho, F.; Ortega, E.; Romeiro, A. Sustainability of nations by indices: Comparative study between environmental sustainability index, ecological footprint and the emergy performance indices. Ecol. Econ. 2008, 66, 628–637. [Google Scholar] [CrossRef]
- Perrini, F.; Tencati, A. Sustainability and stakeholder management: The need for new corporate performance evaluation and reporting systems. Bus. Strategy Environ. 2006, 15, 296–308. [Google Scholar] [CrossRef]
- Zhong, W.; Yuan, W.; Li, S.X.; Huangm, Z. The performance evaluation of regional R&D investments in China: An application of DEA based on the first official China economic census data. Omega 2011, 39, 447–455. [Google Scholar]
- Ness, B.; Urbel-Piirsalu, E.; Anderberg, S.; Olsson, L. Categorising tools for sustainability assessment. Ecol. Econ. 2007, 60, 498–508. [Google Scholar] [CrossRef]
- Khanna, N. Measuring environmental quality: An index of pollution. Ecol. Econ. 2000, 35, 191–202. [Google Scholar] [CrossRef]
- Zhu, Q.; Wu, J.; Li, X.; Xiong, B. China’s regional natural resource allocation and utilization: A DEA-based approach in a big data environment. J. Clean. Prod. 2017, 142, 809–818. [Google Scholar] [CrossRef]
- Labuschagne, C.; Brent, A.C.; Van Erck, R.P.G. Assessing the sustainability performances of industries. J. Clean. Prod. 2005, 13, 373–385. [Google Scholar] [CrossRef]
- Šaparauskas, J.; Turskis, Z. Evaluation of construction sustainability by multiple criteria methods. Technol. Econ. Dev. Econ. 2006, 12, 321–326. [Google Scholar]
- Strezov, V.; Evans, A.; Evans, T.J. Assessment of the Economic, Social and Environmental Dimensions of the Indicators for Sustainable Development. Sustain. Dev. 2016. [Google Scholar] [CrossRef]
- Vasconcelos, D.; Melo, M.B.; Souto, M.S.M.; Caldas, A.; Muniz, D. Good management practices of the waste and of the health and the safety conditions in the constructive process: Sustainability, social responsibility and ethical business activity. In Occupational Safety and Hygiene IV; CRC Press: New York, NY, USA, 2016; p. 133. [Google Scholar]
- Charnes, A.; Cooper, W.W.; Rhodes, E. Measuring the efficiency of decision making units. Eur. J. Oper. Res. 1978, 2, 429–444. [Google Scholar] [CrossRef]
- Zhou, H.; Hu, H. Sustainability evaluation of railways in China using a two-stage network DEA model with undesirable outputs and shared resources. Sustainability 2017, 9, 150. [Google Scholar] [CrossRef]
- Chen, L.; Jia, G. Environmental efficiency analysis of China’s regional industry: A data envelopment analysis (DEA) based approach. J. Clean. Prod. 2017, 142, 846–853. [Google Scholar] [CrossRef]
- Afsharian, M.; Afsharian, M.; Ahn, H.; Neumann, L. Generalized DEA: An approach for supporting input/output factor determination in DEA. Benchmarking Int. J. 2016, 23, 1892–1909. [Google Scholar] [CrossRef]
- Lovell, C.A.K.; Rouse, A.P.B. Equivalent standard DEA models to provide super-efficiency scores. J. Oper. Res. Soc. 2003, 54, 101–108. [Google Scholar] [CrossRef]
- Golany, B.; Roll, Y. An application procedure for DEA. Omega 1989, 17, 237–250. [Google Scholar] [CrossRef]
- Parkan, C.; Wu, M. Decision-making and performance measurement models with applications to robot selection. Comput. Ind. Eng. 1999, 36, 503–523. [Google Scholar] [CrossRef]

| JX | DL | FS | LZ | YS | ZH | YZ | JL | MM | TJ | QL | GZ | GQ | FJ | Z | |
|---|---|---|---|---|---|---|---|---|---|---|---|---|---|---|---|
| A111 | −22.13 | −40.66 | −26.97 | −18.12 | −8.35 | −5.97 | −10.58 | −13.39 | −1.46 | −78.57 | −9.15 | −29.11 | −26.26 | −19.05 | −1.46 |
| A112 | 8.96 | 21.29 | 19.2 | 19.34 | 1.03 | 22.83 | 20.1 | 16.4 | 13.77 | 27.93 | 13.17 | 4.39 | 2.37 | 23.33 | 1.03 |
| A113 | 1.44 | 1.85 | 1.72 | 1.83 | 2.22 | 3.38 | 2.19 | 3.97 | 5 | 2.26 | 2.87 | 3.74 | 3.46 | 3.31 | 5 |
| A121 | 0.86 | 1.56 | 0.45 | 1.44 | 1.62 | 2.06 | 2.97 | 2.13 | 1.91 | 0.93 | 1.19 | 1.53 | 1.12 | 1.25 | 2.97 |
| A122 | 15.78 | 19.41 | 17.26 | 20.61 | 23.9 | 15.5 | 27.5 | 13.73 | 17.04 | 14.25 | 15.37 | 19.09 | 14.72 | 23.21 | 27.5 |
| B111 | 0.32 | 0.32 | 0.36 | 0.34 | 0.31 | 0.48 | 1.4 | 0.34 | 0.26 | 0.3 | 0.42 | 0.74 | 0.38 | 0.36 | 0.26 |
| B112 | 222.3 | 83.63 | 98.41 | 159.7 | 187.6 | 89.65 | 139.6 | 159.8 | 156.3 | 155.3 | 166.6 | 162.8 | 188.7 | 265.3 | 83.63 |
| B113 | 92.79 | 90.64 | 92.02 | 93.37 | 94 | 95.94 | 93.95 | 93.98 | 94.7 | 95.51 | 95.1 | 93.49 | 94.87 | 92.41 | 95.94 |
| B121 | 23.17 | 25.86 | 115.4 | 165.7 | 78.34 | 36.14 | 38.37 | 242.5 | 89.87 | 36.07 | 89.15 | 167.2 | 88.69 | 3.94 | 242.5 |
| B122 | 0.2 | 0 | 1.7 | 0.85 | 0.6 | 0.25 | 5.16 | 2.68 | 0.42 | 1.7 | 0 | 12.54 | 3.37 | 0 | 0 |
| B123 | 0.59 | 0.06 | 0.86 | 0.33 | 0.5 | 0.49 | 0.49 | 0.58 | 0.69 | 0.95 | 1.14 | 0.79 | 0.42 | 0.87 | 0.06 |
| B124 | 0.58 | 0.24 | 1.29 | 0.37 | 0.54 | 0.35 | 0.06 | 1.73 | 0.49 | 0.17 | 0.86 | 0.9 | 0.83 | 0.26 | 0.06 |
| B125 | 99.81 | 98.95 | 100 | 99.15 | 99.26 | 100 | 99.27 | 99.04 | 100 | 97.48 | 97.55 | 99.05 | 97.57 | 100 | 100 |
| C111 | 7.81 | 1.55 | 11.6 | 10.94 | 9.57 | 10.9 | 7.3 | 12.11 | 20.89 | 1.62 | 14.19 | 12.59 | 10.62 | 0.43 | 20.89 |
| C112 | 54.45 | 49.15 | 50.03 | 42.94 | 61.96 | 80.8 | 43.93 | 68.5 | 76.43 | −312.6 | 45.24 | 70.7 | 67.13 | 29.5 | 80.8 |
| C121 | 62,615 | 70,712 | 7601 | 77,449 | 72,953 | 82,566 | 81,508 | 65,143 | 75,861 | 56,957 | 47,099 | 90,382 | 81,931 | 75,865 | 90,382 |
| C122 | 7.36 | 11.8 | 10.61 | 5.21 | 4.38 | 11.43 | 8.77 | 6.92 | 6.15 | 8.18 | 8.9 | 4.22 | 5.94 | 7.99 | 4.22 |
| A111 | A112 | A113 | A121 | A121 | B111 | B112 | B113 | B121 | B122 | B123 | B124 | B125 | C111 | C112 | C131 | C122 | |
|---|---|---|---|---|---|---|---|---|---|---|---|---|---|---|---|---|---|
| A111 | 1.00 | −0.42 | 0.43 | 0.52 | 0.36 | 0.12 | −0.02 | 0.20 | 0.30 | −0.15 | −0.22 | 0.09 | 0.53 | 0.65 | 0.85 | 0.32 | −0.23 |
| A112 | −0.42 | 1.00 | −0.34 | −0.16 | −0.21 | 0.11 | −0.11 | −0.21 | −0.44 | −0.25 | 0.26 | −0.17 | 0.00 | −0.56 | −0.49 | −0.33 | 0.669 |
| A113 | 0.43 | −0.34 | 1.00 | 0.52 | 0.06 | −0.14 | −0.09 | 0.55 | 0.50 | 0.12 | −0.07 | 0.07 | 0.16 | 0.65 | 0.27 | 0.38 | −0.41 |
| A121 | 0.52 | −0.16 | 0.52 | 1.00 | 0.60 | 0.45 | −0.36 | 0.38 | 0.34 | 0.09 | −0.53 | −0.33 | 0.29 | 0.37 | 0.31 | 0.46 | −0.21 |
| A122 | 0.36 | −0.21 | 0.06 | 0.60 | 1.00 | 0.41 | −0.07 | −0.09 | 0.07 | 0.04 | −0.43 | −0.56 | 0.42 | 0.04 | 0.25 | 0.52 | −0.29 |
| B111 | 0.12 | 0.11 | −0.14 | 0.45 | 0.41 | 1.00 | −0.06 | 0.00 | −0.16 | 0.57 | 0.04 | −0.17 | 0.00 | −0.12 | 0.10 | 0.28 | 0.11 |
| B112 | −0.02 | −0.11 | −0.09 | −0.36 | −0.07 | −0.06 | 1.00 | −0.12 | −0.29 | 0.03 | 0.44 | 0.08 | −0.12 | −0.32 | −0.07 | −0.26 | −0.36 |
| B113 | 0.20 | −0.21 | 0.55 | 0.38 | −0.09 | 0.00 | −0.12 | 1.00 | 0.25 | −0.03 | 0.11 | −0.14 | −0.25 | 0.50 | −0.19 | 0.03 | −0.31 |
| B121 | 0.30 | −0.44 | 0.50 | 0.34 | 0.07 | −0.16 | −0.29 | 0.25 | 1.00 | 0.26 | −0.23 | 0.46 | 0.06 | 0.66 | 0.28 | 0.28 | −0.56 |
| B122 | −0.15 | −0.25 | 0.12 | 0.09 | 0.04 | 0.57 | 0.03 | −0.03 | 0.26 | 1.00 | 0.16 | 0.25 | −0.16 | 0.05 | 0.05 | 0.42 | −0.32 |
| B123 | −0.22 | 0.26 | −0.07 | −0.53 | −0.43 | 0.04 | 0.44 | 0.11 | −0.23 | 0.16 | 1.00 | 0.34 | −0.29 | −0.11 | −0.37 | −0.53 | 0.12 |
| B124 | 0.09 | −0.17 | 0.07 | −0.33 | −0.56 | −0.17 | 0.08 | −0.14 | 0.46 | 0.25 | 0.34 | 1.00 | −0.11 | 0.24 | 0.26 | −0.21 | −0.03 |
| B125 | 0.53 | 0.00 | 0.16 | 0.29 | 0.42 | 0.00 | −0.12 | −0.25 | 0.06 | −0.16 | −0.29 | −0.11 | 1.00 | 0.23 | 0.51 | 0.51 | 0.02 |
| C111 | 0.65 | −0.56 | 0.65 | 0.37 | 0.04 | −0.12 | −0.32 | 0.50 | 0.66 | 0.05 | −0.11 | 0.24 | 0.23 | 1.00 | 0.28 | 0.37 | −0.45 |
| C112 | 0.85 | −0.49 | 0.27 | 0.31 | 0.25 | 0.10 | −0.07 | −0.19 | 0.28 | 0.05 | −0.37 | 0.26 | 0.51 | 0.28 | 1.00 | 0.53 | −0.12 |
| C121 | 0.32 | −0.33 | 0.38 | 0.46 | 0.52 | 0.28 | −0.26 | 0.03 | 0.28 | 0.42 | −0.53 | −0.21 | 0.51 | 0.37 | 0.53 | 1.00 | −0.32 |
| C122 | −0.23 | 0.69 | −0.41 | −0.21 | −0.29 | 0.11 | −0.36 | −0.31 | −0.56 | −0.32 | 0.12 | −0.03 | 0.02 | −0.45 | −0.12 | −0.32 | 1.00 |
| Enterprises | Ranking | Relative Efficiency | Scale and Technical Efficiency |
|---|---|---|---|
| Z | 1 | 1 | Scaly and technically efficient |
| YZ | 1 | 1 | Scaly and technically efficient |
| MM | 1 | 1 | Scaly and technically efficient |
| GZ | 1 | 1 | Scaly and technically efficient |
| YS | 5 | 0.9926 | Scaly and technically inefficient |
| DL | 6 | 0.9895 | Scaly and technically inefficient |
| ZH | 7 | 0.93285 | Scaly and technically inefficient |
| TJ | 8 | 0.861589 | Scaly and technically inefficient |
| FS | 9 | 0.849812 | Scaly and technically inefficient |
| LZ | 10 | 0.803096 | Scaly and technically inefficient |
| JX | 11 | 0.7972417 | Scaly and technically inefficient |
| JL | 12 | 0.7480421 | Scaly and technically inefficient |
| FJ | 13 | 0.7055672 | Scaly and technically inefficient |
| GQ | 14 | 0.7025143 | Scaly and technically inefficient |
| QL | 15 | 0.6032789 | Scaly and technically inefficient |
| Enterprises | JX | DL | FS | LZ | YS | ZH | JL | TJ | QL | GQ | FJ | |
|---|---|---|---|---|---|---|---|---|---|---|---|---|
| Relative efficiency | 0.8 | 0.99 | 0.85 | 0.8 | 0.99 | 0.93 | 0.75 | 0.86 | 0.6 | 0.7 | 0.71 | |
| Input surplus | X1 | 7.67 | 20.26 | 17.99 | 0 | 21.73 | 15.02 | 26.74 | 11.48 | 0.92 | 21.87 | 18.07 |
| X2 | 0 | 0.07 | 0.06 | 0.05 | 0.21 | 0 | 0 | 0 | 0.02 | 0 | 0.03 | |
| X3 | 117.6 | 0 | 0 | 104.02 | 0 | 48.03 | 58.68 | 29.26 | 71.01 | 146.81 | 56.47 | |
| X4 | 0.2 | 0 | 1.7 | 0.6 | 0.25 | 2.68 | 1.7 | 0 | 3.37 | 0 | 0.85 | |
| X5 | 0.51 | 0 | 0.79 | 0.44 | 0.42 | 0.5 | 0.88 | 1.04 | 0.34 | 0.79 | 0.26 | |
| X6 | 0.5 | 0.18 | 1.22 | 0.47 | 0.28 | 1.65 | 0.09 | 0.76 | 0.75 | 0.17 | 0.29 | |
| X7 | 2.08 | 7.58 | 5.64 | 0.16 | 6.91 | 1.28 | 3.3 | 1.97 | 0 | 2.01 | 0 | |
| Output deficiency | Y1 | 25.93 | 39.63 | 30.02 | 6.95 | 4.83 | 15.95 | 89.51 | 12.77 | 35.32 | 24.93 | 20.76 |
| Y2 | 4.46 | 3.14 | 3.87 | 2.76 | 1.74 | 1.38 | 3.16 | 3.47 | 2.12 | 2.4 | 3.9 | |
| Y3 | 2.64 | 1.39 | 2.97 | 1.34 | 0.98 | 1.12 | 2.35 | 2.91 | 2.59 | 2.44 | 1.87 | |
| Y4 | 14.64 | 7.88 | 12.05 | 3.42 | 12.86 | 18.41 | 15.24 | 19.71 | 17.76 | 6.08 | 8.29 | |
| Y5 | 3.72 | 4.34 | 4.61 | 1.24 | 0 | 2.62 | 0 | 0 | 0 | 5 | 2.18 | |
| Y6 | 274.58 | 216.4 | 149.62 | 163.61 | 221.25 | 0 | 238.37 | 250.73 | 215.14 | 338.16 | 93.11 | |
| Y7 | 0 | 0 | 0 | 0 | 0 | 1.28 | 2.4 | 2.61 | 1.87 | 0 | 0 | |
| Y8 | 16.36 | 19.32 | 10.93 | 11.25 | 10.71 | 11.74 | 22.26 | 10.8 | 14.29 | 29 | 12.17 | |
| Y9 | 34,614 | 18,920 | 16,904 | 16,885 | 8379 | 33,741 | 38,325 | 40,435 | 10,596 | 20,576 | 15,148 | |
| QL Relative Efficiency = 0.60 | ZH Relative Efficiency = 0.93 | FJ Relative Efficiency = 0.70 | |||||||
|---|---|---|---|---|---|---|---|---|---|
| Original Value | Optimized Target Value | Adjustment Ratio | Original Value | Optimized Target Value | Adjustment Ratio | Original Value | Optimized Target Value | Adjustment Ratio | |
| X1 | 13.17 | 1.69 | −87.15% | 22.83 | 1.10 | −95.16% | 23.33 | 1.46 | −93.74% |
| X2 | 0.42 | 0.42 | 0.00% | 0.48 | 0.27 | −42.92% | 0.36 | 0.36 | 0.00% |
| X3 | 166.67 | 137.41 | −17.55% | 89.65 | 89.65 | 0.00% | 265.34 | 118.53 | −55.33% |
| X4 | 0.00 | 0.00 | 0.00% | 0.25 | 0.00 | −100% | 0.00 | 0.00 | 0.00% |
| X5 | 1.14 | 0.10 | −91.37% | 0.49 | 0.06 | −86.78% | 0.87 | 0.09 | −90.23% |
| X6 | 0.86 | 0.10 | −88.14% | 0.35 | 0.07 | −80.98% | 0.26 | 0.09 | −66.22% |
| X7 | 8.90 | 6.93 | −22.09% | 11.43 | 4.52 | −60.42% | 7.99 | 5.98 | −25.14% |
| Y1 | −9.15 | −2.40 | 73.78% | −5.97 | −1.57 | 73.78% | −19.05 | −2.07 | 89.14% |
| Y2 | 2.87 | 8.22 | 186.77% | 3.38 | 5.36 | 58.54% | 3.31 | 7.09 | 114.16% |
| Y3 | 1.19 | 4.88 | 310.08% | 2.06 | 3.18 | 54.55% | 1.25 | 4.21 | 236.75% |
| Y4 | 15.37 | 35.19 | 128.95% | 15.50 | 29.48 | 90.19% | 23.21 | 38.98 | 67.93% |
| Y5 | 95.10 | 95.10 | 0.00% | 95.94 | 95.94 | 0.00% | 92.41 | 95.98 | 3.86% |
| Y6 | 89.15 | 398.51 | 347.01% | 36.14 | 259.99 | 619.39% | 3.94 | 343.74 | 999.90% |
| Y7 | 97.55 | 100.00 | 2.51% | 100.00 | 100.00 | 0.00% | 100.00 | 100.00 | 0.00% |
| Y8 | 14.19 | 34.32 | 141.89% | 10.90 | 22.39 | 105.45% | 0.43 | 29.61 | 999.90% |
| Y9 | 47,099.45 | 98,507.69 | 109.15% | 82,566.34 | 96,889.00 | 17.35% | 75,865.25 | 98,099.64 | 29.31% |
© 2017 by the authors. Licensee MDPI, Basel, Switzerland. This article is an open access article distributed under the terms and conditions of the Creative Commons Attribution (CC BY) license (http://creativecommons.org/licenses/by/4.0/).
Share and Cite
Li, H.; Dong, K.; Sun, R.; Yu, J.; Xu, J. Sustainability Assessment of Refining Enterprises Using a DEA-Based Model. Sustainability 2017, 9, 620. https://doi.org/10.3390/su9040620
Li H, Dong K, Sun R, Yu J, Xu J. Sustainability Assessment of Refining Enterprises Using a DEA-Based Model. Sustainability. 2017; 9(4):620. https://doi.org/10.3390/su9040620
Chicago/Turabian StyleLi, Hui, Kangyin Dong, Renjin Sun, Jintao Yu, and Jinhong Xu. 2017. "Sustainability Assessment of Refining Enterprises Using a DEA-Based Model" Sustainability 9, no. 4: 620. https://doi.org/10.3390/su9040620
APA StyleLi, H., Dong, K., Sun, R., Yu, J., & Xu, J. (2017). Sustainability Assessment of Refining Enterprises Using a DEA-Based Model. Sustainability, 9(4), 620. https://doi.org/10.3390/su9040620