
A Fuzzy Logic-Based Tool for the Assessment of Corporate Sustainability: A Case Study in the Food Machinery Industry


Abstract
:1. Introduction
2. Literature Review
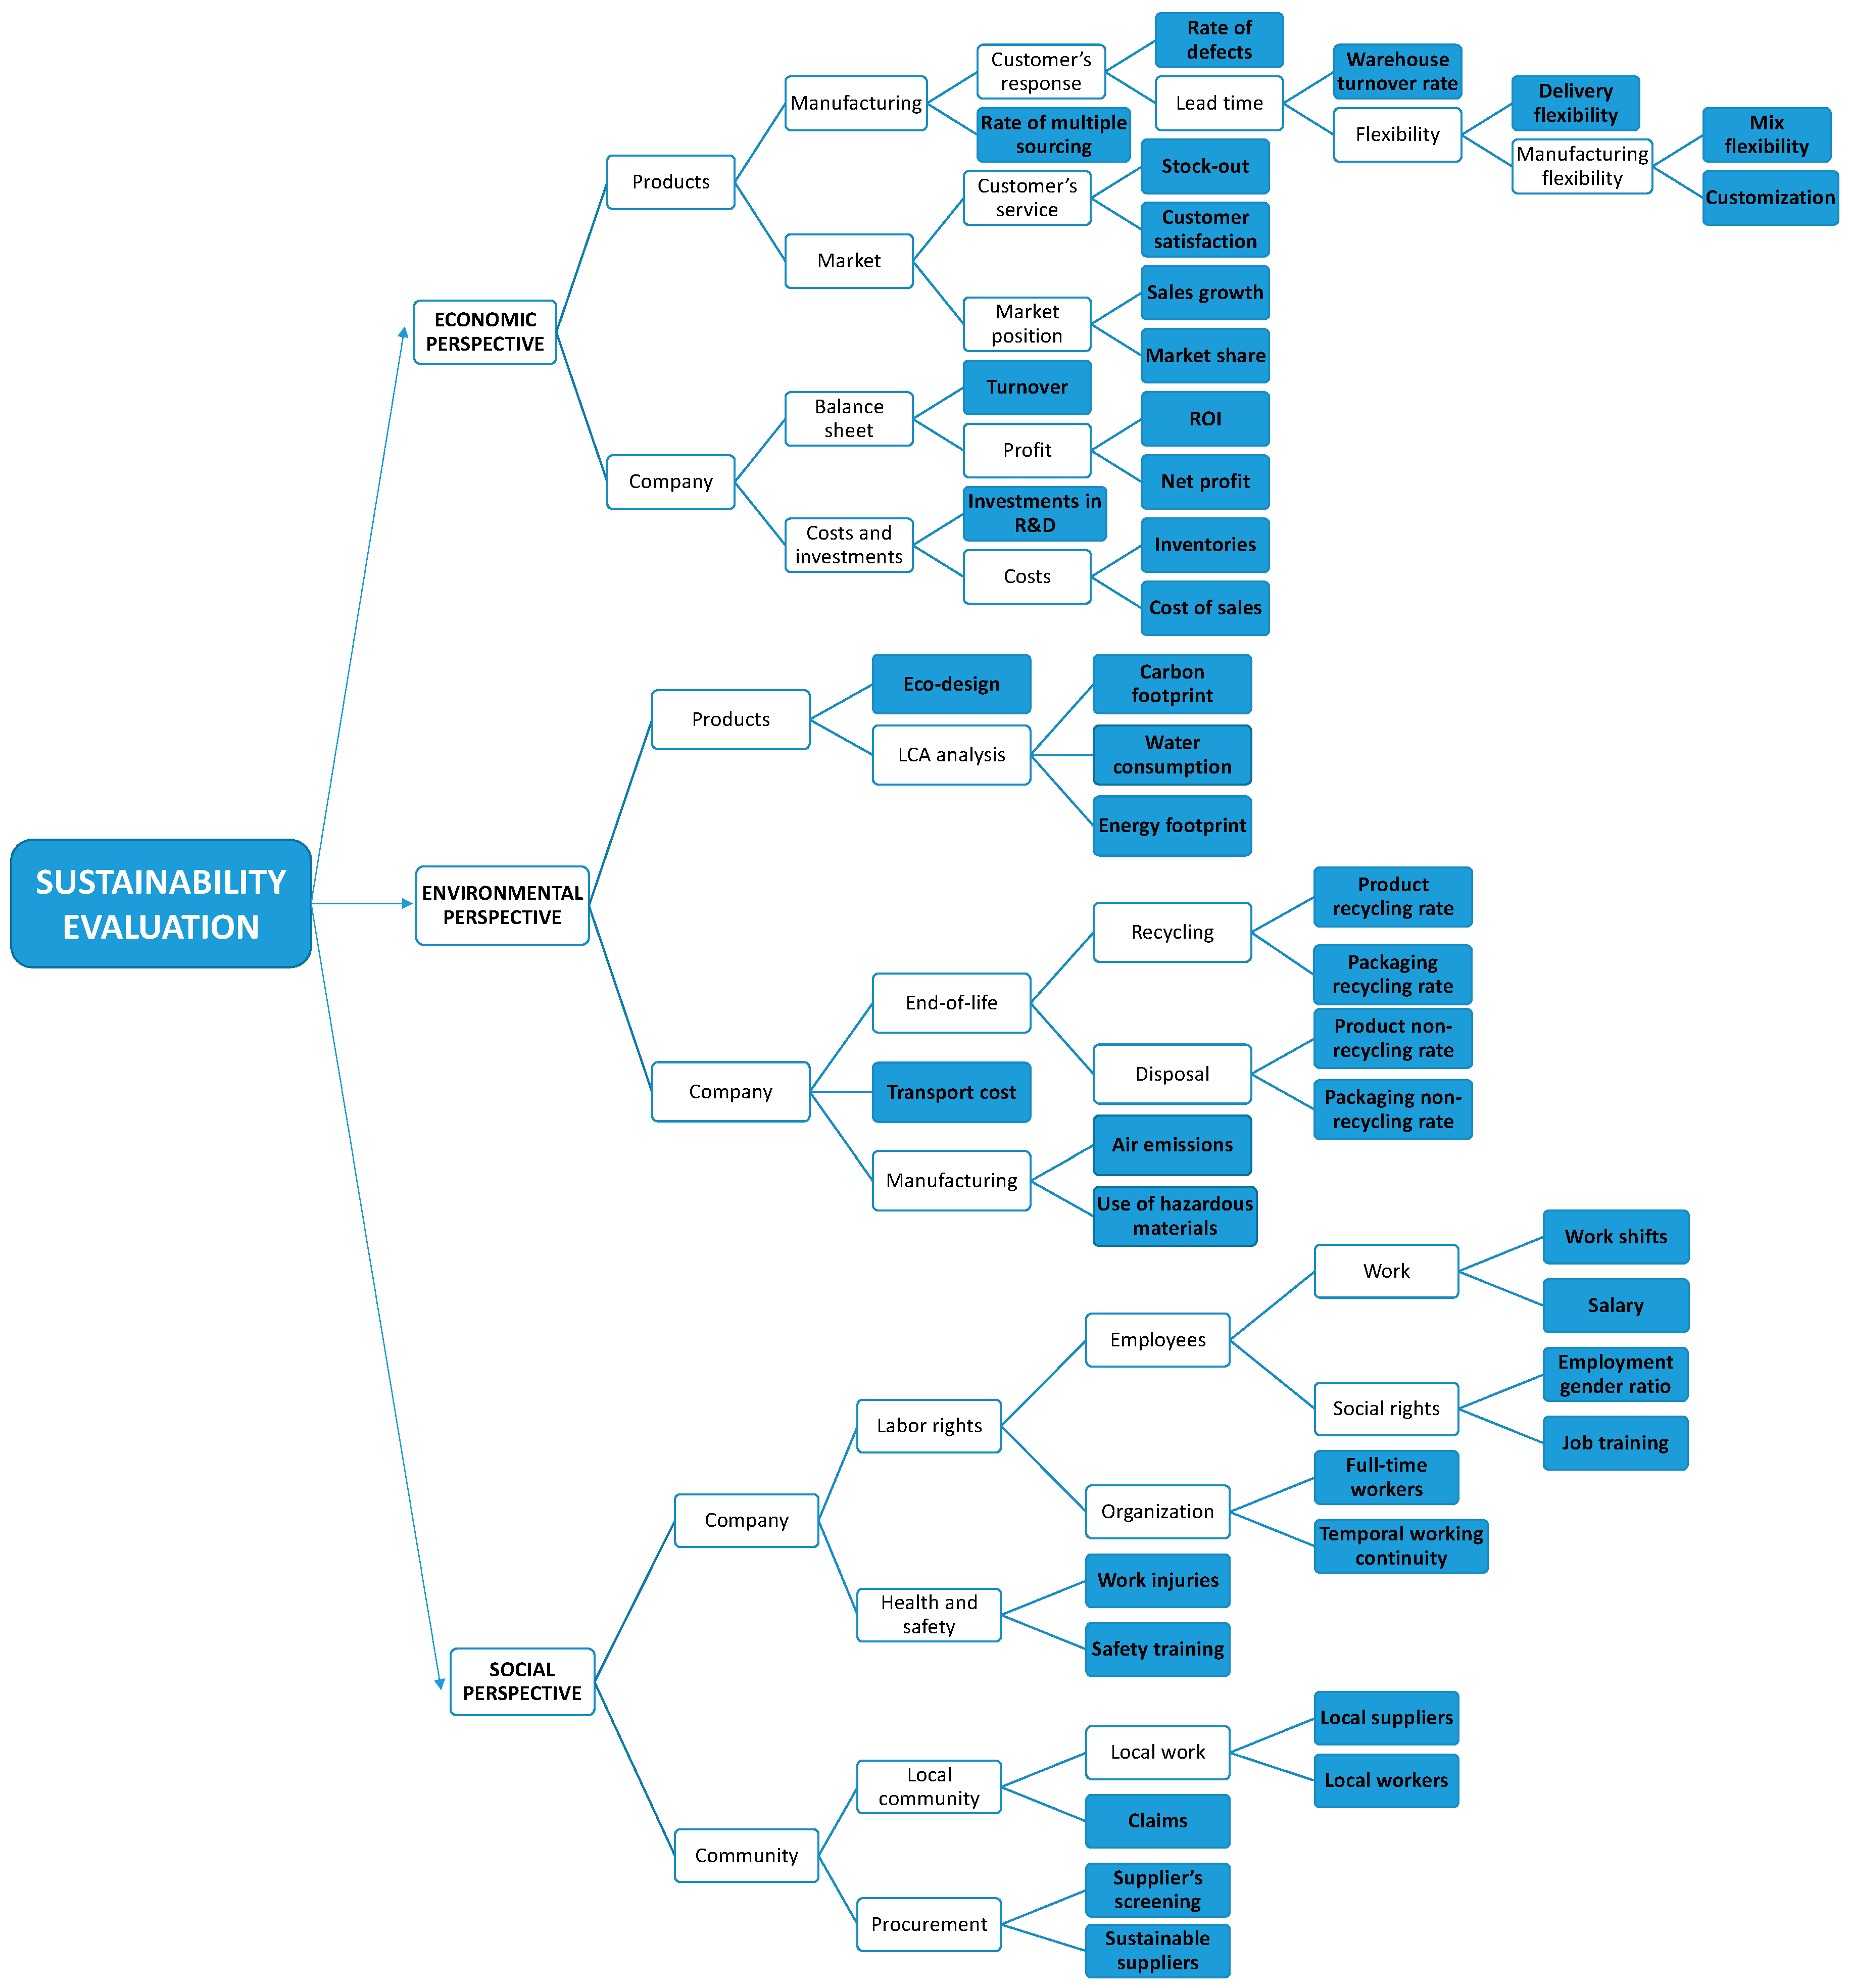
- It develops a monotonic hierarchical fuzzy inference tool that allows assessing the sustainability at the corporate level, taking into account its three key perspectives, i.e., the economic, environmental and social aspects;
- it suggests a set of indexes useful to assess sustainability according to the perspectives listed above, along with their computational procedure;
- it solves some issues related to the definition of the scales and benchmark for the evaluation of the company’s performance against each sustainability index, thus allowing the DM to evaluate how a company is close to or far from a target value;
- it embodies the fuzzy inference model in a Microsoft ExcelTM software ((Microsoft Corporation, Albuquerque, NM, USA) tool that makes the application of the framework straightforward and enables its practical use by DMs.
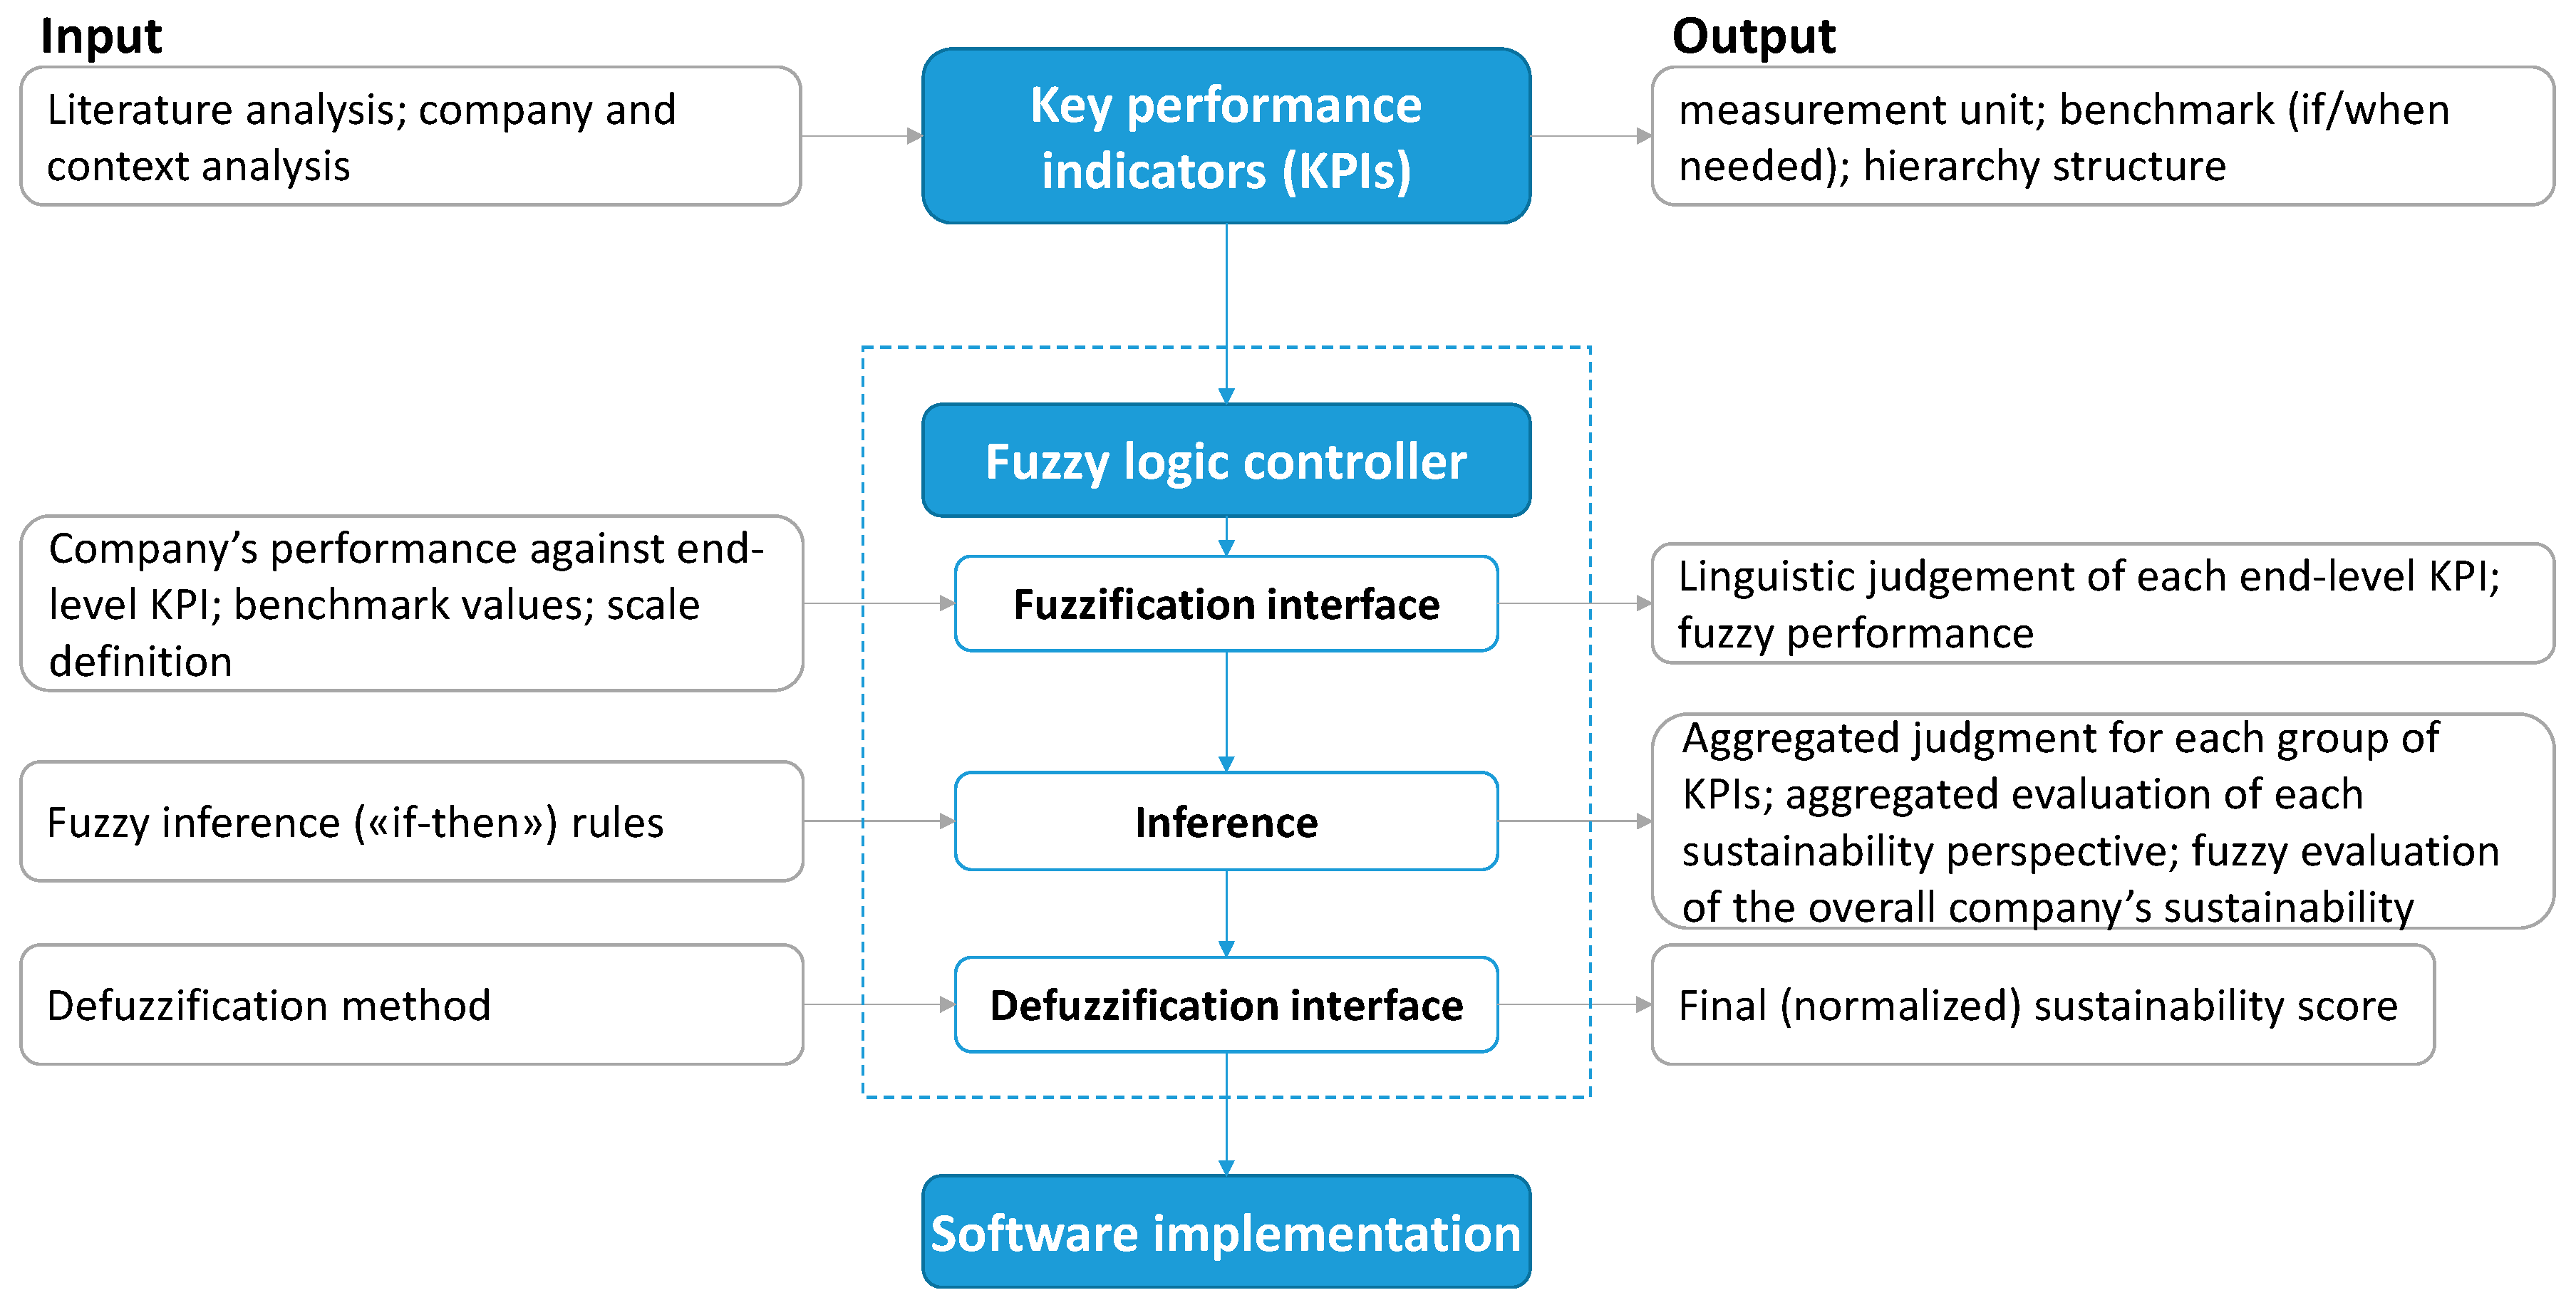
3. The Methodological Approach
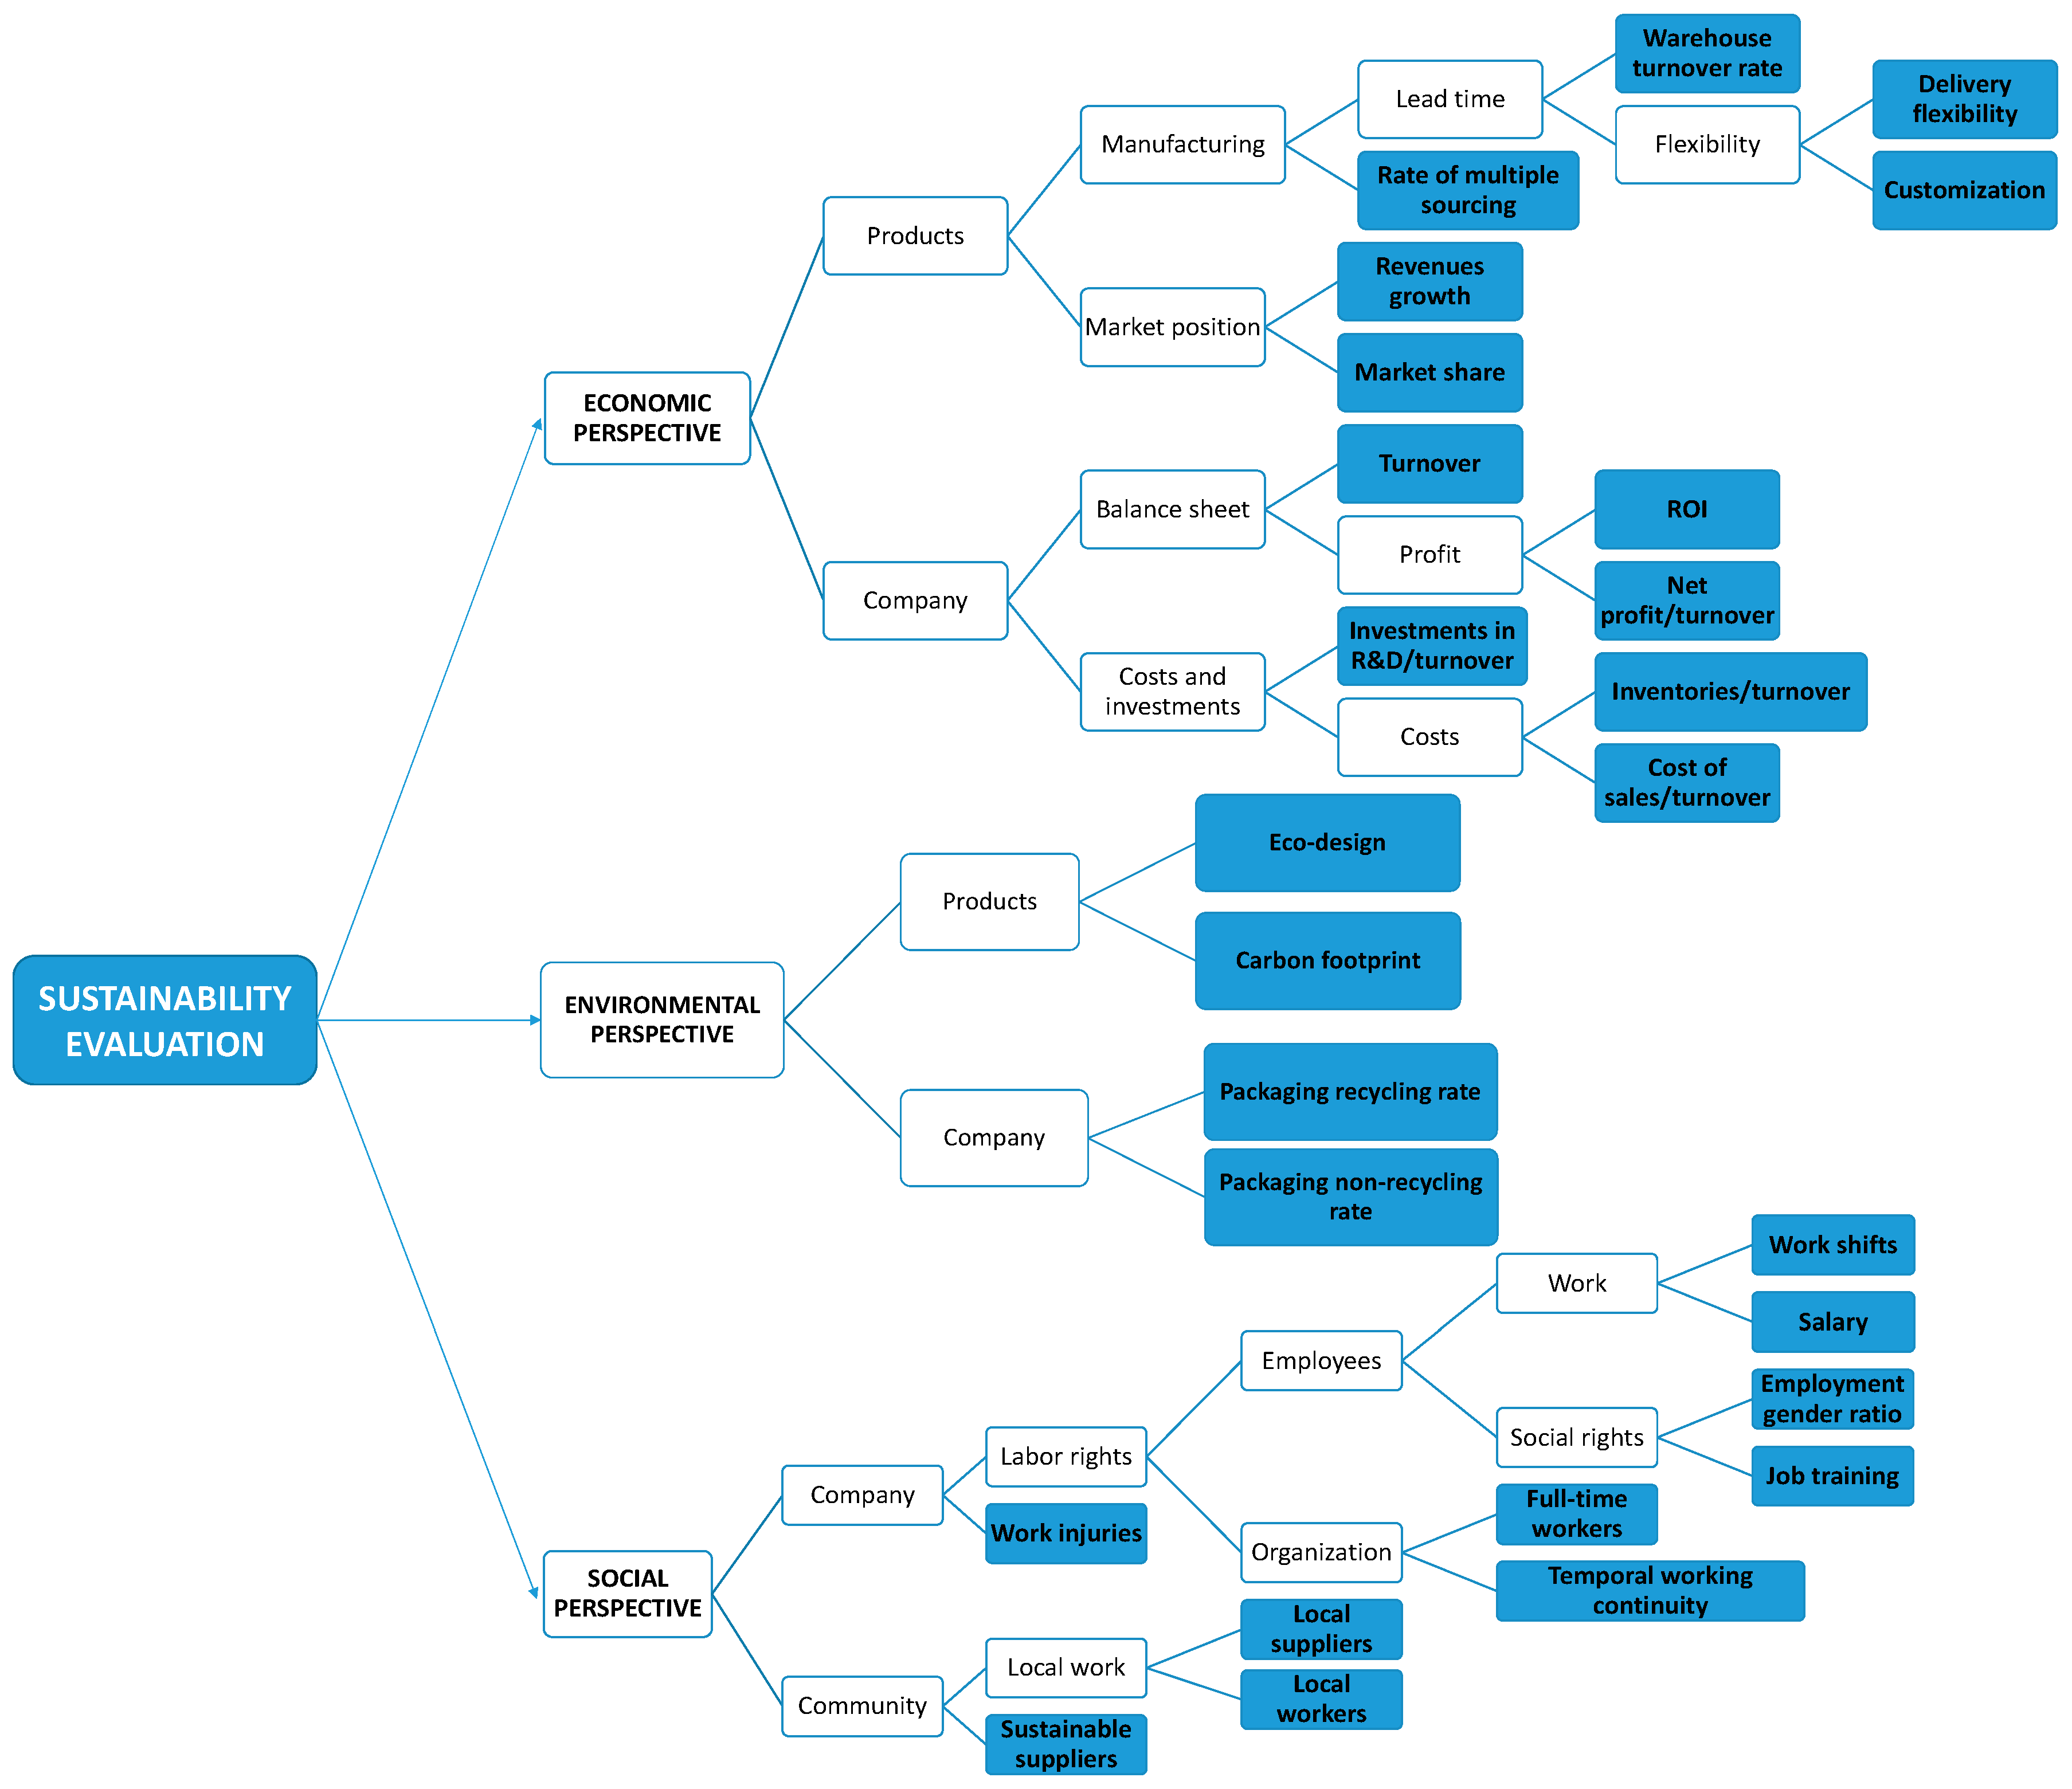
3.1. Key Performance Indicators
- Choosing the appropriate KPIs;
- Identifying a proper measurement unit for each KPI;
- Evaluating the need for a benchmark for each KPI;
- Aggregating the KPIs into a hierarchy structure.
3.2. Design of the Fuzzy Inference Tool
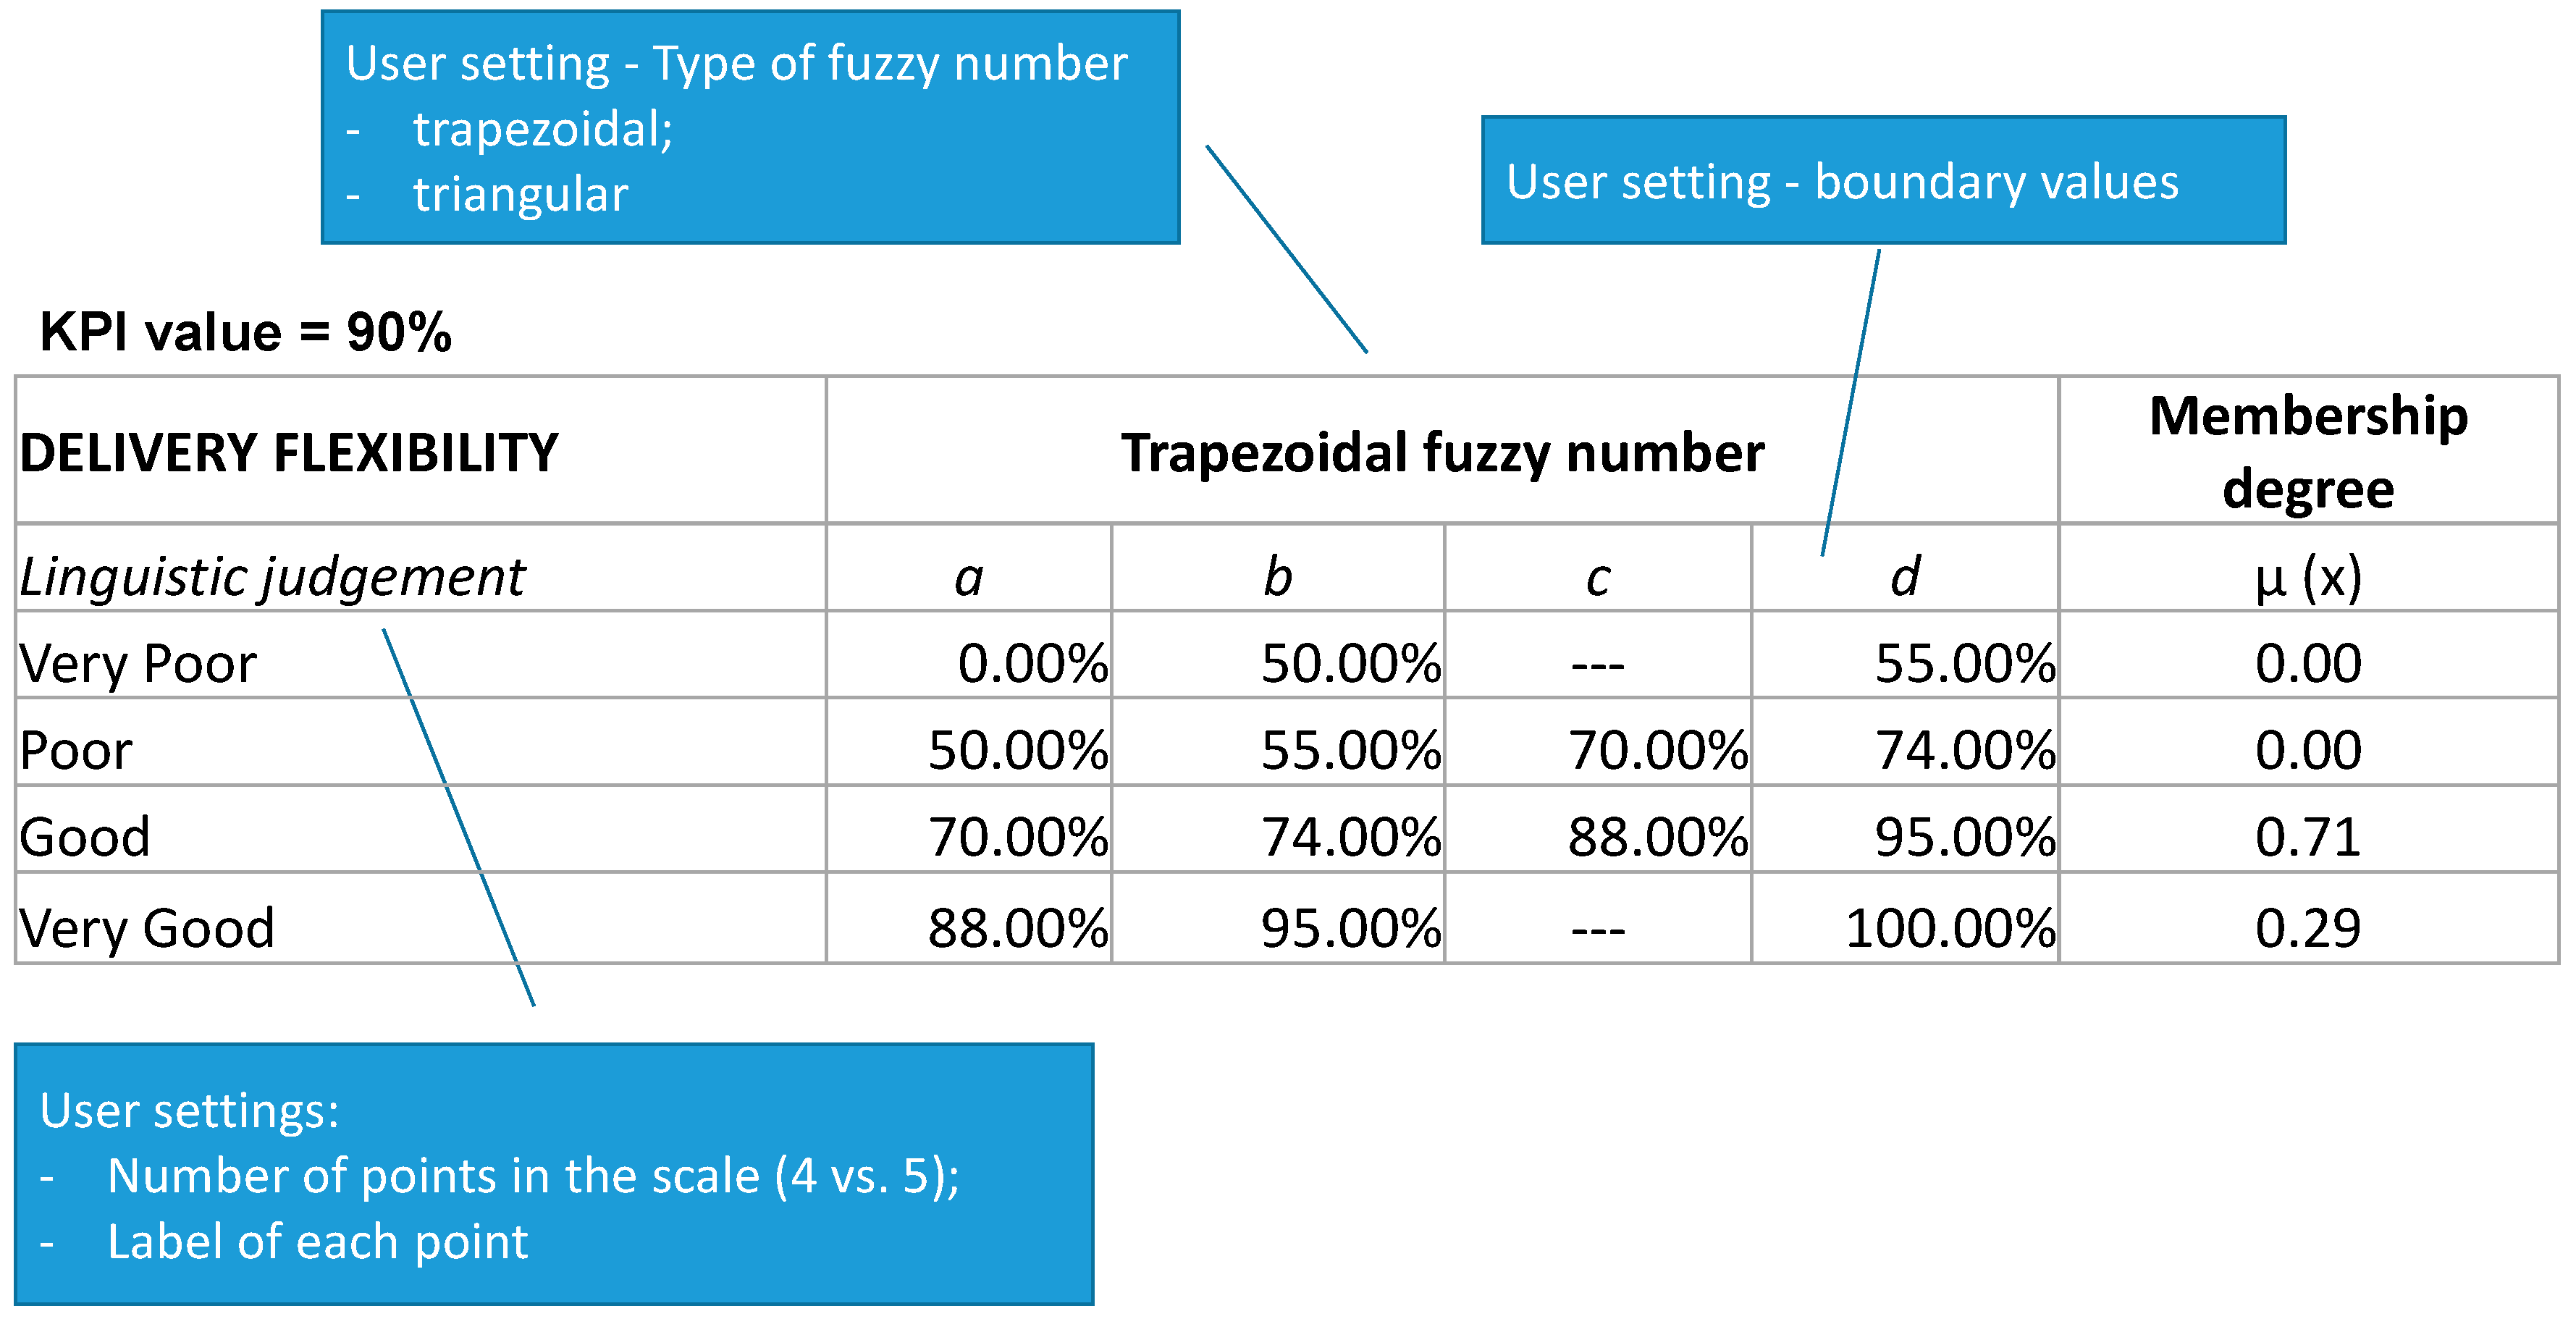
3.2.1. Fuzzification Interface
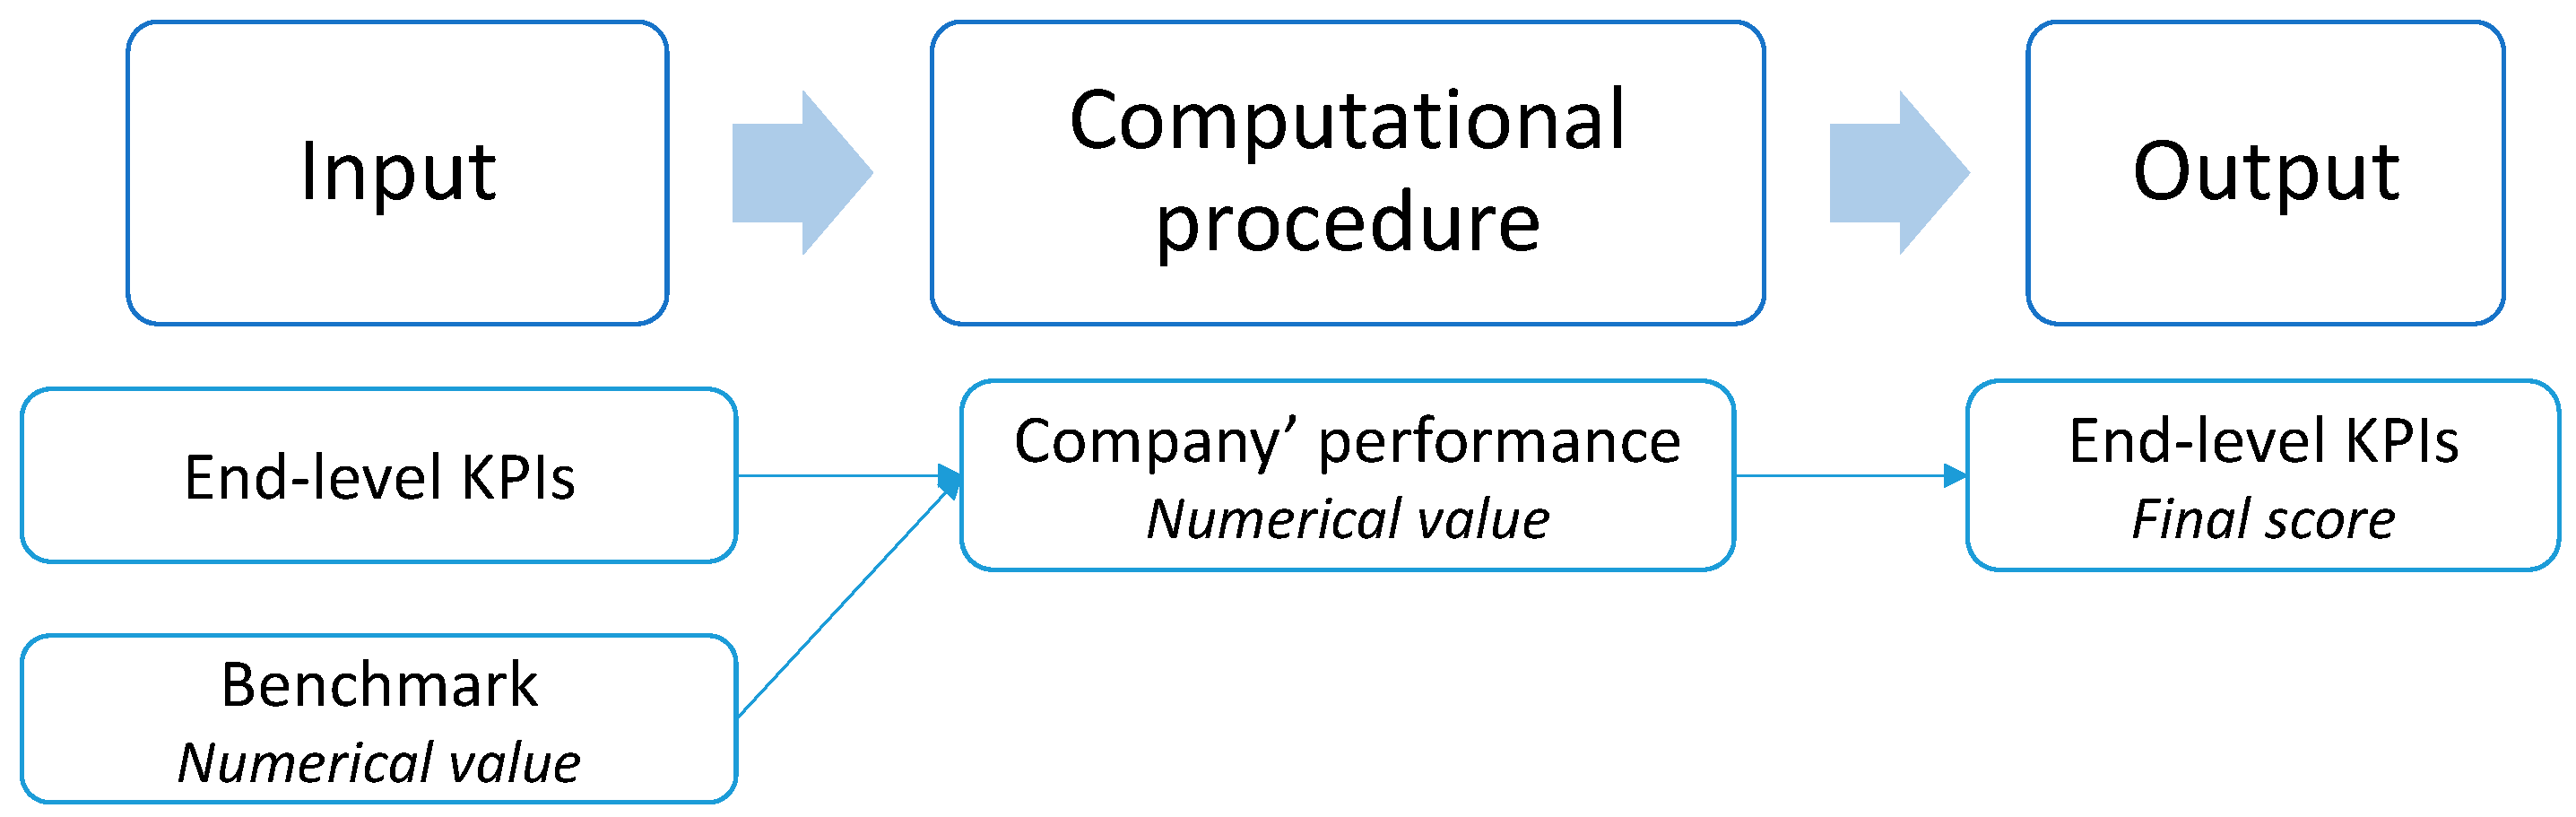
- Measuring the company’s performance against the end-level KPIs;
- Retrieving the benchmark values;
- Setting the fuzzy linguistics scales.
- VP: between 0% and 25%, with if ;
- P: between 20% and 50%, with if ;
- G: between 45% and 75%, with if ;
- VG: between 70% and 100%, with if .
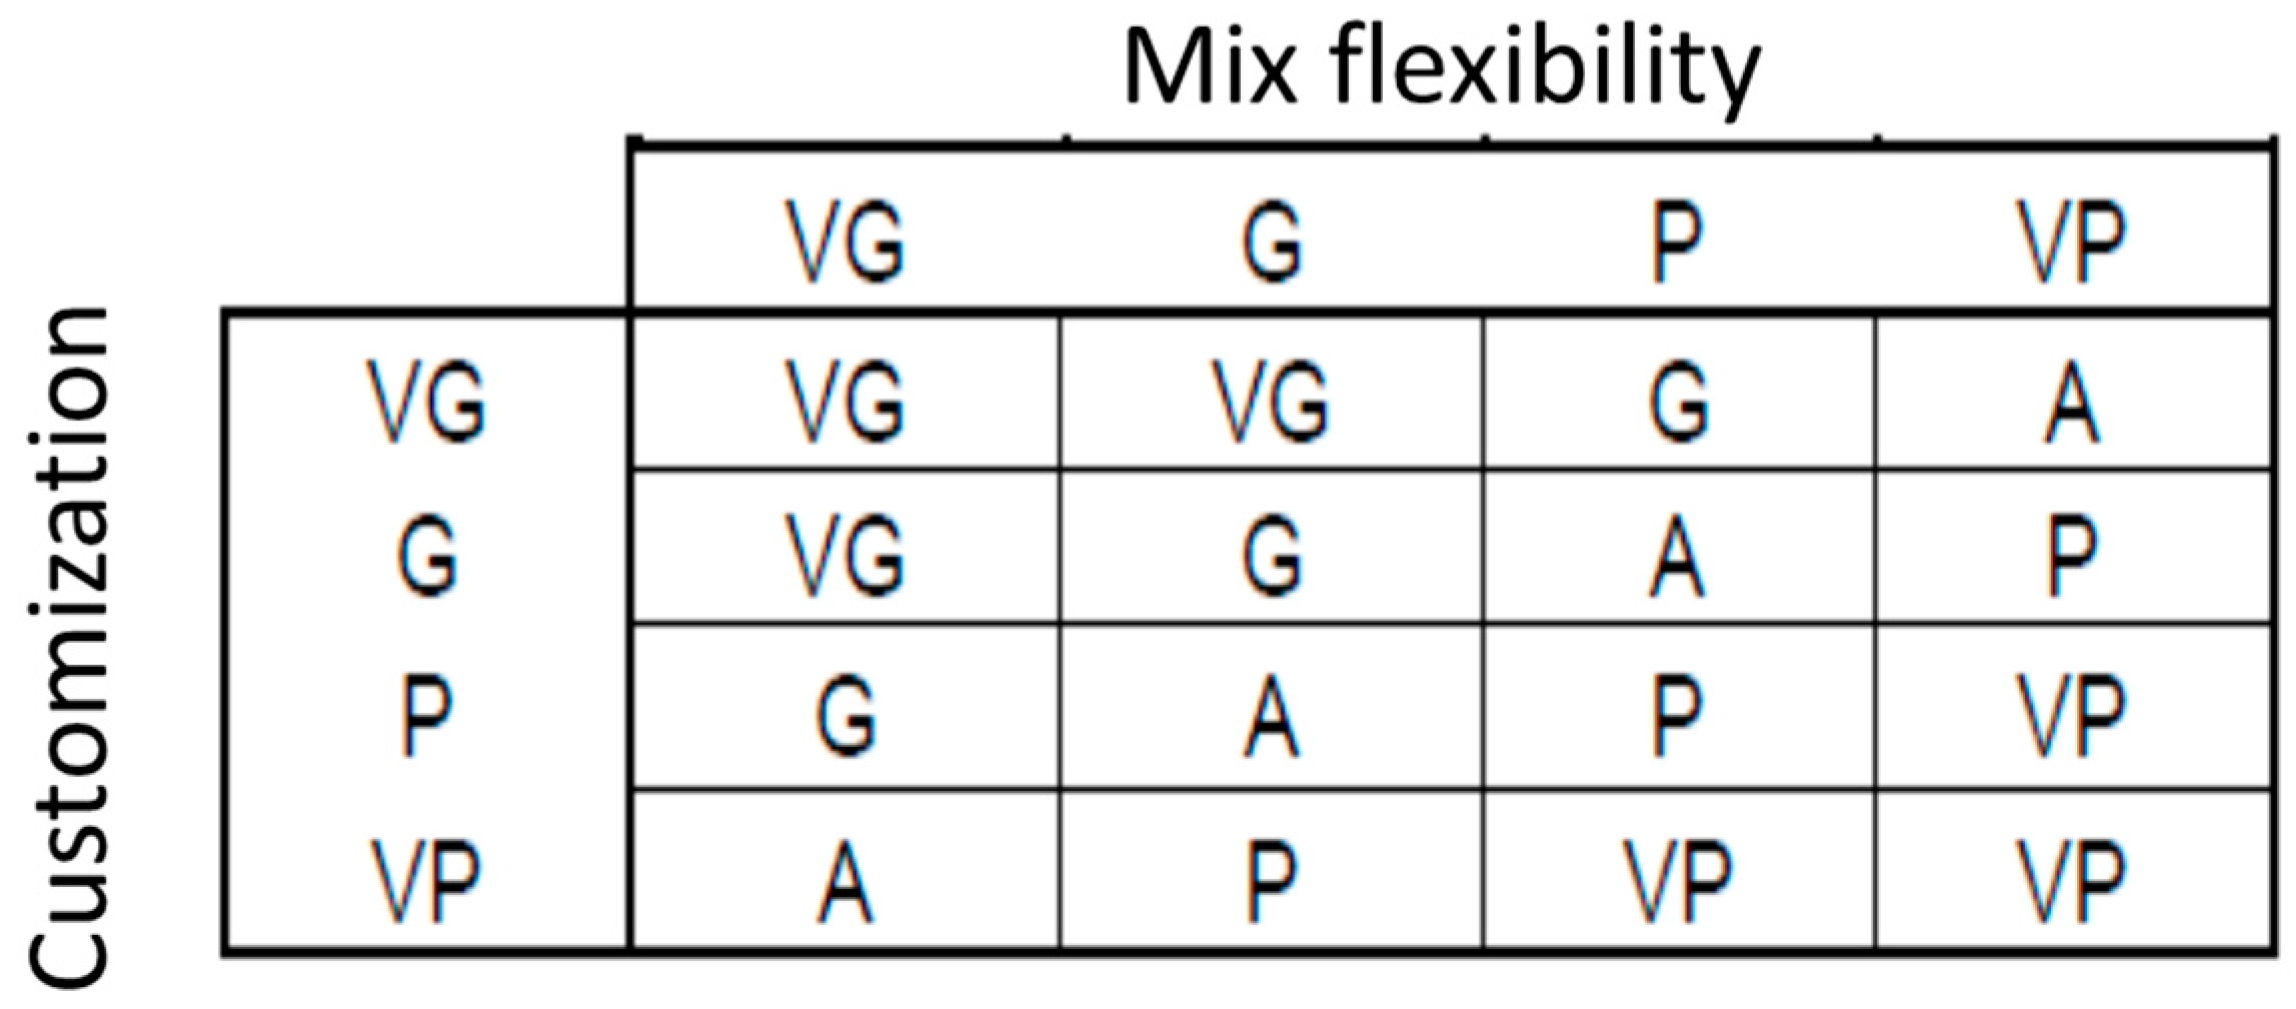
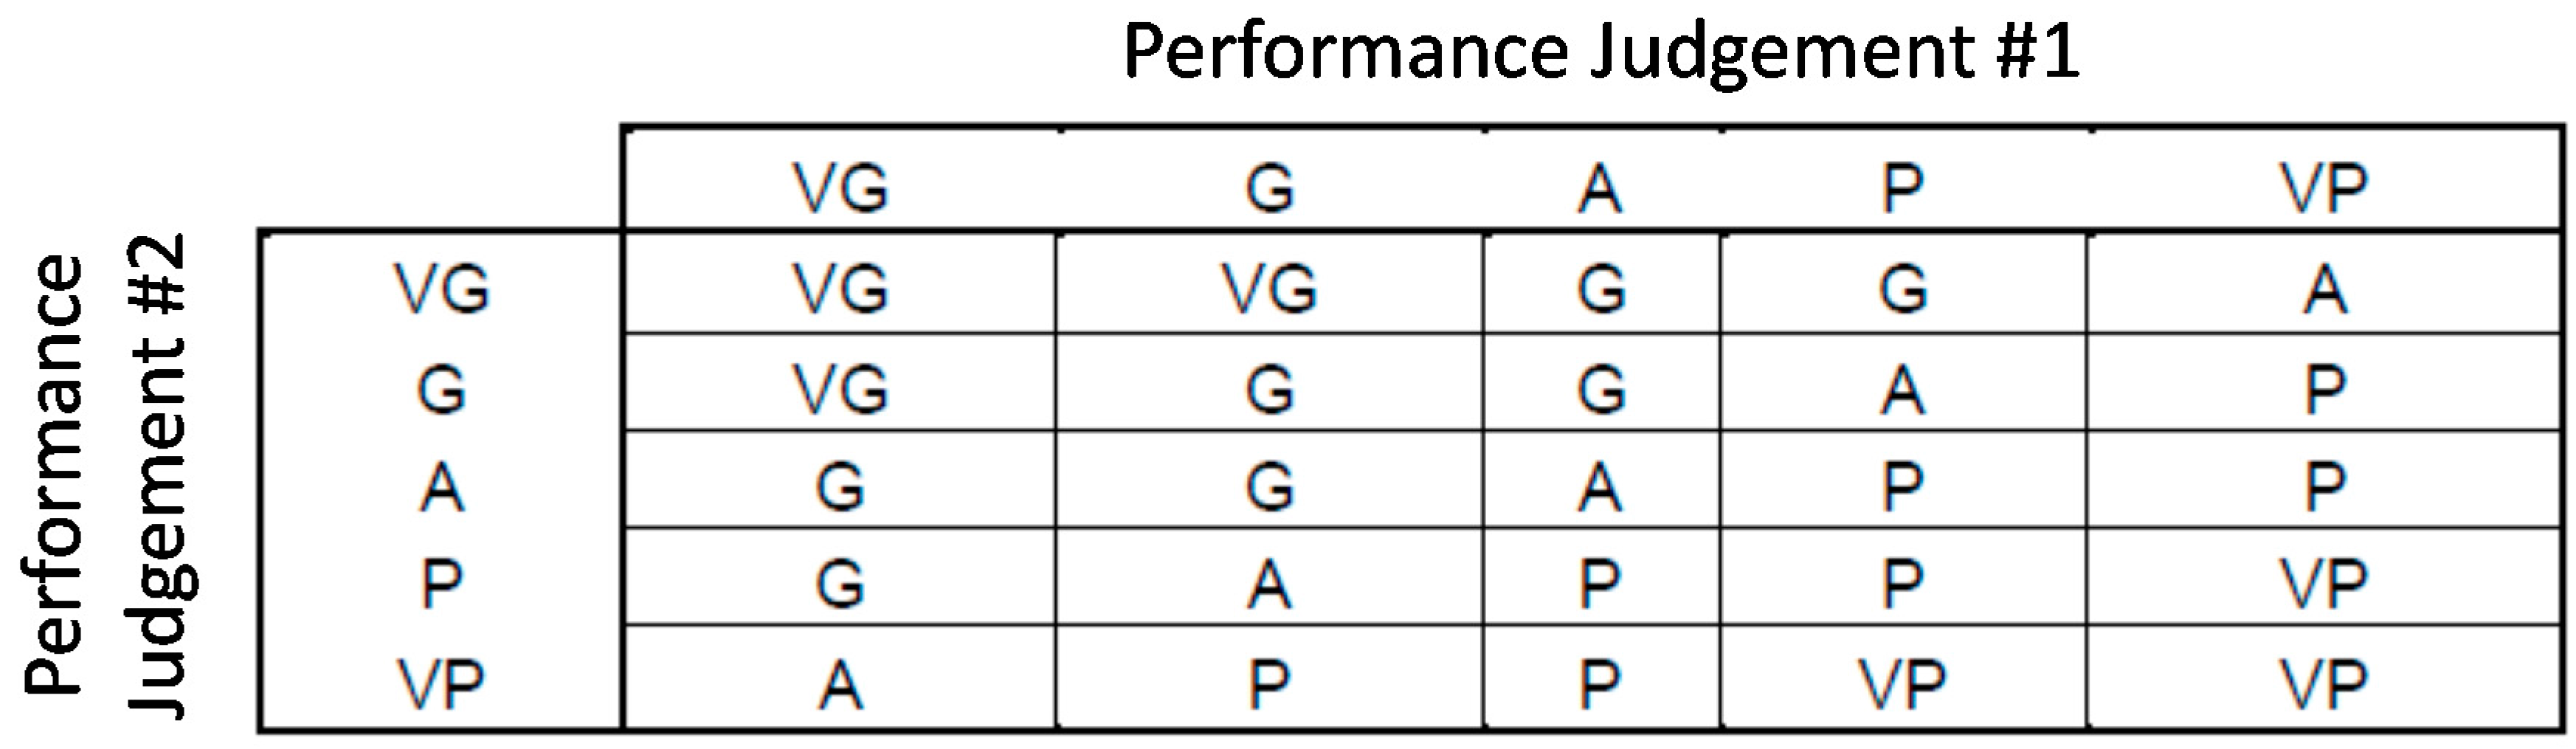
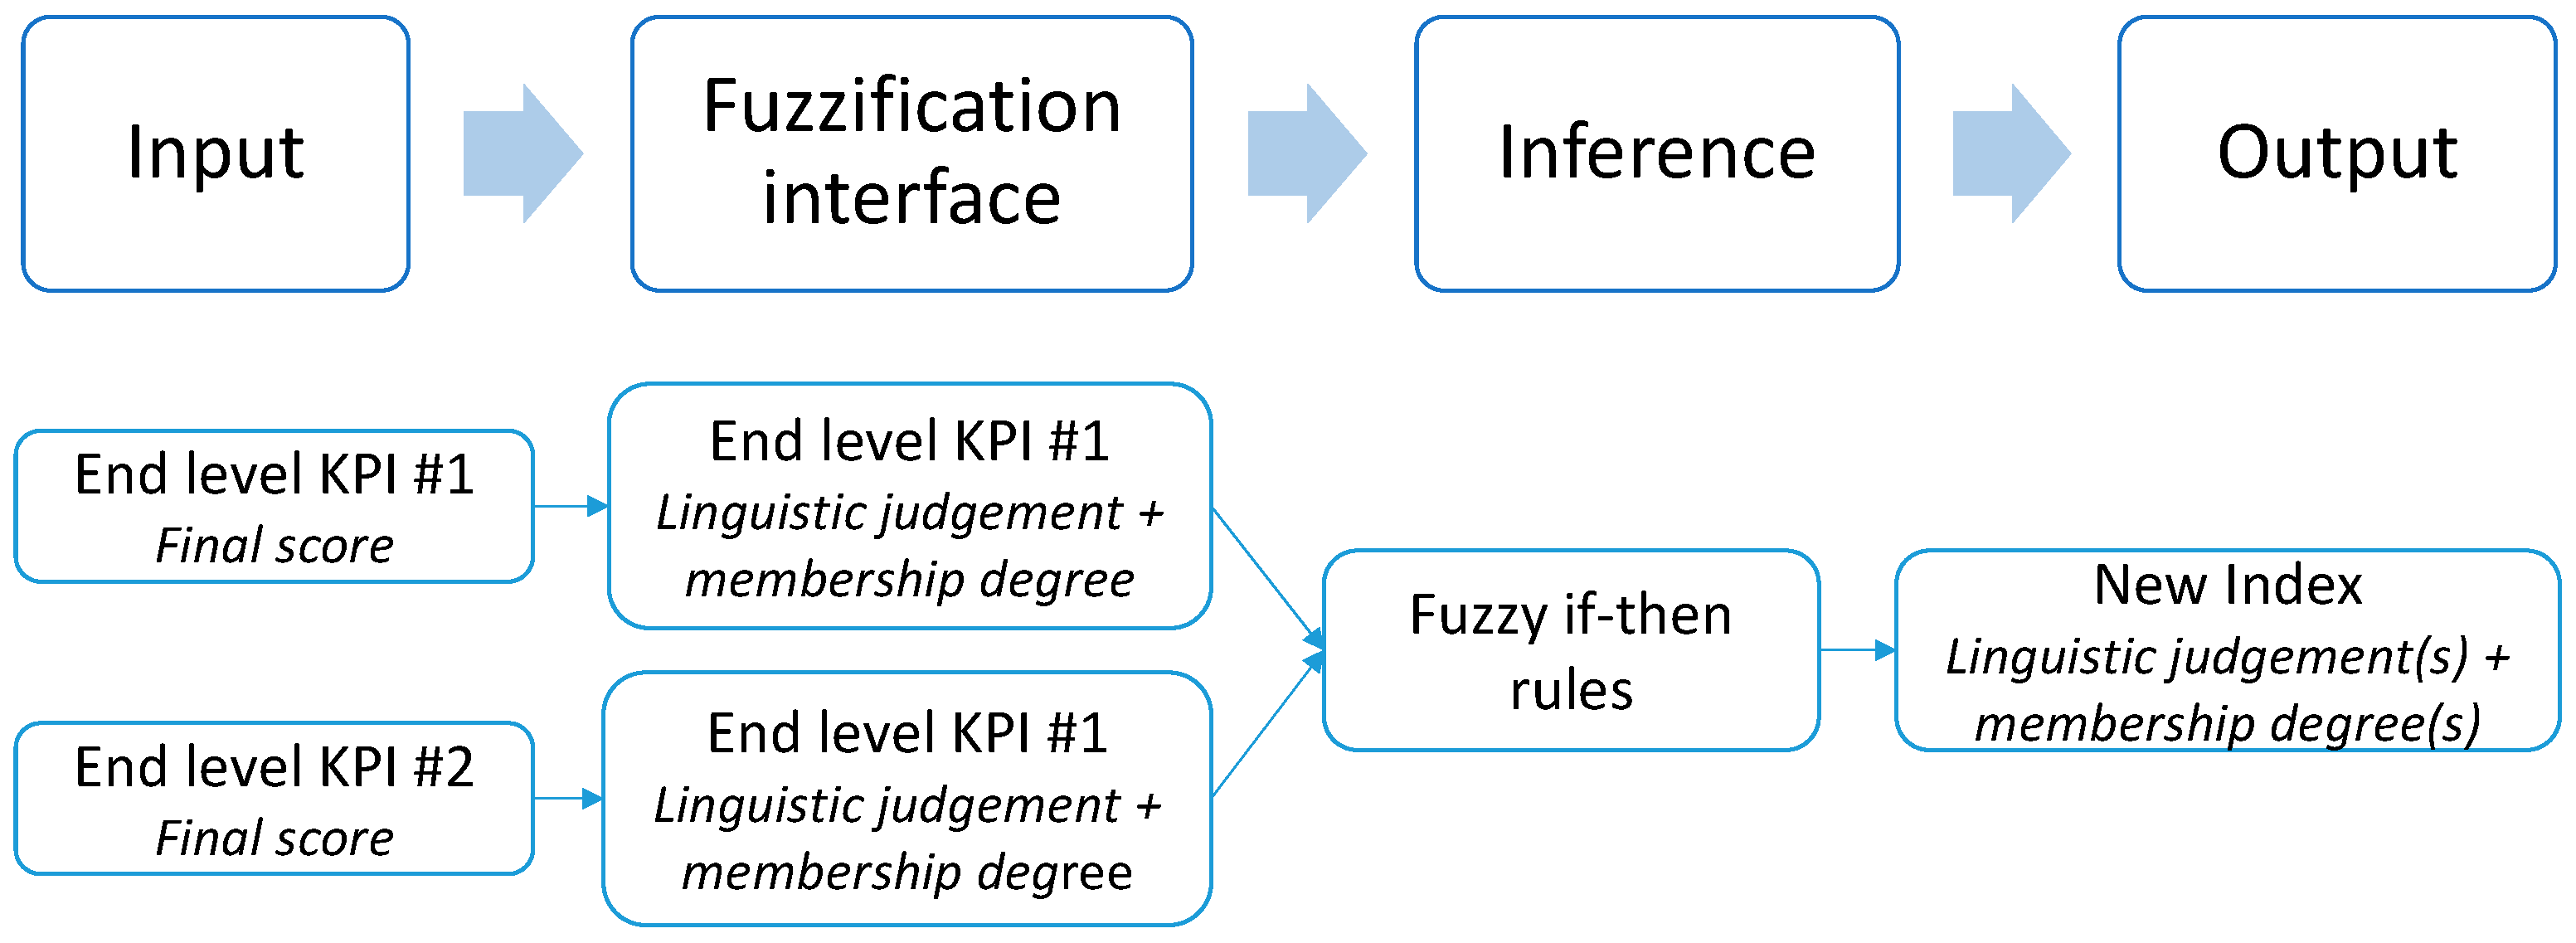
3.2.2. Inference
- Setting the fuzzy inference rules to aggregate the KPIs iteratively;
- Computing the overall sustainability.
- VP: between 0% and 20% with if ;
- P: between 15% and 40% with if ;
- A: between 35% and 60% with if ;
- G: between 55% and 80% with if ;
- VG: between 75% and 100% with if .
- the aggregation of an end-level KPI (4-point scale) with a performance judgement at a higher level of the hierarchy (5-point scale); in this situation, the rules proposed in Figure 4 can still be adopted, provided that the A judgement is neglected for one of the inputs; or
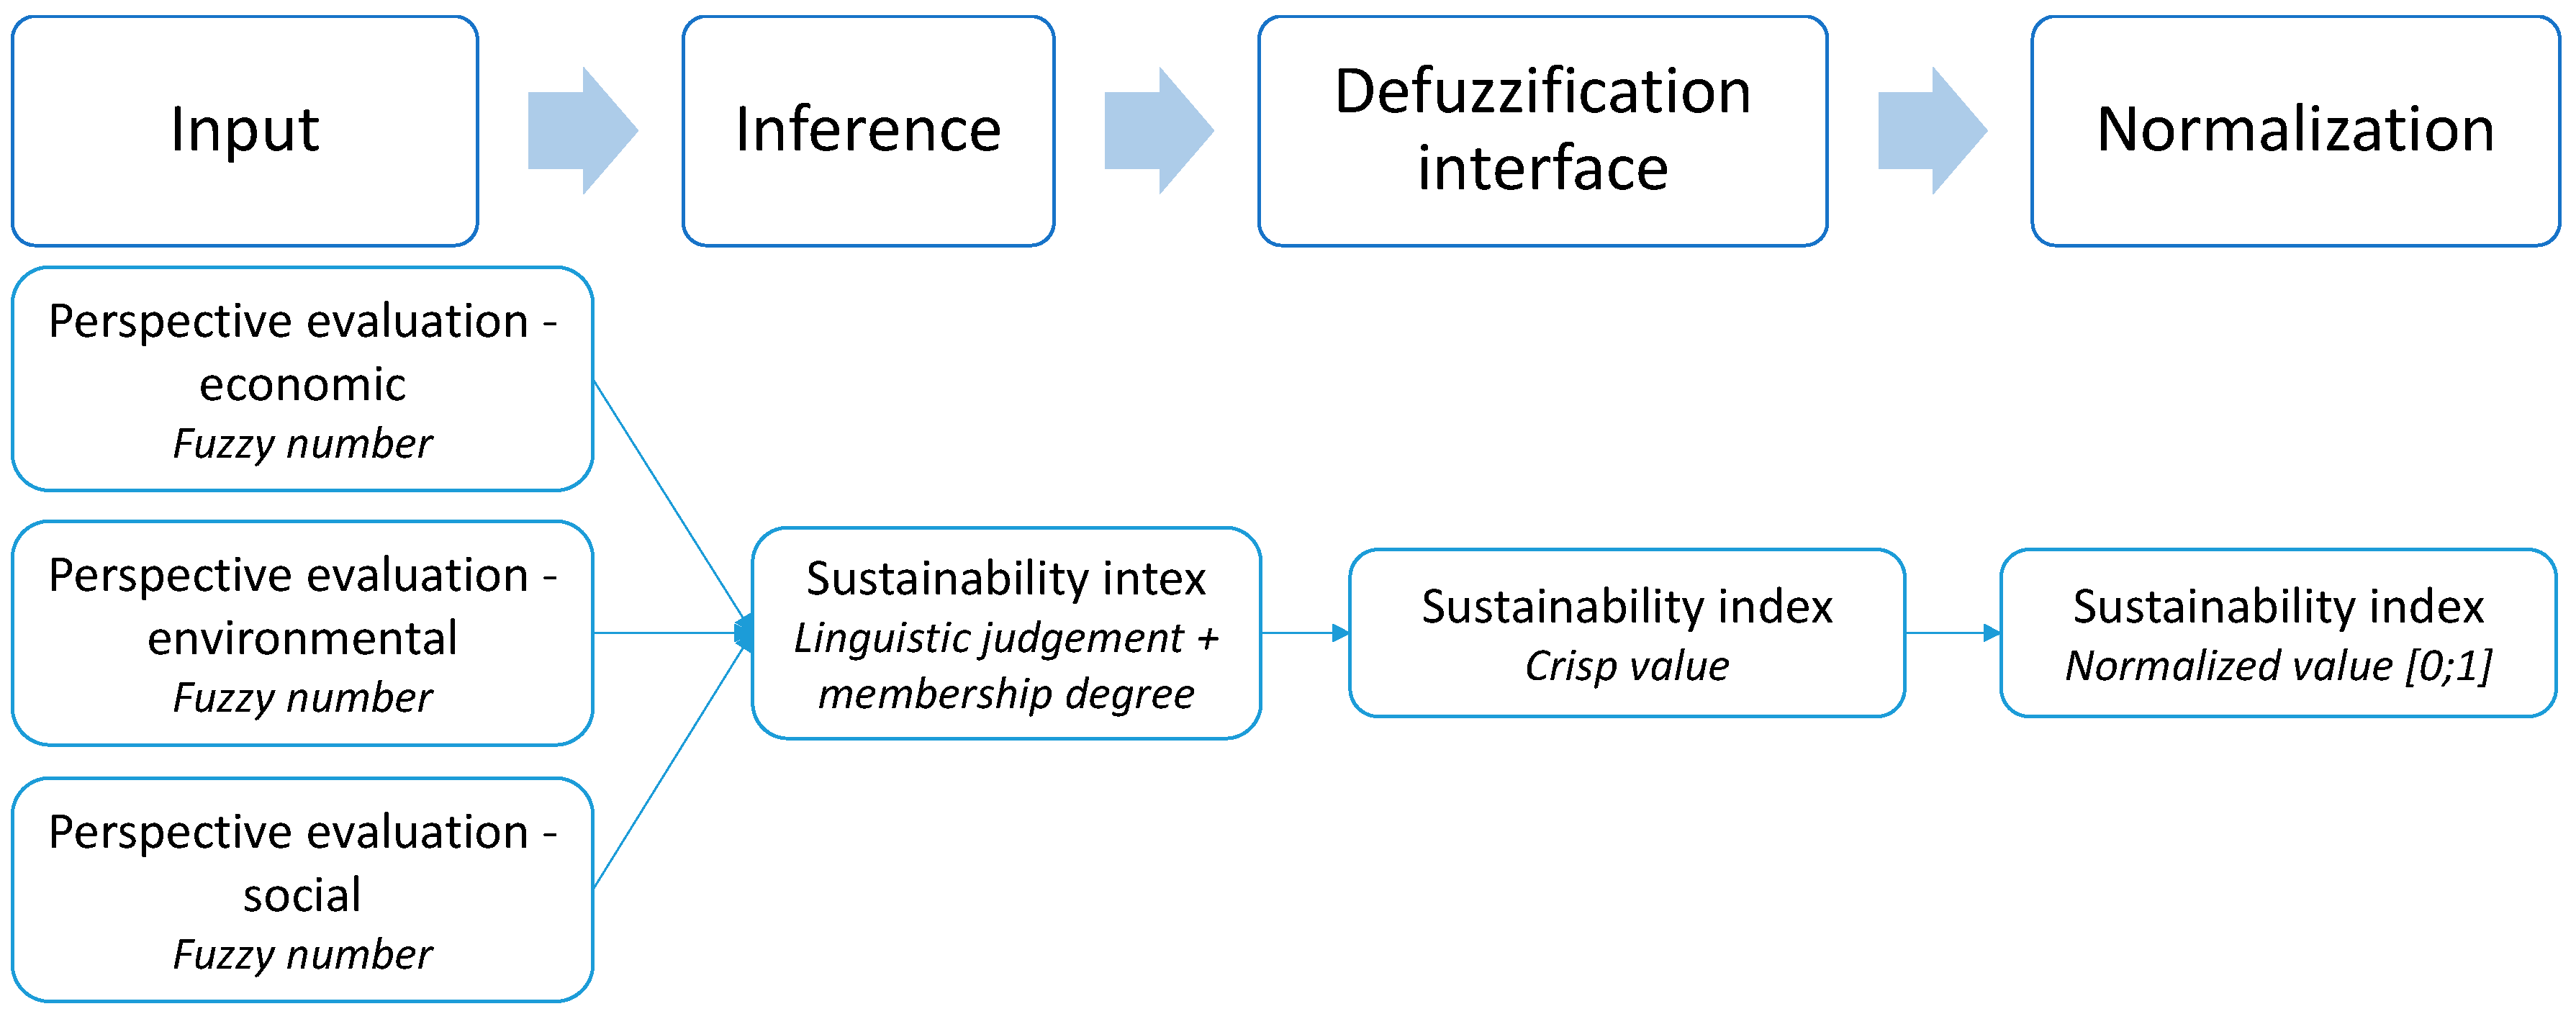
3.2.3. Defuzzification Interface
- choosing the defuzzification method;
- normalizing the final score.
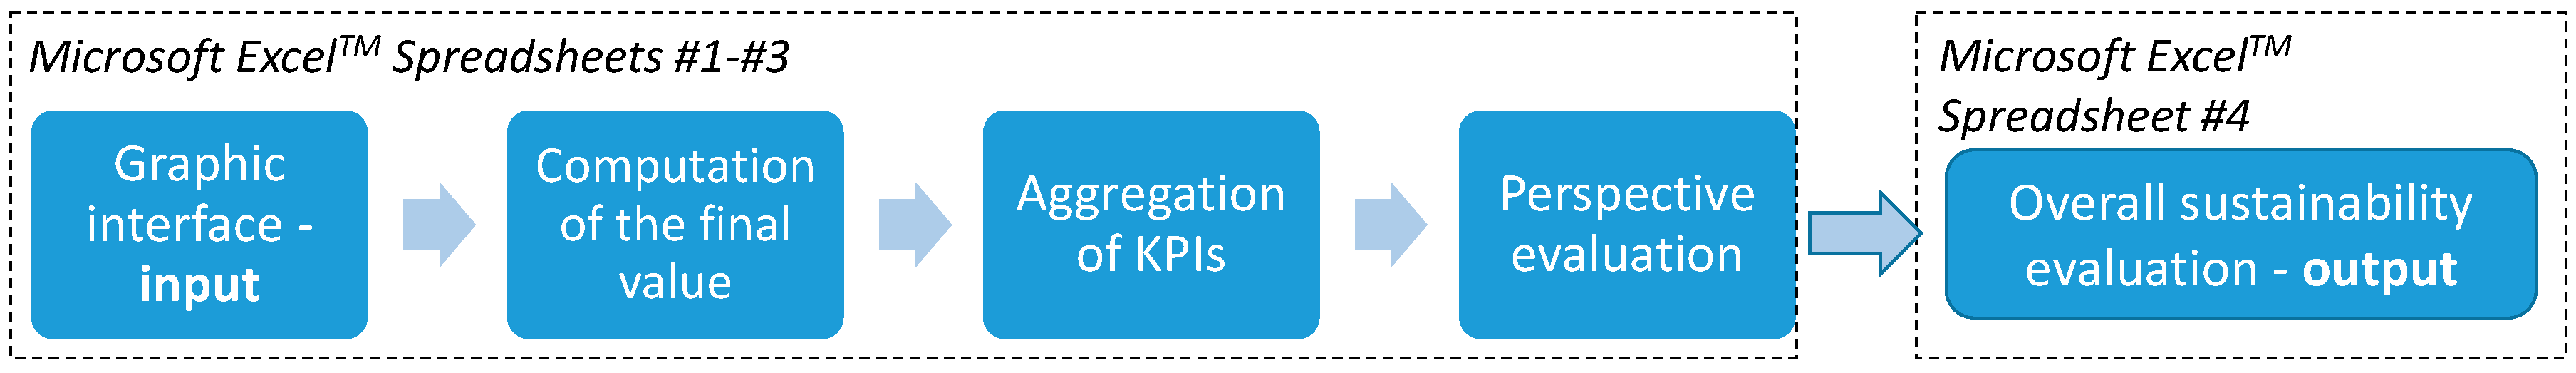
3.3. Software Implementation
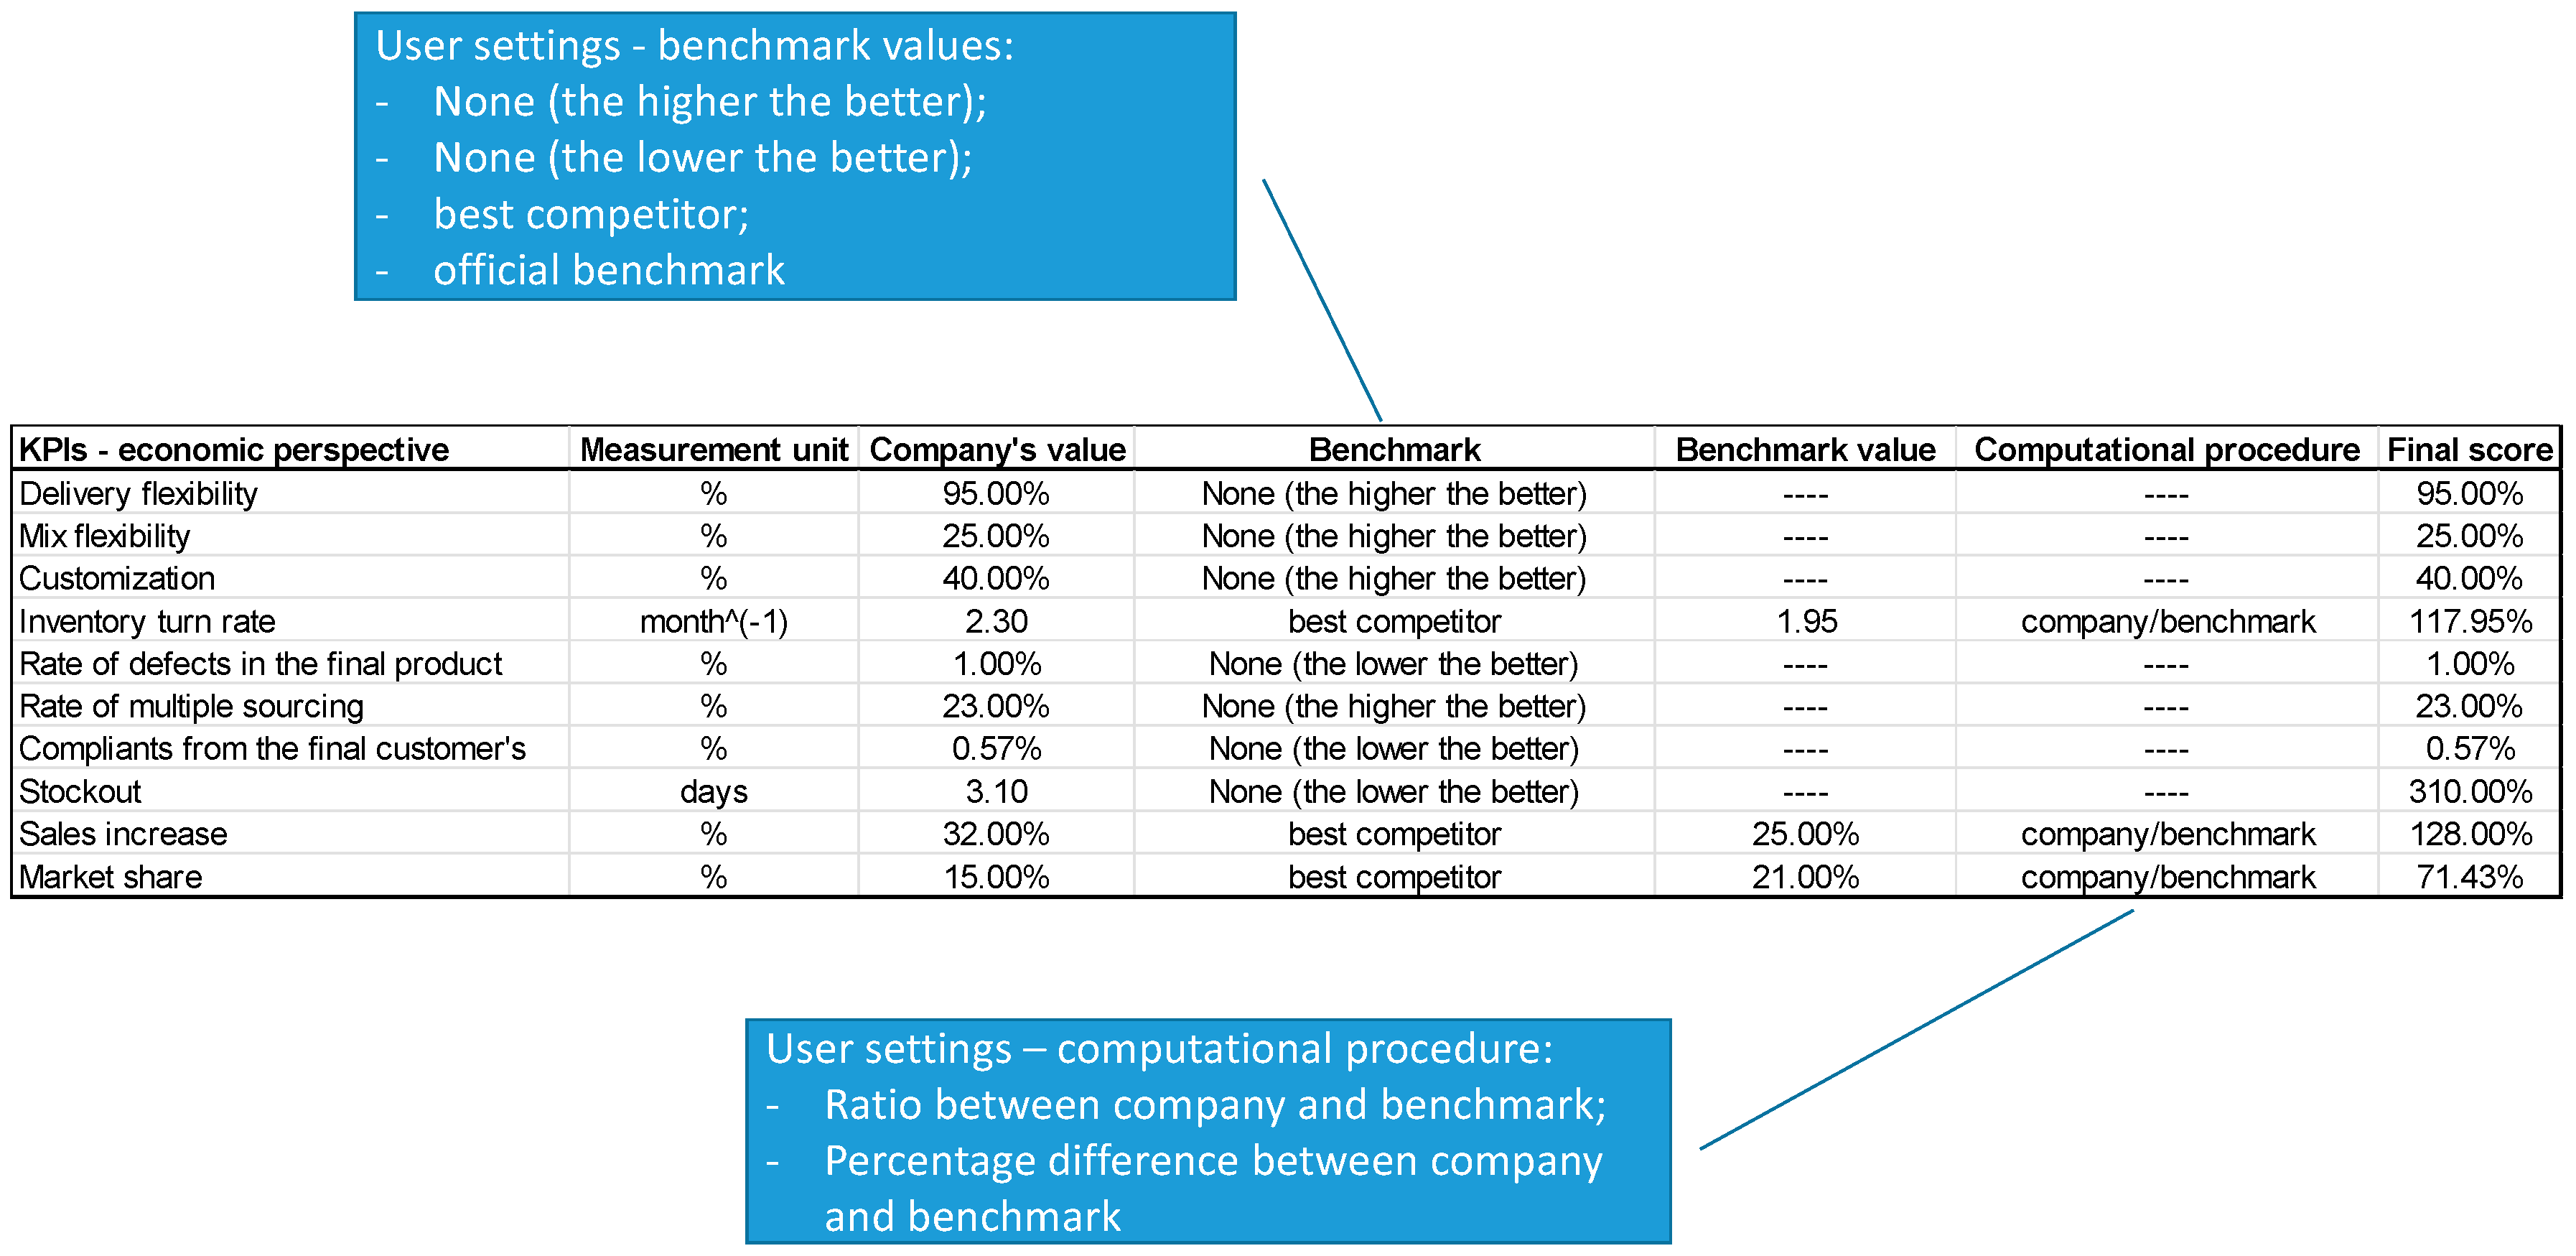
3.3.1. Graphical Interface: Input
- the numerical values reflecting the scores of the company against the KPI, expressed in the appropriate measurement unit;
- the indexes to which the KPI should be aggregated in the hierarchy structure;
- the benchmark values (if/when required) and the way the comparison with the benchmark should be made (e.g., ratio, percentage difference, etc.);
- the type of fuzzy linguistic scales and fuzzy numbers to be used in the fuzzification interface.
3.3.2. Computation of the “Final Score”
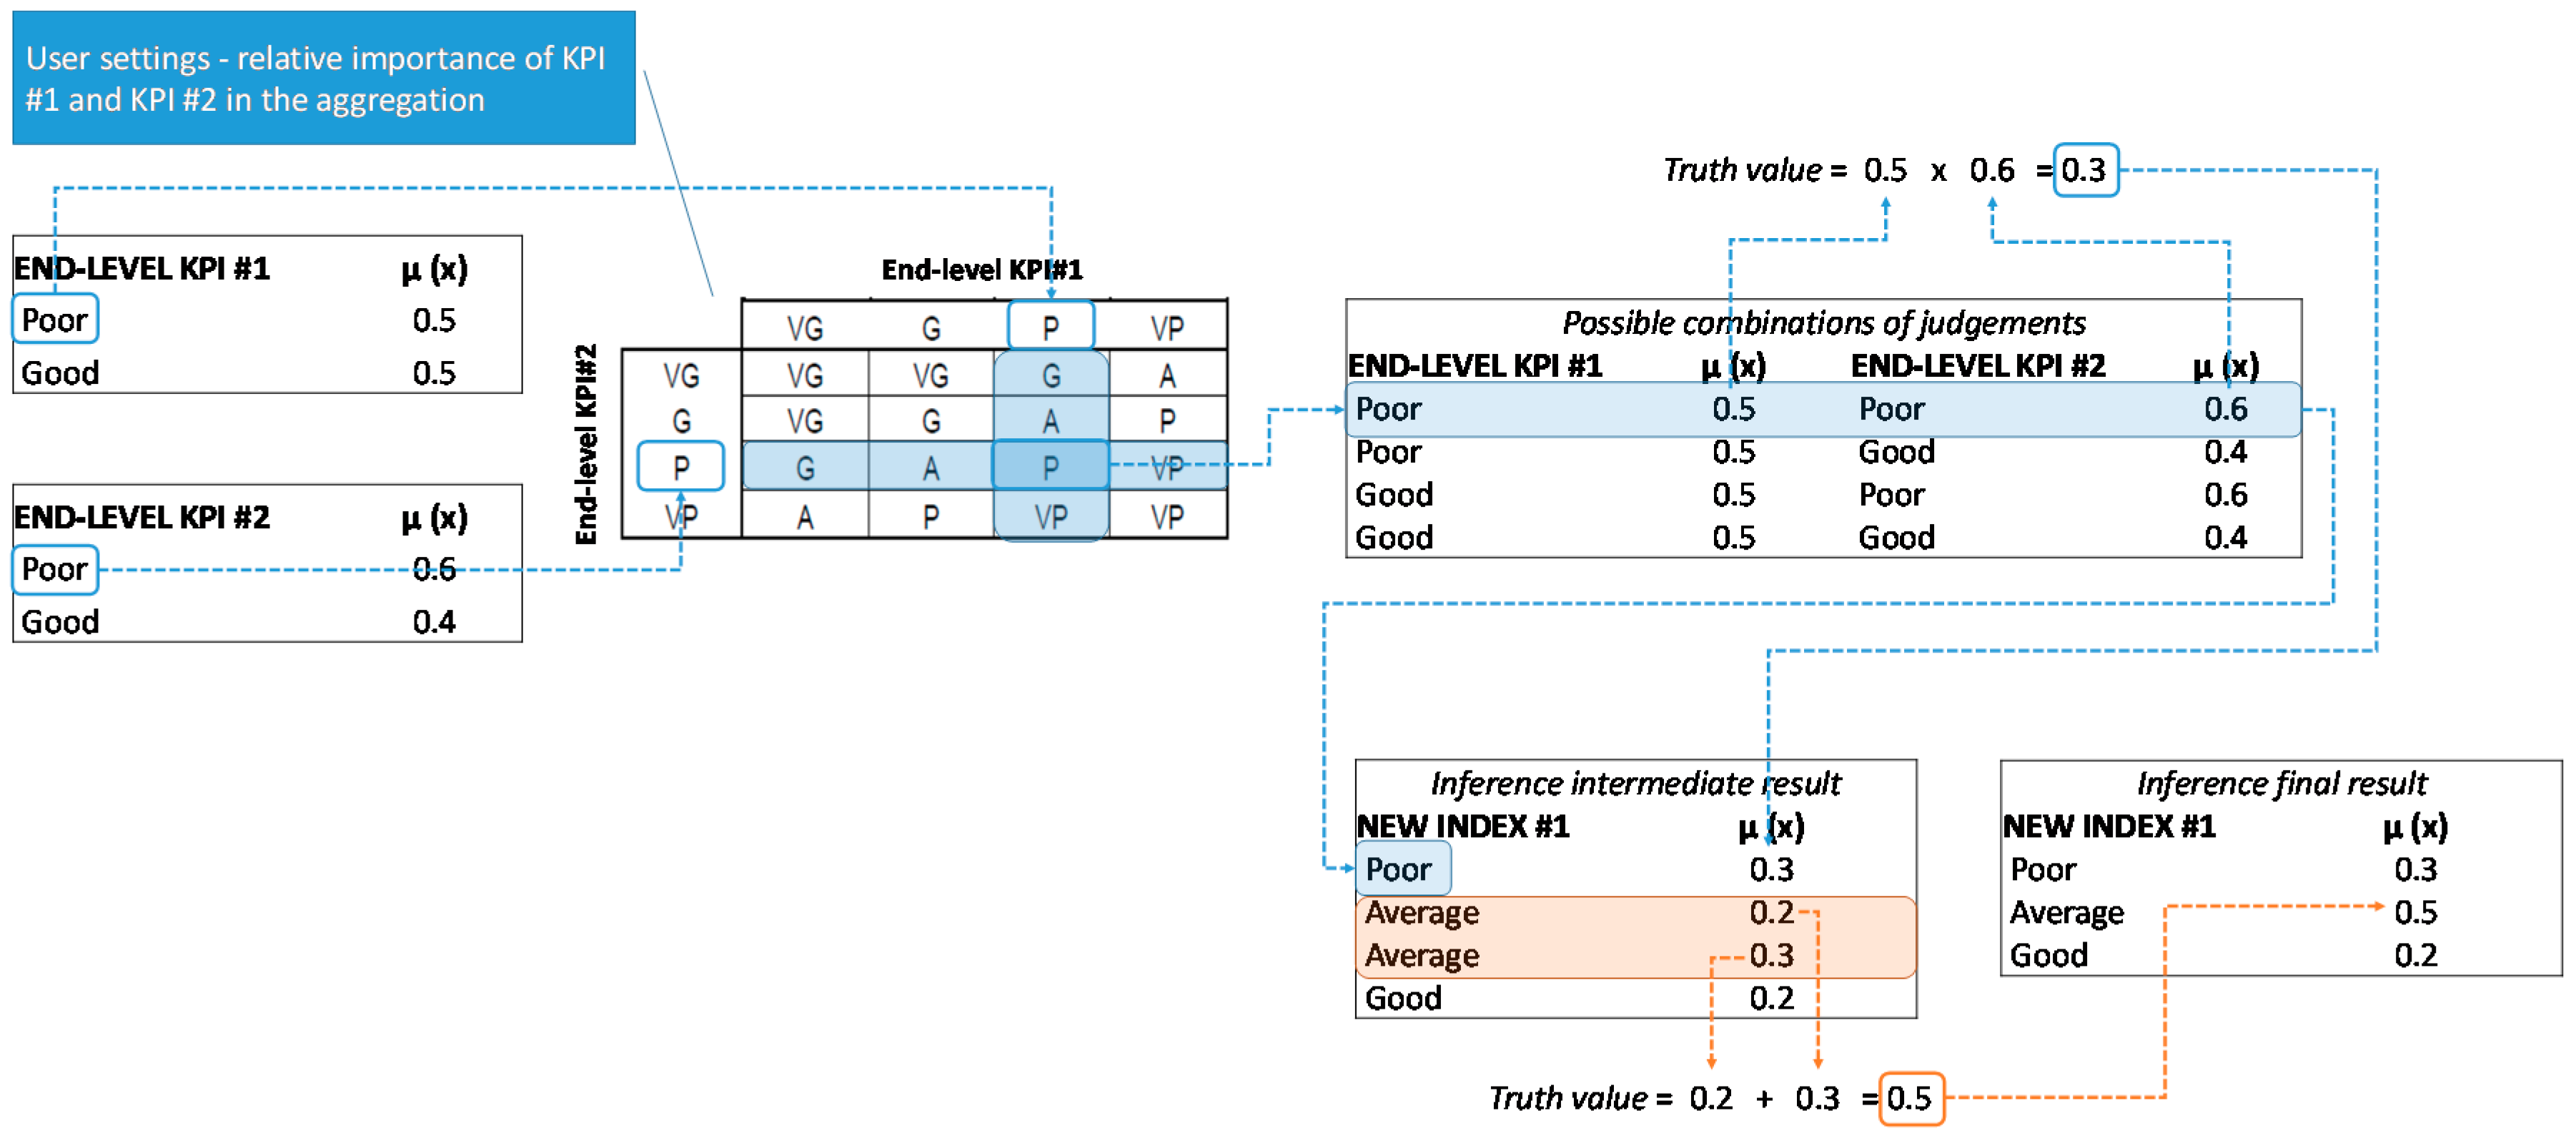
3.3.3. Aggregation of KPIs
- KPI#1 = P with and G with ;
- KPI#2 = P with and G with
3.3.4. Overall Sustainability Evaluation: Output
4. Case Study
4.1. The Company
4.2. Preliminary Model Adaptation and Data Collection
4.2.1. Choice of the KPIs
4.2.2. Identification of the Benchmark Values
4.2.3. Computational Procedure and Scale Definition
- for the three KPIs that do not require a benchmark, the boundaries of the linguistic judgements were set by the authors by interviewing experts in the food machinery industry and by consulting some available references related to the themes of delivery flexibility [80], product customization [81] and multiple sourcing [82] in the ETO environment;
- for the 16 KPIs for which the best competitor is used as the benchmark (e.g., “Sales growth”), the “final score” of Company A against the KPI was computed as the ratio between its performance and that of Company B; with respect to the fuzzy linguistic scale, as a general rule, the performance of Company A was judged as VG if it exceeds the best competitor’s performance by at least 20% and VP if it is more than 20% worse than that of the best competitor; this is the case for a benefit KPI, while the opposite situation holds for a cost KPI (e.g., “Cost of sales”);
- for the seven KPIs for which an official benchmark is available, different computational procedures were used depending on the specific KPI.
- ∘
- For some KPIs, the “final score” of Company A was computed as the ratio between its performance and the official benchmark. This is, for instance, the case for “Salary”, for which the official benchmark (i.e., the collective labor agreement for the mechanical industry) suggests approximately 27,000 €/year as the standard payment for a worker of the mechanical industry. The average salary Company A applies to its workers was directly compared to this value to get the “final score”. The performance of Company A was judged as VG if it exceeds the benchmark by at least 20% and VP if it is more than 20% worse than the benchmark. Similar considerations were applied to “Job training”, as well as to “Carbon footprint” and “Work injury”, although for these latter KPIs, a reversed scale was used (as they are cost attributes);
- ∘
- For “Work shift”, the official benchmark (i.e., again the collective labor agreement for the mechanical industry) suggests 40 hours/week as the standard working time in the mechanical industry. To derive the “final score”, we computed the absolute percentage deviation between the number of hours worked by Company A’s employees and the benchmark value, i.e., . The rationale for this computation is that the company should be fully aligned with the benchmark to be considered as G or VG, while significant deviations, both positive (excessive working time) and negative (too limited working time) from the target should be considered as P or VP. The scale has been defined to capture this situation;
- ∘
- For other KPIs, a scale compliant with the guidelines of the official benchmark was defined. This is, for instance, the case of “Employment gender ratio”, for which the benchmark is the average percentage of women at work in Italy as computed by the Italian Institute of Statistics (ISTAT) [83]. ISTAT [83] estimates an average of 41% of women at work, which was used as the benchmark. Following the same general rule adopted for other KPIs, the performance of Company A was judged as VP if it is more than 20% worse (i.e., <33%) than the benchmark and VG if it exceeds the benchmark by at least 20% (i.e., >48%). Similar considerations were made for “Full-time workers”.
4.2.4. Hierarchy Structure of KPIs
4.2.5. Fuzzy If-Then Rules
4.3. Results and Discussion
5. Conclusions
Acknowledgments
Author Contributions
Conflicts of Interest
References
- Hutchins, M.; Sutherland, J. An exploration of measures of social sustainability and their application to supply chain decisions. J. Clean. Prod. 2008, 16, 1688–1698. [Google Scholar] [CrossRef]
- World Commission on Environment and Development. Our Common Future; Oxford University Press: New York, NY, USA, 1987. [Google Scholar]
- Harris, J.; Kennedy, S. Carrying capacity in agriculture: Global and regional issues. Ecol. Econ. 1999, 29, 443–461. [Google Scholar] [CrossRef]
- Goldman, T.; Gorham, R. Sustainable urban transport: Four innovative directions. Technol. Soc. 2006, 28, 261–273. [Google Scholar] [CrossRef]
- Colla, V.; Branca, T.; Vannucci, M.; Fornai, B.; Amato, A. Quantitative sustainability assessment through key performance indicators in ULCOS project. In Proceedings of the 2nd International Seminar on Society & Materials (SAM2), Nantes, France, 24–25 April 2008. [Google Scholar]
- Dyllick, T.; Hockerts, K. Beyond the business case for corporate sustainability. Bus. Strategy Environ. 2002, 11, 130–141. [Google Scholar] [CrossRef]
- Seuring, S.; Müller, M. From a literature review to a conceptual framework for sustainable supply chain management. J. Clean. Prod. 2008, 16, 1699–1710. [Google Scholar] [CrossRef]
- Seuring, S.; Gold, S. Sustainability management beyond corporate boundaries: From stakeholders to performance. J. Clean. Prod. 2013, 56, 1–6. [Google Scholar] [CrossRef]
- Kates, R.; Clark, W.; Corell, R.; Hall, M.; Jaeger, C.; Lowe, I.; McCarthy, J.; Schellnhuber, H.; Bolin, B.; Dickson, N.; et al. Sustainability science. Science 2001, 292, 641–642. [Google Scholar] [CrossRef] [PubMed]
- Searcy, C. Measuring enterprise sustainability. Bus. Strategy Environ. 2016, 25, 120–133. [Google Scholar] [CrossRef]
- Bossel, H. Indicators for Sustainable Development: Theory, Method, Applications; Balaton Group (International Institute for Sustainable Development): Winnipeg, MB, Canada, 1999; Available online: http://publ.ext.zalf.de/web/lsa_ergebnisse_agstruk_indikatoren/pdfs%5Cbalatonreport.pdf (accessed on 28 January 2017).
- Singh, R.; Murty, H.; Gupta, S.; Dikshit, A. An overview of sustainability assessment methodologies. Ecol. Indic. 2009, 9, 189–212. [Google Scholar] [CrossRef]
- Hervani, A.; Helms, M.; Sarkis, J. Performance measurement for green supply chain management. Benchmarking 2005, 12, 330–353. [Google Scholar] [CrossRef]
- Lancker, E.; Nijkamp, P. A policy scenario analysis of sustainable agricultural development options: A case study for Nepal. Impact Assess. Proj. Apprais. 2000, 18, 111–124. [Google Scholar] [CrossRef]
- Sadler, B. A framework for environmental sustainability assessment and assurance. In Handbook of Environmental Impact Assessment; Blackwell: Oxford, UK, 1999; pp. 12–32. [Google Scholar]
- Pope, J.; Annandale, D.; Morrison-Saunders, A. Conceptualising sustainability assessment. Environ. Impact Assess. Rev. 2004, 24, 595–616. [Google Scholar] [CrossRef]
- Ugwu, O.O.; Haupt, T.C. Key performance indicators and assessment methods for infrastructure sustainability—a South African construction industry perspective. Build. Environ. 2007, 42, 665–680. [Google Scholar] [CrossRef]
- Phillis, Y.; Andriantiatsaholiniaina, L. Sustainability: An ill-defined concept and its assessment using fuzzy logic. Ecol. Econ. 2001, 37, 435–456. [Google Scholar] [CrossRef]
- Andriantiatsaholiniaina, L.; Kouikoglou, V.; Phillis, Y. Evaluating strategies for sustainable development: Fuzzy logic reasoning and sensitivity analysis. Ecol. Econ. 2004, 48, 149–172. [Google Scholar] [CrossRef]
- Sabaghi, M.; Mascle, C.; Baptiste, P.; Rostamzadeh, R. Sustainability assessment using fuzzy-inference technique (SAFT): A methodology toward green products. Expert Syst. Appl. 2016, 56, 69–79. [Google Scholar] [CrossRef]
- Tsoulfas, G.; Pappis, C. Environmental principles applicable to supply chains design and operation. J. Clean. Prod. 2006, 14, 1593–1602. [Google Scholar] [CrossRef]
- Carter, C.; Rogers, D. A framework of sustainable supply chain management: Moving toward new theory. Int. J. Phys. Distrib. Logist. Manag. 2008, 38, 360–387. [Google Scholar] [CrossRef]
- Wu, H.; Dunn, S. Environmentally responsible logistics systems. Int. J. Phys. Distrib. Logist. Manag. 1995, 25, 20–39. [Google Scholar] [CrossRef]
- Murphy, P.; Poist, R.; Braunschwieg, C. Green logistics: Comparative views of environmental progressives, moderates, and conservatives. J. Bus. Logist. 1996, 17, 191–211. [Google Scholar]
- Sheu, J.-B.; Chou, Y.-H.; Hu, C.-C. An integrated logistics operational model for green-supply chain management. Transp. Res. Part E 2005, 41, 287–313. [Google Scholar] [CrossRef]
- Kim, S.; Yoon, S.-G.C.S.; Park, S. Economic and Environmental Optimization of a Multi-Site Utility Network for an Industrial Complex. J. Environ. Manag. 2010, 91, 690–705. [Google Scholar] [CrossRef] [PubMed]
- Min, H.; Galle, W. Green purchasing strategies: Trends and implications. Int. J. Purch. Mater. Manag. 1997, 33, 10–17. [Google Scholar] [CrossRef]
- Eskandarpour, M.; Dejax, P.; Miemczyk, J.; Péton, O. Sustainable supply chain network design: An optimization-oriented review. Omega 2015, 54, 11–32. [Google Scholar] [CrossRef]
- Pan, S.; Ballot, E.; Fontane, F. The reduction of greenhouse gas emissions from freight transport by pooling. Int. J. Prod. Econ. 2013, 143, 86–94. [Google Scholar] [CrossRef]
- Li, H.-C. Optimal delivery strategies considering carbon emissions, time-dependent demands and demand–supply interactions. Eur. J. Oper. Res. 2015, 241, 739–748. [Google Scholar] [CrossRef]
- Guide, V.; Jayaraman, V.; Srivastava, R.; Benton, W. Supply chain management for recoverable manufacturing systems. Interfaces 2000, 30, 125–142. [Google Scholar] [CrossRef]
- Srivastava, S. Green supply-chain management: A state-of the-art literature review. Int. J. Manag. Rev. 2007, 9, 53–80. [Google Scholar] [CrossRef]
- Fleischmann, M.; Bloemhof-Ruwaard, J.; Dekker, R.; van der Laan, E.; van Nunen, J.; van Wassenhove, J. Quantitative models for reverse logistics: A review. Eur. J. Oper. Res. 1997, 103, 1–17. [Google Scholar] [CrossRef]
- Seuring, S. Integrated chain management and supply chain management comparative analysis and illustrative cases. J. Clean. Prod. 2004, 12, 1059–1071. [Google Scholar] [CrossRef]
- Kleindorfer, P.; Singhal, K.; van Wassenhove, L. Sustainable operations management. Prod. Oper. Manag. 2005, 14, 482–492. [Google Scholar] [CrossRef]
- Sarkis, J.; Helms, M.; Hervani, A. Reverse Logistics and Social Sustainability. Corp. Soc. Responsib. Environ. Manag. 2010, 17, 337–354. [Google Scholar] [CrossRef]
- Sarkis, J.; Dhavale, D. Supplier selection for sustainable operations: A triple-bottom-line approach using a Bayesian framework. Int. J. Prod. Econ. 2015, 166, 177–191. [Google Scholar] [CrossRef]
- Igarashi, M.; de Boer, L.; Fet, A.M. What is required for greener supplier selection? A literature review. J. Purch. Supply Manag. 2013, 19, 247–263. [Google Scholar] [CrossRef]
- Lin, C.; Madu, C.; Kuei, C.-H.; Tsai, H.-L.; Wang, K.-N. Developing an assessment framework for managing sustainability programs: A Analytic Network Process approach. Expert Syst. Appl. 2015, 42, 2488–2501. [Google Scholar] [CrossRef]
- Böhringer, C.; Jochem, P. Measuring the immeasurable—A survey of sustainability indexes. Ecol. Econ. 2007, 63, 1–8. [Google Scholar] [CrossRef]
- Ness, B.; Urbel-Piirsalu, E.; Anderberg, S.; Olsson, L. Categorising tools for sustainability assessment. Ecol. Econ. 2007, 60, 498–508. [Google Scholar] [CrossRef]
- Todorov, V.; Marinova, D. Modelling sustainability. Math. Comput. Simul. 2011, 81, 1397–1408. [Google Scholar] [CrossRef]
- Boulanger, P.-M.; Bréchet, T. Models for policy-making in sustainable development: The state of the art and perspectives for research. Ecol. Econ. 2005, 55, 337–350. [Google Scholar] [CrossRef]
- Faucheux, S.; Pearce, D.; Proops, J. Models of Sustainable Development; Edward Elgar Publishing: Brookfield, VT, USA, 1996. [Google Scholar]
- O’Doherty, J.; Mayor, K.; Tol, R. Irish Sustainable Development Model (ISUS): Literature Review, Data Availability and Model Design. 2007. Available online: http://www.esri.ie/UserFiles/publications/20070403121154/WP186.pdf (accessed on 28 March 2010).
- Hassini, E.; Surti, C.; Searcy, C. A literature review and a case study of sustainable supply chains with a focus on metrics. Int. J. Prod. Econ. 2012, 140, 69–82. [Google Scholar] [CrossRef]
- Ahi, P.; Searcy, C. An analysis of metrics used to measure performance in green and sustainable supply chains. J. Clean. Prod. 2015, 86, 360–377. [Google Scholar] [CrossRef]
- Wilson, J. The triple bottom line—Undertaking an economic, social, and environmental retail sustainability strategy. Int. J. Retail Distrib. Manag. 2015, 43, 432–447. [Google Scholar] [CrossRef]
- Hassini, A.T. A data envelopment analysis approach to evaluate sustainability in supply chain networks. J. Clean. Prod. 2015, 105, 74–85. [Google Scholar]
- Mota, B.; Gomes, M.; Carvalho, A.; Barbosa-Povoa, A. Towards supply chain sustainability: Economic, environmental and social design and planning. J. Clean. Prod. 2015, 105, 14–27. [Google Scholar] [CrossRef]
- Chen, Z.; Andresen, S. A Multiobjective Optimization Model of Production-Sourcing for Sustainable Supply Chain with Consideration of Social, Environmental, and Economic Factors. Math. Probl. Eng. 2014, 2014, 616107. [Google Scholar] [CrossRef]
- Ahi, P.; Searcy, C. Assessing sustainability in the supply chain: A triple bottom line approach. Appl. Math. Model. 2015, 39, 2882–2896. [Google Scholar] [CrossRef]
- Kouikoglou, V.; Phillis, Y. Application of a fuzzy hierarchical model to the assessment of corporate social and social sustainability. Corp. Soc. Responsib. Environ. Manag. 2011, 18, 209–219. [Google Scholar] [CrossRef]
- Phillis, Y.; Davis, B. Assessment of Corporate Sustainability via Fuzzy Logic. J. Intell. Robot. Syst. 2009, 55, 3–20. [Google Scholar] [CrossRef]
- Moldan, B.; Janousková, S.; Hák, T. How to understand and measure environmental sustainability: Indicators and targets. Ecol. Indic. 2012, 17, 4–13. [Google Scholar] [CrossRef]
- Sarkis, J. A strategic decision framework for green supply chain management. J. Clean. Prod. 2003, 11, 397–409. [Google Scholar] [CrossRef]
- Vanpoucke, E.; Vereecke, A.; Wetzels, M. Developing supplier integration capabilities for sustainable competitive advantage: A dynamic capabilities approach. J. Oper. Manag. 2014, 32, 446–461. [Google Scholar] [CrossRef]
- Shafiee, M.; Lotfi, F.H.; Saleh, H. Supply chain performance evaluation with data envelopment analysis and balanced scorecard approach. Appl. Math. Model. 2014, 38, 5092–5112. [Google Scholar] [CrossRef]
- Vermeulen, W.; Metselaar, J. Improving sustainability in global supply chains with private certification standards: Testing an approach for assessing their performance and impact potential. Int. J. Bus. Glob. 2015, 14, 226–250. [Google Scholar] [CrossRef]
- Mefford, R. The Economic Value of a Sustainable Supply Chain. Bus. Soc. Rev. 2011, 116, 109–143. [Google Scholar] [CrossRef]
- Searcy, C.; Karapetrovic, S.; McCartney, D. Designing corporate sustainable development indicators: Reflections on a process. Environ. Qual. Manag. 2009, 19, 31–42. [Google Scholar] [CrossRef]
- Chen, R.-Y. An innovative decision-support approach for design consideration EOL in feedback-based sustainable supply chain. Int. J. Adv. Oper. Manag. 2015, 7, 114–135. [Google Scholar] [CrossRef]
- Kucukvar, M.; Cansev, B.; Egilmez, G.; Onat, N.; Samadi, H. Energy-climate-manufacturing nexus: New insights from the regional and global supply chains of manufacturing industries. Appl. Energy 2016, 184, 889–904. [Google Scholar] [CrossRef]
- Zhu, Q.; Sarkis, J. Relationships between operational practices and performance among early adopters of green supply chain management practices in Chinese manufacturing enterprises. J. Oper. Manag. 2004, 22, 265–289. [Google Scholar] [CrossRef]
- Kuik, S.; Kaihara, T.; Fujii, N.; Kokuryo, D. The Optimal Product Disposition Decision for Product Returns towards Sustainable Manufacturing. Eng. Lett. 2016, 24, 301–306. [Google Scholar]
- Haghighi, S.M.; Torabi, S.; Ghasemi, R. An integrated approach for performance evaluation in sustainable supply chain networks (with a case study). J. Clean. Prod. 2016, 137, 579–597. [Google Scholar] [CrossRef]
- Yakovieva, N.; Sarkis, J.; Sloan, T. Sustainable Benchmarking of Food Supply Chains. 2009. Available online: https://www2.clarku.edu/departments/marsh/news/WP2009-02.pdf (accessed on 2 January 2017).
- Verdecho, M.; Alfaro-Saiz, J.; Rodriguez-Rodriguez, R. A performance measurement framework for monitoring supply chain sustainability. In Annals of Industrial Engineering; Springer: London, UK, 2012; pp. 331–338. [Google Scholar]
- Tajbakhsh, A.; Hassini, E. Performance measurement of sustainable supply chains: A review and research questions. Int. J. Prod. Perform. Manag. 2015, 64, 744–783. [Google Scholar] [CrossRef]
- Vallance, S.; Perkins, H.; Dixon, J. What is social sustainability? A clarification of concepts. Geoforum 2011, 42, 342–348. [Google Scholar] [CrossRef]
- Vachon, S.; Klassen, R. Extending green practices across the supply chain: The impact of upstream and downstream integration. Int. J. Oper. Prod. Manag. 2006, 26, 795–821. [Google Scholar] [CrossRef]
- Molamohamadi, Z.; N, I.; Leman, Z.; Zulkifli, N. Supplier Selection in a Sustainable Supply Chain. J. Adv. Manag. Sci. 2013, 1, 278–281. [Google Scholar] [CrossRef]
- Amindoust, A.; Ahmed, S.; Saghafinia, A.; Bahreininejad, A. Sustainable supplier selection: A ranking model based on fuzzy inference system. Appl. Soft Comput. 2012, 12, 1668–1677. [Google Scholar] [CrossRef]
- Sousa, G.; Bose, B. Fuzzy Set Theory Based Control of a Phase-Controlled Converter DC Machine Drive. IEEE Trans. Ind. Appl. 1994, 30, 34–44. [Google Scholar] [CrossRef]
- Chen, T.-Y.; Ku, T.-C. Importance-Assessing Method with Fuzzy Number-Valued Fuzzy Measures and Discussions on TFNs and TrFNs. Int. J. Fuzzy Syst. 2008, 10, 92–103. [Google Scholar]
- Mandami, E.; Assilian, S. An experiment in linguistic synthesis with a fuzzy logic controller. Int. J. Man Mach. Stud. 1975, 7, 1–13. [Google Scholar] [CrossRef]
- Zadeh, L. The concept of a linguistic variable and its application to approximate reasoning. Inf. Sci. 1975, 8, 199–249. [Google Scholar] [CrossRef]
- Kouikoglou, V.; Phillis, Y. On the monotonicity of hierarchical sum–product fuzzy systems. Fuzzy Sets Syst. 2009, 160, 3530–3538. [Google Scholar] [CrossRef]
- Van Leekwijck, W.; Kerre, E. Defuzzification: Criteria and classification. Fuzzy Sets Syst. 1999, 108, 159–178. [Google Scholar] [CrossRef]
- Gosling, J. Flexibility Strategies for Engineer-to-Order Construction Supply Chains. 2013. Available online: https://orca.cf.ac.uk/54426/1/U584527.pdf (accessed on 2 January 2017).
- Kristianto, Y.; Helo, P.; Jiao, R. Mass customization design of engineer-to-order products using Benders’ decomposition and bi-level stochastic programming. J. Intell. Manuf. 2013, 24, 961–975. [Google Scholar] [CrossRef]
- Hicks, C.; McGovern, T.; Earl, C. A typology of UK Engineer-to-Order companies. Int. J. Logist. Res. Appl. 2011, 4, 43–56. [Google Scholar] [CrossRef]
- Istat, Il Mercato del Lavoro Negli anni Della Crisi—Dinamiche & Divari. 2014. Available online: http://www.istat.it/it/files/2014/05/cap3.pdf (accessed on 14 October 2016).
- Fraunhofer Institute for Reliability and Microintegration, Energy-Using Product Group Analysis—Lot 5: Machine Tools and Related Machinery. 2012. Available online: http://www.eup-network.de/fileadmin/user_upload/Produktgruppen/Lots/Final_Documents/EuP_Lot5_Task3_March2012.pdf (accessed on 31 January 2017).
- Fraunhofer Institute for Reliability and Microintegration, Energy-Using Product Group Analysis—Lot 5: Machine Tools and Related Machinery. 2011. Available online: https://www.ebpg.bam.de/de/ebpg_medien/entr5/405_studyd_11_02_part3.pdf (accessed on 31 January 2017).
- Associazioni Sindacali, Contratto Collettivo Nazionale di Lavoro (CCNL) Settore Metalmeccanico per le Lavoratrici & i LAVORATORI addetti All’industria Metalmeccanica Privata & alla Installazione di Impianti. 2016. Available online: http://www.contrattometalmeccanici.it (accessed on 9 February 2017). (In Italian).
- CSR Manager Network Italia & Istat, Oltre il Dato Finanziario: Imprese & Benessere Collettivo. 2013. Available online: http://download.terna.it/terna/0000/0064/05.pdf (accessed on 9 February 2017). (In Italian).
- Istat, “Nero a Metà”: Contratti Part-Time & Posizioni Full-Time fra i Dipendenti delle Imprese Italiane. 2014. Available online: http://www.istat.it/it/files/2014/09/IWP-n.-3-2014.pdf (accessed on 14 October 2016).
- Health and Safety Executive, European Comparison. 2016. Available online: http://www.hse.gov.uk/statistics/european/european-comparisons.pdf?pdf=european-comparisons (accessed on 31 January 2017).


| Sustainability Perspective | KPIs and Source | Description and Computational Procedure |
|---|---|---|
| Economic | Delivery flexibility [56] | Ratio between the number of times the request to change the date for delivery is satisfied and the total requests |
| Mix flexibility [57] | Ratio between the number of times the request to change the mix is satisfied and the total requests | |
| Customization [57] | Ratio between the number of times the request of personalization is satisfied and the total requests | |
| Warehouse turnover rate [58] | Number of times per month where the items rotate, i.e., they are replaced in the warehouse; the higher the number of rotations, the higher the capacity of the company to recover the financial resources invested in the production of the good | |
| Rate of defects [47] | Ratio between the number of non-compliant products and the total number of products; it provides a measure of the quality of the company | |
| Rate of multiple-sourcing [59] | Percentage of supplies for which a multiple-sourcing strategy is adopted; this KPI evaluates the risk of a supplier's failure: the higher is the number of different suppliers, the lower is the risk of the supplier’s failure | |
| Customer satisfaction [47] | It measures the extent to which the product supplied by a company meets the customer’s expectation | |
| Out-of-stock [60] | Number of days per year in which the company does not have goods available to sell to the final customer | |
| Sales growth [47] | It reflects the increase in the company’s sale compared to the previous year | |
| Market share [47] | The share of the company’s sales compared to the total market’s sales | |
| Return on investment (ROI) [47] | It is a financial performance referring to the company’s balance sheet, computed as the ratio between the net income and the amount of capital invested | |
| Turnover [61] | Company’s annual turnover | |
| Cost of sales [61] | Total cost of the items manufactured and sold; it is derived from the company’s balance sheet | |
| Inventories [46] | Economic value of the amount of stocks; it is derived from the company’s balance sheet | |
| Investments in R&D [47,61] | Amount of capital invested in R&D annually by the company | |
| Net profit [47] | It is a measure of the company’s profitability and is taken from the company’s balance sheet | |
| Environmental | Eco-design [62] | Percentage of products realized applying environmentally-sustainable design concepts |
| Carbon footprint [47] | Amount of greenhouse gas emission of the products manufactured by the company; it is typically obtained as the output of a life-cycle assessment (LCA) analysis | |
| Energy footprint [63] | Measure of land required to absorb the CO2 emissions of a product manufactured by the company; it is typically obtained as the output of an LCA analysis | |
| Water consumption [47] | Amount of freshwater taken from ground or surface sources | |
| Air emissions [47] | Amount of pollutants released into the atmosphere | |
| Use of hazardous materials [64] | Amount of hazardous, harmful or toxic material used in production | |
| Product recycling rate [65] | Percentage of finished products recycled | |
| Product non-recycling rate [65] | Percentage of finished products discharged | |
| Packaging recycling rate [66] | Percentage of packaging material recycled | |
| Packaging non-recycling rate [66] | Percentage of packaging material disposed in landfill | |
| Unitary transport cost [28] | Unitary cost associated with the transport activities | |
| Social | Work shift [47] | Average number of hours worked per week by an employee |
| Salary [1] | Average annual cost per employee | |
| Employment gender ratio [67] | Percentage of female workers with respect to male workers | |
| Job training [68] | Percentage of workers who attended training courses | |
| Full-time workers [67] | Percentage of full-time workers out of the total amount of employees | |
| Temporal working continuity [69] | Ratio between the number of new hired workers and of layoffs in one working year | |
| Safety training [68] | Percentage of workers who attend training courses on safety and emergency procedures | |
| Work injury [51] | Ratio between the number of days in which work injuries occurred and the total number of working days | |
| Local suppliers [70] | Ratio between the number of local suppliers and the total number of suppliers | |
| Local workers [70] | Ratio between the number of local workers and the total number of employees | |
| Claims [47] | Number of complaints received from the customers out of the total number of customers served | |
| Supplier’s screening for human rights [71] | Percentage of suppliers evaluated on the respect for human rights | |
| Sustainable suppliers [71,72,73] | Percentage of suppliers that are evaluated and selected taking into account their orientation towards sustainability |
| KPI | Used in the Case Study? | Adaptations/Reason for Removal | Measurement Unit | Benchmark | Fuzzy Linguistic Scale | |
|---|---|---|---|---|---|---|
| Economic perspective | Delivery flexibility | Yes | It was computed as the ratio between the number of deliveries (of finished products) that meet the delivery date defined by Company A and the number of deliveries fulfilled by the company. This KPI was computed for the three main types of order fulfilled by Company A (i.e., spare part, plant/equipment and machinery), and the average value was taken as the company’s performance. | % | none (the higher the better) | VP: <55%; P: 50–74%; G: 70–95%; VG: 88–100% |
| Mix flexibility | No | As Company A works on an ETO basis, mix flexibility is meaningless. | - | - | - | |
| Customization | Yes | - | % | none (the higher the better) | VP: <25%; P: 20–50%; G: 45–75%; VG: >70% | |
| Warehouse turnover rate | Yes | This KPI was computed taking into account the whole stock available at Company A, including finished products, semi-finished products and components. | Months−1 | best competitor | VP: <80% P: 70–100%; G: 90–130%; VG: >120% | |
| Rate of defects | No | Company A checks all new plants before delivering them to the customers, and all defects are fixed during this check. Returns of product because of defects are very likely to be observed. | - | - | - | |
| Customer satisfaction | No | See the previous KPI. | - | - | - | |
| Rate of multiple sourcing | Yes | - | % | none (the higher the better) | VP: <8%; P: 5–16%; G: 14–27%; VG: >25% | |
| Stock out | No | Because Company A works on an ETO basis, products are not manufactured to be kept in stock. Therefore, measuring out-of-stock situations is meaningless. | - | - | - | |
| Sale growth → Revenue growth | Yes | The sale growth does not fully allow capturing the situation of an ETO company. The company’s managers suggested to replace it with the increase in the revenue from contracts, which is monitored annually by Company A and describes the amount of orders Company A has received from its customers in one year. | % | best competitor | VP: <80%; P: 70–100%; G: 90–130%; VG: >120% | |
| Market share | Yes | As the best competitor (Company B) works in several market sectors, to compute the KPI, we took into account its market share limited to the milling industry. | % | best competitor | VP: <80%; P: 70–100%; G: 90–130%; VG: >120% | |
| ROI | Yes | - | % | best competitor | VP: <80%; P: 70–100%; G: 90–130%; VG: >120% | |
| Turnover | Yes | - | € | best competitor | VP: <80%; P: 70–100%; G: 90–130%; VG: >120% | |
| Cost of sales → Cost of sales/Turnover | Yes | This KPI was computed as the ratio between the cost of sales and the turnover (both derived from the company’s balance sheet) to allow a more meaningful comparison with the best competitor. | % | best competitor | VP: >120%; P: 90–130%; G: 70–100%; VG: <80% | |
| Inventories → Inventories/Turnover | Yes | See the previous KPI. | % | best competitor | VP: <80%; P: 70–100%; G: 90–130%; VG: >120% | |
| Investments in R&D → Investments in R&D/Turnover | Yes | See the previous KPI. | % | best competitor | VP: <80%; P: 70–100%; G: 90–130%; VG: >120% | |
| Net profit → Net profit/Turnover | Yes | See the previous KPI. | % | best competitor | VP: <80%; P: 70–100%; G: 90–130%; VG: >120% | |
| Environmental perspective | Eco-design | Yes | - | % | best competitor | VP: <80%; P: 70–100%; G: 90–130%; VG: >120% |
| Carbon footprint | Yes | We used the average value computed by Company A on three main types of machines manufactured. Such an average value was compared to some available environmental product declarations (EPD) of similar products, as the benchmark. | kg CO2 eq. | EPD certification of food machines [84,85] | VP: >120%; P: 90–130%; G: 70–100%; VG: <80% | |
| Energy footprint | No | At the time of writing, Company A is carrying out a complete LCA analysis of their main machines, but the related results are still not available. We have therefore neglected this KPI. | - | - | - | |
| Water consumption | No | See the previous KPI. | - | - | - | |
| Air emissions | No | At the time of writing, Company A has never evaluated its air emissions. We have therefore neglected this KPI. | - | - | - | |
| Use of hazardous materials | No | This KPI is not particularly relevant to plant manufacturers and is not expect to vary significantly across plant manufacturing companies. | - | - | - | |
| Product recycling rate | No | Company’s products are durable goods, whose lifecycle can reach 50 years. Therefore, end-of-life management is a marginal problem for Company A (and more in general, for companies operating as plant manufacturers). | - | - | - | |
| Product non-recycling rate | No | See the previous KPI. | - | - | - | |
| Packaging recycling rate | Yes | - | % | best competitor | VP: <80%; P: 70–100%; G: 90–130%; VG: >120% | |
| Packaging non-recycling rate | Yes | - | % | best competitor | VP: <80%; P: 70–100%; G: 90–130%; VG: >120% | |
| Unitary transport cost | No | This KPI is not particularly relevant to plant manufacturers, as they are often forced to make use of container shipments because of the size of the product shipped. Therefore, the transport cost is not expected to vary significantly across these companies. | - | - | - | |
| Social perspective | Work shift | Yes | - | hours/week | collective labor agreement for the mechanical industry [86] | VP: >7%; P: 5–8%; G: 3–6%; VG: <4% |
| Salary | Yes | - | €/year | collective labor agreement for the mechanical industry [86] | VP: <80%; P: 70–100%; G: 90–130%; VG: >120% | |
| Employment gender ratio | Yes | This KPI was computed considering both full-time workers and interim employees, which could be employed at Company A for a limited time during peaks of work. | % of women at work | average percentage of women at work in Italy [87] | VP: <35%; P: 33–43%; G: 38–48%; VG: >46% | |
| Job training | Yes | See the previous KPI. | hours/year | average amount of hours for job training in Italy [87] | VP: <80%; P: 70–100%; G: 90–130%; VG: >120% | |
| Full-time workers | Yes | - | % | average percentage of full-time workers in Italy [88] | VP: <50%; P: 48–70%; G: 68–90%; VG: >88% | |
| Temporal working continuity | Yes | - | - | best competitor | VP: <80%; P: 70–100%; G: 90–130%; VG: >120% | |
| Safety training | No | As in Italy, safety training is mandatory for any worker and is regulated by specific laws, this KPI scores 100% for any Italian company. | - | - | - | |
| Work injury | Yes | - | % | standardized accident rates of Europe [89] | VP: >120%; P: 90–130%; G: 70–100%; VG: <80% | |
| Local suppliers | Yes | Suppliers were considered as local if they are located in a range of 50 km from the company. | % | best competitor | VP: <80%; P: 70–100%; G: 90–130%; VG: >120% | |
| Local workers | Yes | Workers were considered as local if they are located in a range of 50 km from the company. | % | best competitor | VP: <80%; P: 70–100%; G: 90–130%; VG: >120% | |
| Claims | No | Company A checks all new plants before delivering them to the customers, and all defects are fixed during this check. Claims after this check are very unlikely to occur. | - | - | - | |
| Supplier’s screening for human rights | No | The screening of the suppliers for human rights is currently not performed by Company A and Company B. Therefore, this KPI was neglected in the analysis. | - | - | - | |
| Sustainable suppliers | Yes | - | % | best competitor | VP: <80%; P: 70–100%; G: 90–130%; VG: >120% |
| KPI | Company’s Performance | Benchmark | Final Score | Linguistic Judgement (Membership Degree) |
|---|---|---|---|---|
| Delivery flexibility | 90% | - | 90.00% | G (0.71); VG (0.29) |
| Customization | 47% | - | 47.00% | P (0.60); G (0.40) |
| Warehouse turnover rate | 1.7 | 2.0 | 85.00% | P (1) |
| Rate of multiple sourcing | 35% | - | 35.00% | VG (1) |
| Revenue growth | 139% | 17% | 820.38% | VG (1) |
| Market share | 23% | 15% | 153.33% | VG (1) |
| ROI | 22.6% | 21.76% | 103.86% | G (1) |
| Turnover | xxx 1 | xxx | 293.24% | VG (1) |
| Cost of sales/Turnover | 94.41% | 87.22% | 108.25% | P (1) |
| Inventories/Turnover | 13.99% | 15.11% | 92.61% | P (0.74); G (0.26) |
| Investments/Turnover | 0.06% | 0.05% | 108.32% | G (1) |
| Net profit/Turnover | 4.86% | 10.64% | 45.61% | VP (1) |
| KPI | Company’s Performance | Benchmark | Final Value | Linguistic Judgement (Membership Degree) |
|---|---|---|---|---|
| Eco-design | 33% | 25% | 132.00% | VG (1) |
| Carbon footprint | 131,699 | 54,567 | 241.35% | VP (1) |
| Packaging recycling rate | 88% | 90% | 97.78% | P (0.22); G (0.78) |
| Packaging non-recycling rate | 5% | 3.5% | 142.86% | VG (1) |
| KPI | Company’s Performance | Benchmark | Final Value | Linguistic Judgement (Membership Degree) |
|---|---|---|---|---|
| Work shift | 42.12 | 40 | 5.30% | P (0.30); G (0.70) |
| Salary | 26,000 | 27,000 | 96.30% | P (0.37); G (0.63) |
| Employment gender ratio | 39% | 41% | 95.12% | VG (1) |
| Job training | 92% | 93% | 98.92% | VG (1) |
| Full-time workers | 87% | 98% | 88.78% | G (0.61); VG (0.39) |
| Temporal working continuity | 1.18 | 1.67 | 70.91% | VP (0.91); P (0.09) |
| Work injury | 1.54% | 1.80% | 85.47% | G (1) |
| Local suppliers | 53% | 76% | 69.74% | VP (1) |
| Local workers | 71% | 92% | 77.17% | VP (0.28); P (0.72) |
| Sustainable suppliers | 74% | 45% | 164.44% | VG (1) |
© 2017 by the authors. Licensee MDPI, Basel, Switzerland. This article is an open access article distributed under the terms and conditions of the Creative Commons Attribution (CC BY) license (http://creativecommons.org/licenses/by/4.0/).
Share and Cite
Bottani, E.; Gentilotti, M.C.; Rinaldi, M. A Fuzzy Logic-Based Tool for the Assessment of Corporate Sustainability: A Case Study in the Food Machinery Industry. Sustainability 2017, 9, 583. https://doi.org/10.3390/su9040583
Bottani E, Gentilotti MC, Rinaldi M. A Fuzzy Logic-Based Tool for the Assessment of Corporate Sustainability: A Case Study in the Food Machinery Industry. Sustainability. 2017; 9(4):583. https://doi.org/10.3390/su9040583
Chicago/Turabian StyleBottani, Eleonora, Maria Carmen Gentilotti, and Marta Rinaldi. 2017. "A Fuzzy Logic-Based Tool for the Assessment of Corporate Sustainability: A Case Study in the Food Machinery Industry" Sustainability 9, no. 4: 583. https://doi.org/10.3390/su9040583
APA StyleBottani, E., Gentilotti, M. C., & Rinaldi, M. (2017). A Fuzzy Logic-Based Tool for the Assessment of Corporate Sustainability: A Case Study in the Food Machinery Industry. Sustainability, 9(4), 583. https://doi.org/10.3390/su9040583