Article

Are Consumers Willing to Pay More for a “Made in” Product? An Empirical Investigation on “Made in Italy”

1
Department of Economics and Law, Cassino University, Viale dell’ Università, 03043 Cassino, Italy
2
Department of Management, Sapienza University of Rome, Via del Castro Laurenziano 9, 00161 Rome, Italy
*
Author to whom correspondence should be addressed.
Sustainability 2017, 9(4), 556; https://doi.org/10.3390/su9040556
Submission received: 29 December 2016 / Revised: 27 March 2017 / Accepted: 3 April 2017 / Published: 6 April 2017

Abstract

:
The paper aims to explore consumer behavior towards “Made in” products in order to determine the associated quality and value-attributes related to the purchasing intention of consumers. In particular, the article presents the comments and results deriving from an empirical investigation on “Made in Italy”. The research questions addressed are: (1) Does recognition really exist in terms of qualitative characterization of “Made in Italy” products? And if yes; (2) Does willingness to pay a “premium price” for such products exist in quantitative terms? The study is characterized by two phases. From a theoretical standpoint, the main literature on the topic is presented through the identification and deepening of the scientific strand of reference, such as the Country of Origin, the Country Image and the Brand Image, placing them in a broader context on Willingness to Pay. From an experimental standpoint, the research group investigates the existence and the type of relationship between the perception of quality and the willingness to pay for “Made in Italy” products. The summarized main findings show (1) “Made in Italy” is well established as a conceptual category in the minds of consumers; and (2) there is a significant “premium price” recognized by consumers for “Made in Italy” in the three sectors analyzed (food, fashion and furnishings). The “premium price” is not homogeneously recognized for the various product sectors analyzed, although for all the sectors the most commonly encountered value is relative to 10–30%.

1. Introduction

This article forms part of a larger research project which aims to analyze the consumer’s attitude and behavior towards “Made in Italy” products, in order to identify the associated attributes and the value systems that influence the purchasing intention.
The research questions on which the project is focused are essentially the following:
(1) Does recognition really exist in terms of qualitative characterization of “Made in Italy” products?
And if yes,
(2) Does willingness to pay a “premium price” for such products exist in quantitative terms?
In concrete terms, the study examines the relationship between the recognition, in terms of qualitative characterization, and the consumer’s willingness to pay a “premium price”, in quantitative terms, for “Made in Italy” products. The fundamental aim is to demonstrate whether and to what extent the consumer is willing to pay a premium price for a “Made in Italy” product, taking into account three traditional areas of our country’s specialization: Food, Fashion and Furnishings. Typically, these three areas are located in industrial districts characterized by small and medium enterprises that strongly characterize its reference area, and whose stability has a strong impact expressed in terms of productive and social sustainability. In this context, these companies can sustain its global competitiveness by applying the enhancement strategies linked to the “Made in”, also using approaches based on Corporate Social Responsibility, thus revaluing assets and entrepreneurial skills [1,2,3].
The paper is organized in two parts: the first introduces a discussion on the literature, while the second illustrates an empirical investigation, conducted through a questionnaire.
The literature seems to lack sufficient references for a full understanding of the real worth of “Made in Italy” in terms of consumers’ willingness to pay. In order to present the main literature on the subject, it seems logical to refer to the wide strand of the Country of Origin, within which other strands are associated such as the Country Image and Brand Image that we also investigated. Willingness to Pay represents our additional field of the literature, which is transversal to the others.

2. Literature Review

As discussed, we have chosen to present the literature review following the main strand of research under the denomination of Country of Origin. Two other research areas, referred to as Country Image and Brand Image, that are related to the first were deepened within this context. The Willingness to Pay, finally, was a cross-literature to the topics. The reasons why we felt it useful to follow this logic are strictly connected with our research questions. In fact, the literature on Country of Origin is the natural container to study “Made in Italy” products, since it makes explicit reference to a particular country; the Country Image is associated with the most representative characteristics of the production of a specific country (this perspective is especially useful as our empirical research focused on specific areas/products that typically refer to “Made in Italy”); the Brand Image is equally important since the brand represents the conceptual vehicle within which consumers associate “Made in Italy” products; Willingness to Pay, finally, represents the specific aim of our research and for this reason can be considered as being transversal with the previous strands of research.

2.1. Country of Origin

Ditcher (1962) introduces the concept of Country of Origin (i.e., COO), underlining its importance in explaining the success of the products [4]. The first scientific paper investigating the relationship between consumer behavior and products’ COO is due to Schooler [5]. This author investigates the existence of tangible effects on consumer behavior due to the country of origin of the products [5]. Information on the country of origin results in two effects: the “halo construct” and the “summary construct”. In the former case, the consumer has a generic image of that country, while the in the second, the consumer already has purchasing experiences of the products of that country and, therefore, is able to provide a subjective assessment [6]. Through the “summary construct effect”, the COO is used in the purchasing evaluation by consumers who have a high familiarity with the product. It is obtained by analyzing the evolution of the use of the COO in different types of consumers [7]. According to Baker and Ballington [8], De Nisco [9], De Luca and Pegan [10], Bursi et al. [11], the COO effect influences the consumer’s decision-making process. Several studies have been proposed with this purpose for general products [12,13,14], for the commodity class of products [15], for specific products [16,17,18], and for particular brands [19,20]. The COO effect is dominant when the consumer associates the manufactured goods with the tradition of production [21,22]. However, other authors, such as Johansson et al., argue the indirect effect of the COO on the overall evaluation of the product branded “Made in” [23]. According to these authors, the purchasing intention does not depend by the COO but from other attributes [24], such as the particular historical moment [25,26]. According to Manrai et al. [27], political, cultural and economic issues have a stronger influence in the process evaluation of the “Made in” product. They propose summarizing such issues through the GDP indicator [28]. Several empirical investigations differ in industrialized countries and developing countries. In particular, different perceptions of manufactured products occurred in developed and developing countries [13,29,30]. There are indeed many preconceptions observed in developing countries [8,20,23]. There are patriotic attitudes and ethnocentric consumption [31,32]. For products coming from industrialized countries, consumers in the industrialized country show a favorable attitude towards “Made in” products when the products come from their own home country [33]. The effect is opposite for consumers of developing countries, where the “foreign” product is perceived as being of greater quality and is, therefore, viewed positively [34,35]. The COO theories are closely related to risk perception and prejudices. According to Hampton [15] and Lumpkin [35], when consumers in industrialized countries purchase a product of their own country of origin, a low risk is perceived during the decision-making process. The effect is an overestimation of the quality of domestic products and an underestimation in the case of foreign products [36]. Ger et al. interpret the symbolism of the COO and conduct a survey on stereotypes related to some countries: the consumer from nations with a not-always-positive social identity rewards foreign products more than local products [37]. Factors such as ethnocentrism and the propensity to aggregation occur only in countries where there is a positive social identity. They are supported by positive stereotypes. However, they are not relevant for those people who seek the aspirational identity. Moreover, the demographic variables influence the effect of the COO [38]. Several empirical investigations [39,40,41] show a more important influence of “Made in” products on older people (with a low education and low income). Obermiller and Spangenberg [42] analyze the relationship between the COO and Consumer Behavior using three dimensions: the affective component, the normative component and the cognitive component. In the affective component, the COO does not appear to be related to the perception of product quality, but rather to a set of factors such as the consumer’s emotions and sensations [43]. The normative component concerns the adaptation of a product’s legislative standards [44], with particular reference to the food product sector [45]. A cognitive approach, which assumes that consumers are rational, investigates the relationship between the COO, the Brand, and the Willingness to pay [46]. Studies investigate a possible correlation between the COO and Consumer Knowledge. Consumer knowledge is regarded as a multi-dimensional construct, where different kinds of product-related experiences lead to different dimensions of knowledge. Such different dimensions have different effects on product evaluations and choices [47]. The customer knowledge has become a big topic. Consumers with a high level of product-country knowledge are more likely to trust the COO in the evaluation process of low-involvement products, rather than consumers who have a low level of product-country knowledge. Consumers with a high level of knowledge of the product class, especially in the case of products with unfamiliar brand names, are more confident in the use of the COO in evaluating the product than consumers with a low level of knowledge [48].

2.2. Country Image

Another perspective of the COO’s researches regards the product’s Country Image [49,50]. Usunier and Cestre study the country’s association to product peculiarities [51]. The country’s image can be expressed as “the representation, the reputation, the stereotype that consumers associate to the products of a specific country” [52,53]. According to Roth and Romeo [22], the image of a country is determined by a number of dimensions that positively qualify a nation in terms of production; these dimensions are related to the areas of “innovation” (superiority, technology advantage), “design” (style, elegance), “prestige” (exclusivity, status of national brands), and “workmanship” (reliability, durability, quality of domestic products). The Country Image’s effect on perceptions and on the behavior of individuals, can be an important competitive tool both at the enterprise level and at the country level [54]. The academic community has not found a point of convergence on the conceptual and practical content related to Country Image [55]. Many researchers defined Country Image as a “perception”, “impressions”, “stereotype” or “pattern” [43] other authors, instead, associate a set of beliefs with this term [56]. The implications from an operational standpoint of this lack of convergence in a single definition of Country Image has produced a plethora of measurement tools of the particular parameter. The debate over the years has defined the concept as a multidimensional construct, consisting in the following dimensions [57]:
-
Factors related to the image of the product categories with certain provenances, such as shoes for Italy;
-
Influence of the “Made in” labels;
-
Image evoked by the origin of the product;
-
The product’s national image compared to the consumer’s overall judgment in respect to past experience;
-
Factors related to the image of domestic products over those that are imported.
As regards the Italian context, Italy’s country image seems to be based on some traditional components such as history and culture, design, creativity, tourism, and lifestyle [58]. That image is inevitably compared with the characteristics of the production related to “Made in Italy” [59]. Varaldo (2001) argues that “Made in Italy” is not recognized with a specific and defined identity; it includes a diverse set of industries and manufacturing sectors without major technological ties. However, the author recognizes main the components of “Made in Italy” due to the “fashion system” (textile/clothing, footwear, leather goods, eyewear, jewelry), “home furnishings” (lighting articles, marble, ceramic tiles, home faucets), the “Mediterranean diet” (pasta, pizza, olive oil, wine) and “mechanical” (textile machinery, packaging, leather tanning). This interpretation of “Made in Italy” comes from a perspective that is widely accepted in doctrine and is variously developed [60,61,62]. In Italy, it is summarized in the formula of “4A (In the Italian language, the macro-sectors of manufacturing excellence start with the first letter “A”: Clothing-Fashion (Abbigliamento), Home Furnishings (Arredo-casa), Food and Beverage (Alimentare), Automation-mechanical-plastic-rubber (Automazione Meccanica))”. “Made in Italy” focuses on four macro-sectors of manufacturing excellence: Clothing-Fashion, Home Furnishings, Food and Beverage, and Automation-mechanical-plastic-rubber [63,64]. Close to these macro-areas, there are other high-tech sectors (luxury cars, cruise ships, helicopters and aerospace, defense, chemicals and pharmaceuticals, biomedical) and the Italian tourist system, based on “4A (In the Italian language, the tourist system start with the first letter “A”: Environment (Ambiente), Art (Arte), Architecture (Architettura), Hospitality (Accoglienza))”: Environment, Art, Architecture, Hospitality [63]. Considering the sectoral excellence, “Made in Italy” expresses culture, and its products represent significant symbols of the image that the Country boasts in the world [59].

2.3. Brand Image

Most researchers recognize the importance of the Brand Image. Aaker [65] argues that the image creates value in terms of processing information for the consumer, differentiating the brand from others, and generating purchasing processes giving positive sensations. Keller [66], one of the major contributors in this domain, defines the Brand Image as “perceptions of a brand as reflected by the brand associations held in consumer memory”. The same author considers the Brand Image as a component of the Brand Knowledge, classifying the brand associations (and therefore, the brand image) into three categories: attributes (non-product-related attributes and product-related attributes), benefits (functional, experiential and symbolic), and brand attitudes (consumers’ overall evaluations of a brand). Aaker [65] makes an important contribution to the Brand Image literature, distinguishing 11 dimensions: product attributes, intangibles, customer benefits, price, experience, user, celebrity, life-style, product class, competitors, and country of origin. Thus, there is a close relationship between the Brand Image and the Country of Origin: the image of the brand evokes positive emotions in the consumer if the brand belongs to a particular country of origin that is significant for the consumer himself [67]. Consumers spontaneously associate the brand of the product with the brand’s country of origin, independently from the product’s physical place of manufacture [68,69].
With specific attention to the Italian case, several studies on the image of the “Made in Italy” brand have demonstrated the real significance of the brand image, placing it in the top position for brand awareness in most countries. The “Made in Italy” brand evokes attributes in consumers’ minds that positively characterize the image of Italy as a country, facilitating the perception through the effect of the product-country association [70]. Main studies highlight that the “Made in Italy” brand image is positive all over the world [71] so that three phenomena are generated, in order to make use of the worth and strength of the brand image: counterfeiting, the “Italian sounding” and the Italian brands bought by foreign companies. The World Trade Organization defined counterfeiting as the “unauthorized representation of a registered trademark carried on goods identical or similar to goods for which the trademark is registered, with a view to deceiving the purchaser into believing that he/she is buying the original goods”, while the “Italian sounding” phenomenon refers to creating images, colors and names of products very similar to their Italian equivalent. Counterfeiting and the “Italian sounding” phenomena impact directly and negatively on Italy as a country, especially in the fashion sector and agribusiness. In fact, this problem affects consumers that are not aware of the purchase of non-original products (demand-side) and the companies with registered brands (supply-side). Many foreign groups have acquired consolidated Italian brands, associated with the “Made in Italy” concept. However, this gives rise to some questions: (1) Do they continue to be “Made in Italy”? and (2) Do they continue to be perceived as being “Made in Italy”? The consumer’s perspectives include an element of attention such as perception (image, reputation, quality) and related behaviors (willingness to pay a premium price). The customer’s standpoint is fundamental, because the brand’s attribute is created by its promoter and is influenced by the market. According to Temperini et al., 2016 [70], “Made in Italy still definitely enjoy a high degree of awareness in international markets; however, the impact on perceptions, image, and customer loyalty, caused especially by the actions that tend to create confusion and mislead customers, is to be feared”. The brand embodies and communicates a promise [72]. The development of buyer confidence is a priority in order to increase his/her loyalty and to streamline purchasing intentions [73], thus increasing the value of the brand itself. Looking ahead, the “Made in Italy” brand value is important in order to increase the relationship between the customer and the brand, acting positively on satisfaction and fidelity.

2.4. Willingness to Pay

Consumer affinity for a product’s “Made in” could have an effect on a consumer’s willingness to pay [74,75]. Willingness to Pay refers to the maximum amount of money a consumer is willing to spend for a product [76], and it could be defined as the attention or perception of consumers towards the purchase of a product related to the psychology approach to pay a premium price for a “Made in” or for a specific brand product [77]. The consumers’ willingness to pay is higher when the COO of a branded product reminds a positive country image [78]. Thus, the consumers of a “Made in” product are willing to pay a premium price [79]. Finally, the consumer’s willingness to pay depends on the evaluating role of the “Made in Italy” product value. Consumers set their purchasing processes relating to the assessment of Country of Origin, Country Image and Brand Image expressed by a directly proportional relationship with the purchasing power.

3. Materials and Methods

The survey used an ad hoc questionnaire developed as an investigative tool. A preliminary test was carried out on a small set of units in order to sharpen the questions. This was particularly relevant for tuning the items related to measuring the propensity to pay of the respondents, and their attitude towards “Made in Italy”. The survey was hence on May 2015 by a set of trained interviewers. It involved a sample of 660 Italian citizens living both in the big town of Rome and in a medium-sized demographic town in Southern Lazio, specifically Cassino. The decision to consider different demographic dimension centers stems from the idea to monitor the public’s attitude towards “Made in Italy”, taking into account the possible existence of local lifestyles both in a metropolis and in non-metropolitan urban areas. The sampling plan is stratified according to three variables: gender (male, female), age group (18–24; 25–34; 35–44; 45–54; over 55), education (up to high school, diploma, degree and higher). The sample size consists of 300 interviews in Cassino and 360 interviews in Rome. The share of interviews in each stratum is proportional to the corresponding value in the reference population. The questionnaire was designed in order to analyze consumers’ attitude towards “Made in Italy” products and has been administered through direct interviews. Once collected the data, all computation and graphics were done in the R language [80], using the basic packages and the additional ggplot [81], likert [82] and wordcloud [83] packages. Particular attention has been devoted to understanding the tangible (material, shape, etc.) and intangible (aesthetics, style, image, brand, etc.) characteristics of the products associated with “Made in Italy” that affect the purchase.
The questionnaire was structured along three different perspectives: the knowledge of the phenomenon (Section Q1), the measurement of the propensity to pay a premium price for a product associated with “Made in Italy” (Section Q2) and the general attitude towards “Made in Italy” (Section Q3). This in according with the most influential available literature [52,84]. The final Section Q4 pertains to demographic information of the respondent.
Q1. Knowledge of the Phenomenon
The knowledge of the phenomenon was investigated introducing different definitions of “Made in Italy”. The characteristics of the products and the role of the brand played also a central role in this section of the questionnaire. In particular, the first question introduced the general theme and aimed at filtering the respondents who knew “Made in Italy”. The second question asked to select among four different definitions of “Made in Italy”. Finally, in the last two questions, the respondents were asked to indicate three products and three brands, respectively, both associated with “Made in Italy”.
Q2. Willingness to Pay for a Premium Price
The second section of the questionnaire aimed at detecting the general attitude to pay a premium price for “Made in Italy”. To this end, two opinion questions were used. The two questions was planned to detect both the perceived quality of a Made in Italy product, and the additional price of such a type of product. Since it is well know in literature that respondents tend to answer what is expected by the person who administer the questionnaire [85], the respondents were also requested to quantify the willingness to pay for a premium price based on the product sector (food, textile, home furnishing) both in percentage terms and in absolute terms. In particular, in the latter case, three hypothetical values were used: €100, €1000, and €10,000. This in according with the literature commonly used by demographers for measuring family preference size [86]. Specifically, it was further investigated whether the possible willingness to pay an additional price was influenced by the reference sectors (food, clothing, home furnishings). The data collected in this section aimed towards comprehending the second research question.
Q3. Attitudes towards “Made in Italy”
This section tries to assess two dimensions: the rationality level of the consumer and the level of affection for “Made in Italy”. The scaling process exploits Likert scales: respondents were asked to specify their level of agreement or disagreement on a symmetric agree-disagree scale for two series of statements. For this purpose, each Likert scale was divided into four response modes (strongly agree, agree, disagree, and strongly disagree). We opted for a forced choice method, not inserting the middle option “Neither agree nor disagree”. This to avoid an easy option for unsure respondents.
Q4. Personal Data
This section enabled the gathering of information on the following demographic information: gender, age, level of education and residence. This information was crossed with the other variables measured in order to evaluate any differences among the various strata of the sample analyzed. As already mentioned, we chose to compare the attitudes towards “Made in Italy” in different contexts of population size, by taking a metropolis and a smaller center into account. These are two popular local targets on Italian territory. A subsequent analysis would be to extend the research to other areas, in order to have additional comparator elements.

4. Results and Discussion

Before moving on to the presentation of the results, it is important to emphasize that in a preliminary stage, the analysis of the answers suggested the adoption of a coding in 6 representative sectors of “Made in Italy” and in 9 characteristics that distinguish it. In particular, the following areas were identified: food, furniture, drinks, jewelery, mechanics, fashion, and technology, and the following characteristics: beauty, certification, quality, price, elegance, originality, tradition, sustainability, and utility.
The Italian respondents’ opinion on the image of “Made in Italy” was collected through two questions with open answers. The first asks them to indicate the first 3 adjectives that they associate with the term “Made in Italy”. The collected answers are graphically depicted in Figure 1 using word clouds, also referred to as text clouds or tag clouds. They are visual representation of text data, widespread for reporting qualitative data. As was expected (Figure 1a), a series of characteristics emerged that identify “Made in Italy” as a badge of excellence with high standards. In particular, two aspects appear: one linked to product characteristics (quality, reliability, safety), while the other is linked to the aesthetic quality (original, elegant, beautiful). It is interesting to note the association of the term “expensive” to indicate the surplus of expense that one associates with a product marked with this badge.
In the second question, respondents are asked to indicate the first three brands that come to mind representing “Made in Italy” products. The results are split into three sectors (food, automobiles and fashion) which, more than others, have been exported around the world (Figure 1b). The most known brands vary from Ferrari to Fiat, from Barilla to Ferrero. It is interesting to note that the interviewees did not directly refer to a brand, but spoke more generally about “reggiano”, “parmigiano”, “prosciutto” etc.
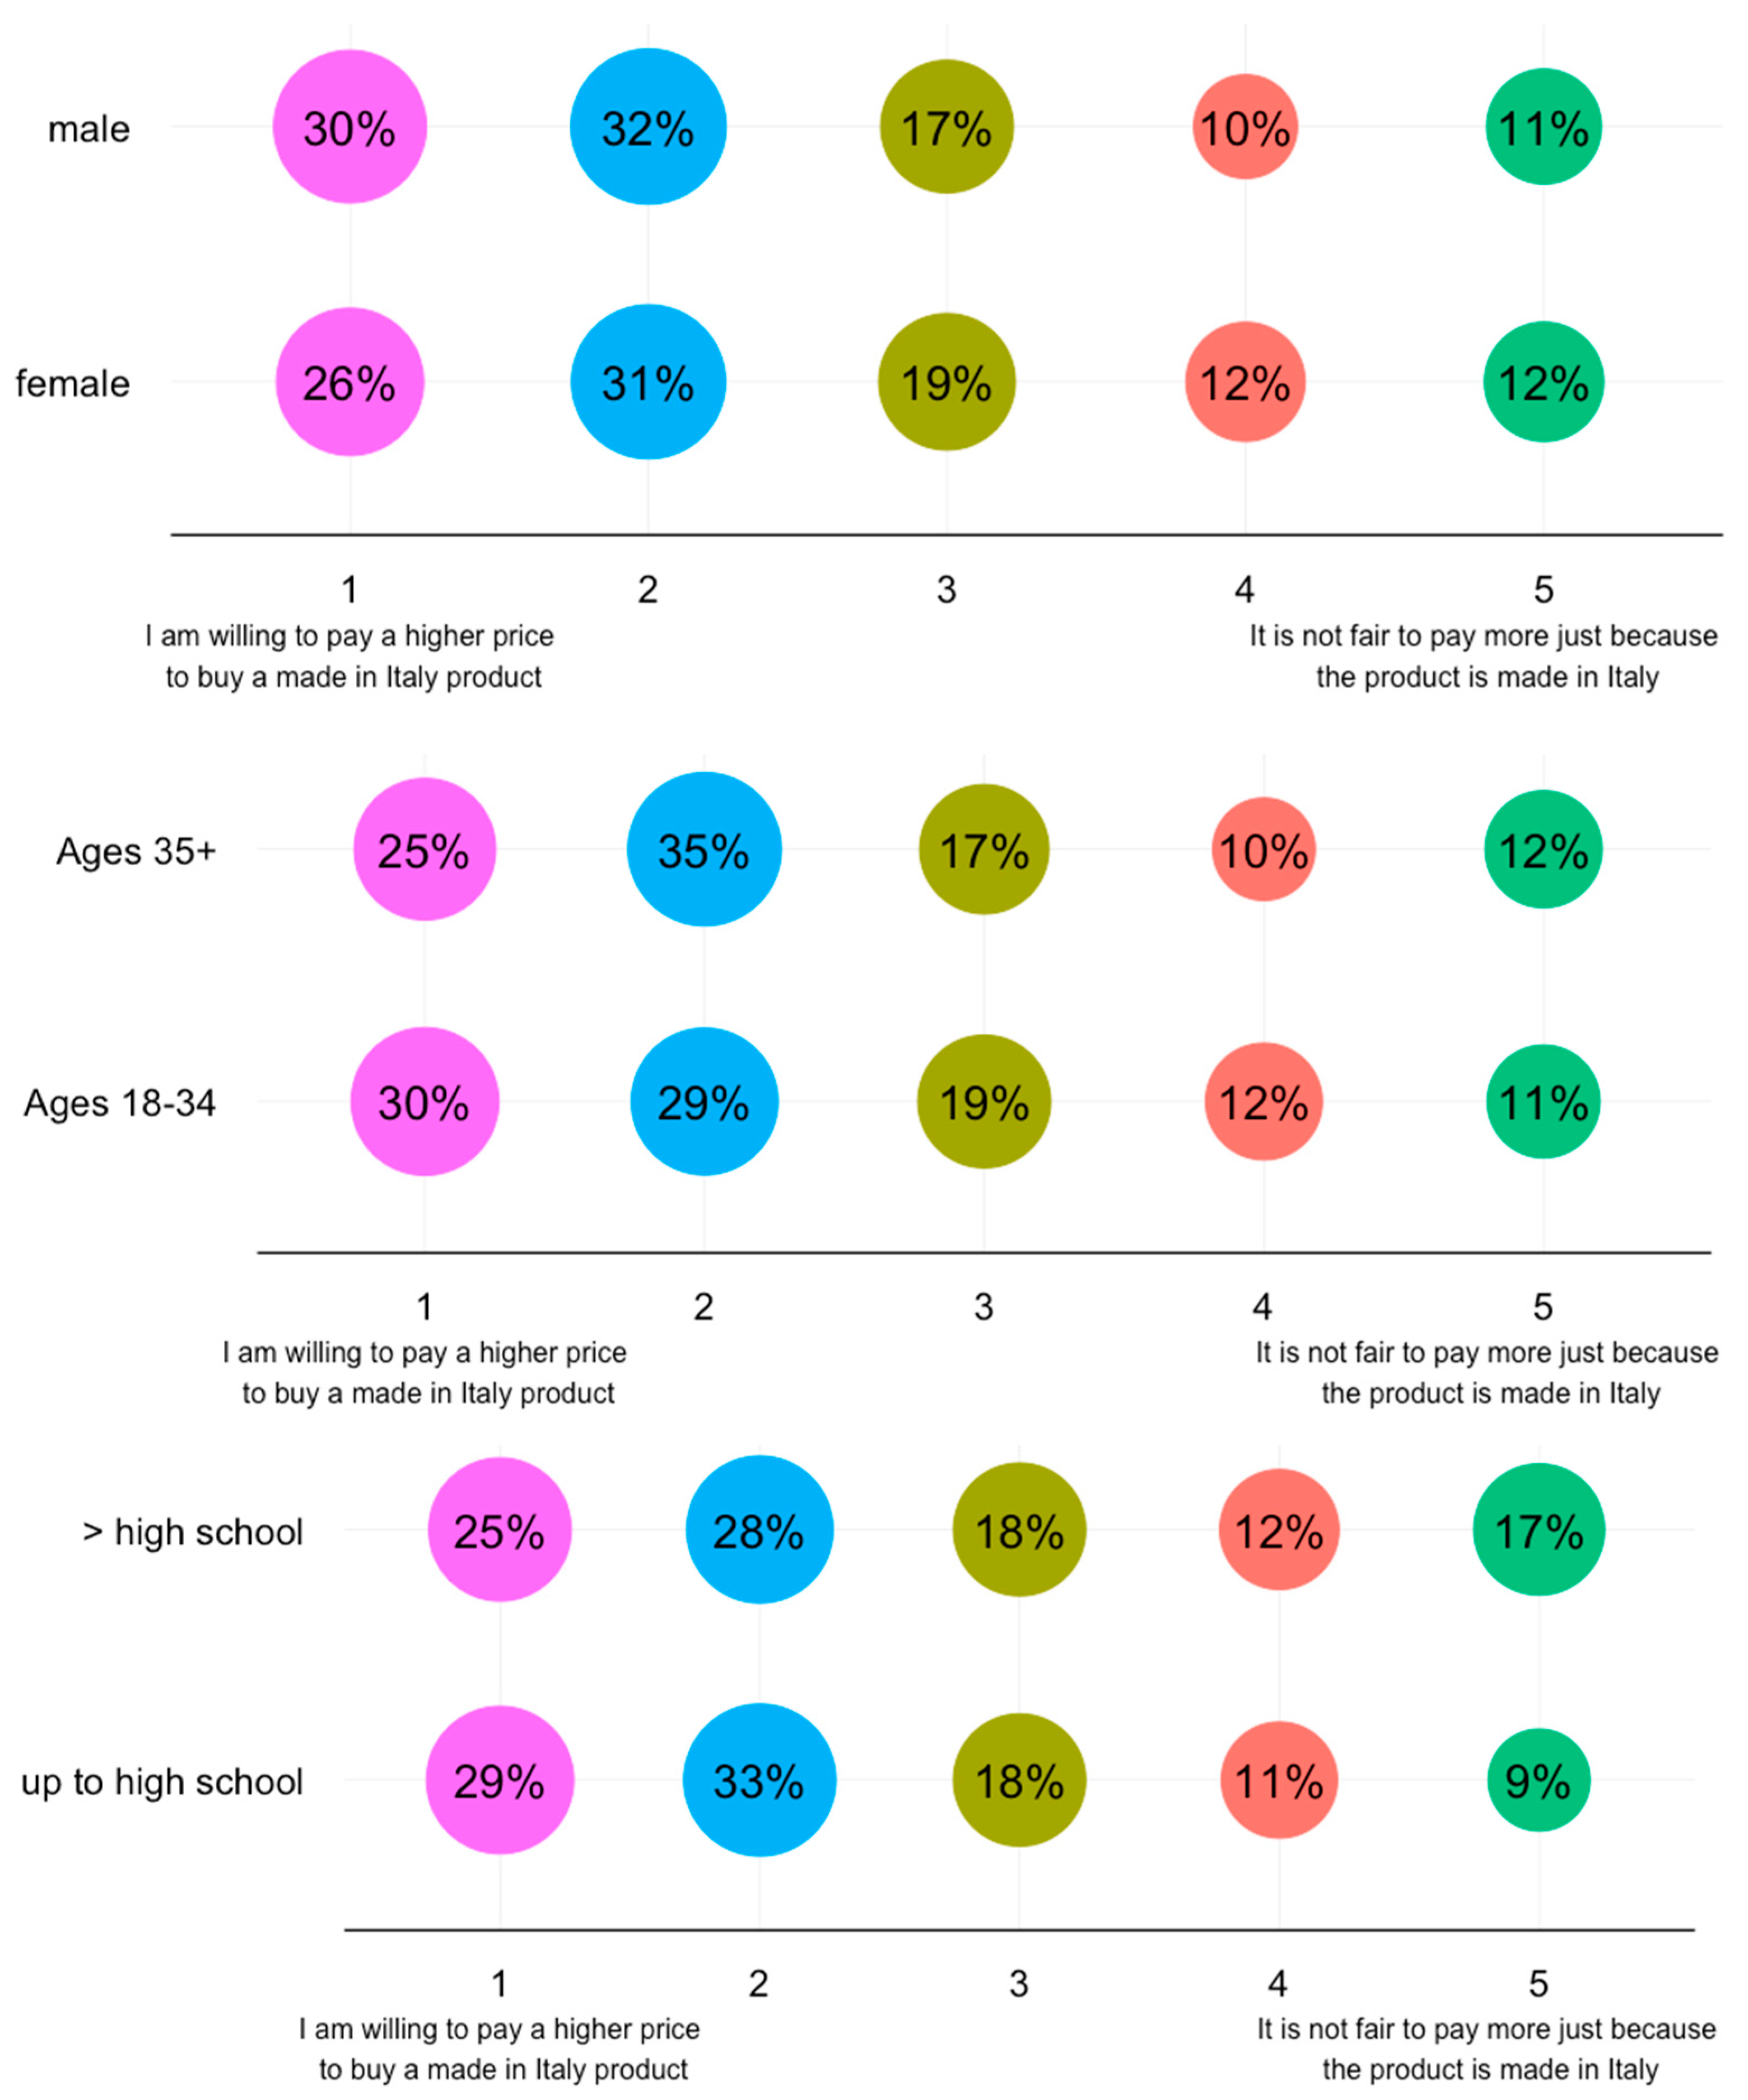
The positive image associated with “Made in Italy” is also confirmed by Figure 2, which reports the results of the question formed as a “thermometer of sentiments”. The interviewee is invited to indicate on a scale between two phrases where their instinct most accurately lies: to one extreme, the interviewee fully agrees with the statement “I am willing to pay a higher price to buy a Made in Italy” product while at the other extreme, the interviewee agrees with the statement “It is not fair to pay more just because the product is Made in Italy”. A prevalent proportion of the sample (60%) appears prepared to pay more in order to purchase a “Made in Italy” product, as shown by the answers on the aforementioned scale (Figure 2). The percentages drop slightly (57%) in the case of female interviewees (Figure 3). Respondents with a higher level of education show less willingness to pay a higher price (Figure 3). Younger individuals seem more oriented to pay a premium price (the percentage that is placed on the left-most segment of the sentiment thermometer is equal to 30% compared with a value of 25% for older individuals (Figure 3). It should be noted that the above results are significant (p-values < 0.01).
As already discussed, the research aims to discover whether and how much the interviewees would be prepared to pay more to purchase a “Made in Italy” product. It was intended to observe the relationship between the premium price and some socio-demographical variables (gender, age and education). Focusing only on the level “between 10% and 30%” for the premium price, the difference in gender, education and age appears to be sensitive. In particular, as regards gender, there is no notable difference between men and women, with the exception of the slot that indicates a premium between 10% and 30% where women display a greater willingness to pay more (34 versus 28) for a “Made in Italy” product (Figure 4).
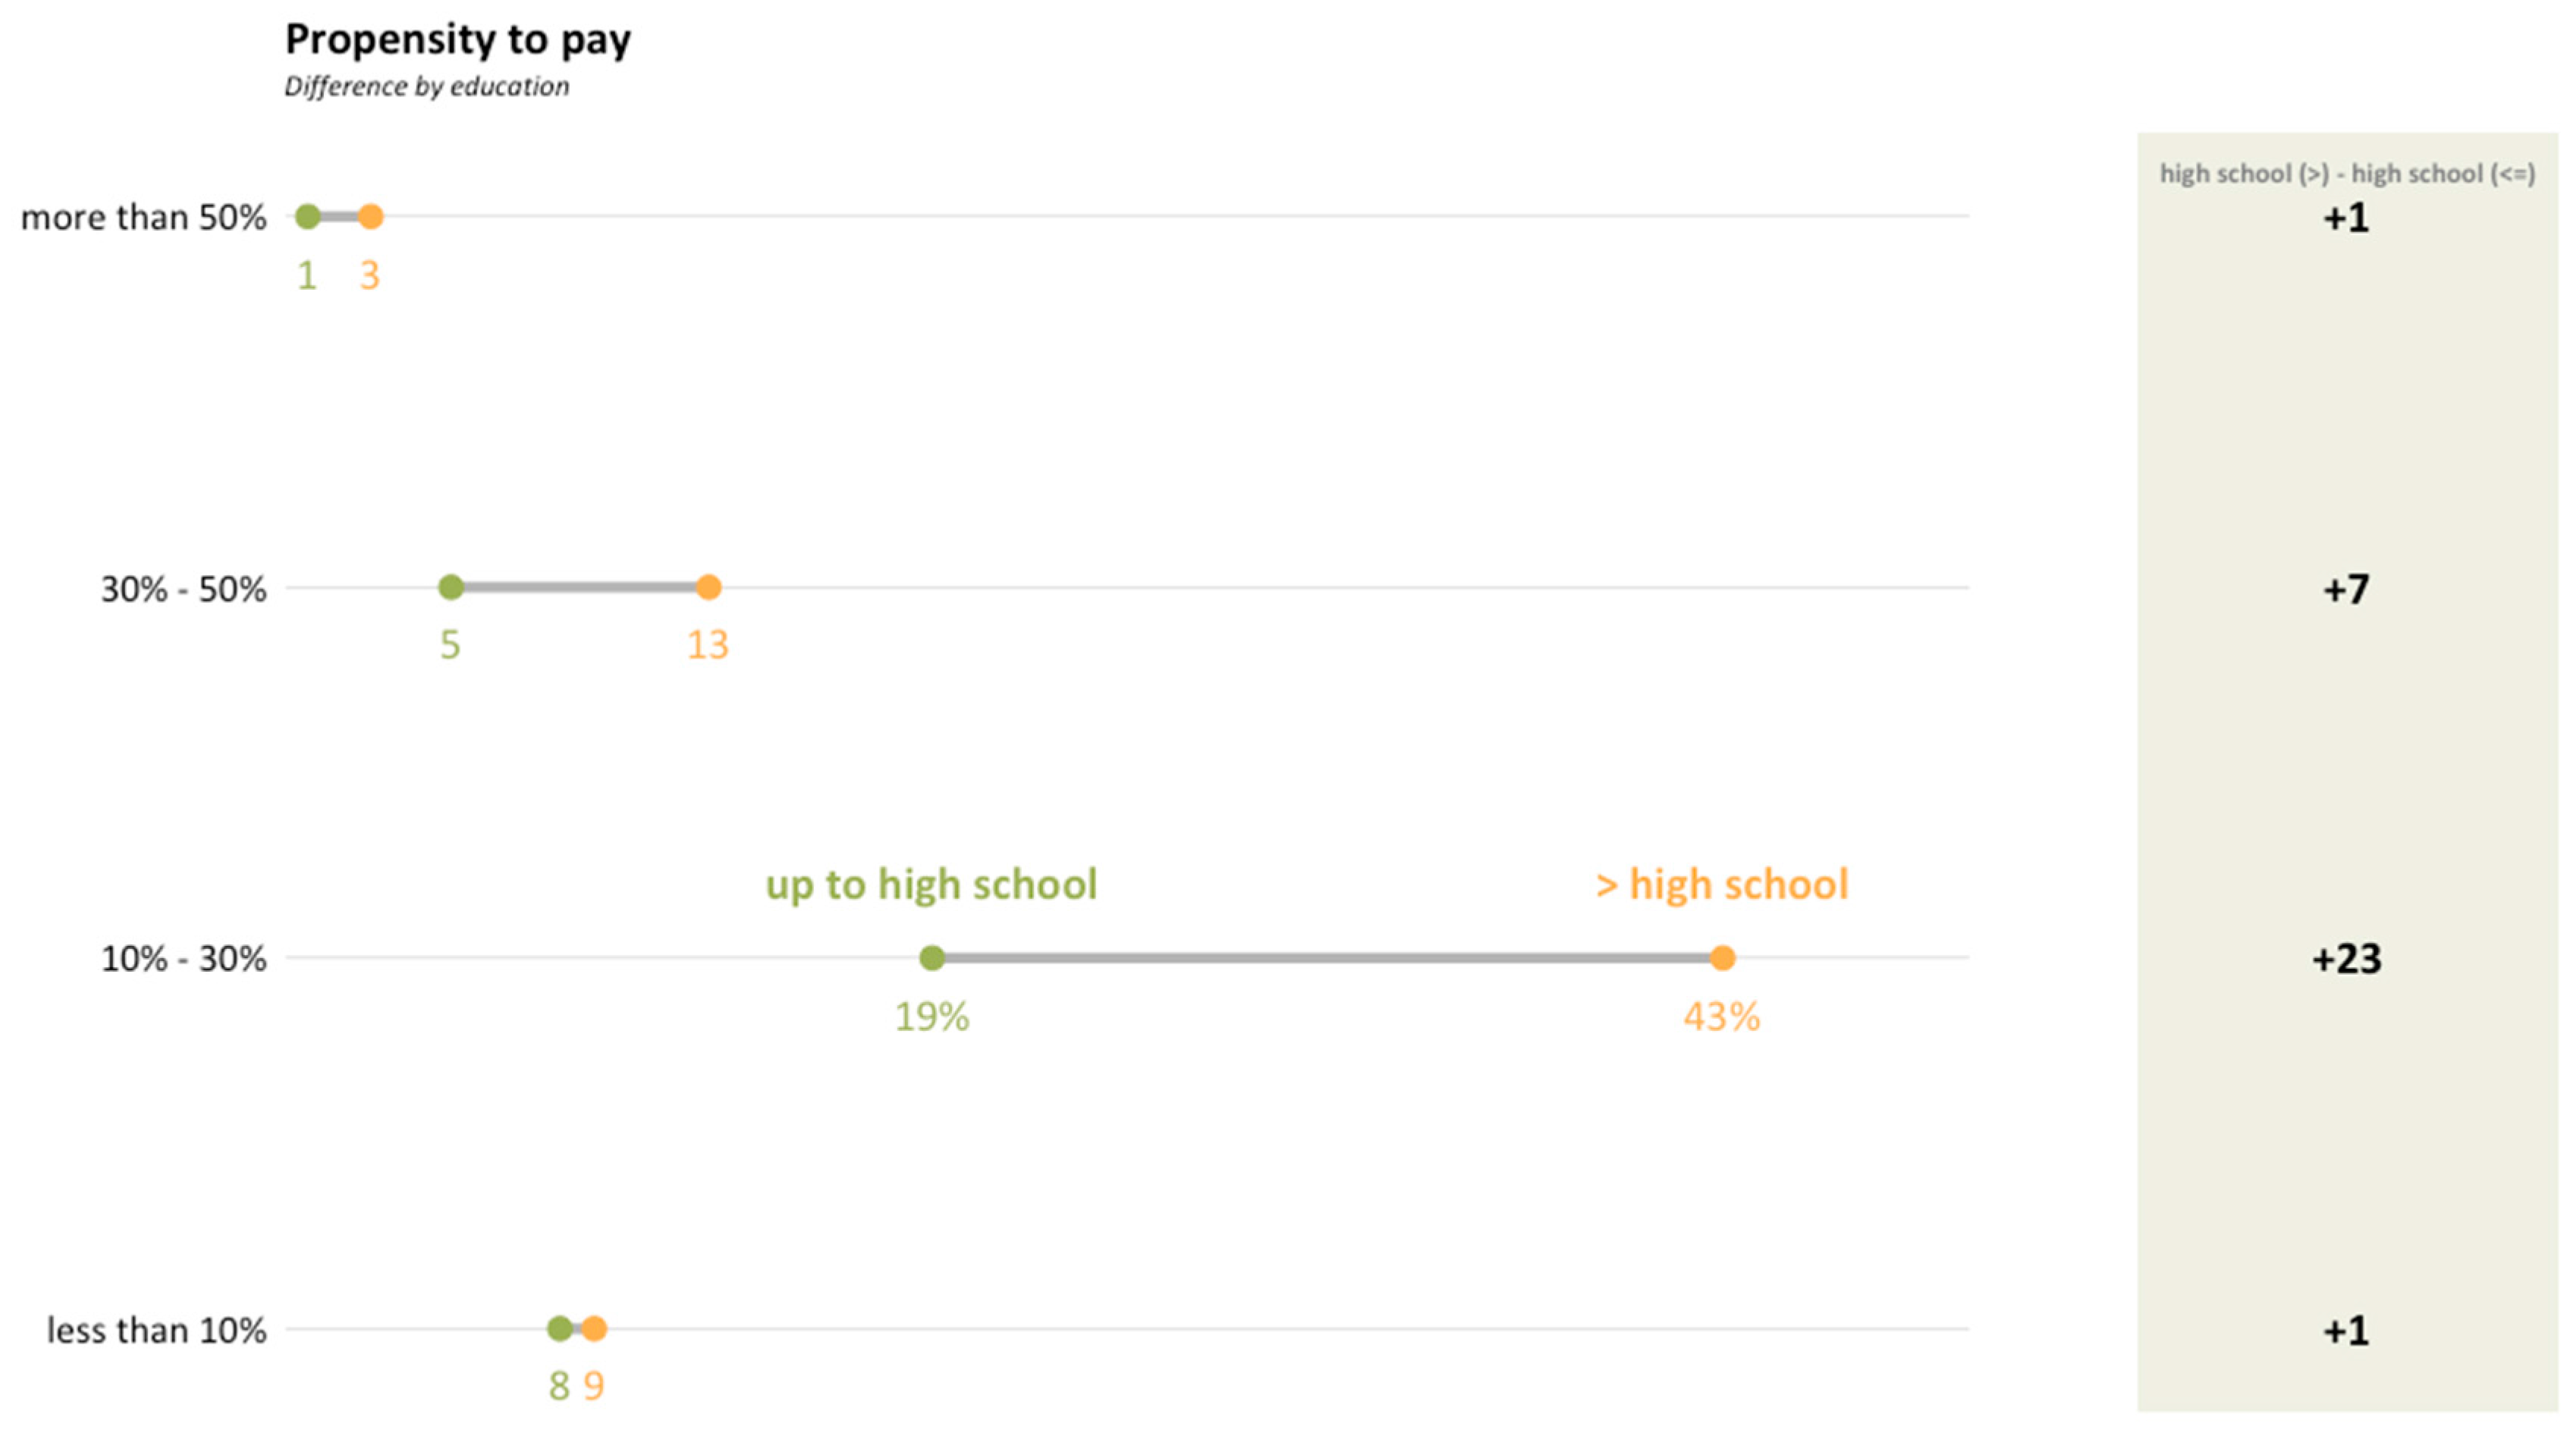
A greater variance emerges in the relationship between the willingness to pay and the level of education (distinguished in two categories: up to high school and more than high school) (Figure 5). This is also the case in the slot “between 10% and 30%”, depending on the level of education (43% in the case of those more highly educated against 19% of those of a more modest educational background). Also, for the surplus, higher percentages (from 30% to 50%) are observed, albeit more modestly (5% versus 13%), depending on the level of education.
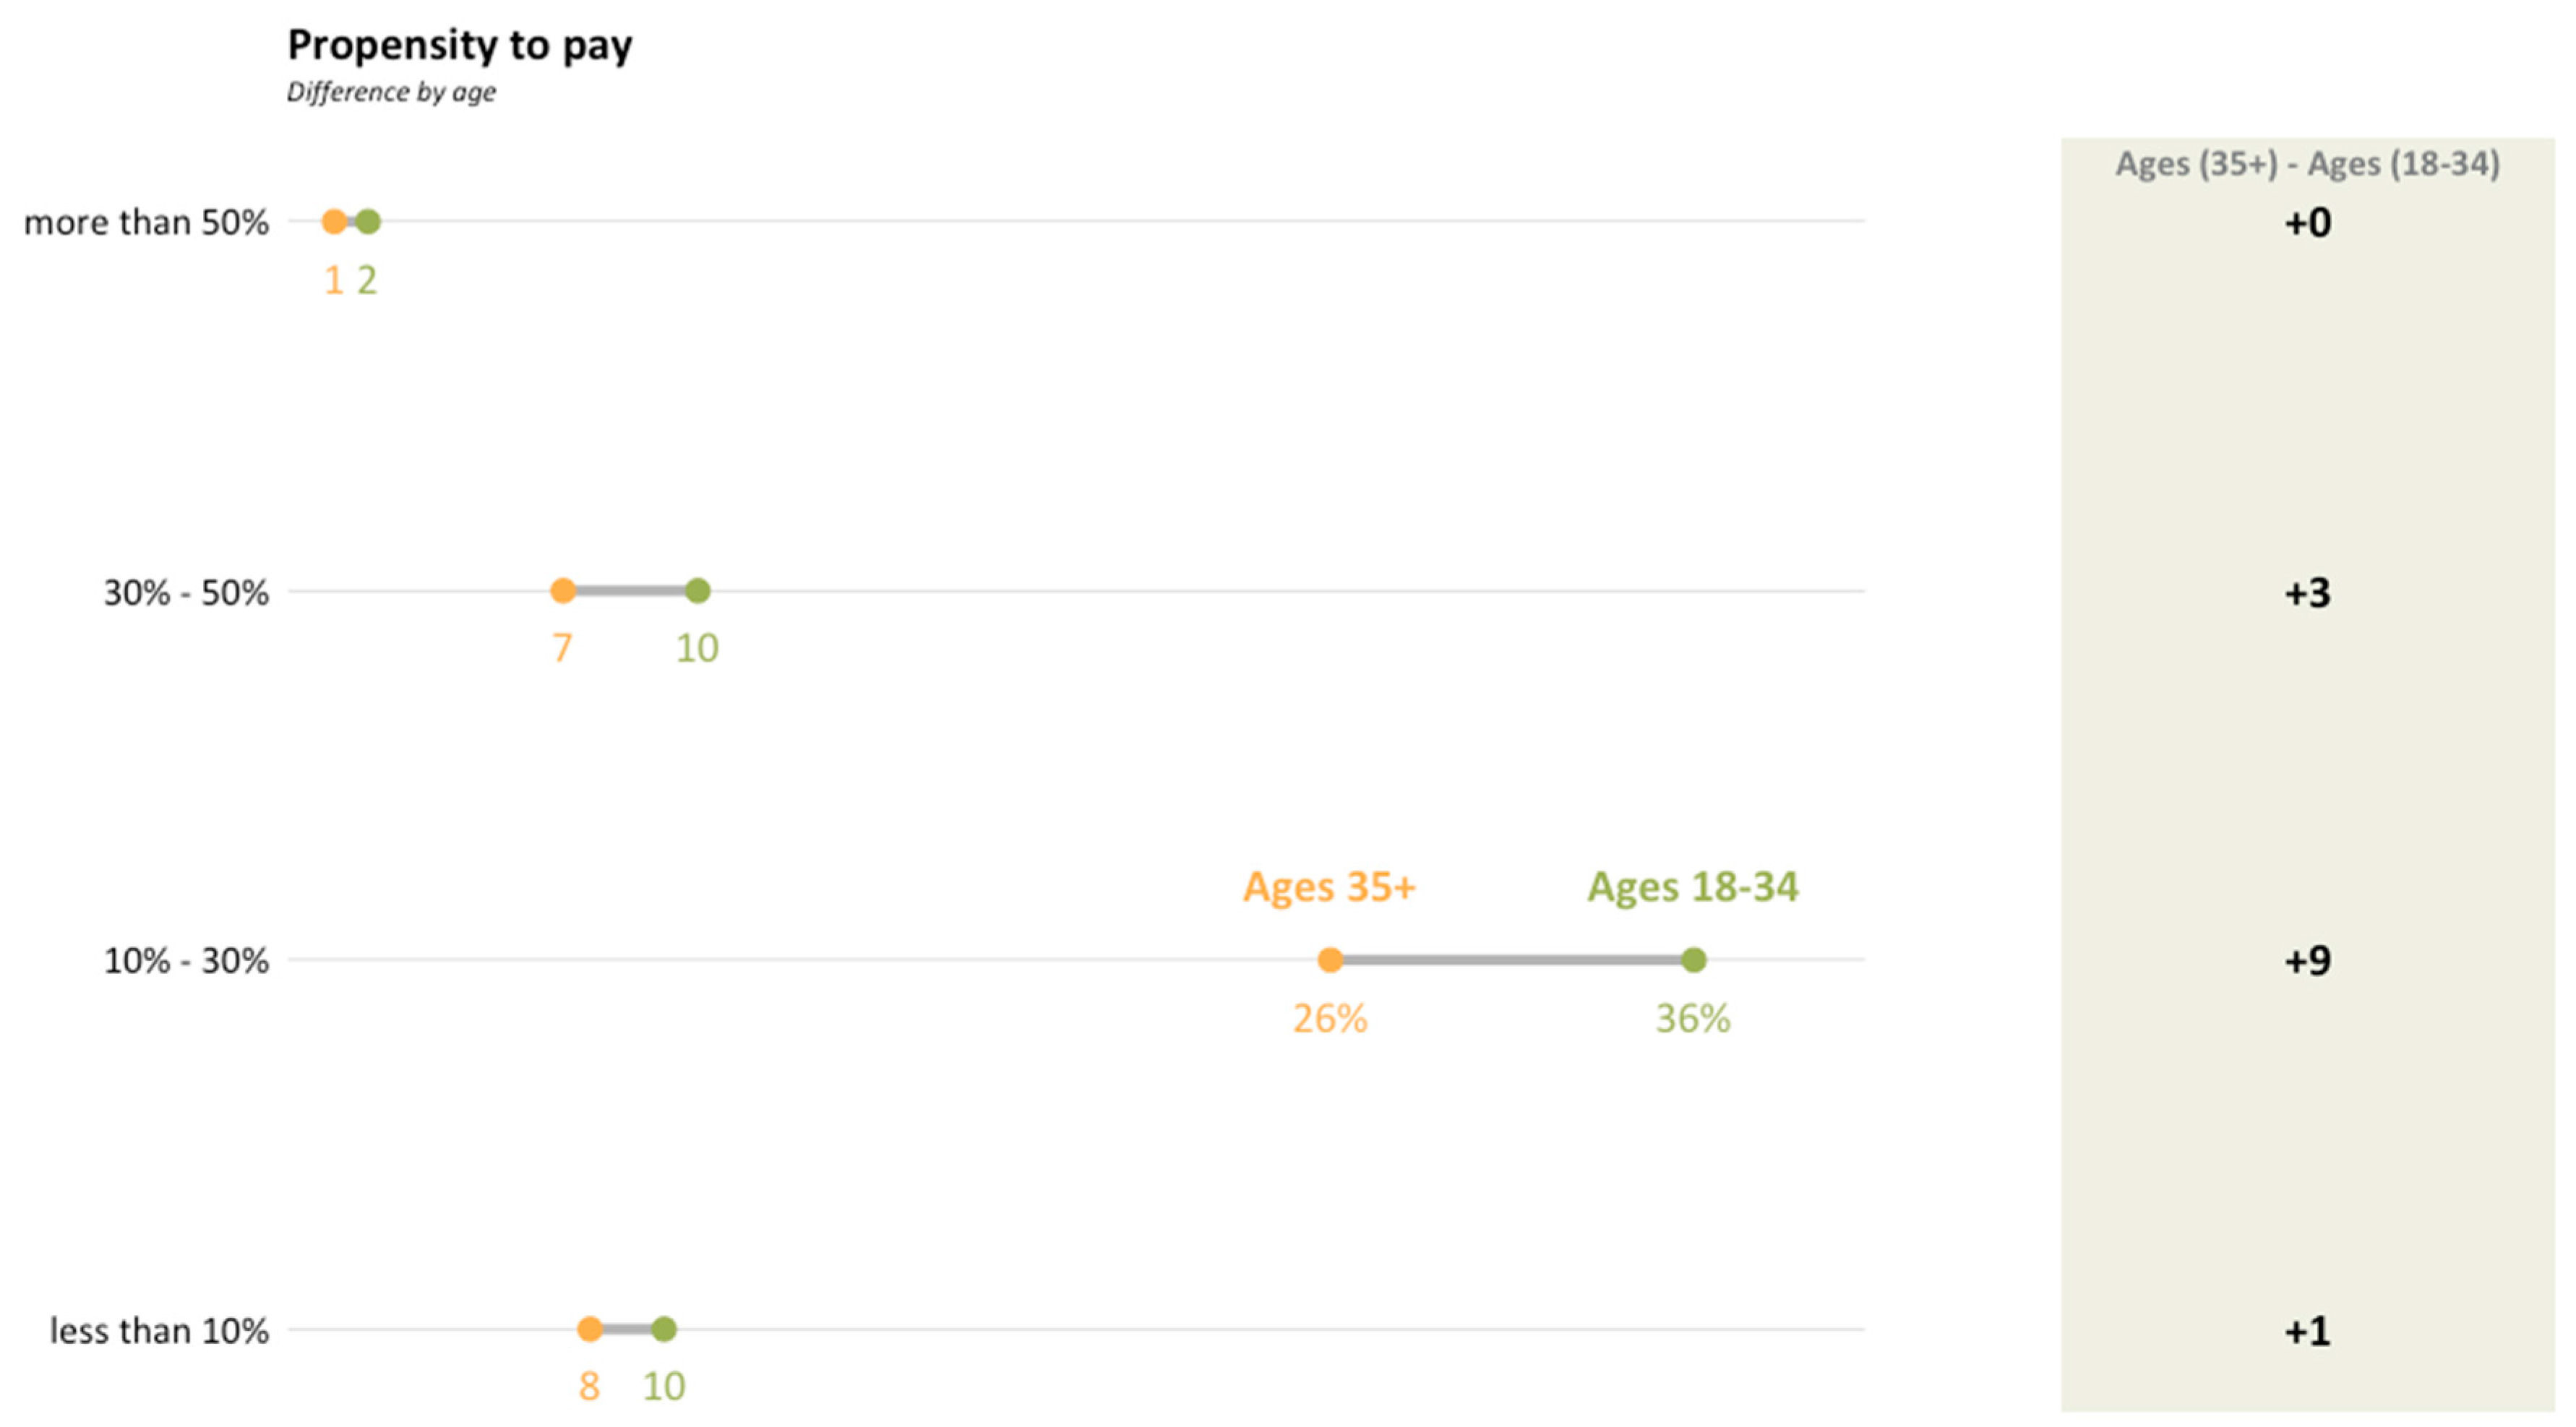
Lastly, a difference in behavior between younger and older consumers emerges only with respect to the premium price level “between 10% and 30%” (36% younger consumers versus 26% older consumers) (Figure 6).
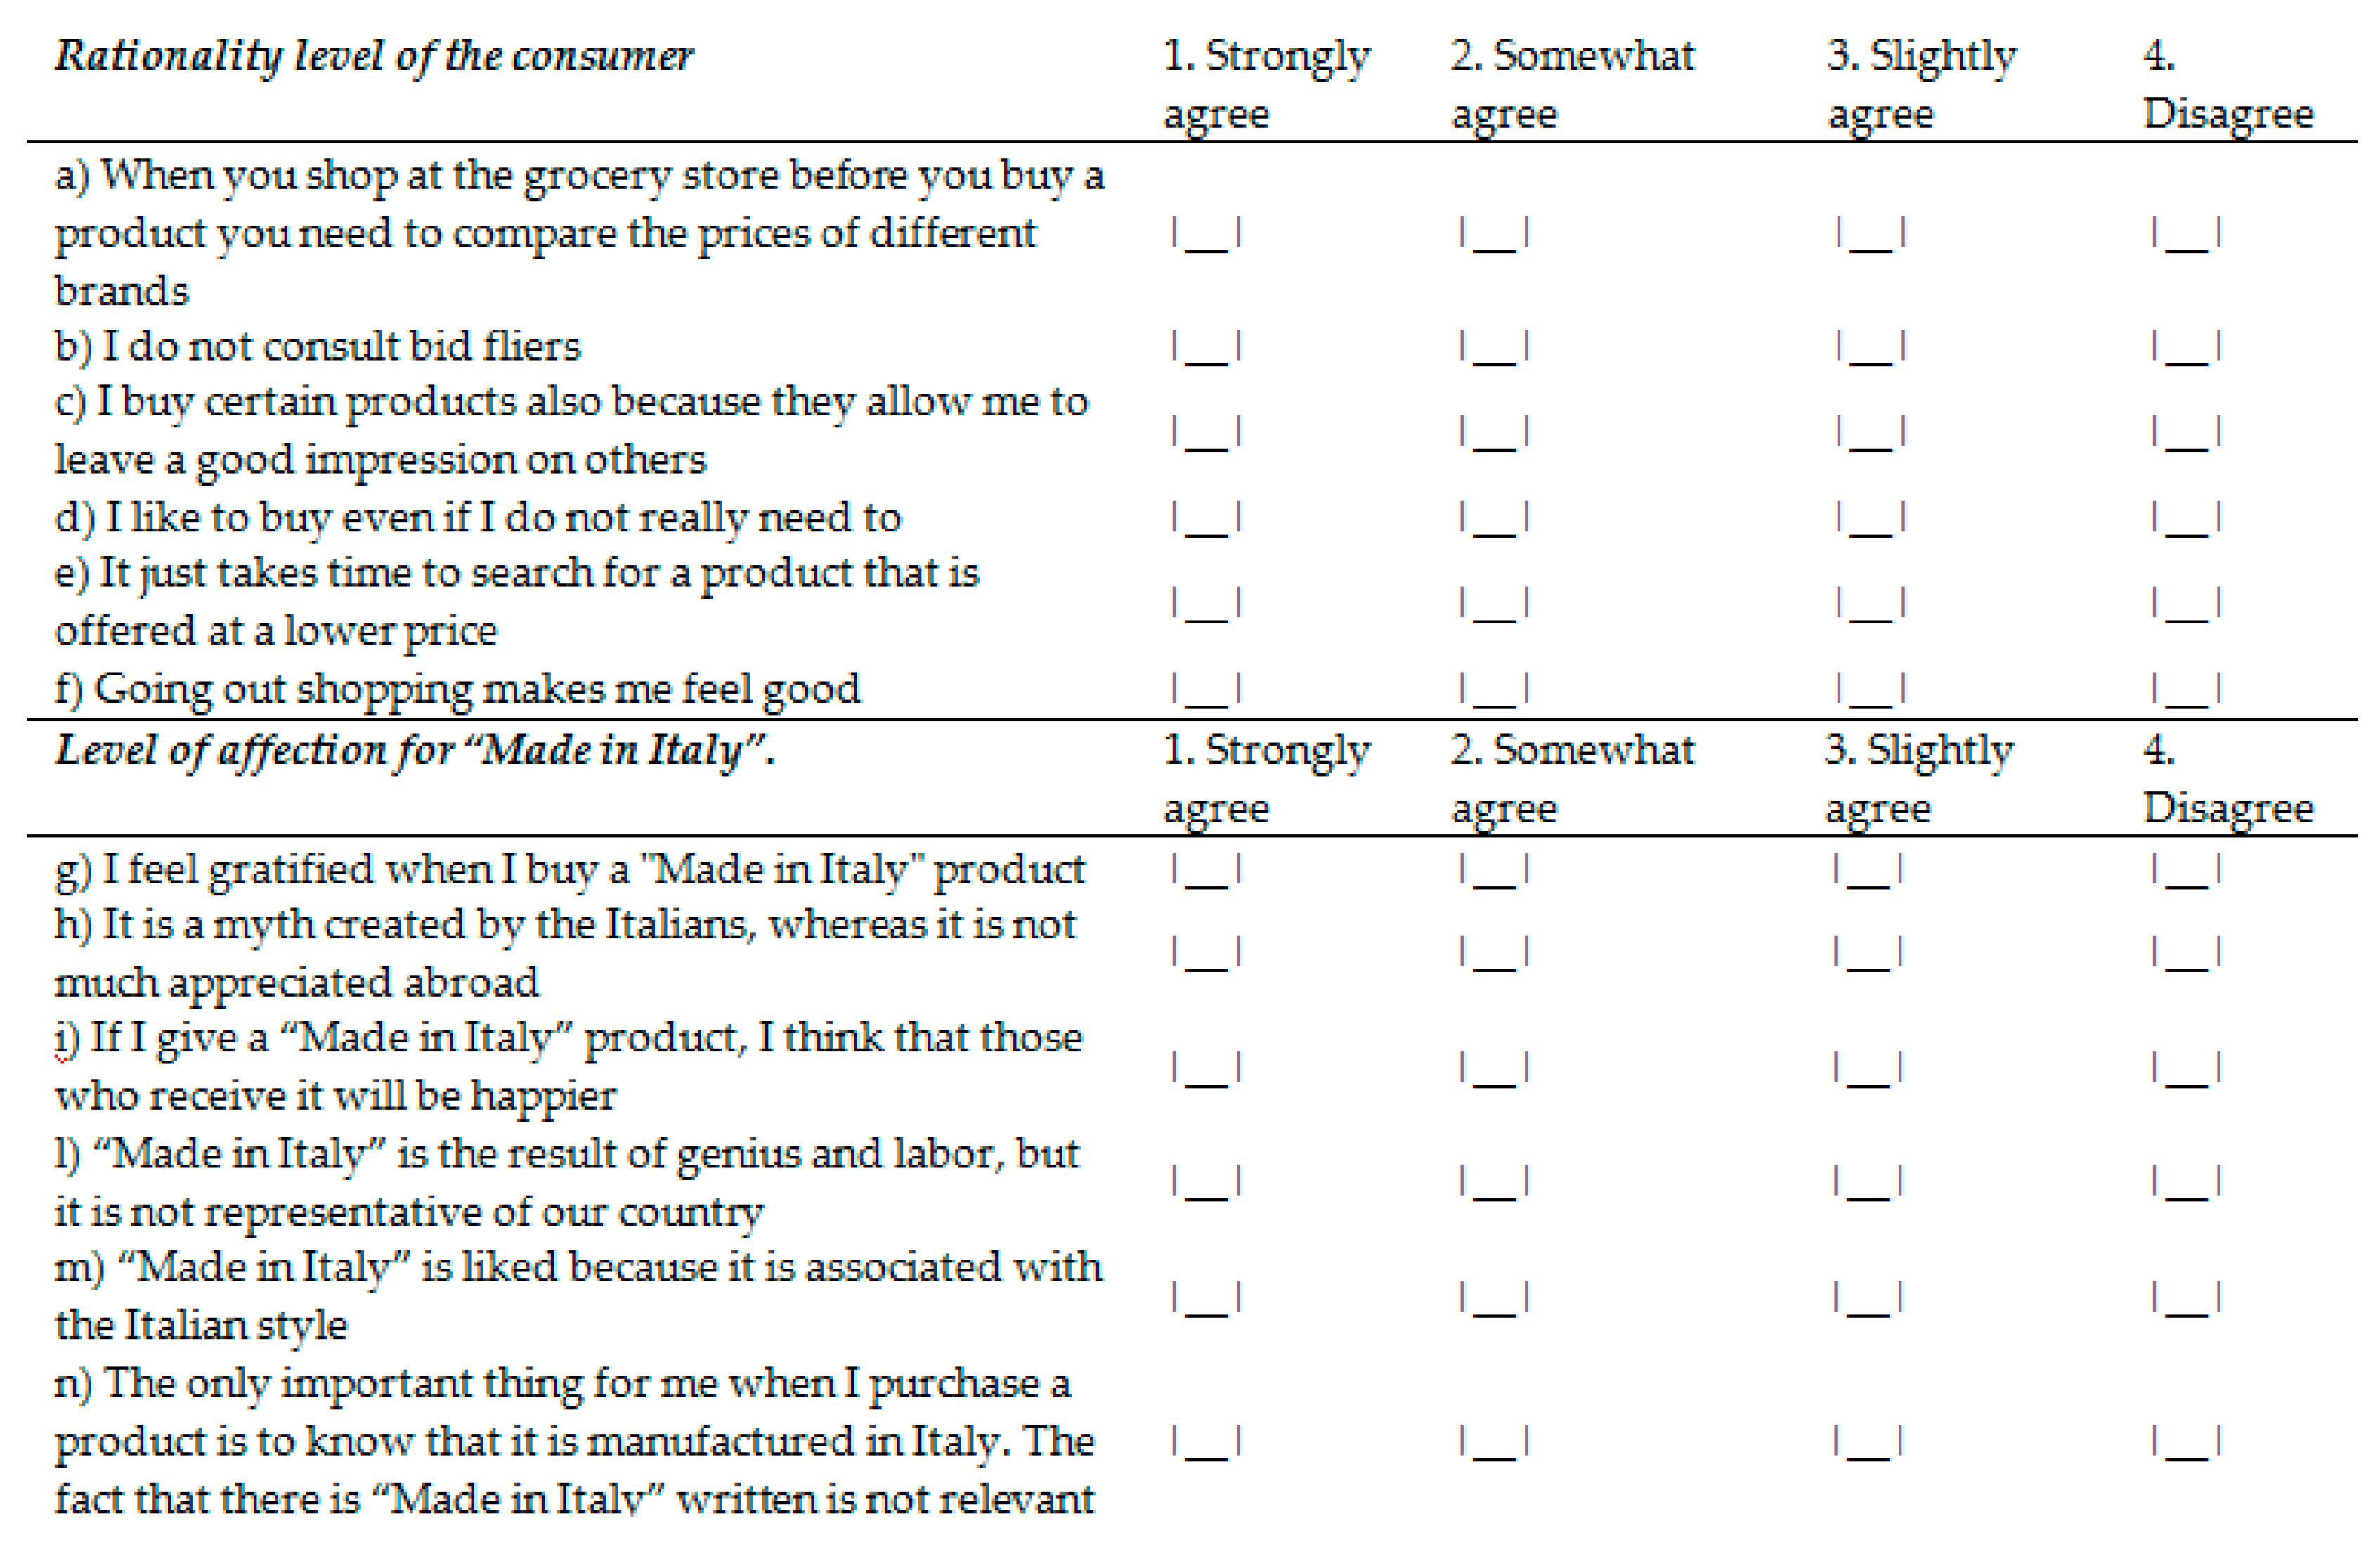
With respect to the perceived image of “Made in Italy” by interviewees, two blocks of statements were constructed, each composed of six items (Figure 7). The first was to indicate the consumer’s level of rationality while the second was to evaluate the level of affection for “Made in Italy” products.
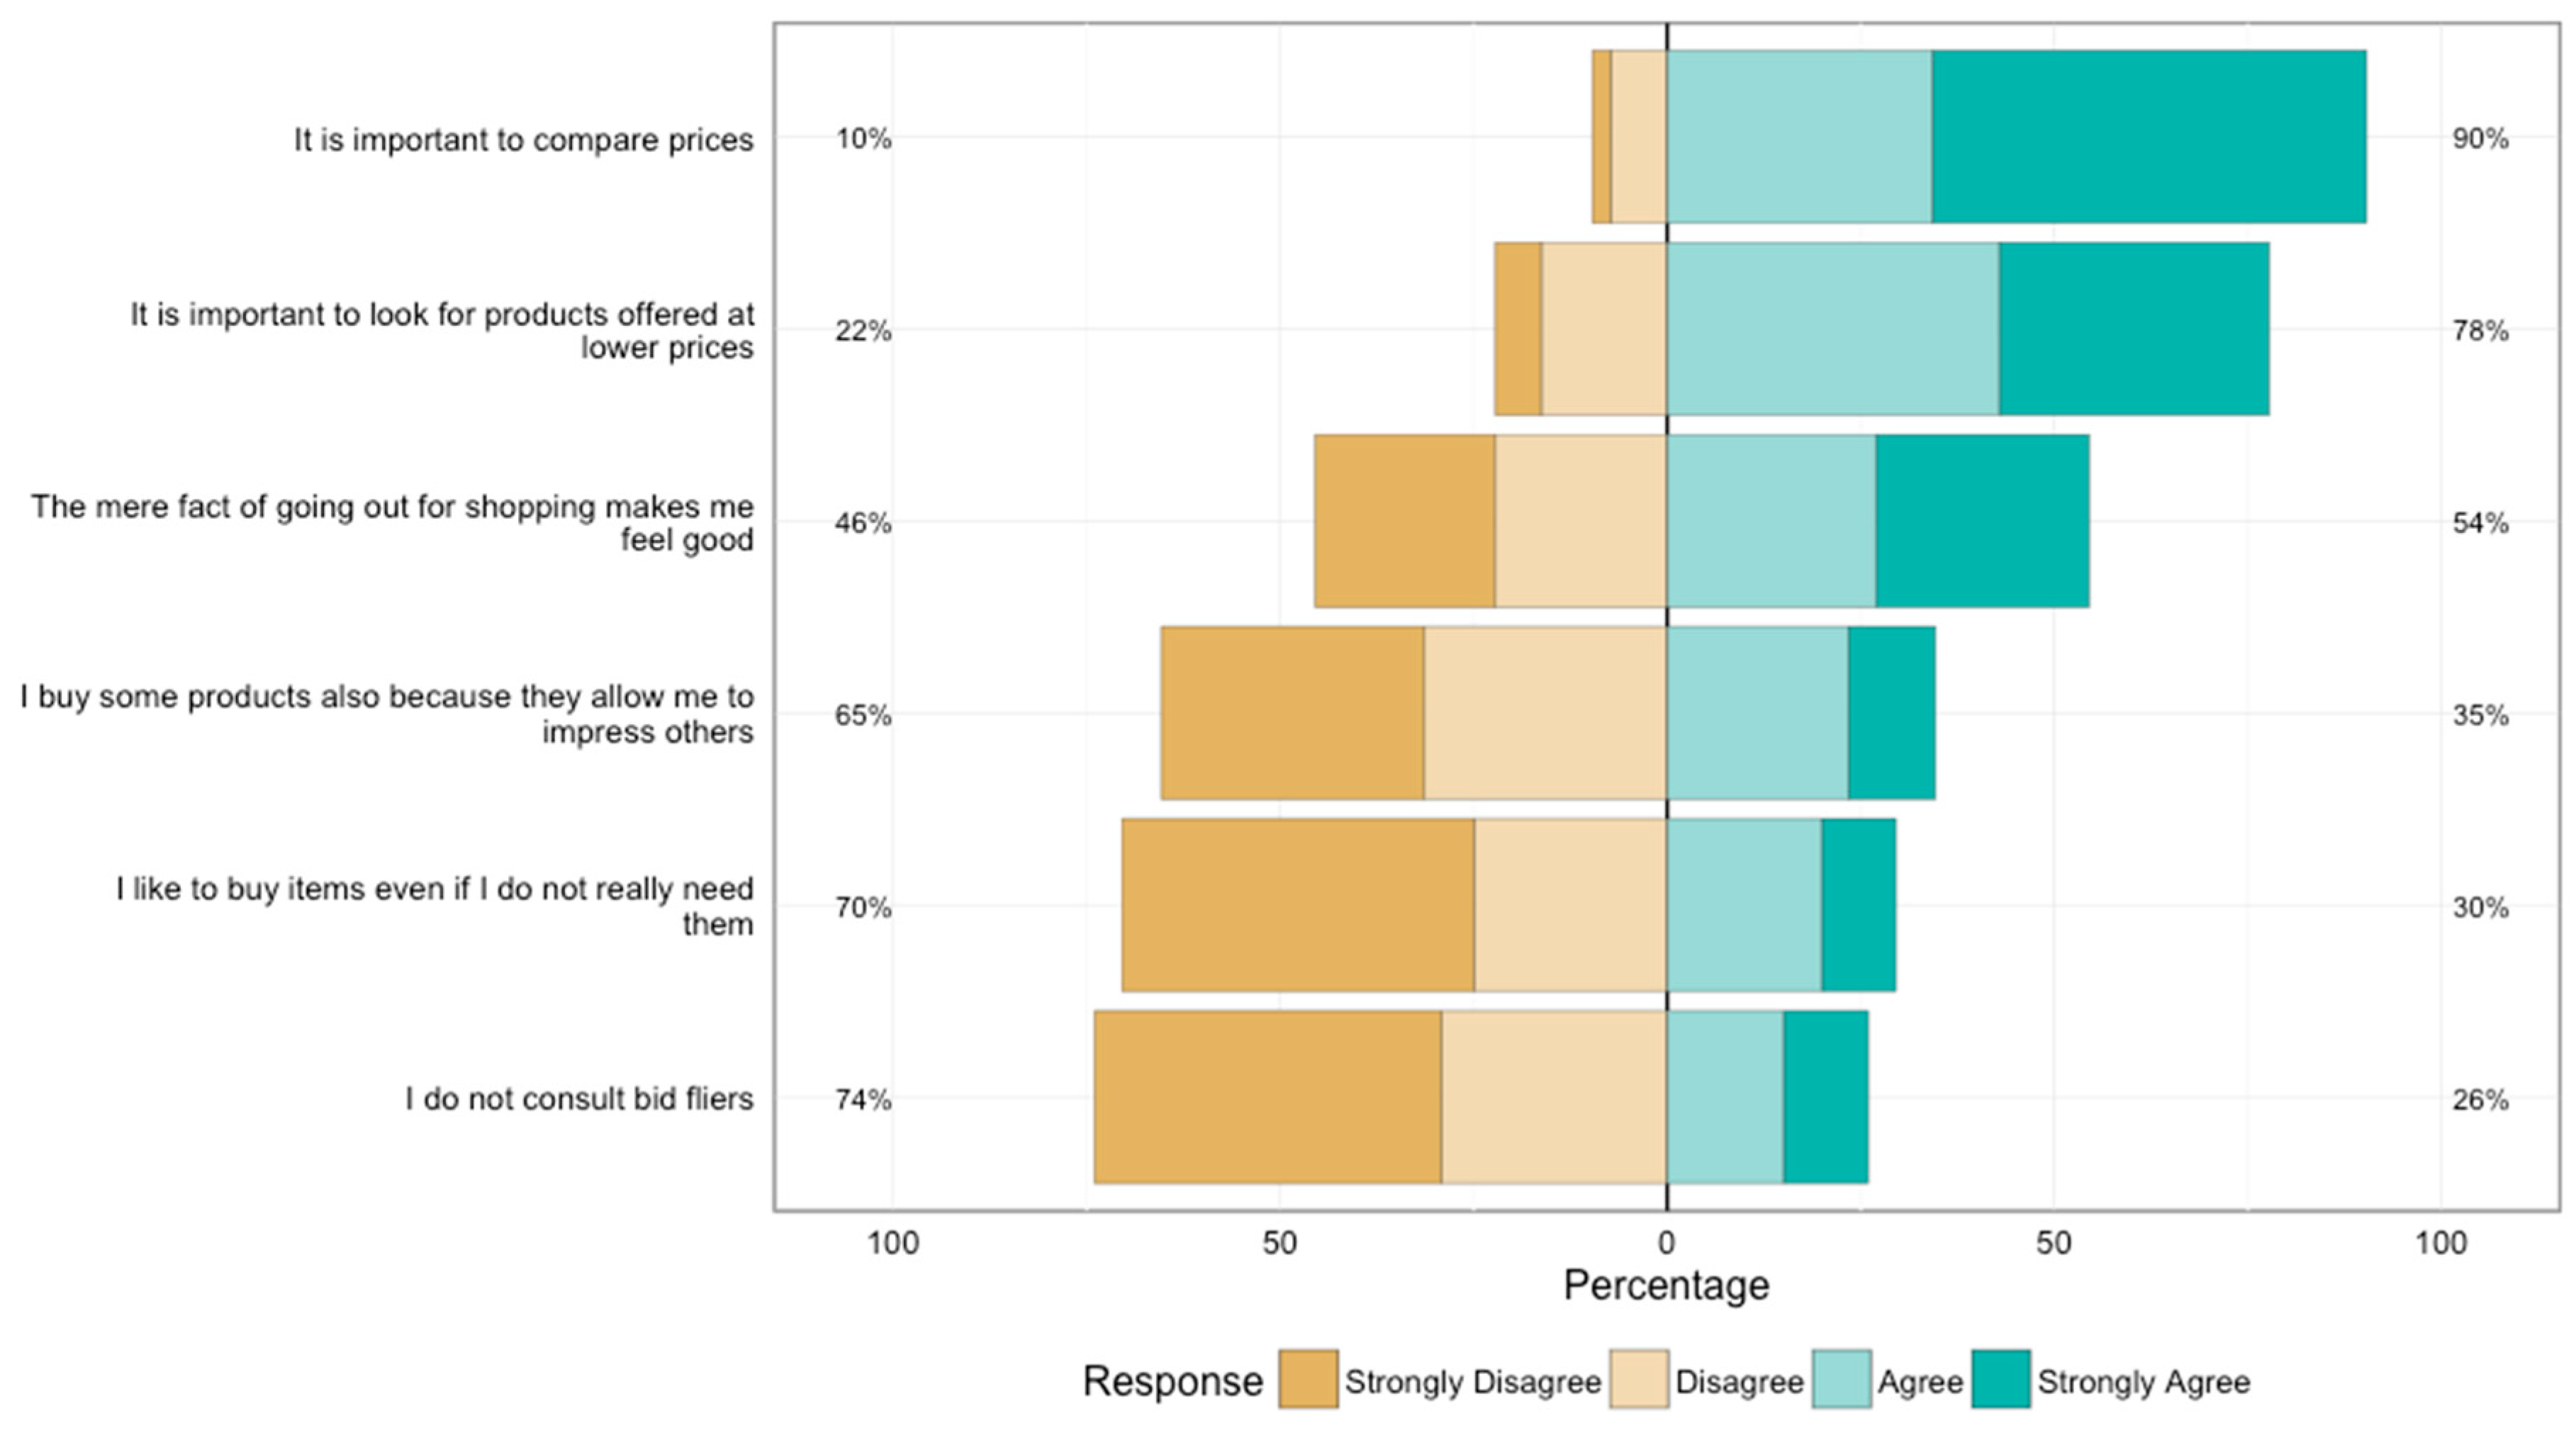
Figure 8 and Figure 9 illustrate the distribution of respondents for the various items in the two batches. Going into detail for the separate items related to the level of consumer rationality, the respondents answer differently in terms of agreement or disagreement with a given statement. Concerning agreement, the item “It is important to compare prices” collects over 90% of respondents, while for disagreement the item “I do not consult bid fliers” collects almost three quarters of respondents, expressing disagreement on the question (Figure 8).
It is worth commenting on the items related to the degree of affection for “Made in Italy”. The statement “I feel gratified when I buy a Made in Italy” product collects 83% agreement among respondents and, consistently, the reverse coded affirmation “It is a myth created by the Italians, whereas it is not much appreciated abroad” collects 86% of the sample in disagreement (Figure 9).
Furthermore, an overall score has been computed for expressing the degree of rationality and the affection for “Made in Italy” in a unique value. The steps are briefly described below: a number is associated with each label related to the individual answer. Clearly, the statements formulated in a reversed direction have been previously recoded. The final score for each subject is the sum of all partial scores related to the individual items [87].
A principal component analysis was carried out with the aim of validating the internal consistency of the two above-mentioned scales of attitude (see Figure 7). Basically, it is a multivariate technique aimed at summarizing most of the redundant information related to the correlation between the original variables (Table 1).
The obtained Coordinates have to be interpreted in terms of correlation between the original variable and the synthesis factors. The table highlights how the items related to the two scales are well separated. The first component explains about 15% of variability, and it is positively correlated with the four statements “gratification”, “international”, “gift”, and “genius”. These are four statements that are all related to the level of affection for “Made in Italy” (the correlation coefficient variables/factors are never less than 0.48). The second component, tied to the statements “compare price”, “flyer”, “pleasure of shopping”, “uselessness”, “status symbol”, and “research best price”, reveals a different dimension to the previous due to the rationality of the interviewee. Also, for the second component, the explained variability stood on the same level as that detected for the first component. The result is encouraging because the list of questions specially designed for this research have proven effective in capturing two distinct and non-overlapping dimensions. Such dimensions are not easily detectable due to the high level of subjectivity that characterizes this kind of attitude. By using the Varimax rotation, two scores were detected for each respondent: the former, related to the first principal component, expresses the respondent’s willingness to rationalize the “Made in Italy” product; the latter, connected to the second component, may instead be interpreted in terms of the respondent’s affection for the “Made in Italy” product. The scores, classified into five categories, were crossed with the year of birth (Table 2 and Table 3) and the gender (Table 4 and Table 5). The last row of each table reports the proportion of respondents who have had at least a medium-high score. Such proportion has been obtained by cumulating the upper middle and high class.
With respect to the cross-classification by age, the highest percentages both for the level of rationality and for the level of affection for “Made in Italy” are observed for the people born between 1964 and 1977. On the contrary, the millennials (born after 1990) show the lowest level of affection for “Made in Italy”.
As additional points that emerged from the data, Table 4 and Table 5 highlight how the majority of respondents are willing to pay a premium price ranging from 10% to 30%. It is worth remembering that Table 4 is related to the level of rationality while Table 5 concerns the level of affection for “Made in Italy”. Both tables refer to a general product.

5. Conclusions

The study provides starting points for reflection and discussion about “Made in Italy”. From a theoretical perspective, the research bridges the gap in the literature since, to our knowledge, no other studies investigating “Made in Italy” products in terms of willingness to pay an additional premium price are available. Furthermore, we have combined and extended the studies concerning “Made in Italy” with other domains, such as Country of Origin, Origin Brand, and Country Image. The linking factor among these different fields was set under the Willingness to Pay a Premium Price. This premium price for “Made in Italy” products was the focus of the empirical investigation, that aimed to quantify the price ranges and their association with the specific sectors.
In summary, “Made in Italy” is a well-established conceptual category in the minds of consumers. There is a significant and important “premium price” recognized by consumers for the three sectors analyzed (food, fashion and furnishings). The “premium price” is not homogeneously recognized for the various sectors analyzed, although a premium price “between 10% and 30%” is the typical value.
Rational consumer choice is not only based on the emotional element, but on a cognitive approach. There is a strong level of consumer rationality towards the purchase of “Made in Italy” products, in particular relating to price comparison, bid fliers and the choice of products offered at lower prices.
Further extensions of the empirical analysis to other areas have been planned for future studies. Another point worthy of future investigation is the relationship between the identification of “Made in Italy” and the willingness to pay by consumers. This, particularly through a differentiation of the specific production areas in order to identify which area of “Made in Italy” is more satisfying for enterprises in terms of consumers’ recognition of premium price.

Acknowledgments

The authors would like to thank the reviewers’ suggestions for their contributions to the research project.

Author Contributions

The authors equally contributed to the reported research in terms of conception and design.

Conflicts of Interest

The authors declare no conflict of interest.

References

  1. Molteni, M.; Todisco, A. Responsabilità sociale d’impresa. In Come le PMI Possono Migliorare le Performance Aziendali Mediante Politiche di CSR; Logiche, Strumenti, Benefici: Milano, Italy, 2008. (In Italian) [Google Scholar]
  2. Bertoli, G.; Resciniti, R. International Marketing and the Country of Origin Effect: The Global Impact of “Made in Italy”; Edward Elgar: Cheltenham, UK, 2012. [Google Scholar]
  3. De Chiara, A. La competitività responsabile nelle PMI: Strategia vincente nei territori “nemici”. Piccola Impresa/Small Bus. 2012, 1, 29–52. (In Italian) [Google Scholar]
  4. Dichter, E. The world customer. Thunderbird Int. Bus. Rev. 1962, 40, 113–123. [Google Scholar] [CrossRef]
  5. Schooler, R.D. Product bias in the central American common market. J. Mark. Res. 1965, 2, 394–397. [Google Scholar] [CrossRef]
  6. Han, C.M. Country Image: Halo or summary construct? J. Mark. Res. 1989, 26, 222–229. [Google Scholar] [CrossRef]
  7. Heimbach, A.E.; Johansson, J.K.; Maclachlan, D.L. Product familiarity, information processing, and COO cues. Adv. J. Consum. Res. 1989, 16, 460–467. [Google Scholar]
  8. Baker, J.M.; Ballington, L. Country-of-origin as a source of competitive advantage. J. Strateg. Mark. 2002, 10, 157–168. [Google Scholar] [CrossRef]
  9. De Nisco, A. Country-of-origin e buyer behavior: Una meta-analisi della letteratura internazionale. Mercati e Competitività 2006, 4, 81–101. [Google Scholar]
  10. De Luca, P.; Pegan, G. La percezione del Made in Italy sui mercati internazionali: Primi risultati di una ricerca “netnografica” sulle comunità online di consumatori di caffè. In Proceedings of the Società Italiana Marketing, Benevento, Italy, 20–21 September 2012. [Google Scholar]
  11. Bursi, T.; Grappi, S.; Martinelli, E. Effetto “Country of Origin”. Un’analisi Comparata a Livello Internazionale Sul Comportamento d’acquisto Della Clientela, 1st ed.; Il Mulino: Bologna, Italy, 2012; pp. 1–204. [Google Scholar]
  12. Bilkey, W.J.; Nes, E. Country-of-origin effects on product evaluations. J. Int. Bus. Stud. 1982, 13, 89–100. [Google Scholar] [CrossRef]
  13. Bannister, J.; Saunders, J. UK consumers’ attitudes towards imports: The measurement of national stereotype image. Eur. J. Mark. 1978, 12, 562–570. [Google Scholar] [CrossRef]
  14. Gaedeke, R. Consumer attitudes toward products “Made in” developing countries. J. Retail. 1973, 49, 13–24. [Google Scholar]
  15. Hampton, G.M. Perceived risk in buying products made in abroad by American firms. Baylor Bus. Stud. 1977, 8, 53–64. [Google Scholar] [CrossRef]
  16. Schooler, R.D. Bias phenomena attendant to the marketing of foreign goods in the U.S. J. Int. Bus. Stud. 1971, 2, 71–80. [Google Scholar] [CrossRef]
  17. Schooler, R.D.; Sunoo, D.H. Consumer perceptions of international products. Soc. Sci. Q. 1969, 49, 886–890. [Google Scholar]
  18. Schooler, R.D.; Wildt, A.R. Elasticity of product bias. J. Mark. Res. 1968, 5, 78–81. [Google Scholar] [CrossRef]
  19. Kincaid, W.M. A Study of the Perception of Selected Brands on Products as Foreign and American Attitudes toward Such Brands. Ph.D. Thesis, University of Texas, Austin, TX, USA, 1970. [Google Scholar]
  20. Yaprak, A. Formulating a Multinational Marketing Strategy: A Deductive Cross-National Consumer Behavior Model. Ph.D. Thesis, Georgia State University, Atlanta, GA, USA, 1978. [Google Scholar]
  21. Baumgartner, G.; Jolibert, A.J. The perceptions of foreign products in France. Adv. Consum. Res. 1978, 5, 603–605. [Google Scholar]
  22. Roth, M.S.; Romeo, J.B. Matching product category and country image perceptions: A framework for managing country-of-origin effects. J. Int. Bus. Stud. 1992, 23, 477–497. [Google Scholar] [CrossRef]
  23. Johansson, J.K.; Douglas, S.P.; Nonanka, I. Assessing the impact of country of origin on product evaluation: A new methodological perspective. J. Mark. Res. 1985, 22, 388–396. [Google Scholar] [CrossRef]
  24. Peterson, R.A.; Jolibert, A.J.P. A meta-analysis of country-of-origin business studies. J. Int. Bus. Stud. 1995, 26, 883–900. [Google Scholar] [CrossRef]
  25. Krishnakumar, P. An Exploratory Study of Influence of Country of Origin on the Product Images of Persons from Selected Countries. Ph.D. Thesis, University of Florida, Gainesville, FL, USA, 1974. [Google Scholar]
  26. Wang, C. The Effects of Foreign Economics, Political and Cultural Environment on Consumer’s Willingness to Buy Foreign Products. Ph.D. Thesis, Texas A&M University, College Station, TX, USA, 1978. [Google Scholar]
  27. Manrai, L.A.; Lascu, D.N.; Manrai, A.K. Interactive effects of country of origin and product category on product evaluations. Int. Bus. Rev. 1998, 7, 591–615. [Google Scholar] [CrossRef]
  28. Thanasuta, K.; Patoomsuwan, T.; Chaimahawong, V.; Chiaravutthi, Y. Brand and country of origin valuations of automobiles. Asia Pac. J. Mark. Logist. 2009, 21, 355–375. [Google Scholar] [CrossRef]
  29. Dornoff, R.J.; Tankersley, C.B.; White, G.P. Consumer’s perception of imports. Akron Bus. Econ. Rev. 1974, 5, 26–29. [Google Scholar]
  30. Tongberg, R.C. An Empirical Study of Relationship between Dogmatism and Consumer Attitudes toward Foreign Products. Ph.D. Thesis, Penn State Universtity, State College, PA, USA, 1972. [Google Scholar]
  31. Brodowsky, G.H. The effects of country of design and country of assembly on evaluative beliefs about automobiles and attitudes toward buying them: A comparison between high and low ethnocentric consumers. J. Int. Consum. Mark. 1998, 10, 85–103. [Google Scholar] [CrossRef]
  32. Balbanis, G.; Diamantopoulos, A. Domestic country bias, country-of-origin effects, and consumer ethnocentrism: A multidimensional unfolding approach. J. Acad. Mark. Sci. 2004, 32, 80–95. [Google Scholar] [CrossRef]
  33. Batra, R.; Ramaswamy, V.; Alden, D.L.; Steenkamp, J.-B.E.M. Effects of brand local and non-local origin on consumer attitudes in developing countries. J. Consum. Psychol. 2000, 9, 83–95. [Google Scholar] [CrossRef]
  34. Dakin, J.A.; Carter, S. Negative image: Developing countries and country of origin—An example from Zimbabwe. Int. J. Econ. Bus. Res. 2010, 2, 166–186. [Google Scholar] [CrossRef]
  35. Lumpkin, J.R.; Crawford, J.C.; Kim, G. Perceived risk as a factor in buying foreign clothes. Int. J. Advert. 1985, 4, 157–161. [Google Scholar] [CrossRef]
  36. Watson, J.; Wright, K. Consumer ethnocentrism and attitudes toward domestic and foreign products. Eur. J. Mark. 2000, 34, 1149–1166. [Google Scholar] [CrossRef]
  37. Ger, G.; Askegaard, S.; Christiensen, A. Experiential nature of product-place images: Image as a narrative. Adv. Consum. Res. 1999, 26, 165–169. [Google Scholar]
  38. Anderson, W.T.; Cunningham, W.H. The socially conscious consumer. J. Mark. 1972, 36, 23–31. [Google Scholar] [CrossRef]
  39. Shimp, T.A.; Sharma, S. Consumer ethnocentrism: Construction and validation of the CETSCALE. J. Mark. Res. 1987, 26, 280–289. [Google Scholar] [CrossRef]
  40. Bailey, W.; Pineres, S. Country of origin attitudes in Mexico: The malinchismo effect. J. Int. Consum. Mark. 1997, 9, 25–41. [Google Scholar] [CrossRef]
  41. Ahmed, S.A.; D’Astous, A. Perceptions of countries as producers of consumer goods. A t-shirt study in China. J. Fash. Mark. Manag. 2004, 8, 187–200. [Google Scholar] [CrossRef]
  42. Obermiller, C.; Spangenberg, E. Exploring the effects of country of origin labels: An Information processing framework. Adv. Consum. Res. 1989, 16, 454–459. [Google Scholar]
  43. Verlegh, P.W.J.; Steenkamp, J.-B.E.M.; Meulenberg, M.T.G. Country-of-origin effects in consumer processing of advertising claims. Int. J. Res. Mark. 2005, 22, 127–139. [Google Scholar] [CrossRef]
  44. Dmitrovic, T.; Vida, I. Consumer behavior induced by product nationality: The evolution of the field and its theoretical antecedents. Transform. Bus. Econ. 2010, 9, 145–165. [Google Scholar]
  45. Andehn, M.; Berg, P.O. Place-of-Origin Effects: A Conceptual Framework Based on a Literature Review; Stockholm University School of Business: Stockholm, Sweden, 2011. [Google Scholar]
  46. Li, W.-K.; Monroe, K.B.; Chan, D.K.S. The effects of country of origin, brand, and price information: A cognitive-affective model of buying intentions. Adv. Consum. Res. 1994, 21, 449–457. [Google Scholar]
  47. Alba, J.W.; Hutchinson, J.W. Dimensions of consumer expertise. J. Consum. Res. 1987, 13, 411–454. [Google Scholar] [CrossRef]
  48. Schaefer, A. Consumer knowledge and country-of-origin effects. Eur. J. Mark. 1997, 31, 56–72. [Google Scholar] [CrossRef]
  49. Papadopoulos, N.; Heslop, L.A. Product and Country Images: Research and Strategy; The Haworth Press: New York, NY, USA, 1993; pp. 1–504. [Google Scholar]
  50. Liefeld, J.P. Consumer knowledge and use of country-of-origin information at the point of purchase. J. Consum. Behav. 2004, 4, 85–96. [Google Scholar] [CrossRef]
  51. Usunier, J.C.; Cestre, G. Product ethnicity: Revisiting the match between products and countries. J. Int. Mark. 2007, 15, 32–72. [Google Scholar] [CrossRef]
  52. Nagashima, A. A comparison of Japanese and US attitudes toward foreign products. J. Mark. 1970, 34, 68–74. [Google Scholar] [CrossRef]
  53. Nagashima, A. Comparative “Made in” product image survey among Japanese businessmen. J. Mark. 1977, 41, 95–100. [Google Scholar] [CrossRef]
  54. Nebenzahl, I.D.; Jaffé, E.D. Measuring the joint effect of brand and country of image in consumer evaluation of global products. Int. Mark. Rev. 1996, 13, 5–22. [Google Scholar] [CrossRef]
  55. Zeugner-Roth, K.P.; Diamantopoulos, A. Advancing the country image construct: Reply to Samiee’s (2009) commentary. J. Bus. Res. 2010, 63, 446–449. [Google Scholar] [CrossRef]
  56. Kotler, P.; Haider, D.H.; Rein, I. Marketing Places; Free Press: New York, NY, USA, 1993. [Google Scholar]
  57. Aiello, G.; Donvito, R. L’immagine paese e l’immagine di marca: Gli esiti di una ricerca empirica sul Made in Italy. In Proceedings of the 10th International Congress Marketing Trends Conference, Paris, France, 20–22 January 2011. (In Italian). [Google Scholar]
  58. Esposito, G.E. Elogio Della Diversità: Made in Italy; Hoepli: Milano, Italy, 2006; p. 49. [Google Scholar]
  59. Varaldo, R. Il Marketing del Made in Italy: Quadro d’insieme, in Carlo Alberto Pratesi, (a cura di) Il Marketing del Made in Italy; Nuovi Scenari e Competitività Franco Angeli: Milano, Italy, 2001. (In Italian) [Google Scholar]
  60. Becattini, G. “Dal “Miracolo Economico al Made in Italy”, in Becattini G. (2000), Dal Distretto Industriale allo Sviluppo Locale; Bollati Boringhieri: Torino, Italy, 2000. (In Italian) [Google Scholar]
  61. Micelli, S.; Di Maria, E. Distretti Industriali e Tecnologie di rete: Progettare la Convergenza; FrancoAngeli: Milano, Italy, 2000. (In Italian) [Google Scholar]
  62. Chiarvesio, M.; Di Maria, E. Internationalization of supply networks inside and outside clusters. Int. J. Oper. Prod. Manag. 2009, 29, 1186–1207. [Google Scholar] [CrossRef]
  63. Fortis, M. Il Made in Italy tra Commercio Leale e Innovazione Industriale. In Proceedings of the II Conferenza Nazionale sul Commercio con l’Estero, Roma, Italy, February 2005. (In Italian). [Google Scholar]
  64. Fortis, M.; Realacci, E. ITALIA: Geografie del Nuovo Made in Italy; Symbola e Fondazione Edison: Milano, Italy, 2009. (In Italian) [Google Scholar]
  65. Aaker, D.A. Managing Brand Equity; The Free Press: New York, NY, USA, 1991. [Google Scholar]
  66. Keller, K.L. Conceptualizing, Measuring, and Managing Customer-Based Brand Equity. J. Mark. Res. 1993, 29, 1–22. [Google Scholar] [CrossRef]
  67. Thakor, M.V.; Kohli, C.S. Brand origin: Conceptualization and review. J. Consum. Mark. 1996, 13, 27–42. [Google Scholar] [CrossRef]
  68. Samiee, S. Consumer evaluation of products in a global market. Int. Bus. Stud. 1994, 25, 579–604. [Google Scholar] [CrossRef]
  69. Samiee, S. Advancing the country image construct—A commentary essay. J. Bus. Res. 2010, 63, 442–445. [Google Scholar] [CrossRef]
  70. Temperini, V.; Gregori, G.L.; Palanga, P. The Brand Made in Italy. A critical Analysis. Manag. Stud. 2016, 4, 93–103. [Google Scholar] [CrossRef]
  71. Prometeia, C. Esportare la Dolce Vita; SIPI Spa: Roma, Italy, 2015. (In Italian) [Google Scholar]
  72. Kotler, P.; Pfoertsch, W. Being known or being one of many: The need for brand management for business to business (B2B) companies. J. Bus. Ind. Mark. 2007, 22, 357–362. [Google Scholar] [CrossRef]
  73. Delgado-Bellester, E.; Munuera-Alemán, J.L. Brand trust in the context of consumer loyalty. Eur. J. Mark. 2001, 35, 1238–1258. [Google Scholar] [CrossRef]
  74. Oberecker, E.M.; Diamantopoulos, A. Consumers’ emotional bonds with foreign countries: Does consumer affinity affect behavioral intentions? J. Int. Mark. 2011, 19, 45–72. [Google Scholar] [CrossRef]
  75. Bernard, Y.; Zarrouk-Karoui, S. Reinforcing willingness to buy and to pay due to consumer affinity towards a foreign country. Int. Manag. Rev. 2014, 10, 57–67. [Google Scholar]
  76. Homburg, C.; Koschate-Fischer, N.; Hoyer, W.D. Do satisfied customers really pay more? A study of the relationship between customer satisfaction and willingness to pay. J. Mark. 2005, 69, 84–96. [Google Scholar] [CrossRef]
  77. Cappelli, L.; D’Ascenzo, F.; Natale, L.; Rossetti, F.; Ruggieri, R.; Vistocco, D. Is the “Made in Italy” a key to success? An empirical investigation. In Proceedings of the Congresso di Scienze Merceolgiche, Viterbo, Italy, 2–4 March 2016. [Google Scholar]
  78. Koschate-Fischer, N.; Diamantopoulos, A.; Oldenkotte, K. Are consumers really willing to pay more for a favorable country image? A study of country-of-origin effects on willingness to pay. J. Int. Mark. 2012, 20, 19–41. [Google Scholar] [CrossRef]
  79. Steenkamp, J.-B.E.M.; Batra, R.; Alden, D.L. How perceived brand globalness creates brand value. J. Int. Bus. Stud. 2002, 34, 53–65. [Google Scholar] [CrossRef]
  80. Team, R.C. R: A Language and Environment for Statistical Computing; R Foundation for Statistical Computing: Vienna, Austria, 2016. [Google Scholar]
  81. Wickham, H. ggplot2: Elegant Graphics for Data Analysis; Springer: New York, NY, USA, 2009. [Google Scholar]
  82. Bryer, J.; Speerschneider, K. Likert: Analysis and Visualization Likert Items; R Package Version 1.3.5.; GitHub: Vienna, Austria, 2016. [Google Scholar]
  83. Fellows, I. Wordcloud: Word Clouds. R Package Version 2014, 2, 109. [Google Scholar]
  84. Hui, M.K.; Zhou, L. Country of manufacture effects for know brands. Eur. J. Mark. 2003, 37, 133–153. [Google Scholar] [CrossRef]
  85. Casacchia, O.; Natale, L. Pregiudizio e Discriminazione Verso Gli Stranieri, Polis, 3; Il Mulino Bologna: Bologna, Italy, 1994. [Google Scholar]
  86. De Santis, G.; Breschi, M. Fecondità Costrizioni Economiche ed Interventi Pubblici in M. Breschi, M.Livi Bacci, (a cura di) La bassa Fecondità Italiana tra Costrizioni Economiche e Cambio di Valori; Forum Editrice: Udine, Italy, 2003. [Google Scholar]
  87. Cacciola, S.; Marradi, A. Costruire il dato. Sulle Tecniche di Raccolta Delle Informazioni Nelle Scienze Sociali, 1st ed.; Franco Angeli Editore: Milano, Italy, 1988; pp. 63–105. [Google Scholar]
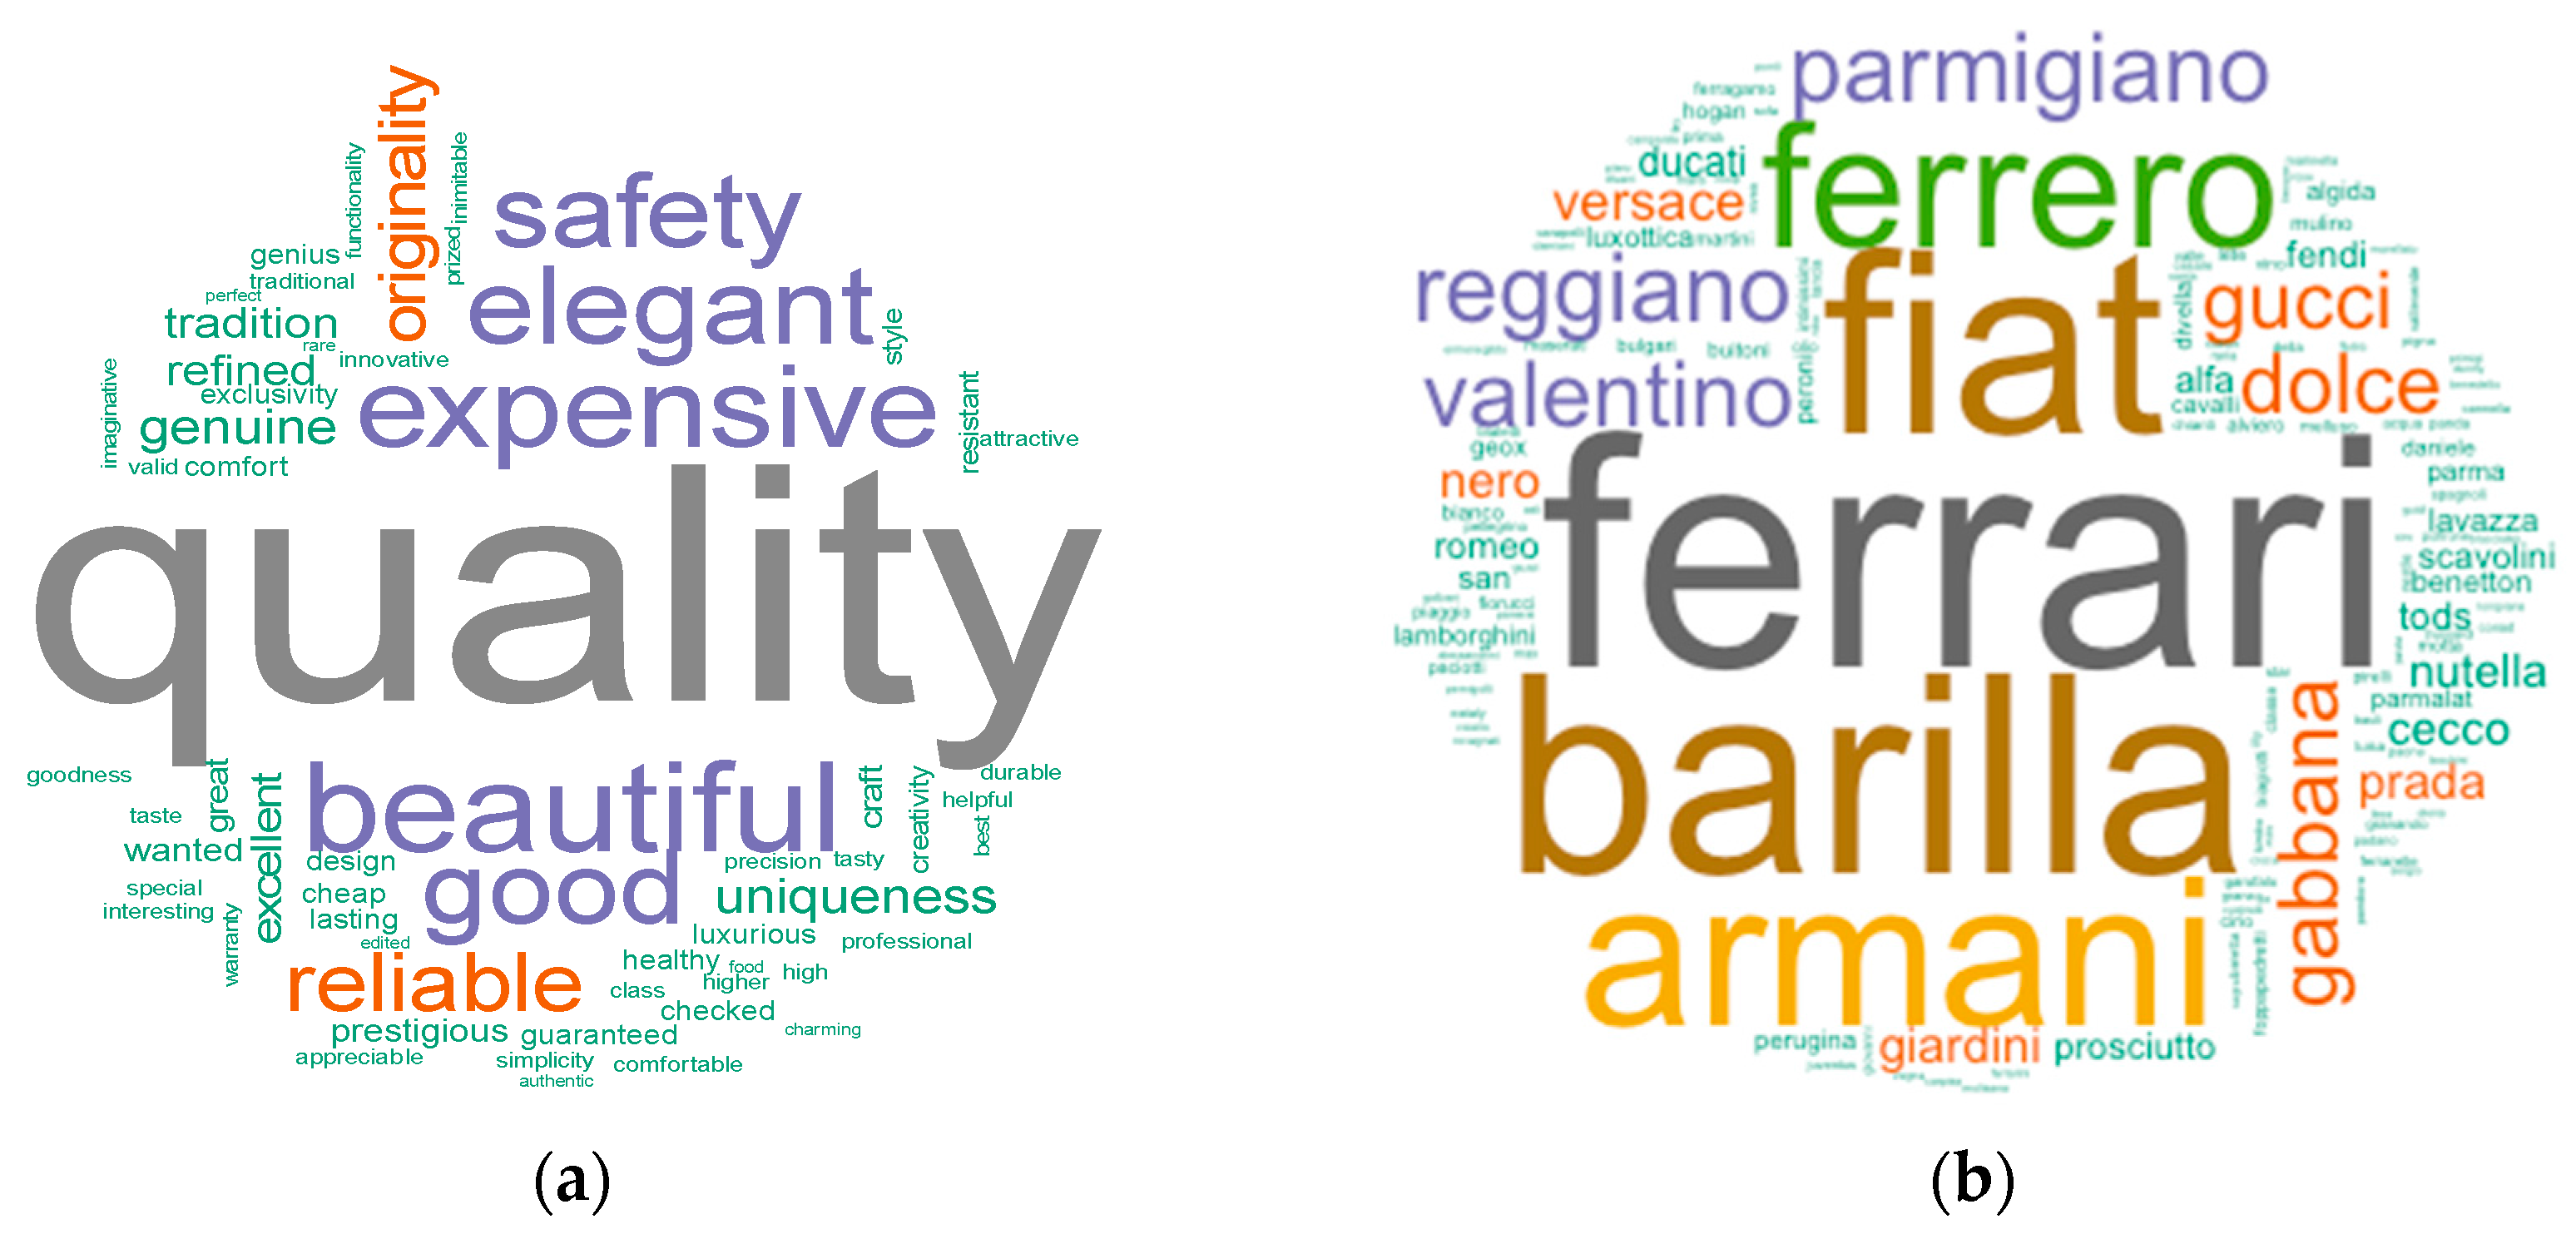
Figure 1. Word Cloud: The perception of “Made in Italy” characteristics and the principal brand. (a) The top 3 adjectives that come to mind when talking about “Made in Italy”; (b) The top 3 brands that come to mind when talking about “Made in Italy”.
Sustainability 09 00556 g001
Figure 2. Distribution of interviewees according to the “sentiment thermometer”.
Sustainability 09 00556 g002
Figure 3. Distribution of interviewees according to the “sentiment thermometer”, by gender.
Sustainability 09 00556 g003
Figure 4. Propensity to pay by gender (%).
Sustainability 09 00556 g004
Figure 5. Propensity to pay by education (%).
Sustainability 09 00556 g005
Figure 6. Propensity to pay by age (%).
Sustainability 09 00556 g006
Figure 7. Now I will read some statements out to you. Could you express your agreed level? (Read out each item).
Sustainability 09 00556 g007
Figure 8. Respondents according to the level of affection based on the questions about the consumer’s rationality.
Sustainability 09 00556 g008
Figure 9. Respondents according to their level of agreement to the questions on the affection for “Made in Italy”.
Sustainability 09 00556 g009
Table 1. Correlation statements/component to the type of statement.
StatementFirst Principal ComponentSecond Principal Component
COMPARE_PRICES0.070.44
FLYER0.360.41
STATUS_SYMBOL−0.170.45
USELESSNESS0.080.61
RESEARCH_BEST_PRICE0.260.46
PLEASURE_OF_SHOPPING0.010.57
GRATIFICATION0.71−0.27
INTERNATIONAL0.520.18
GIFT0.73−0.18
GENIUS0.480.08
LIFESTYLE0.16−0.33
ITALIAN_ORIGIN−0.010.13
Table 2. Rationality level of consumers: distribution by year of birth.
≤19631964–19771978–19901990≥Tot.
Lower19.3%15.8%21.8%22.8%20.0%
Lower-middle17.4%18.0%21.1%24.2%20.1%
Medium24.8%23.7%17.7%12.8%19.8%
Medium-high18.0%15.8%19.7%26.2%20.0%
High20.5%26.6%19.7%14.1%20.1%
Tot.100.0%100.0%100.0%100.0%100.0%
% ≥ medium-high38.5%42.4%39.5%40.3%40.1%
Table 3. Affection level for “Made in Italy”: distribution by year of birth.
≤19631964–19771978–19901990≥Tot.
Lower23.6%15.8%17.7%21.5%19.8%
Lower-middle17.4%20.1%19.7%24.2%20.3%
Medium17.4%21.6%21.8%19.5%20.0%
Medium-high23.0%18.7%17.0%20.8%20.0%
High18.6%23.7%23.8%14.1%20.0%
Tot.100.0%100.0%100.0%100.0%100.0%
% ≥ medium-high41.6%42.4%40.8%34.9%39.9%
Table 4. Rationality level: distribution by premium amount. General Framework.
Add a Premium in the Order of
From 10% to 30%From 30% to 50%≤10%≥50%Tot.
Lower65.5%17.6%12.6%3.4%100.0%
Lower-middle66.9%9.9%19.0%4.1%100.0%
Medium62.2%21.0%15.1%1.7%100.0%
Medium-high58.0%18.5%21.0%2.5%100.0%
High57.5%20.0%18.3%4.2%100.0%
Tot.62.0%17.4%17.2%3.2%100.0%
Table 5. Affection level for “Made in Italy”: distribution by premium amount. General Framework.
Add a Premium in the Order of
From 10% to 30%From 30% to 50%≤10%≥50%Tot.
Lower65.0%16.7%17.5%0.8%100.0%
Lower-middle63.6%14.0%19.0%3.3%100.0%
Medium64.4%19.5%15.3%0.8%100.0%
Medium-high59.7%21.0%16.0%2.5%100.0%
High57.5%15.8%18.3%8.3%100.0%
Tot.62.0%17.4%17.2%3.2%100.0%