Article

The Development of the Renewable Energy Power Industry under Feed-In Tariff and Renewable Portfolio Standard: A Case Study of China’s Photovoltaic Power Industry

1
School of Economics and Management, North China Electric Power University, Beijing 102206, China
2
State Grid Liaoning Electric Power Co., Ltd., Benxi Power Supply Company, Benxi 117020, China
*
Author to whom correspondence should be addressed.
Sustainability 2017, 9(4), 532; https://doi.org/10.3390/su9040532
Submission received: 7 March 2017 / Revised: 28 March 2017 / Accepted: 29 March 2017 / Published: 31 March 2017

Abstract

:
Among the regulatory policies, feed-in tariffs (FIT) and renewable portfolio standards (RPS) are the most popular to promote the development of renewable energy power industry. They can significantly contribute to the expansion of domestic industrial activities in terms of sustainable energy. In this paper, we synthetically consider various important factors with the analysis of the existing literature, and use system dynamics (SD) to establish models of long-term development of the renewable energy power industry under FIT and RPS schemes. The model not only clearly shows the complex logical relationship between the factors but also reveals the process of coordination between the two policy tools in the development of the renewable energy power industry. In addition, as an example of development of renewable energy industry, the paper studies the development of China’s photovoltaic power industry under different scenarios. The models proposed in this paper can provide a reference for scholars to study development of the renewable energy power industry in different countries, thereby facilitating an understanding of the renewable energy power’s long-term sustainable development pattern under FIT and RPS schemes, and helping to provide references for policy-making institutions. The results show that in the perfect competitive market, the implementation of RPS can promote long-term and rapid development of China’s photovoltaic power industry given the constraints and actions of the mechanisms of RPS quota proportion, the TGC valid period, and fines, compared with FIT. At the end of the paper, policy implications are offered as references for the government.

1. Introduction

1.1. Background

Countries around the world have developed many technologies and proposed various policies to promote the development of renewable energy such as large-scale energy storage [1], feed-in tariffs (FIT) and renewable portfolio standards (RPS). Large-scale energy storage is a practical solution in adopting renewable energy resources in power grid as an important technology [2], and many countries have considered it as a viable solution to increase the contribution of renewable energy resources [3,4]. Renewable energy policies can also significantly contribute to the expansion of domestic industrial activities in terms of sustainable energy [5]. Among the regulatory policies, FIT and RPS are the most popular. More than 60 countries and regions worldwide have implemented one or other of the two policies [6]. FIT and RPS have common attributes, in that both are policy tools with dual characteristics of government intervention and market regulation.
FIT policy, represented by China, South America, and most European countries, is a scheme designed to accelerate investment in renewable energy technologies. It is a government-led regulatory mechanism that requires power grid enterprises to buy electricity from renewable energy producers at government-specified prices. In the early stages of renewable energy development, it ensured the sale of renewable energy at a protected price, ensuring that the high costs of electricity generation associated with certain renewable energy technologies do not prohibit the development and use of those technologies, eliminating the usual uncertainties and risks of renewable energy [7]. The goal of the FIT is to offer cost-based compensation to renewable energy producers, providing them with price certainty and long-term contracts that help finance renewable energy investments [8].
RPS policy, represented by the United Kingdom, Belgium, and multiple states in the USA, is a main promotion scheme of a quota obligation on electricity suppliers to supply an increasing proportion of their electricity from renewable sources [9]. It is structured as a quantity regulation, letting the market determine a reasonable price for renewable energy power. In this approach, governments set targets or quotas to ensure that power grid enterprises purchase a certain market share of capacity or generation of electricity coming from renewable energy sources. In most cases, governments create tradable green certificates (TGC) to track the fulfillment of quotas [10]. The competitive market determines the transaction price. The advantage of RPS policy is that it is a framework policy that is easy to integrate with other policy measures and can be implemented in conjunction with the FIT.
Renewable electricity production is in China at present supported by a FIT support scheme. Taking China’s photovoltaic power as an example, the National Development and Reform Commission (NDRC) issued the Notice on Improving Feed-in Tariff of Photovoltaic Power in July 2011, to standardize photovoltaic power prices within a particular area [11]. The main contents of the notice cover two aspects: one of these is that photovoltaic power FIT would be applied according to different solar resources’ areas, and the other is that the photovoltaic power price cost sharing system would be implemented continually. However, the current situation is likely to change in the future. Along with the economic transformation and adjustment of its industrial structure, China has implemented new power system reforms. The NDRC issued the Notice on Trial Implementation of Renewable Energy Tradable Green Certificate Issuance and Voluntary Subscription Trading System on 18 January 2017 [12]. The notice stipulates that the wind power and photovoltaic power sectors trial RPS policy from 1 July 2017, and that all renewable energy resources must subscribe to TGC from 1 January 2018. The introduction of RPS policy will greatly change the renewable energy power industry in China, and there are many important problems worth studying, such as the direction of the development of renewable energy power in the long term under the two policy schemes, potential problems that may arise during the development process, and future policy-making.

1.2. Literature Review

Many scholars have built various models to study the renewable energy power industry under FIT and RPS schemes. Some scholars have used multi-objective programming approaches to serve the decision makers in the renewable energy industry. Ziaii et al. [13] emphasize a method that integrates the backward dynamic programming algorithm and Least-Squares Monte Carlo method to assess the optimal levels of FIT for photovoltaic power generation industry in China. Ritzenhofen et al. [14] quantitatively compare the impact of RPS and FIT on renewable energy power industry via a dynamic long-term capacity investment model, which includes various objects and constraints. Some scholars have used bottom up models. Bianco et al. [15] develop a long-term consumption forecasting model to study the influence of FIT variables on energy industry in Italy. Farooq et al. [16] analyze the potential of renewable energy for power generation under RPS scheme in Pakistan using a bottom up type of long term energy system based on the MARKAL framework. Other models have also been used. Sun and Nie [6] establish a two-stage model to compare the effect of FIT and RPS on renewable energy power industry. Dong [10] examines the relative effectiveness of FIT and RPS in promoting wind power industry’s development using non-linear econometric and statistical model with panel data.
Numerous system dynamics (SD) simulation models built by scholars have been developed and applied successfully to a variety of problems related to energy planning and management [17]. Ford et al. [18] simulate the TGC price dynamics of a market designed to support an aggressive mandate for wind power generation in the northwestern USA. Naill [19] describes the conceptual development of the SD model of U.S. energy supply and demand, and its use in analyzing national energy policy issues. Ford [20] shares reflections on why SD practitioners have been successful in energy power industry. Ochoa [21] uses SD models to study various aspects of security of energy supply faced by the Swiss electricity market. Ponzo et al. [22] establish a SD model to analyze the regulation and intervention in the markets affect the long-term prospect for the secure supply of gas in Argentina. Olaya and Dyner [23] address SD models considered for the assessment of policy options in the natural gas industry in Colombia, which focus on both modeling and policy, specifically with respect to industry sustainability and environmental impacts.

1.3. Rationale and Structure of the Paper

In the existing literature, scholars have presented various methods to provide useful analysis for renewable energy industry’s development under FIT and RPS schemes. However, the dynamics of development of the renewable energy industry are complex. Most of the literature examines the static impact of a single factor on renewable energy power industry’s development, and few examples visually indicate the complex relationship between various important factors and long-term renewable energy power industry’s development. Thus, our goal is to fill this gap. In this paper, we synthetically consider various important factors with the analysis of the existing literature, and use SD to establish models of long-term development of the renewable energy power industry under FIT and RPS schemes. The model not only clearly shows the complex logical relationship between the factors but also reveals the process of coordination between the two policy tools in renewable energy power industry’s development. In addition, as an example of development of renewable energy industry, the paper studies the development of China’s photovoltaic power industry under different scenarios. The models proposed in this paper can provide a reference for scholars to study development of the renewable energy power industry in different countries, thereby facilitating an understanding of the renewable energy power’s long-term sustainable development pattern under FIT and RPS schemes, and helping to provide references for policy-making institutions. The structure of this paper is as follows. Section 2 establishes the models of development of the renewable energy power industry under FIT and RPS schemes. Section 3 carries out data analysis, presents the results of simulations of different scenarios, and conducts a sensitivity analysis in case of China’s photovoltaic power industry. Section 4 is the discussion, and conclusions and policy implications are shown in Section 5.

2. Methodology

SD is a systems modeling and dynamic simulation methodology for the analysis of dynamic complexities in socio-economic and biophysical systems with long-term, cyclical, and low-precision requirements [24]. Through the complex relationship between the various elements of the system, SD establishes a relatively effective model, which can achieve the predetermined goal and meet the predetermined requirements. Based on the principle of system thinking and feedback control theory, SD helps understand the time-varying behavior of complex systems [25]. The development of the renewable energy power industry under FIT and RPS represents a dynamic system that contains a range of factors, including investment, cost, installed capacity, quota, TGC price, and TGC demand and supply (Figure 1). These factors affect and restrict each other and determine the behavior mode of TGC suppliers and demanders (for details, please see [18]). Development of the renewable energy power industry under FIT and RPS involves multivariable, high order, and nonlinear, dynamic feedback complex systems, with obvious SD characteristics. Although other types of quantitative modeling can be used for the impact analysis, the SD model, which has the advantage of solving dynamic problems, can better simulate the process of development of the renewable energy power industry [26].

2.1. Theoretical Framing Analysis

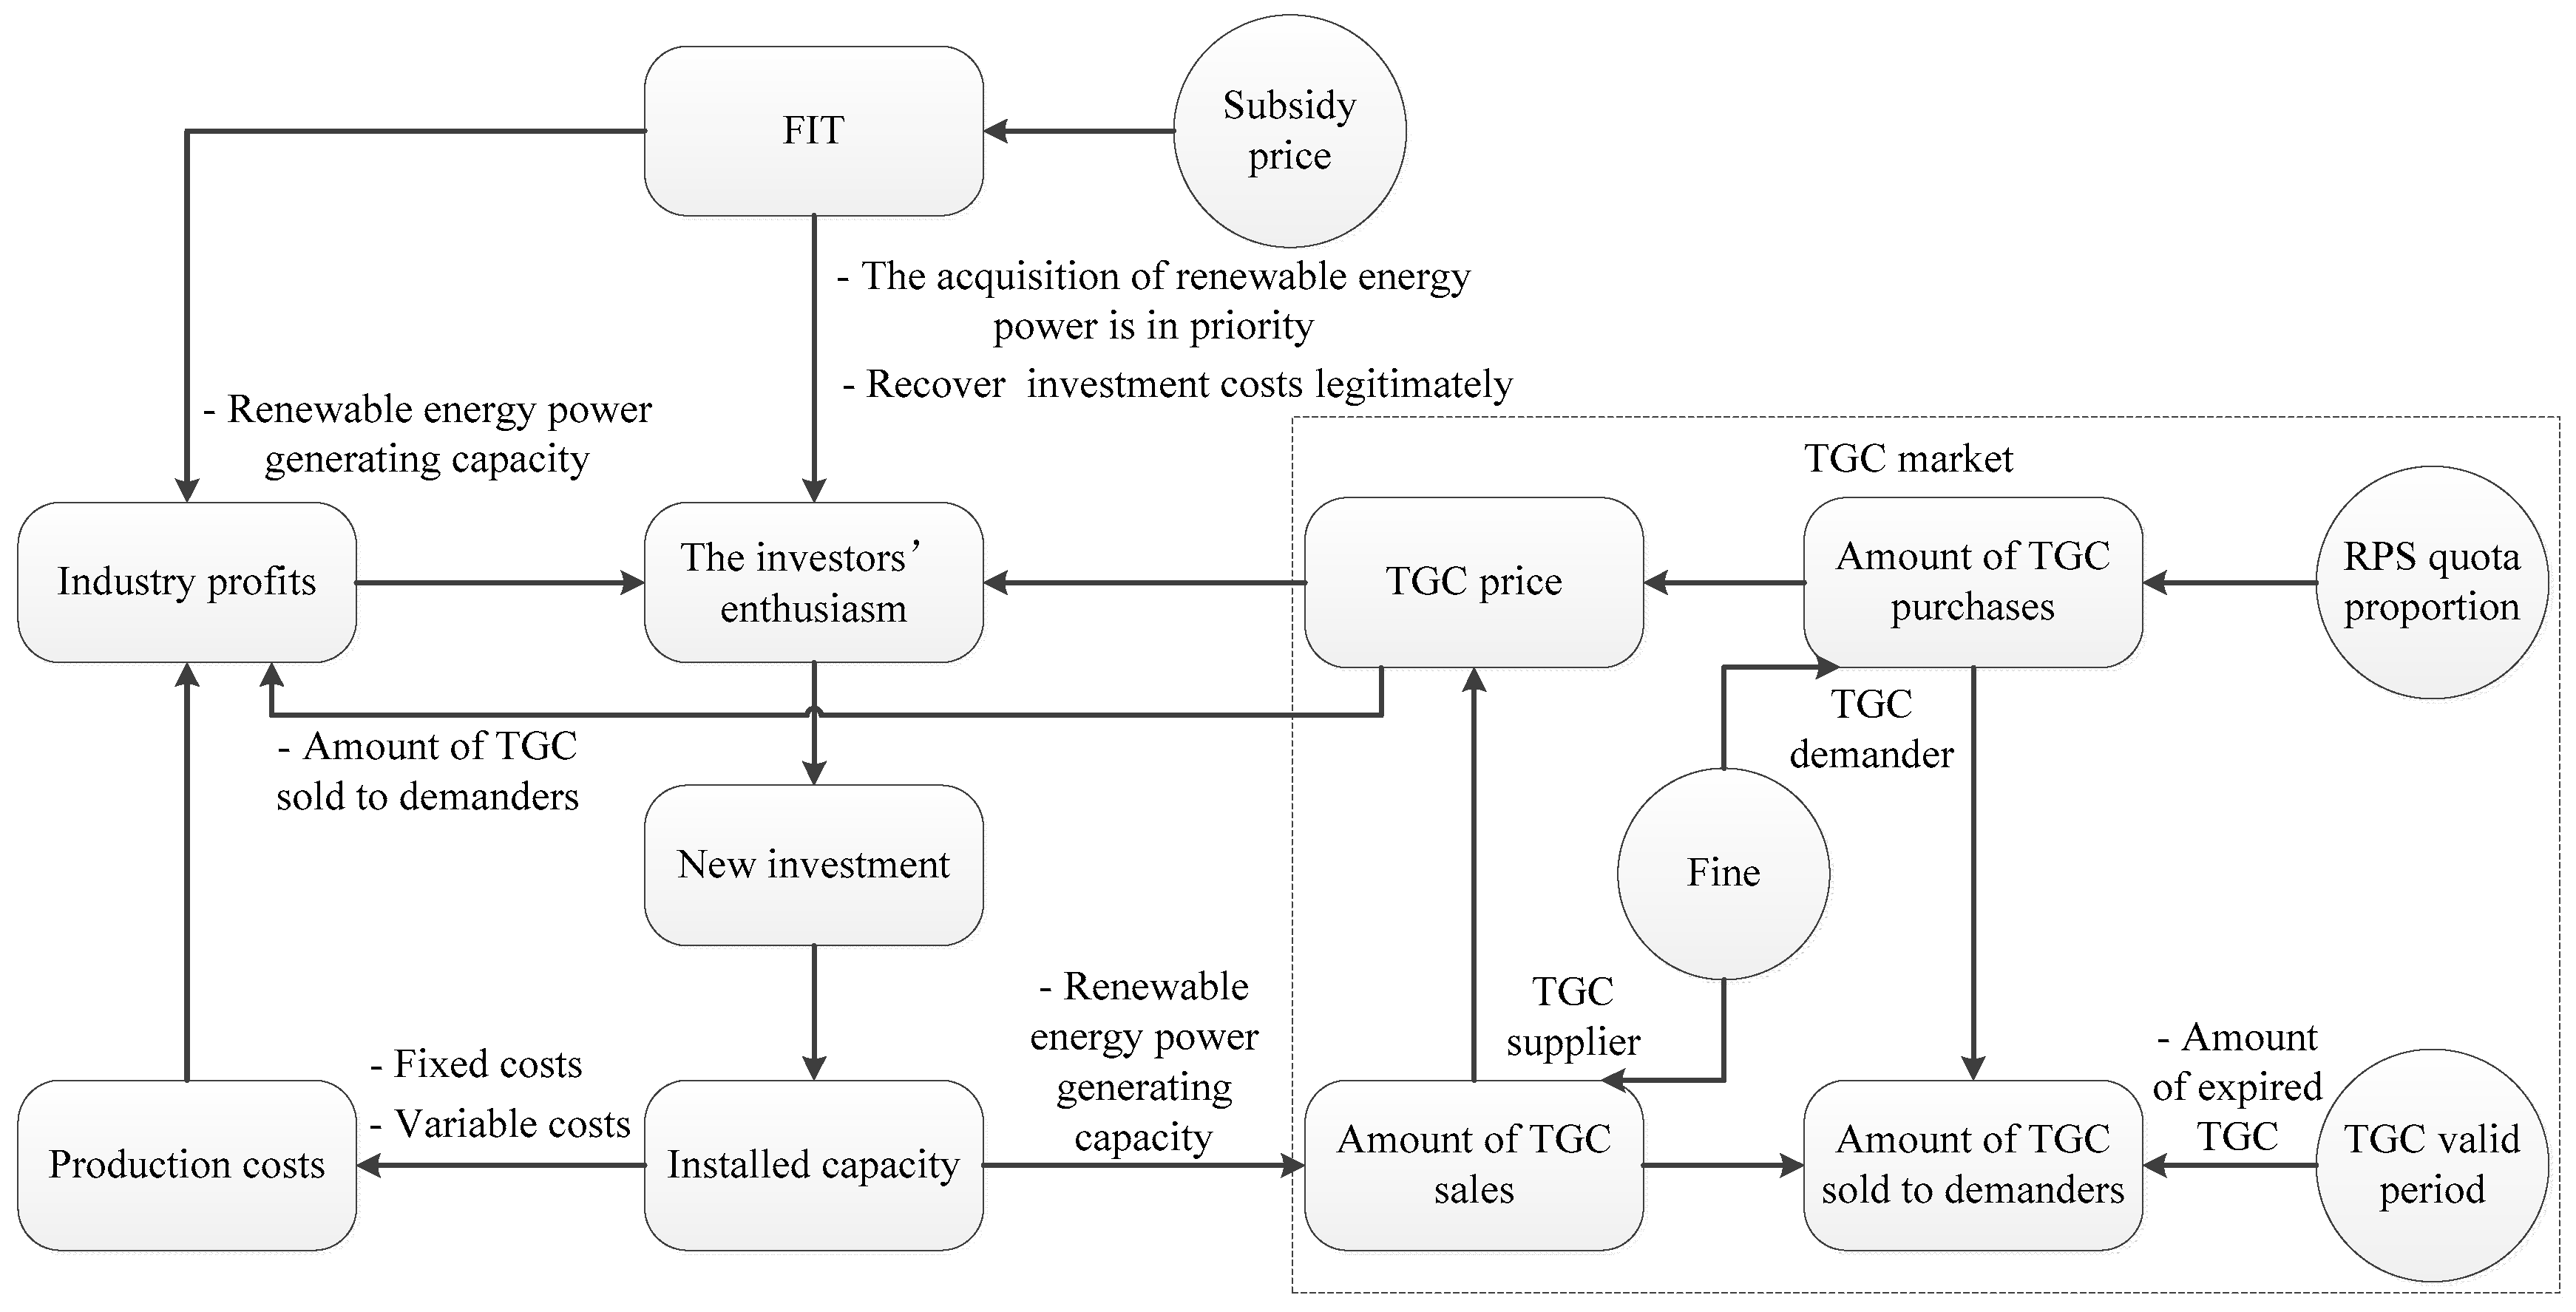
FIT and RPS policies are the two instructional tools guiding investors’ confidence and direction for the renewable energy power industry. In the process of renewable energy power industry’s development, the introduction and implementation of FIT and RPS first lead to the change of investment sentiment, which is the investors’ enthusiasm, and then affect the new investment, thereby affecting the industrial scale and industry’s profits, which are the most important evaluation indicators of the development of the industry. We can see that investors’ enthusiasm is very important for the industry development, thus, the theoretical framing of the model in this study analyzes the main factors influencing the investors’ enthusiasm under FIT and RPS schemes, as shown in Figure 2. We use the installed capacity of the renewable energy power to represent its industrial scale in the figure.

2.1.1. FIT Module

To encourage investment in the development of the renewable energy power industry under FIT, the government subsidizes the electricity price of renewable energy power through developing an appropriate proportion of the long run marginal cost of renewable energy power [27]. This part of the subsidy price is a premium price, which directly determines the on-grid prices of renewable energy power. The FIT scheme improves investors’ enthusiasm for developing renewable energy projects. On the one hand, FIT scheme can make renewable energy power compete in the market at a lower on-grid price to ensure that power grid enterprises acquire renewable energy power in priority [28]. On the other hand, it can ensure that renewable energy power investors legitimately recover the cost of investment. Thus, the FIT is a main factor affecting the investors’ enthusiasm.
FIT scheme ensures investment and revenue of the renewable energy power industry. However, with the growing scale of the industry, various construction costs, land occupation costs, human resources costs, and loans gradually increase within the construction of renewable energy projects. The profits of the renewable energy power industry continuously change, which can not only directly affect the development of the industry but also influence short-term investment of construction projects. Investors will adjust the new investment in the next period according to changes of profits. It reveals that industry’s profit is a main factor affecting the investors’ enthusiasm.

2.1.2. RPS Module

The implement carrier of RPS policy is the TGC market. TGC refers to a certificate of renewable energy generation mode, which can be tradable and honored as a currency. TGC system is a market-based subsidy scheme designed to promote renewable energy power by prescribing the RPS quota proportion, which is a critical policy variable reflecting government policy objectives [29]. In this market, traditional power plants and power grid enterprises (TGC demanders) that purchase green certificates undertake designated RPS quota proportion. The renewable energy power plants (TGC suppliers) that sale green certificates can trade with TGC demanders on the basis of the renewable energy power generating capacity. In general, one kWh of electricity can be converted to one unit of TGC. The supply and demand of TGC determine the TGC price in the trading market. Besides, TGC has its valid period. TGC suppliers need to sell TGCs, and TGC demanders need to turn TGCs in RPS before expiration. Thus, TGC valid period affects the amount of TGC sold to demanders. To ensure the implementation of RPS, the government will punish either TGC suppliers or demanders who do not fulfill their quota obligations by setting a fine.
Within the implementation of RPS, the formation of TGC trading market affects the development of the renewable energy power industry. The revenue of renewable energy power plants is not only from electricity sales but also from TGC sales, which is determined by TGC price and amounts of TGC sold to demanders. The change of revenue affects the industry’s profits. In addition, according to microeconomics theory, TGC price increases when TGC demand (amount of TGC purchases) is greater than supply (amount of TGC sales). In this situation, the investors hold that selling TGC is profitable, and invest new renewable energy power projects, and vice versa. It shows that TGC price affects investors’ enthusiasm, thereby influencing new investment and the development of the renewable energy power industry.

2.2. Model Design

To facilitate the theoretical study and establishment of the model, there are several assumptions in the process of model establishment: (1) Do not consider the technological progress, that is, FIT and unit cost do not change with time. (2) Do not consider energy abandonment, that is, all the renewable energy power generation is on-grid. (3) The market is a perfect competitive market, that is, the market traders are rational economic people, and supply and demand determines the transaction price.

2.2.1. Model under FIT Scheme

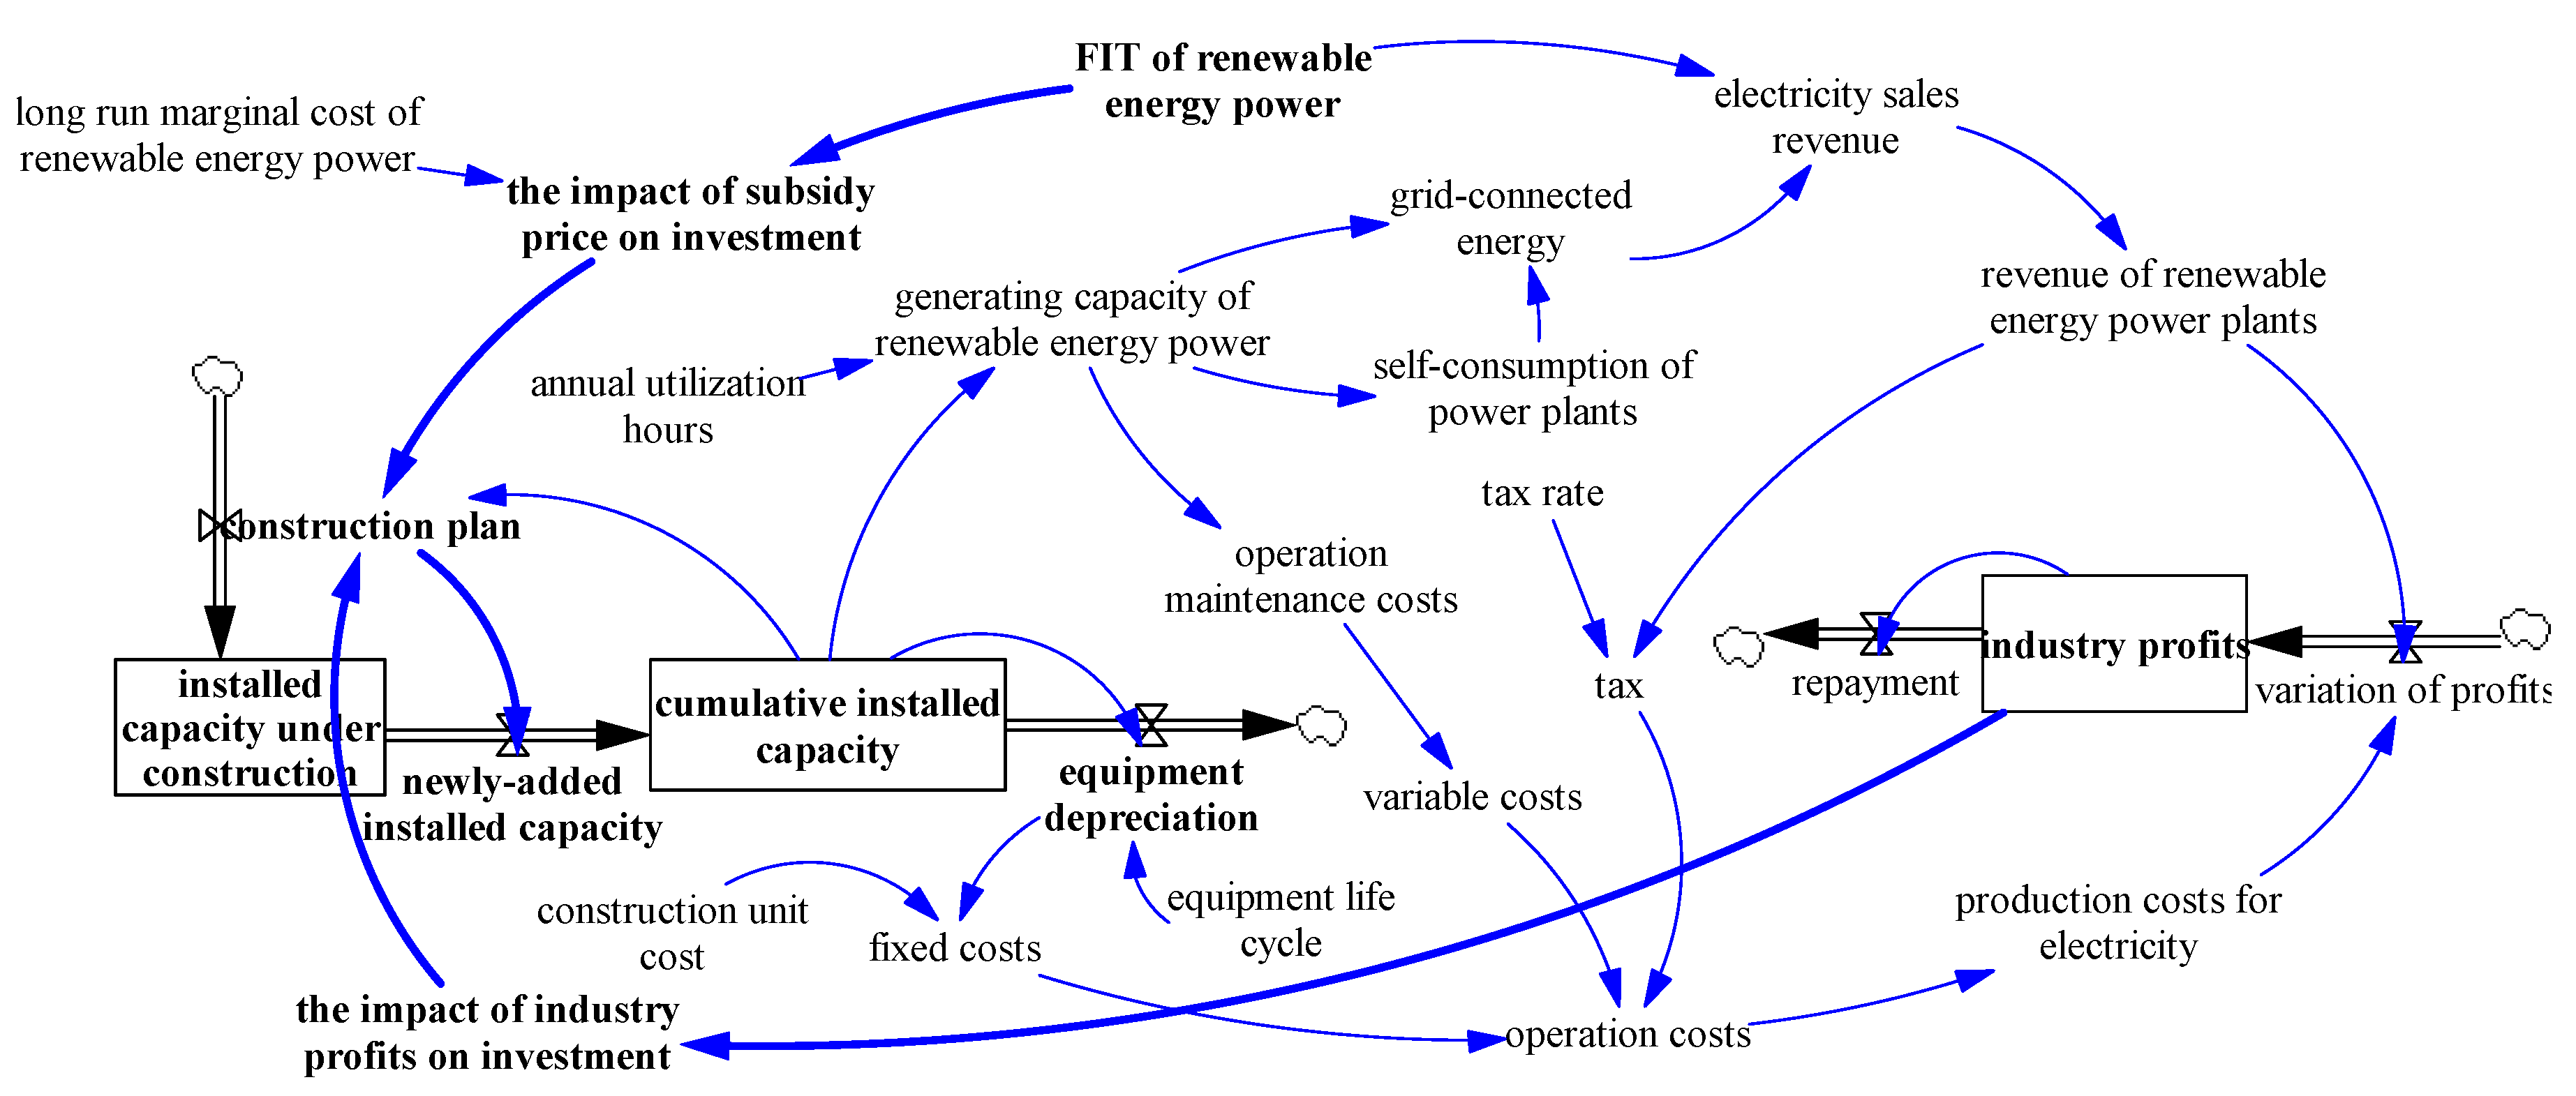
Based on the above analysis, we believe that the development of the renewable energy power industry under FIT is mainly affected by FIT level and industry’s profits. This study sets the variables showing the cumulative results to state variables (shown in boxes), the variables showing the changing rate of state variables to rate variables (shown with double triangles), and the rest of the relevant variables to auxiliary variables according to the characteristics of the factors [26]. The flow graph is a good tool for modeling the cause and effect relationships between various components of the SD model. A flow graph of the development of the renewable energy power industry under FIT scheme is established in this paper using Vensim software, as shown in Figure 3. The directions of the arrows indicate the influence interaction, and the impact of the FIT level and industry’s profits on the development of the industry is stressed via boldface and thick line.
There are approximately twenty control functions in this flowchart that are used to express the quantitative relationships between parameters. Due to the limited length of the article, only the main formulas and significant functional relationships of the impact of the FIT level and industry’s profits on the development of the renewable energy power industry in the flow chart are enumerated, as follows. Interested readers can collect all the necessary information from [30,31] to completely understand the model under FIT scheme.
s i = ( F I T + α ) / L M C r e n e w a b l e
p i = I P × ε
C P = ( s i + p i ) × I C c u m u l a t i v e × ϕ
I C c u m u l a t i v e = ( I C n e w E D ) + I C c u m u l a t i v e 0
The description of the parameters used in Equations (1)–(4) is shown in the Appendix A. s i can be seen as a comparative advantage over long L M C r e n e w a b l e , and it is positively correlated with FIT levels, as shown in Equation (1). I P directly determines investors’ investment strategies, and p i is positively related to the profits, as shown in Equation (2) [30]. Both s i and p i can be seen as the proportion of investment in the next period of the construction plan with I C c u m u l a t i v e , thus C P is shown as Equation (3). The renewable energy power projects need to be operational after the construction period, thus, we use the delay function in Vensim to represent the newly-added installed capacity, which is D E L A Y   F I X E D   ( C P ,   c o n s t r u c t i o n   p e r i o d ,   0 ) . I C c u m u l a t i v e is the cumulative value of the difference between the newly-added installed capacity and E D each year, as shown in Equation (4), where E D is calculated by the average depreciation method.

2.2.2. Model under RPS Scheme

Based on the above analysis, we believe that the development of the renewable energy power industry under RPS scheme is mainly affected by FIT level, industry’s profits, and TGC price. A flow graph of development of the renewable energy power industry under RPS scheme is established, as shown in Figure 4, where, the impact of FIT level, industry’s profits, and TGC price on the industry’s development is stressed via boldface and thick line.
There are approximately forty control functions in this flow chart, and only the main formulas and significant functional relationships of the impact of TGC price on the development of the renewable energy power industry and the process of TGC fluctuation in the flow chart are enumerated, as follows. Interested readers can collect all the necessary information from [18,32,33] to completely understand the model under RPS scheme.
t i = ( A P + η ) / L M C r e n e w a b l e
C P = ( s i + p i + t i ) × I C c u m u l a t i v e × δ
T G C s a l e s = f / m × ( T G C p / T G C p 0 × T G C h p )
T G C p u r c h a s e s = { 0 , i f   T G C h d > T G C t f / m × [ T G C p 0 / T G C p × ( T G C t T G C h d ) ] , i f   T G C h d T G C t
T G C p f = T G C o × λ / t f p
The description of the parameters used in Equations (5)–(9) is shown in the Appendix A. t i can be seen as a comparative advantage over L M C r e n e w a b l e , which is similar to s i , and, as mentioned above, the higher the TGC price, the greater the enthusiasm of investors; thus, t i is positively correlated with T G C p . In addition, investors use A P , a relatively stable price, as a reference for the next period of investment [34]; thus, t i is shown in Equation (5). C P is similar to Equation (3), as shown in Equation (6). As there is a time difference between a TGC price signal and a new renewable energy power project starting to produce energy, t i is shown by using a delay function in Vensim, as D E L A Y 1   ( t i , a d j u s t m e n t   t i m e   o f   T G C   p r i c e   t r e n d ) . Newly-added installed capacity and cumulative installed capacity are the same as those under FIT.
In the TGC market, T G C s a l e s is based on T G C h p and is affected by two aspects of f and T G C p . On the one hand, T G C s a l e s changes as the T G C p changes, that is, the renewable energy power plants plan the sales amount by taking the ratio of the current T G C p to T G C p 0 as a reference [18]. When based on marginal cost price, T G C p 0 , is the difference between L M C r e n e w a b l e and the long run marginal cost of traditional power. On the other hand, as f set by the government is generally higher than m , TGC suppliers would rather sale more TGC than accept punishment [32]. To show the promotion effect of a fine, we set f / m as a proportion representing the more amount of TGC sales based on the initial sales amount of renewable energy power plants. Thus, T G C s a l e s is shown in Equation (7). Similarly, T G C p u r c h a s e s is shown in Equation (8), which is a conditional function shown as I F   E L S E   T H E N   ( T G C h d > T G C t , 0 , f / m × T G C p 0 / T G C p × ( T G C t T G C h d ) ) in Vensim. T G C h d is the difference between TGC sold to demanders and T G C t , where TGC sold to demanders is shown by using extremal function as M I N ( M A X ( T G C e d , T G C p u r c h a s e s ) ,   M A X ( T G C e s , T G C s a l e s ) ) in Vensim ( T G C e d and T G C e s are the amount of expired TGC of TGC demanders and suppliers, respectively). T G C t is determined by electricity demand and RPS quota proportion each year. As mentioned above, TGC supply and demand directly determines the TGC price changes: the greater the supply of TGC, the higher the TGC price. Thus, T G C p f is negatively correlated with T G C o , as shown in Equation (9) [35].

2.3. Validation of Dynamic Models

SD models are causal models, well suited for policy analysis and assessment rather than the point prediction of the variables under study [36,37]. Consistent with this assertion, the key purpose of our developed SD models is to assist us in the assessment and analysis of renewable energy power industry sector. Therefore, we followed validation methods that the SD community subjects their models to according to Qudrat [38] and Qudrat et al [39]. Both the structural (shown as follows) and behavior validity procedures (shown in the analysis of the results) are applied to SD models. While structural validity ascertains that model structures generate the right behavior, behavior validity assesses how well the model generated behavior mimics the observed patterns of the real system [40].

2.3.1. Boundary Adequacy

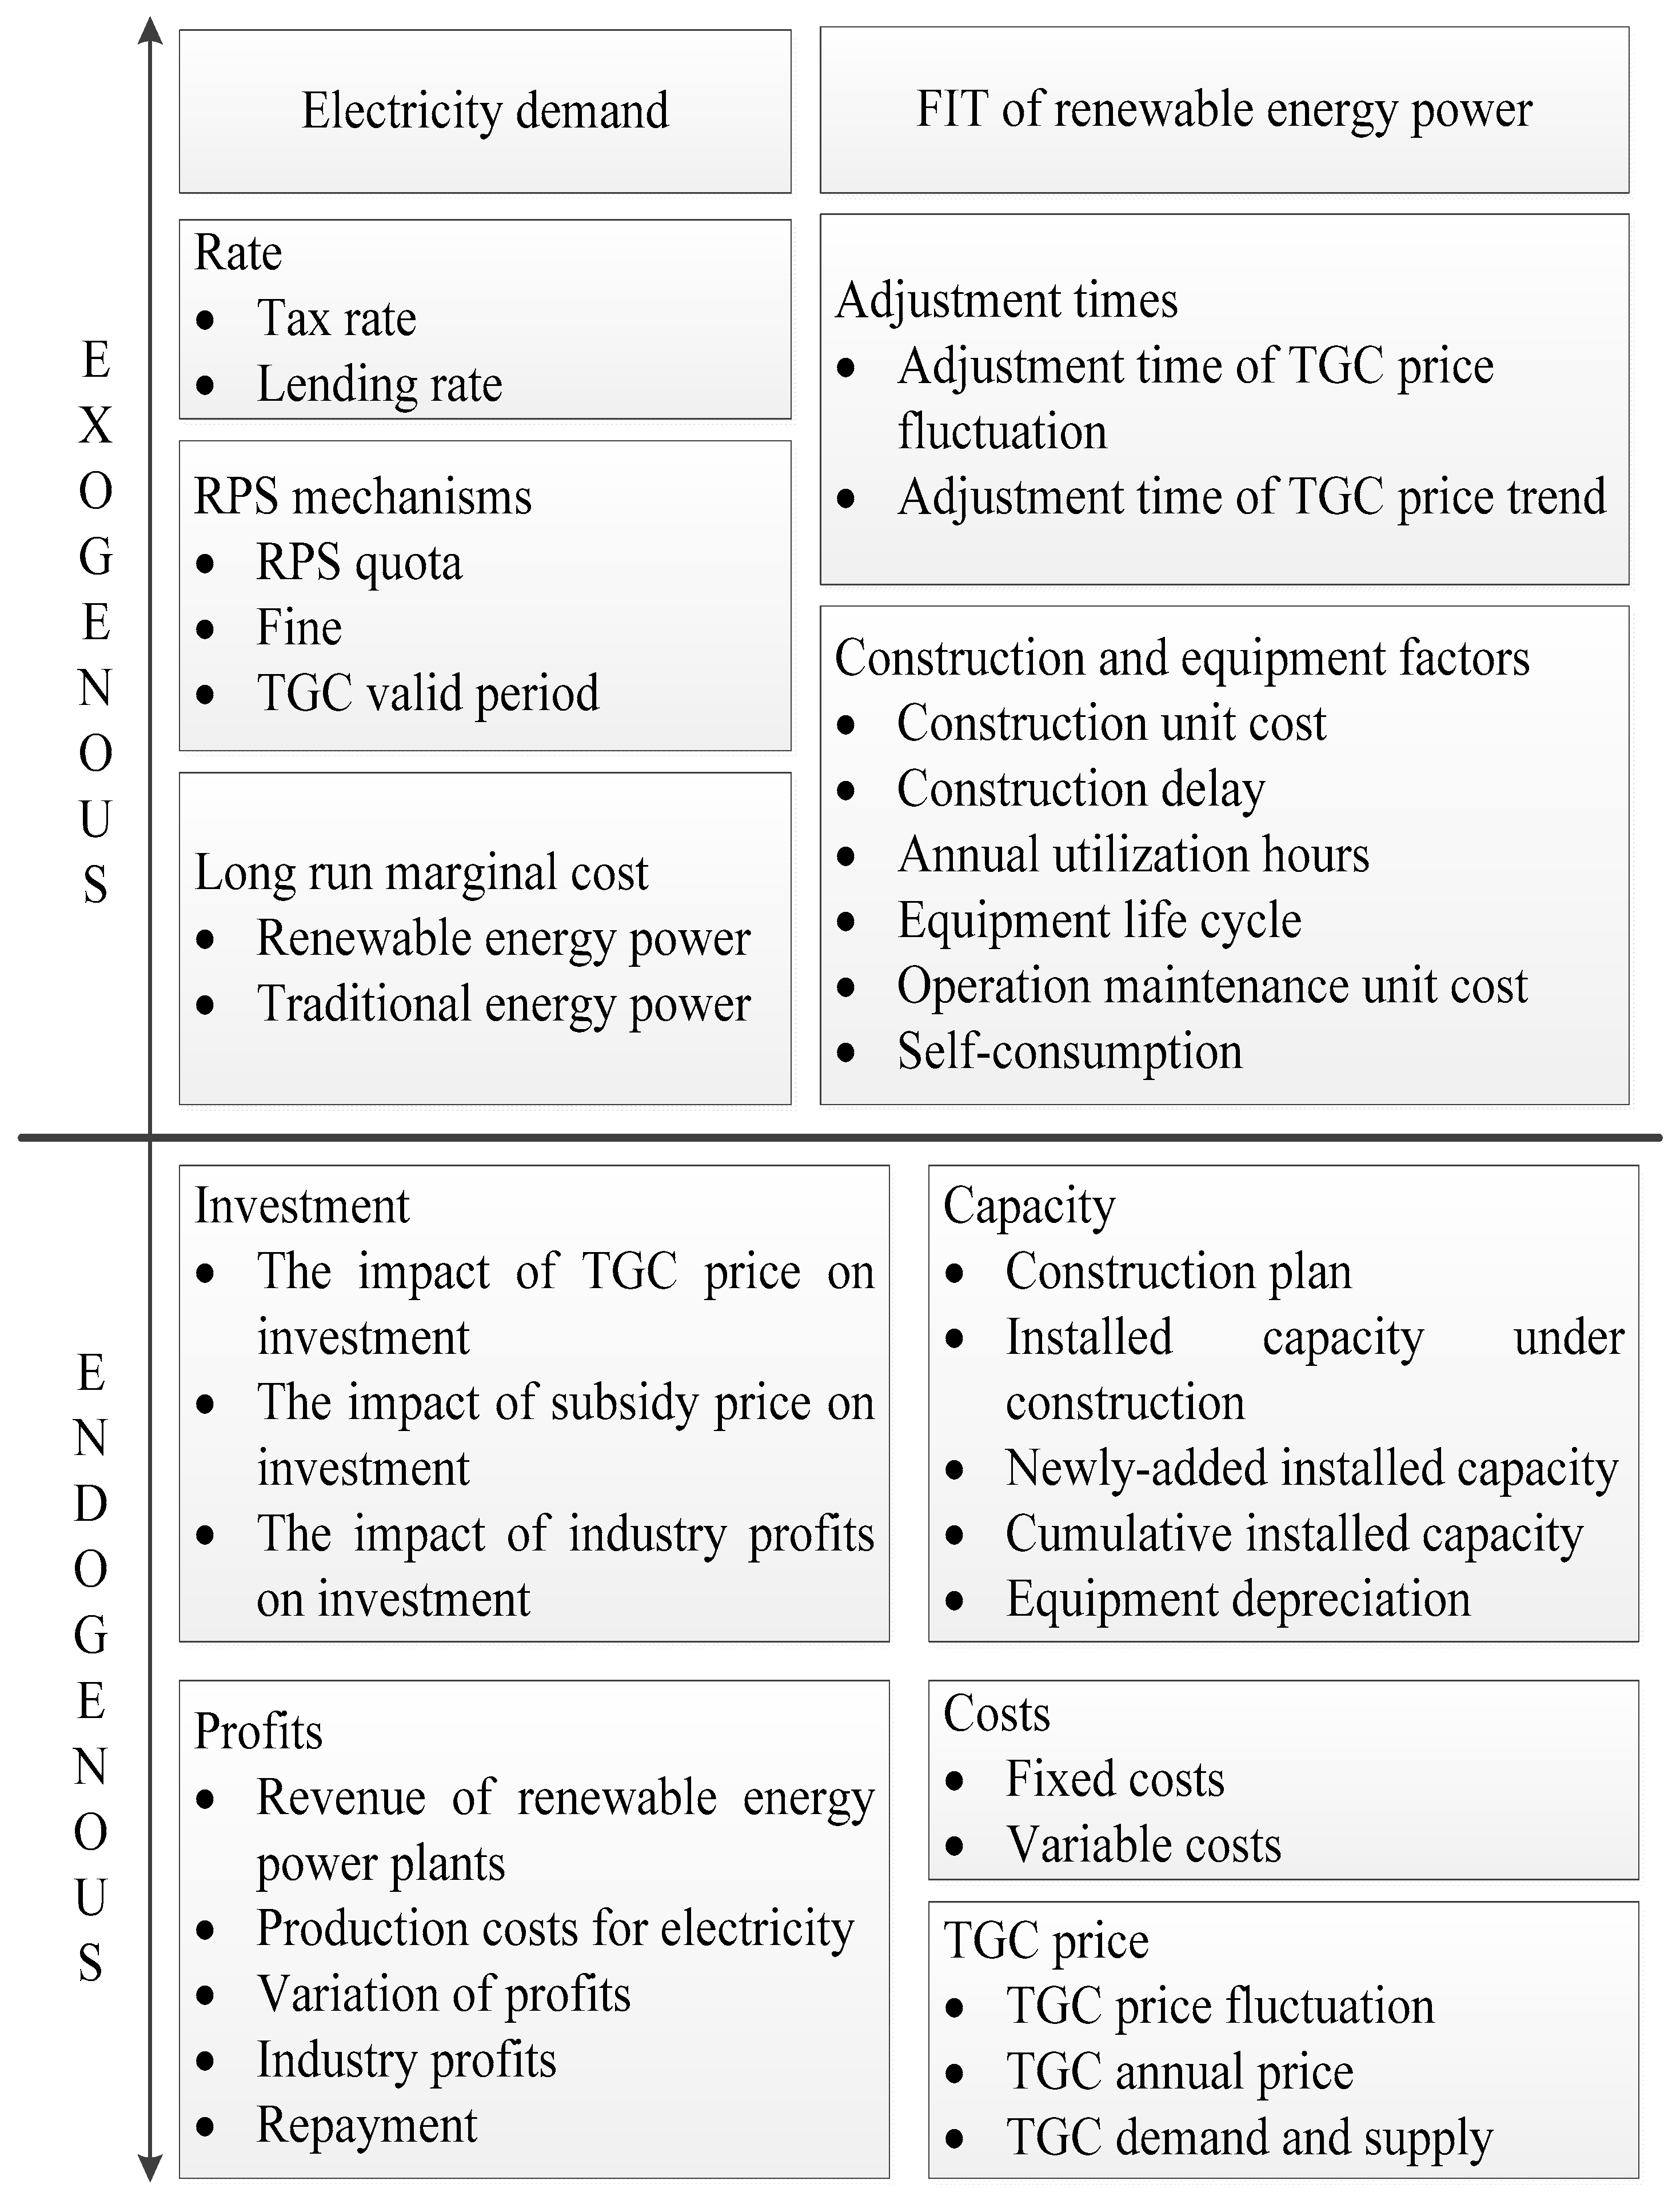
Figure 5 summarizes the major endogenous and exogenous variables in the models. Consistent with the purpose of the development of renewable energy power industry, all the major aggregates, investment, capacity, profits, costs, and TGC price, are generated endogenously. Electricity demand, FIT, construction and equipment factors, RPS mechanisms, long run marginal costs, rate, and adjustment times are exogenous variables.

2.3.2. Structure Verification

We apply a two-pronged approach, which in this specific case is China’s data (or available knowledge about the real system) shown in Section 3, and the sub-models/structures of the existing models of the domain shown in Table 1.

2.3.3. Dimensional Consistency

Dimensional consistency test requires that each mathematical equation in the model be tested if the measurement units of all the variables and constants involved are dimensionally consistent [39]. We have used “Unit Test” in Vensim and found that the dimensional consistency passed the test.

2.3.4. Parameter Verification

The values assigned to the parameters of the models are sourced from the existing knowledge and numerical data form the case China’s data. The detailed description is given in Section 3.

2.3.5. Extreme Condition Test

We set: (i) both FIT and RPS quota as 0; and (ii) construction delay to a very large number as several extreme conditions. We have found that installed capacity, investment and industry profits are gradually reduced and close to zero in these cases. We observe that the models exhibits a behavior that is in line with the anticipated behavior of the real system under the extreme condition. Thus, we conclude that the models we produced passes the extreme condition test and its validity is enhanced.

2.3.6. Structurally Oriented Behavior Test

In this test, the behavioral sensitivity of the models is evaluated, and is shown in detail in the sensitivity analysis of Section 3.
In summary, the SD model structures of renewable energy power industry development under FIT and RPS schemes were exposed to all the six tests for overall structural validity. Based on these evaluations, we have strong confidence in the models’ ability to generate “right behavior for right reasons” [39].

3. Data, Simulation Results and Analysis

3.1. Data

This paper takes China’s photovoltaic power industry as an example. To facilitate the study of the dynamic development, the temporal resolution of the model needs to be small. This study assumes that the step size is one month. At present, each country’s TGC contract period usually ranges 3–10 years. To study the impact of policy on the long-term development of the industry, this study considers the actual situation in China, and assumes that the simulation time is 10 years, or 120 months, and that the start time is January 2016. The key parameters and their practical initial values in the study are shown in Table 2. Most of the data are collected from the China Statistical Yearbook, a survey of the data from the China Electricity Council and National Energy Administration. The initial value of the RPS quota proportion of 1% is the proportion of photovoltaic power generating capacity represented in the total electricity consumption in January 2016. As the RPS quota proportion of China’s photovoltaic power will reach at least 6% in 2025 [41], its growth rate is set as 1.5% each month. As China’s long-term electricity demand growth rate is approximately 3% each year [42], it is set as 0.25% each month. The FIT of 0.89 Yuan/kWh is the average value of the FITs of three photovoltaic resource classes, 0.8 Yuan/kWh, 0.88 Yuan/kWh and 0.98 Yuan/kWh, respectively, in 2016 [43]. The key parameters and their assumed values in the study are shown in Table 3. As the maximum value of the probable TGC price is approximately twice the long run marginal cost of photovoltaic power [35], we set it as 1.3 Yuan/kWh.

3.2. Simulation Results

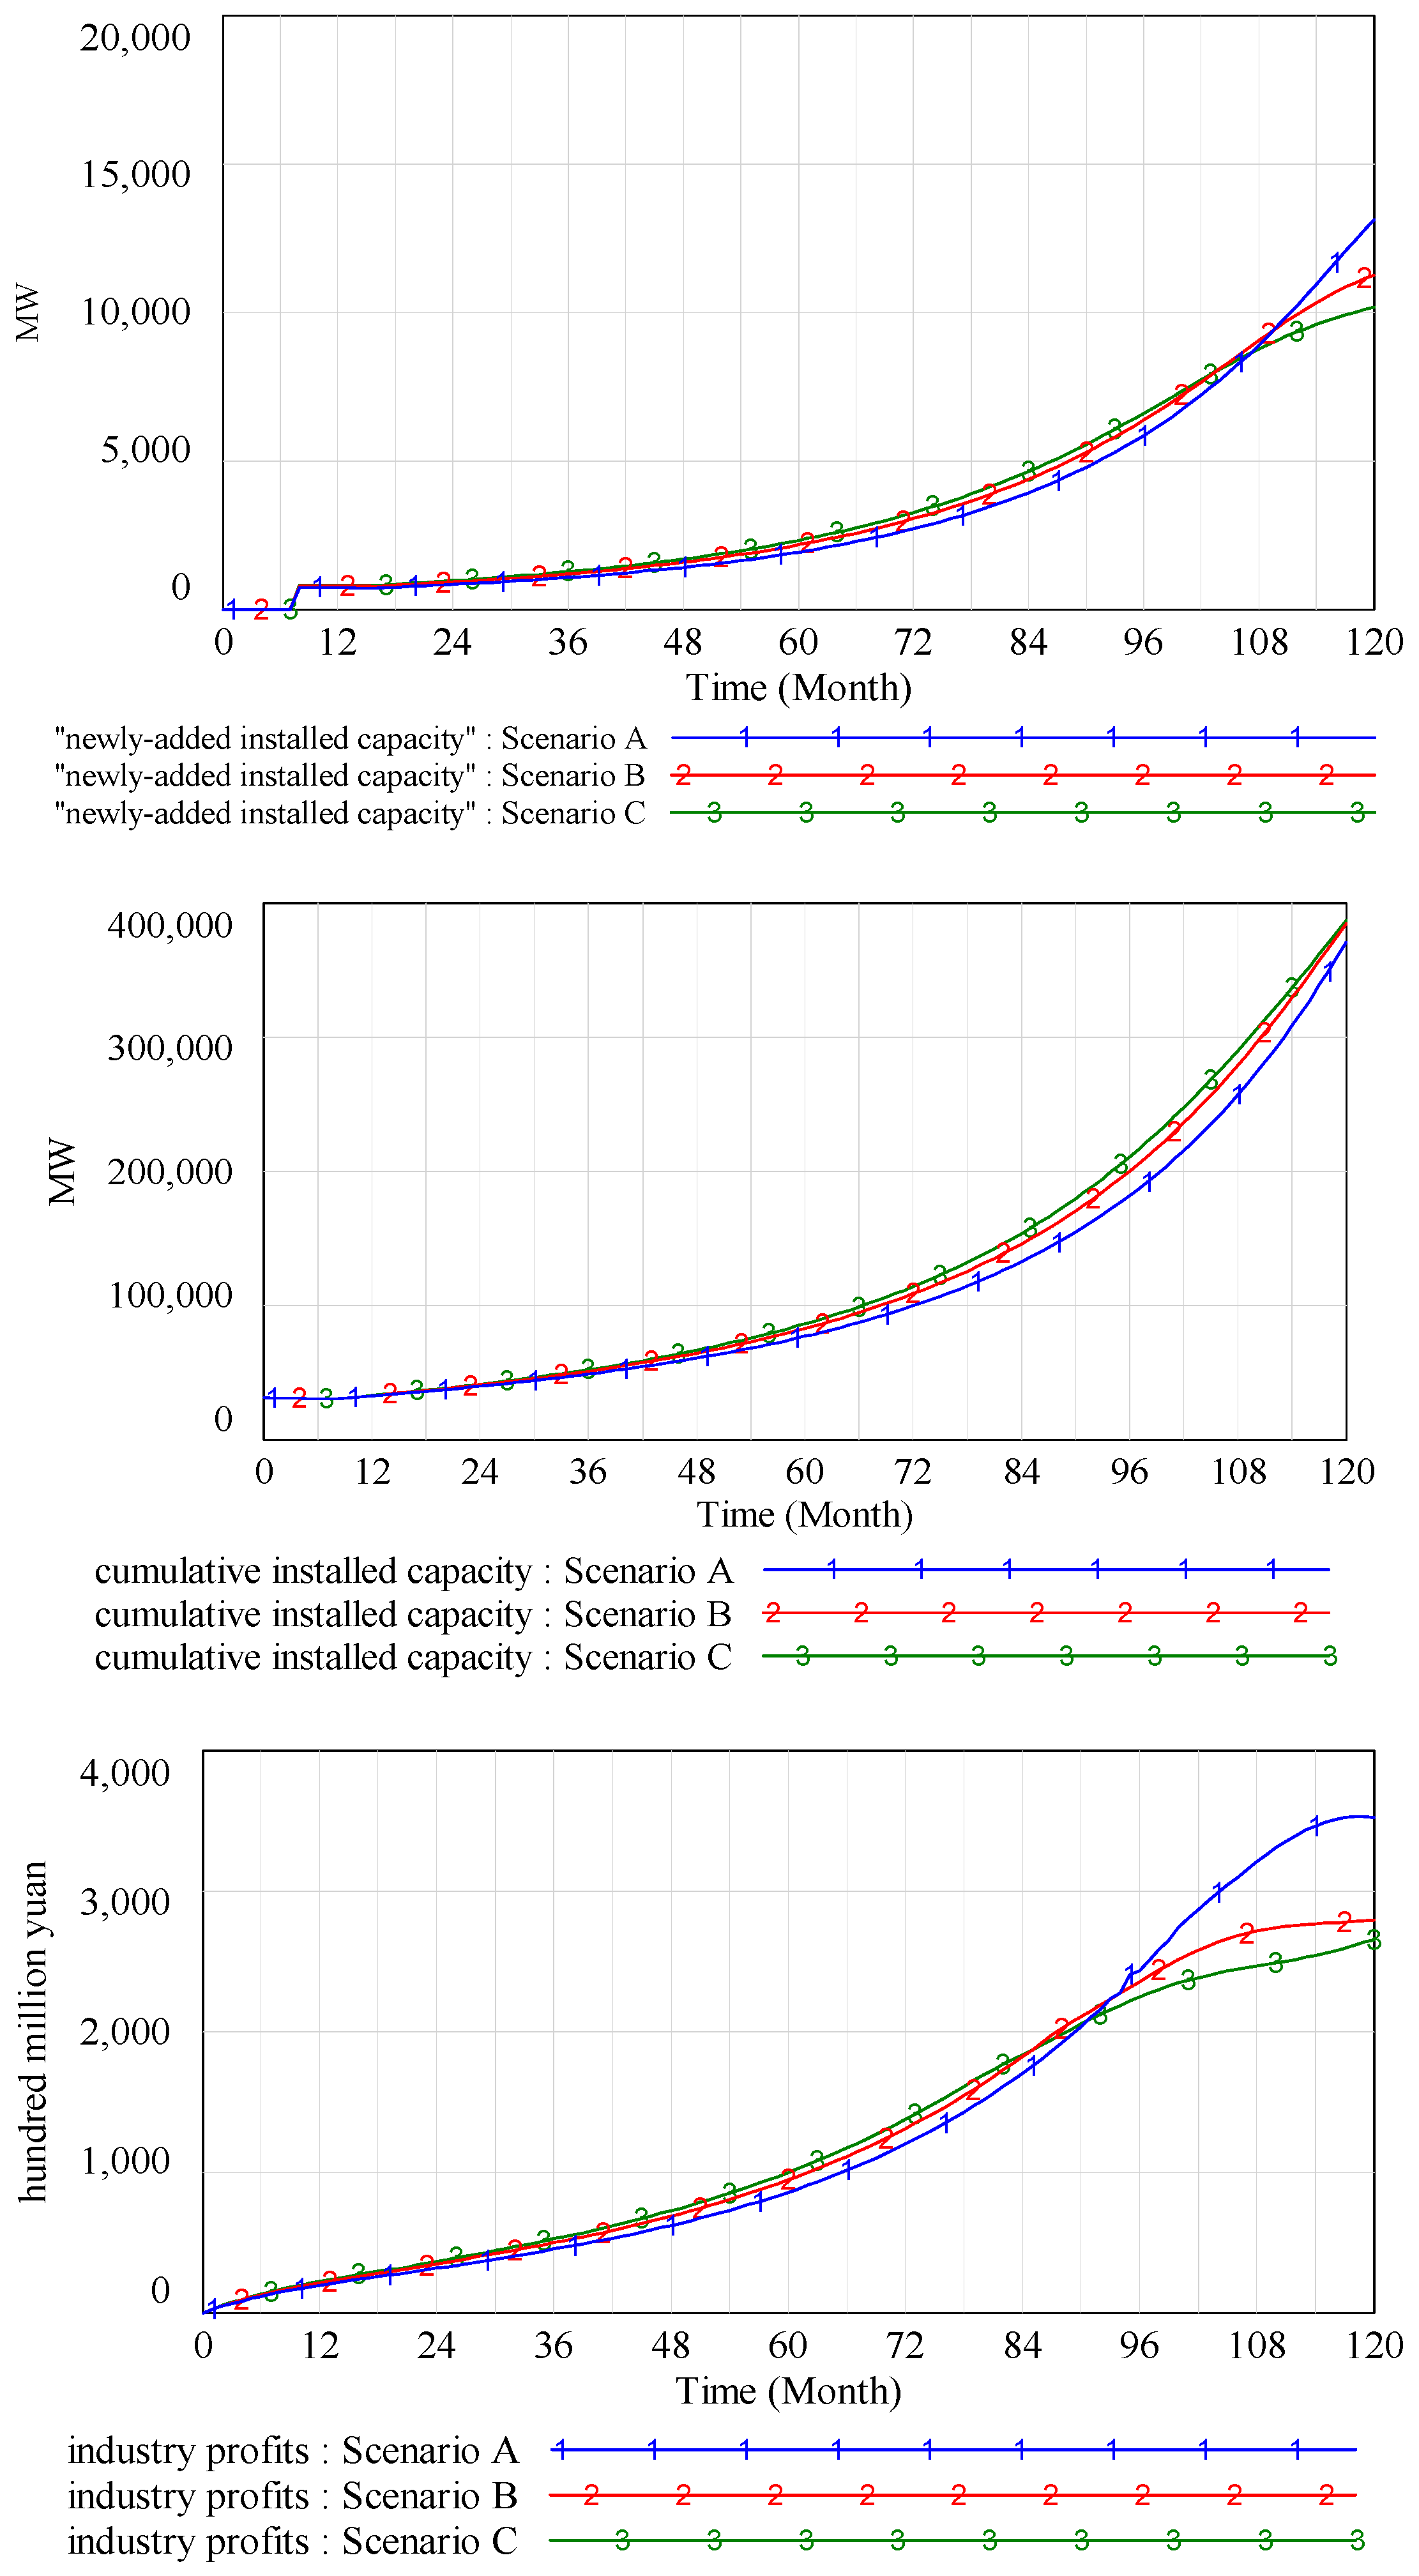
The simulation of the development of China’s photovoltaic power industry under FIT and RPS schemes will be operated based on the SD models in Figure 3 and Figure 4. We set up the three following scenarios of FIT for comparative study. Scenario A is a practical situation, with a subsidy rate of about 35% relative to the long run marginal cost of photovoltaic power, while Scenario B and C are comparative scenarios, with subsidy rates of 45% and 55%, respectively.
  • Scenario A: FIT is 0.89 Yuan/kWh.
  • Scenario B: FIT is 0.96 Yuan/kWh.
  • Scenario C: FIT is 1 Yuan/kWh.
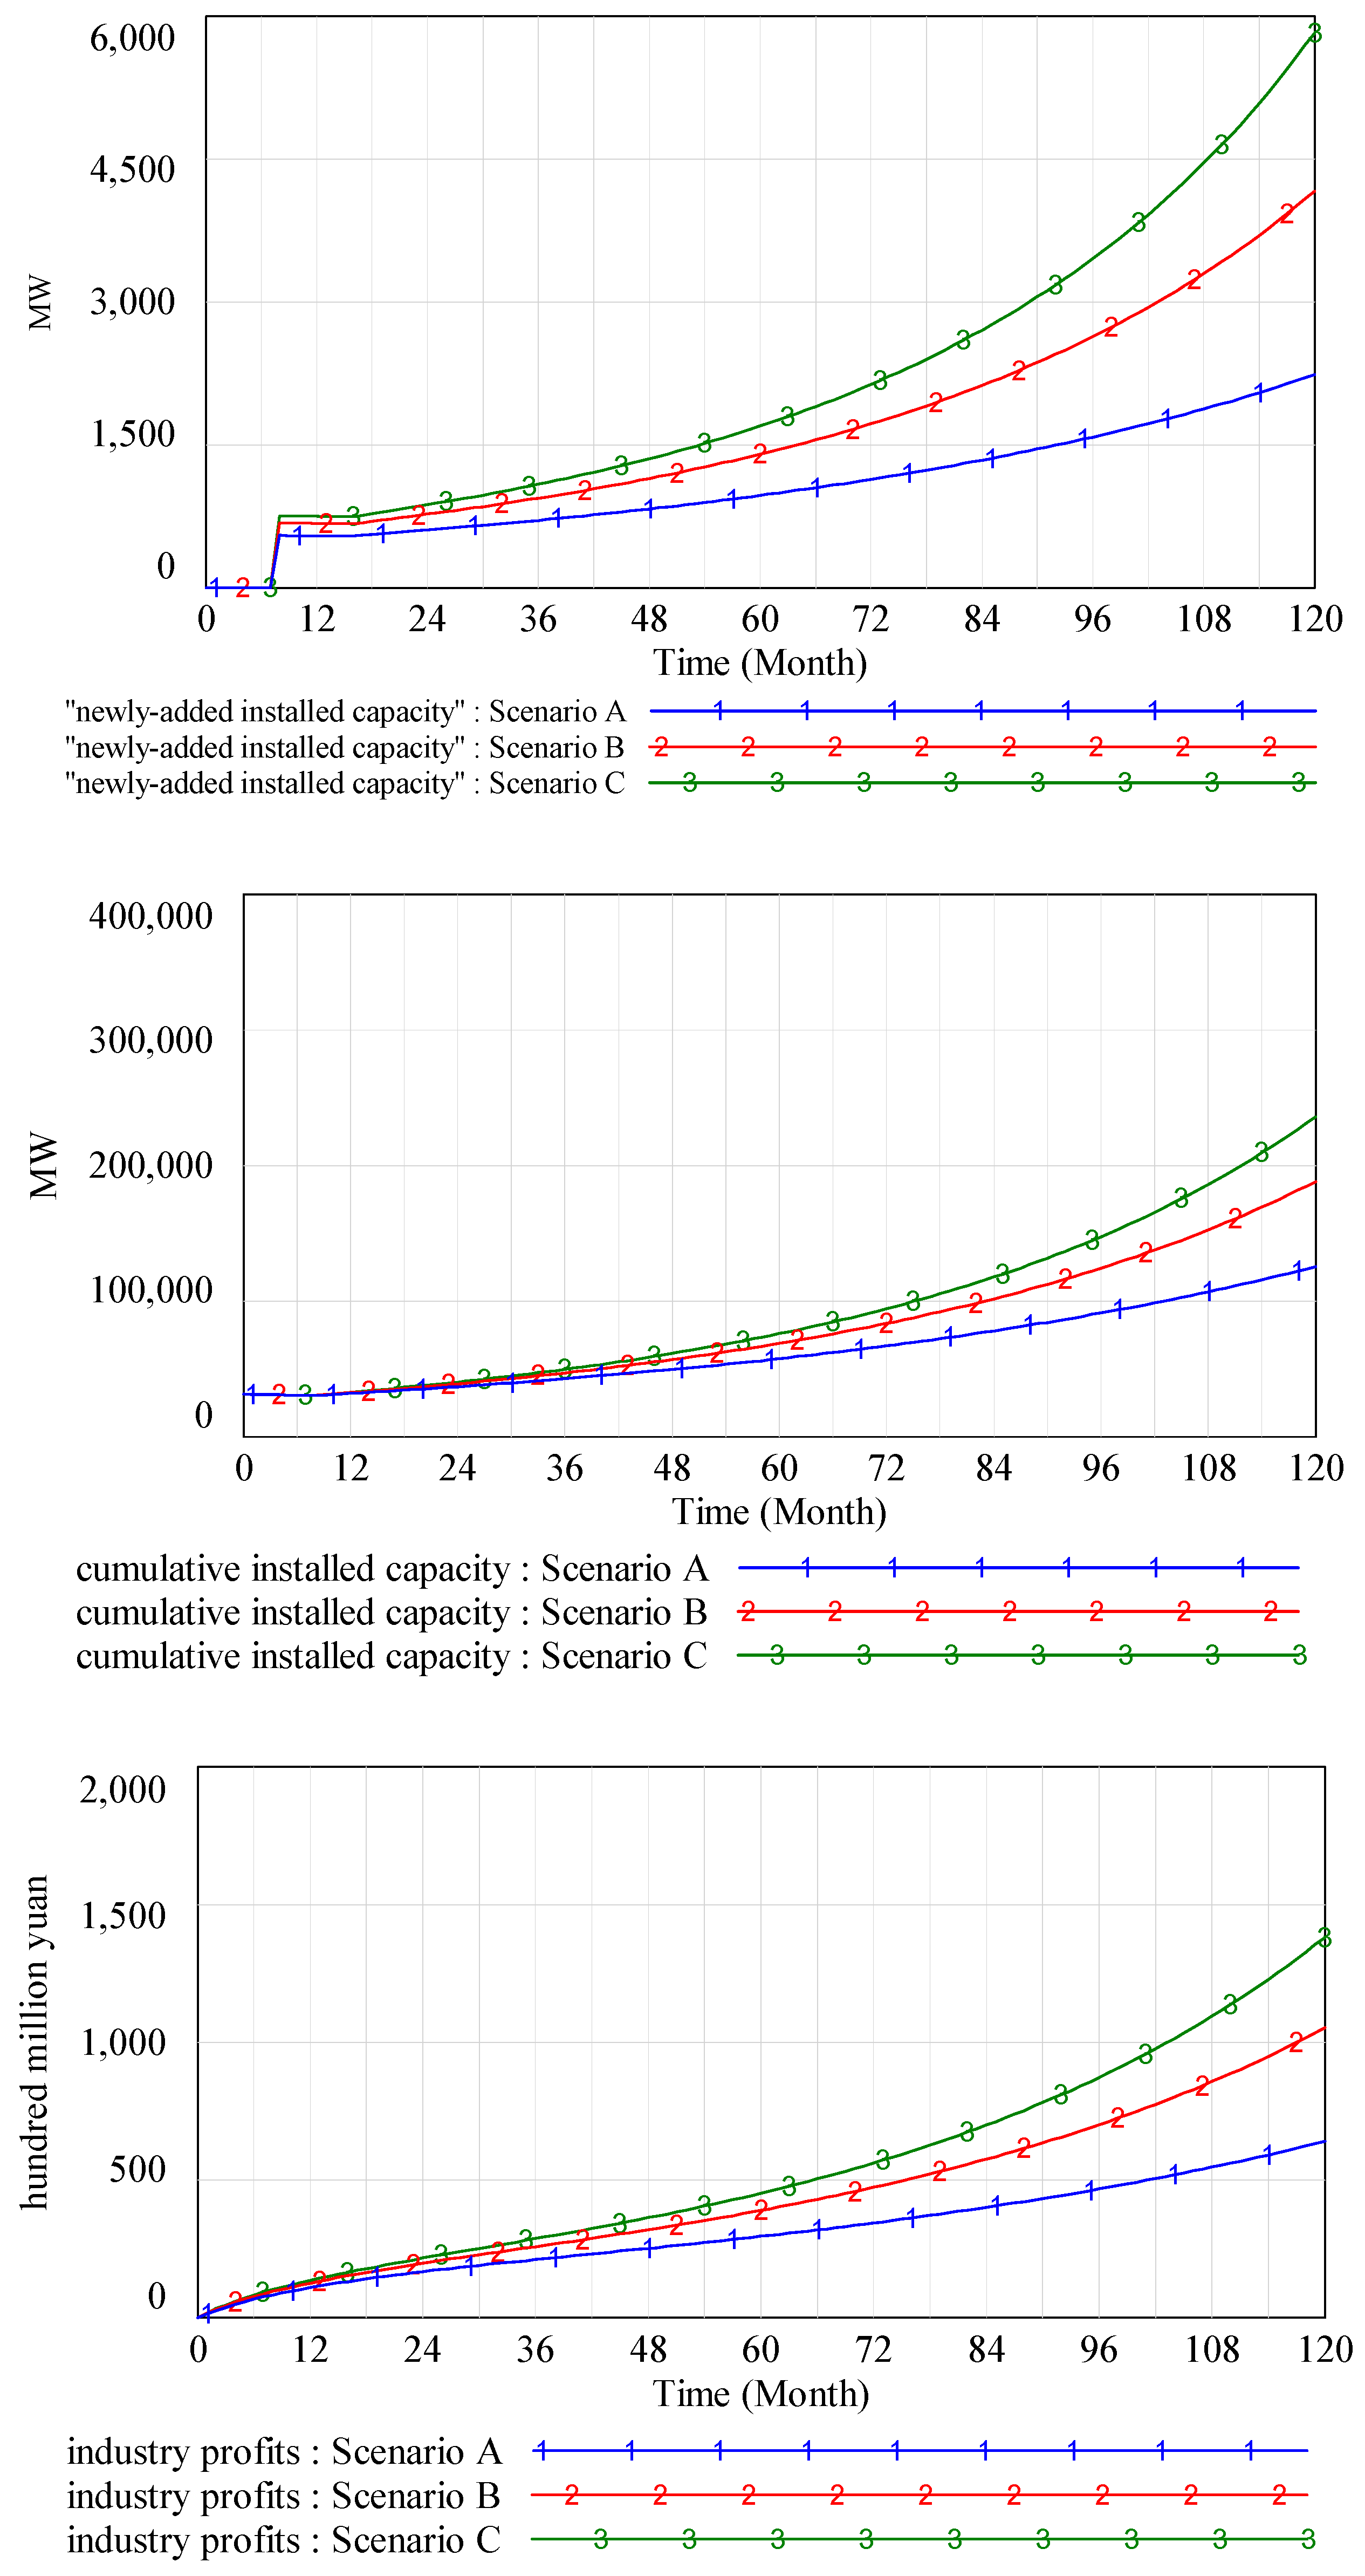
The simulation results of the development of China’s photovoltaic power industry under FIT scheme are shown in Figure 6. We can see that, starting from the commencement of operation, the newly-added installed capacity, cumulative installed capacity, and industry’s profits continue to grow steadily under three FIT levels, with increases in the level of subsidy directly correlated with increases in the speed of growth. Under the three FIT levels, the cumulative installed capacities will approach 125 GW, 188 GW, and 235 GW, respectively, and the photovoltaic power industry’s profits will reach ¥63 billion, ¥105 billion, and ¥138 billion, respectively, in 2025.
We verify the behavioral validity of the model under FIT scheme in this part by comparing the results of the simulation with the Chinese government's planning values. As the industry planning of China’s photovoltaic power is up to 2020, we compare the data in 2020 shown in Table 4. As the technological progress is not considered in the simulation, the planning value might be higher than the simulation results. Since the model is not intended for forecasting but rather for policy analysis, the errors in installed capacity and profits growth rate are of little concern, as it will not affect the relative efficacy of policies [39]. As a result, it is fair to conclude that the model under FIT scheme, a model used for policy analysis rather than forecasting purposes, accurately replicates the actual data.
The simulation results of the development of China’s photovoltaic power industry under RPS scheme are shown in Figure 7. By comparing the results of TGC price with the related literature [18,32,33,34], we find that the overall trend of TGC prices is an initial increase followed by a decrease and that the maximum TGC price is less than the fine level. This proves that our simulation results are consistent with those of other scholars.
First, we analyze the practical situation, namely Scenario A. We can see from the figure that construction of the TGC market begins in 2016–2021 (Time from 0 to 72), during which period, within the context of the continuing growth in electricity demand and the government’s requirement for the RPS quota ratio, there is always TGC excess demand in the market and the TGC price will rise steadily. The growth of the TGC price causes two changes. First, investors’ enthusiasm grows, with the result that new photovoltaic power plants will access the market. On the other hand, the revenue of photovoltaic power plants increases. This causes steady growth of the newly-added installed capacity, cumulative installed capacity, and industry’s profits.
With the construction of the TGC market and the expansion in scale of the photovoltaic power industry, the electricity demand increases steadily and the generating capacity of photovoltaic power grows fast. In addition, the effect of a fine contributes to increasing TGC purchases and sales. On the other hand, TGC demanders and photovoltaic power plants use the TGC held by themselves and the amount of expired TGC to adjust the amount of TGC in the market. Thus, the market interplay between TGC demanders and photovoltaic power plants gradually intensifies from 2022 (Time = 73) and begins to fluctuate violently, while TGC excess demand decreases, and TGC price, the newly-added installed capacity, cumulative installed capacity, and industry’s profits continue to grow.
With the further fast expansion of the photovoltaic power industry, fluctuating excess demand for TGC gradually changes into oversupply. The TGC price reaches a maximum of 0.998 Yuan/kWh in 2024 (Time = 99) and then begins to decline rapidly. Due to the delayed effect of the TGC price signal on new photovoltaic power projects, investors do not immediately reduce their investment in new photovoltaic construction projects in 2024. Thus, the newly-added installed capacity and the cumulative installed capacity both still grow rapidly. However, the rapid decline of the TGC price and the growth of construction costs causes the profits of the photovoltaic power industry to increase slowly. Finally, the cumulative installed capacity and industry’s profits approach 370 GW and ¥352 billion, respectively, in 2025.
We verify the behavioral validity of the model under RPS scheme in this part. As China has not yet implemented RPS, there is no practical data for comparison. However, on the one hand, as mentioned above, simulation results of TGC price are consistent with those of other scholars. On the other hand, according to the experience of other countries, the installed capacity will reach the target ahead of time if RPS can be well implemented. The simulation results of our model are consistent with the fact. It reveals that the model under RPS scheme, a model used for policy analysis rather than forecasting purposes similar to that under FIT scheme, accurately reflects the actual development trend.
Second, we conduct a comparative analysis using three scenarios. When the TGC market is in the TGC excess demand phase, the higher the subsidy price, the greater the enthusiasm of investors, the greater the newly-added installed capacity and industry’s profits, the more rapid growth of the cumulative installed capacity of photovoltaic power, the greater the TGC supply, the lower the TGC price while the easier to balance TGC demand, and more quickly reaching the maximum TGC price. Moreover, we find that the higher the subsidy price, the smaller fluctuation of market interplay between TGC demanders and photovoltaic power plants. When TGC excess demand changes into oversupply, the TGC price begins to drop. We find that the higher the subsidy price, the lower the TGC price, the slower the growth of both newly-added installed capacity and cumulative installed capacity of photovoltaic power, and the slower the growth of photovoltaic power industry’s profits. Although the high subsidy price contributes to increase investors’ enthusiasm, the too-low TGC price caused by high subsidy price leads to a reduction in the TGC market transaction activity, thereby reducing the investors’ enthusiasm. Through the contrast, we can see that a high subsidy price is propitious to the industry’s development in the TGC excess demand phase while a high TGC price is conductive to the industry’s development in the TGC oversupply phase.
In summary, we draw the following three conclusions from the simulation results. First, China’s photovoltaic power industry develops faster, increases in scale, and profits more with the constraints and actions of RPS quota proportion, TGC valid period and fines under RPS scheme. Second, the subsidy price is negatively correlated with the TGC price in industry’s development. Third, the promotion effect of FIT on new investment in the TGC excess demand phase is stronger than that in the TGC oversupply phase. In contrast, the promotion effect of TGC price on new investment in the TGC oversupply phase is stronger than that in the TGC excess demand phase.

3.3. Sensitivity Analysis

As mentioned above, policy makers set up mechanisms of RPS quota proportion, TGC valid period, and fine, to encourage industry’s development under RPS scheme. Various values of the three mechanisms will have different effects on industry’s development, and policy makers will develop their initial values accordingly. We set the FIT of the photovoltaic power as 0.89 Yuan/kWh in this section.

3.3.1. RPS Quota Growth Rate

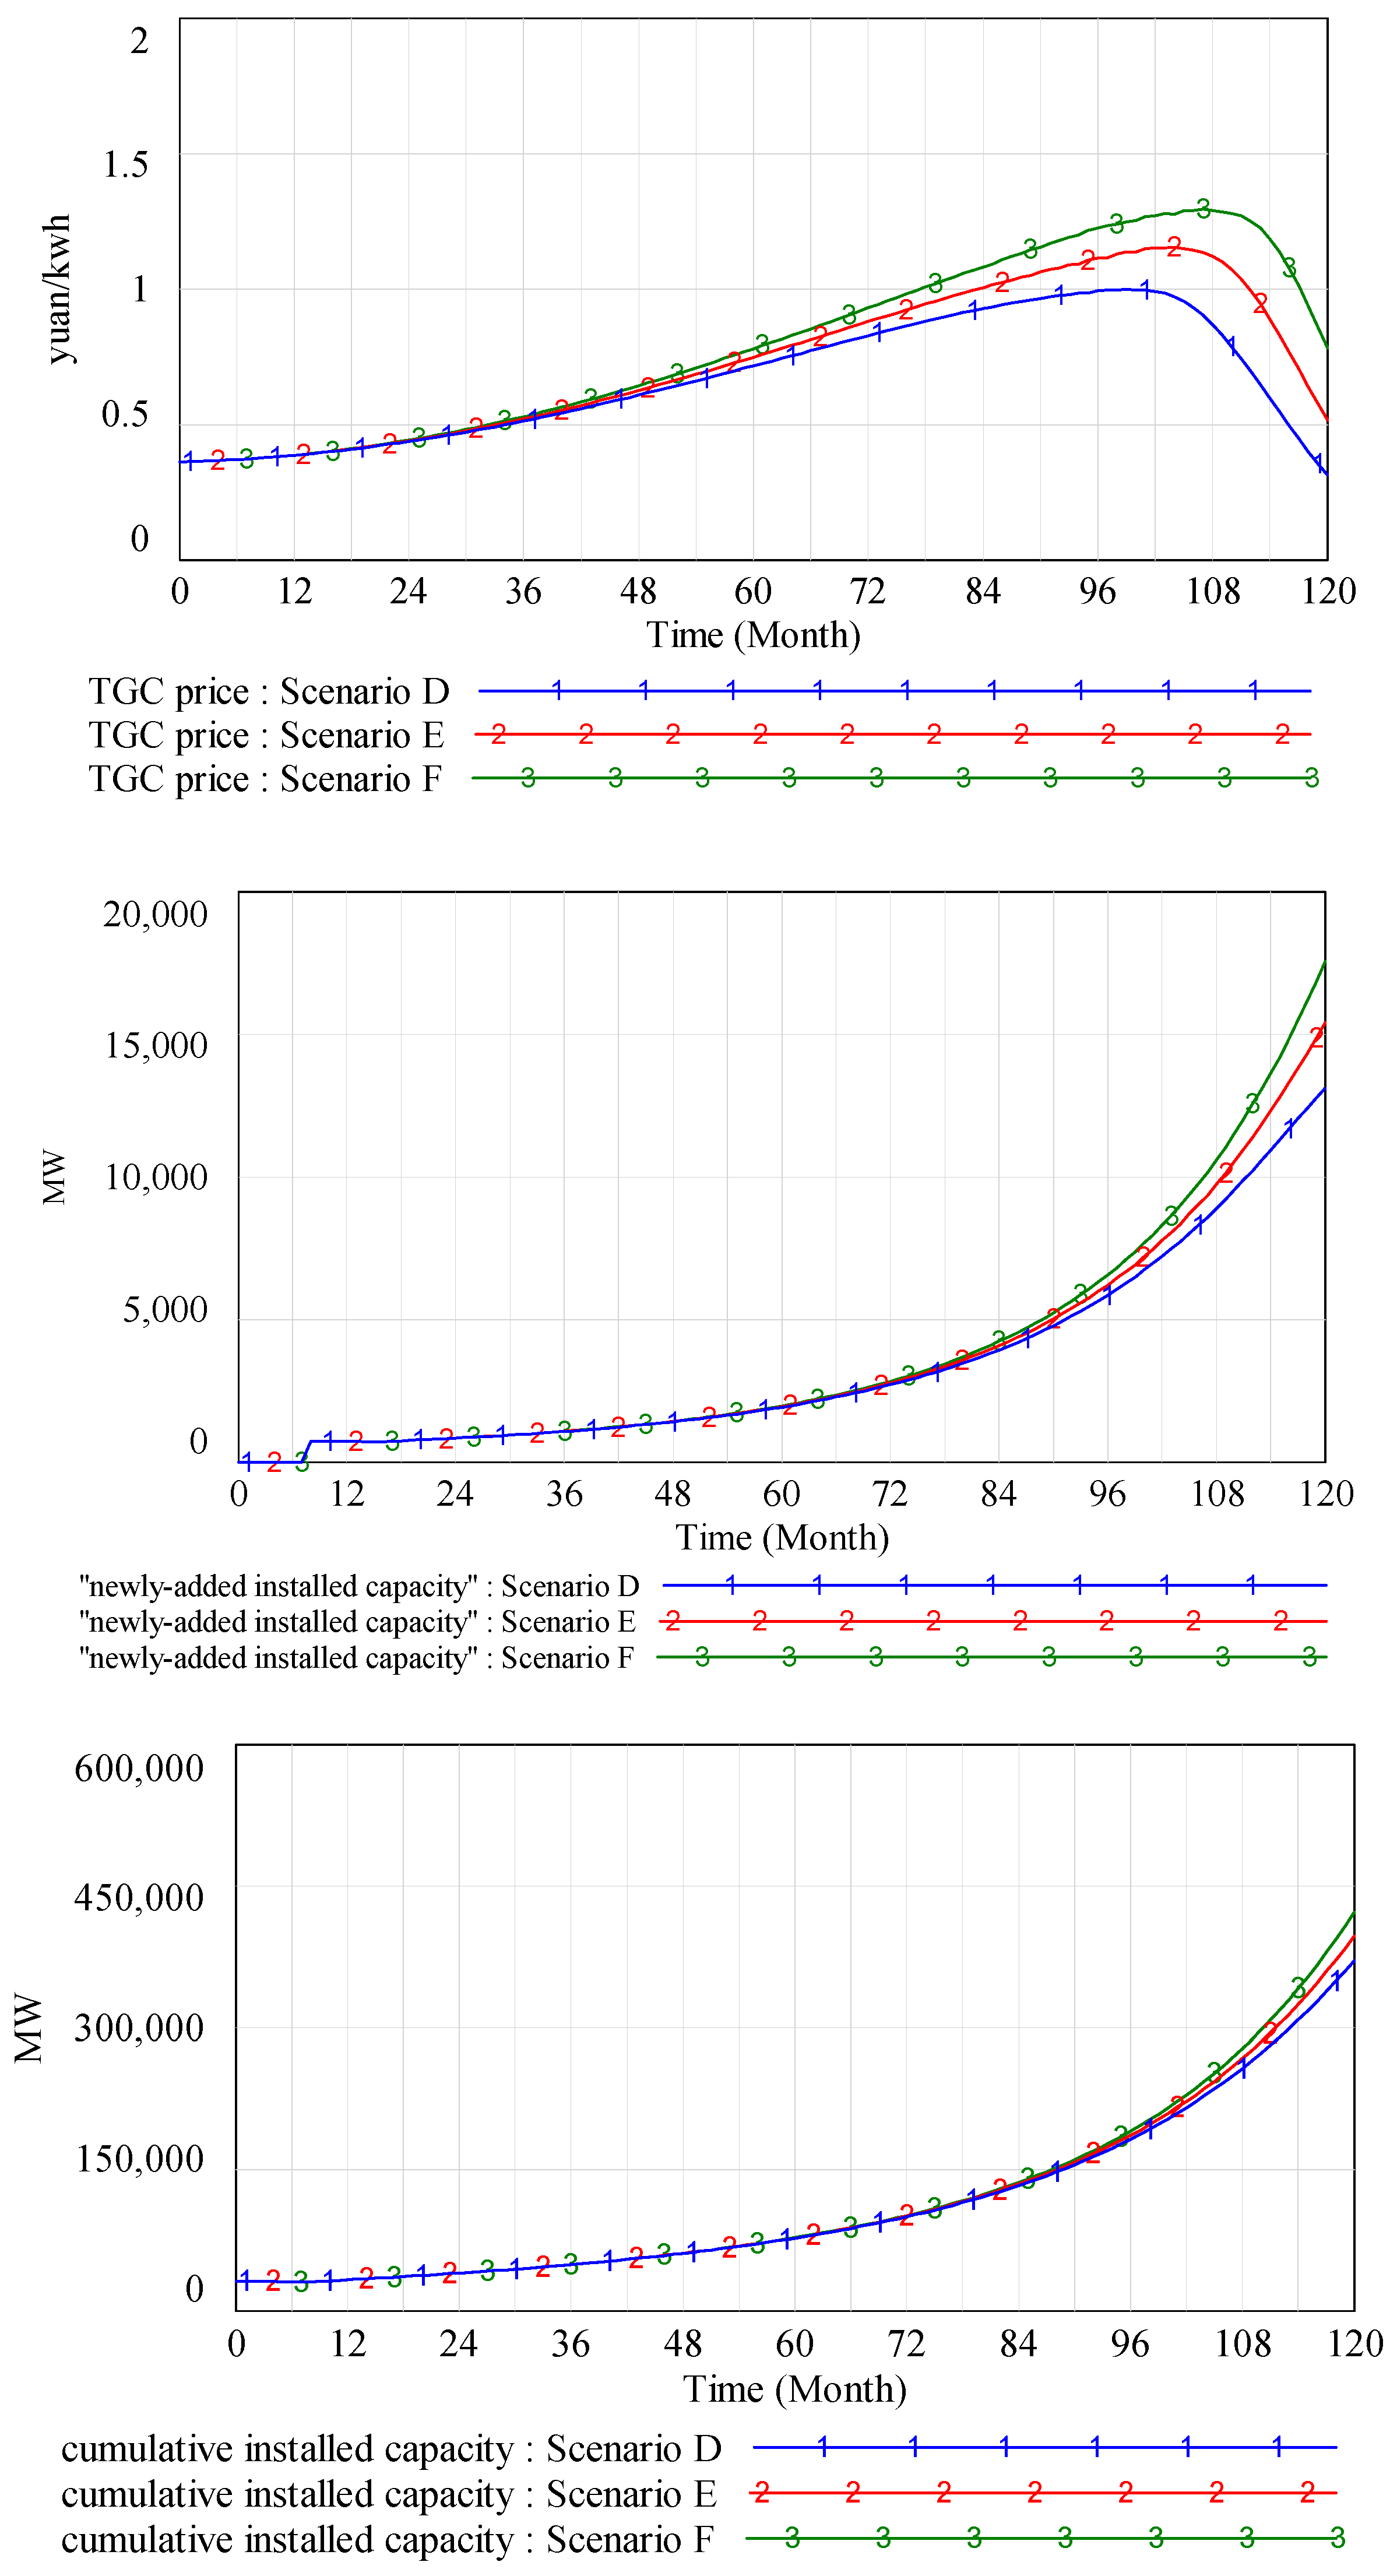
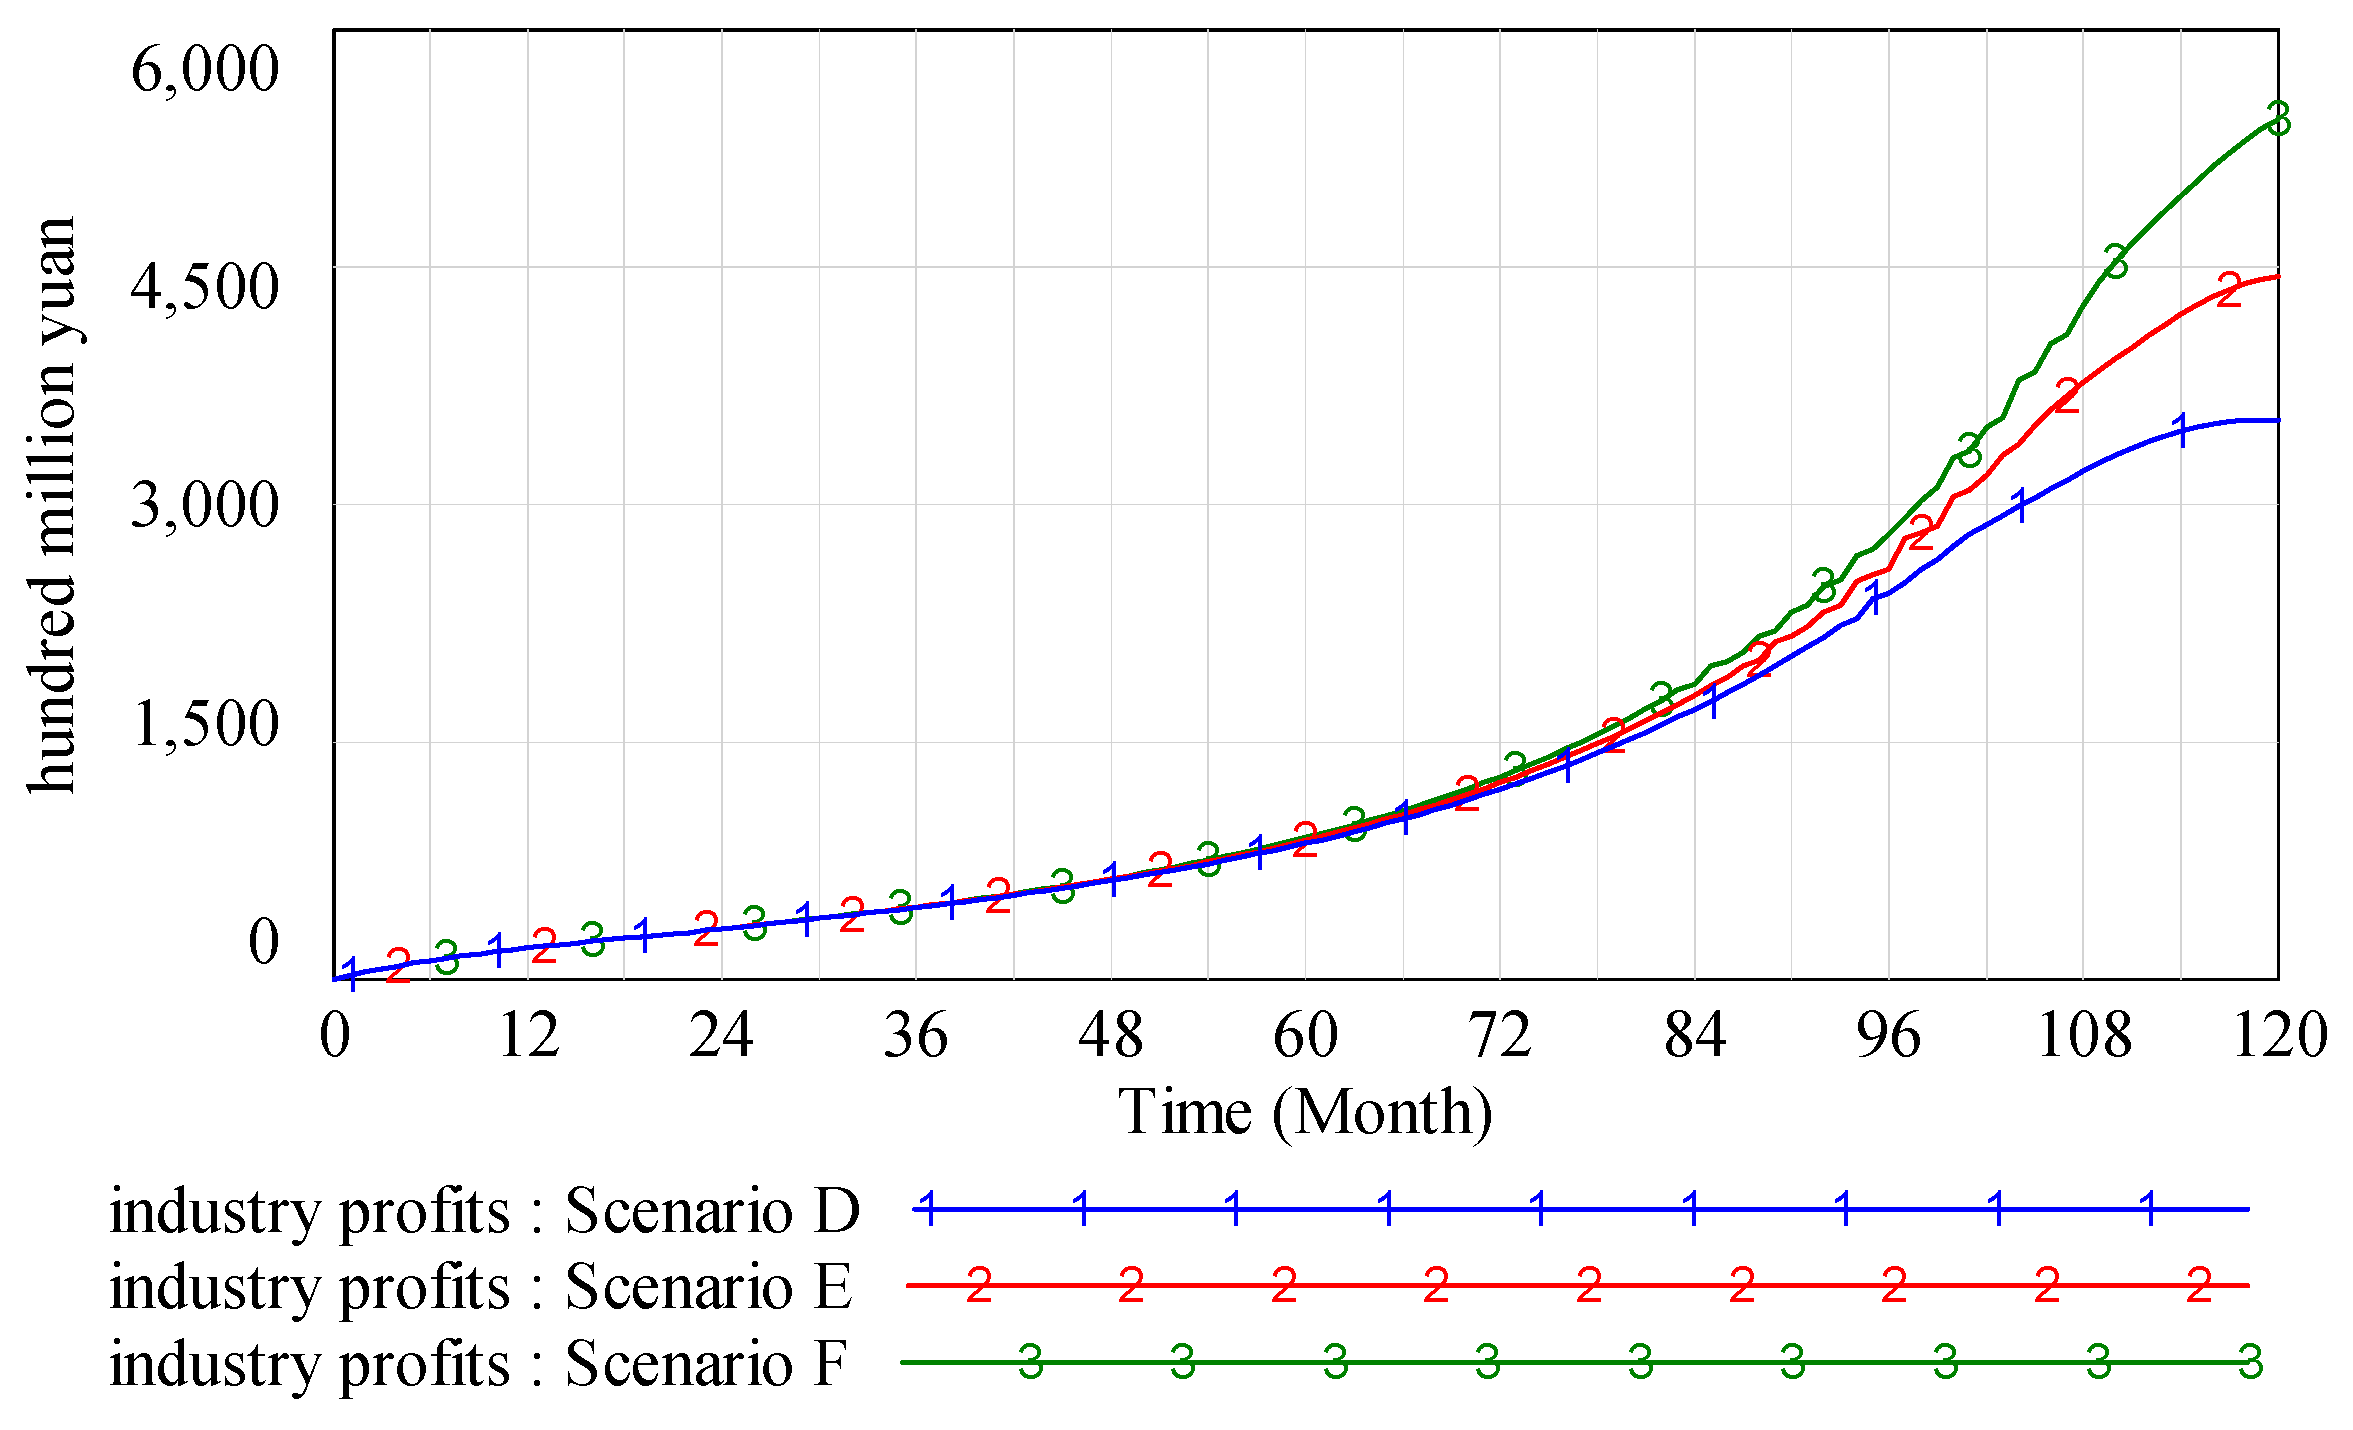
We set the RPS quota proportion of China’s photovoltaic power in 2025 as 6%, 6.5% and 7%; that is, the RPS quota growth rate is set at 1.5%, 1.57%, and 1.64%, respectively, each month as Scenarios D, E, and F, respectively. The simulation results are shown in Figure 8. We can see that the higher the RPS quota growth rate, the higher the TGC price, the greater the newly-added installed capacity and profits of the photovoltaic power industry, with the increases being fast and steady, and the more rapid growth of the cumulative installed capacity. This is because higher RPS quota proportion results in greater TGC demand, increased ease of promotion of market TGC transactions, and increased investor enthusiasm, thereby promoting industry’s development.

3.3.2. TGC Valid Period

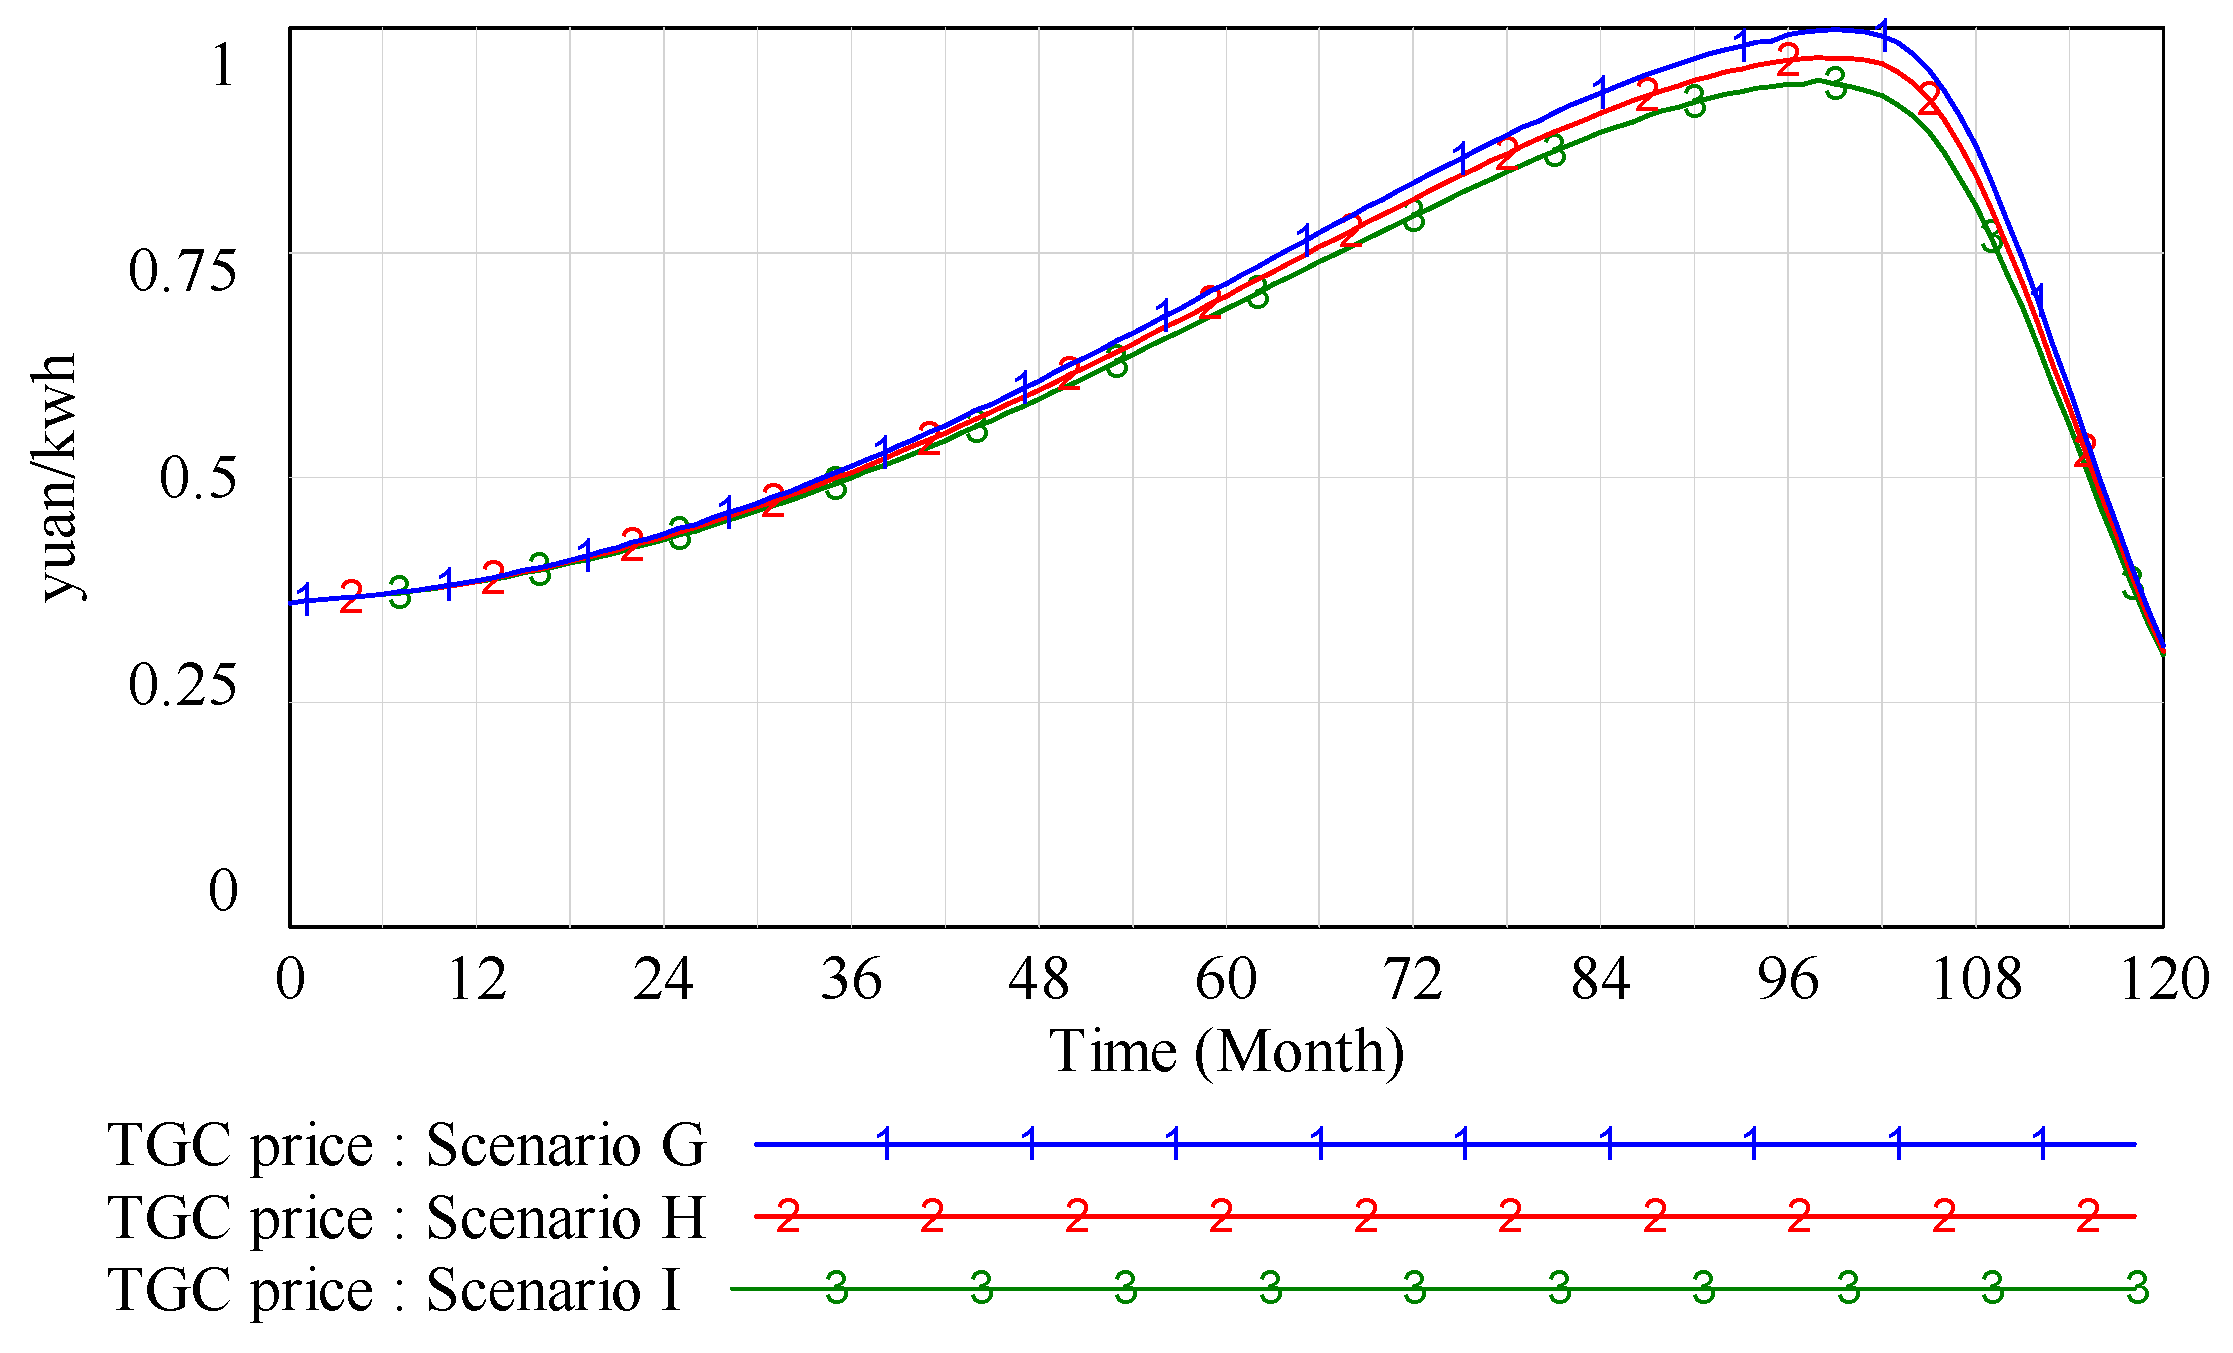
We set 12 months, 36 months, and 60 months of the TGC valid period as Scenarios G, H, and I, respectively, in this section. The simulation results are shown in Figure 9. The figure shows, first, that the longer the TGC valid period, the lower the TGC price, the smaller the magnitude of TGC price fluctuation, and the slower the growth of newly-added installed capacity, cumulative installed capacity, and profits of the photovoltaic power industry. This is because increases in the TGC valid period increases not only the amount of TGC that can be held by the transactors but also the length of time that it can be held and the amount that can be sold, thus being helpful for transactors to deal with long-term risk of the TGC price, and resulting in the lower TGC price and slower it rises and falls. Second, the figure also shows that the change of the TGC valid period has no significant effect on newly-added installed capacity, cumulative installed capacity, and profits of the photovoltaic power industry. As a mechanism that can flexibly adjust the transaction volume at different times, the TGC valid period has little effect on the total amount of TGC transactions and, thus, has no significant effect on development of the photovoltaic power industry.

3.3.3. Fine Level

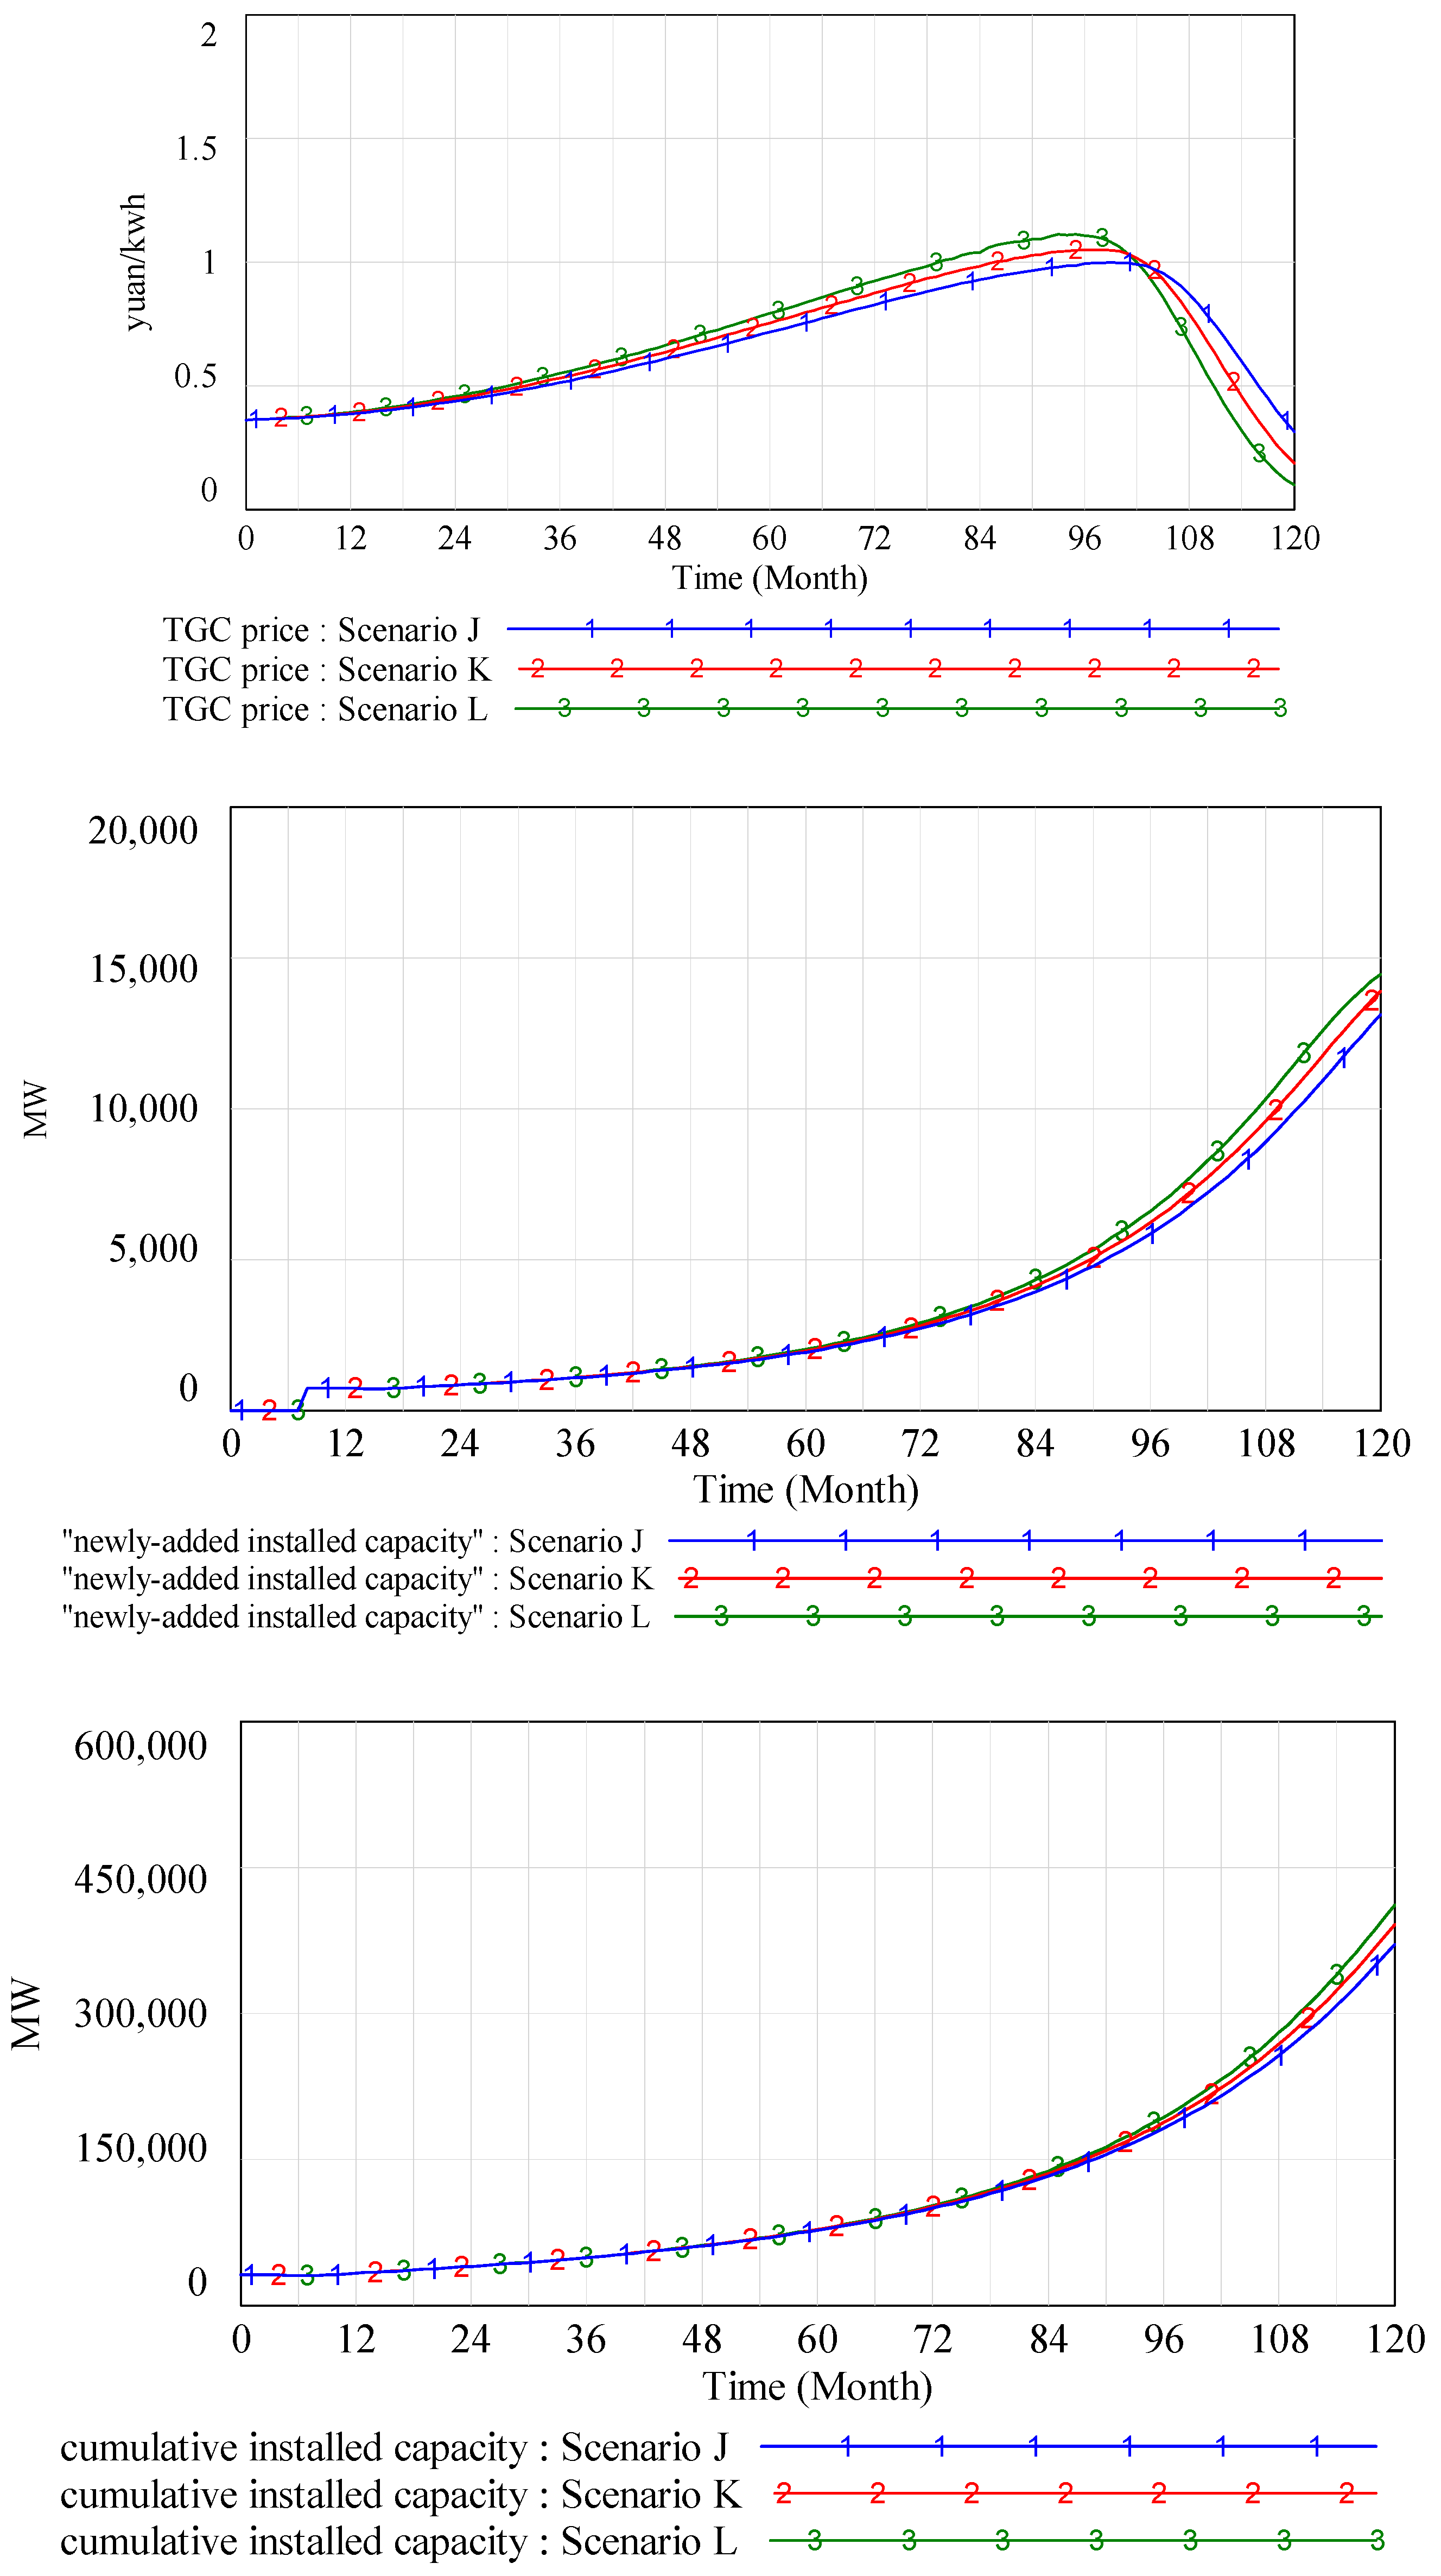
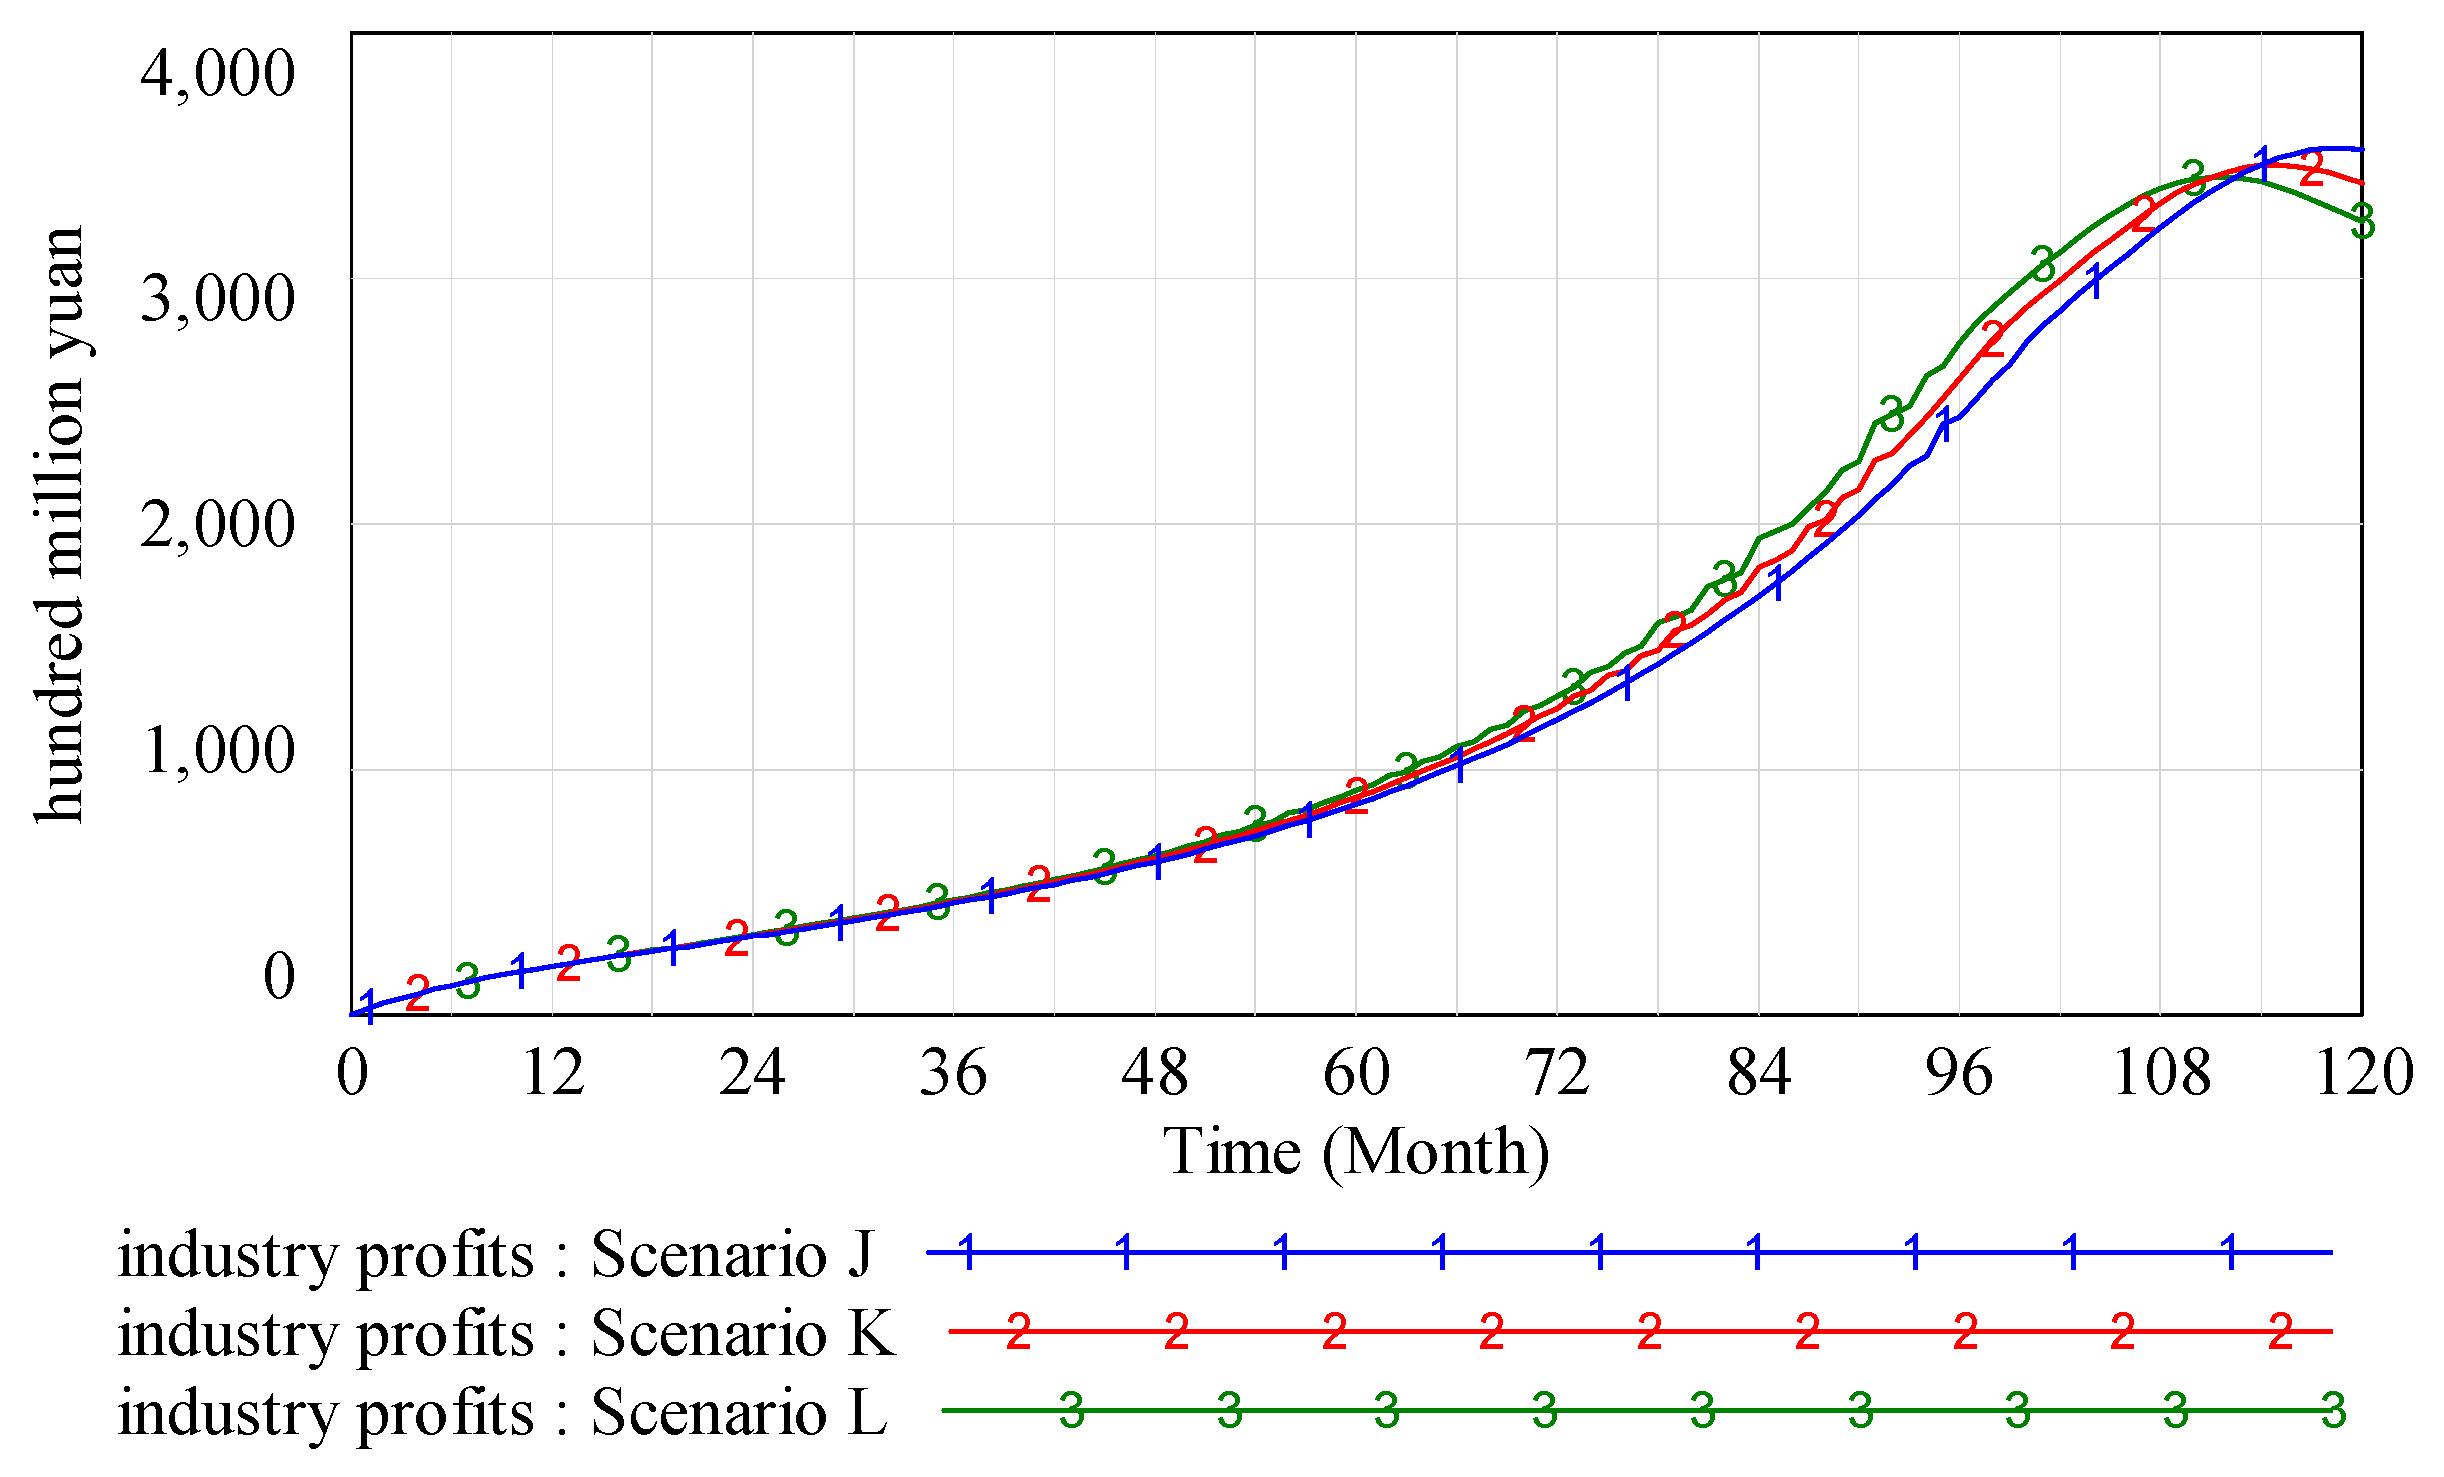
We set 1.4 Yuan/kWh, 1.6 Yuan/kWh and 1.8 Yuan/kWh of fine level as Scenarios J, K, and L, respectively, in this section. The simulation results are shown in Figure 10. We can see that the higher the fine, the greater the market incentive effect, the more active the market, the higher the TGC price, the greater the enthusiasm of investors, and the more rapid the development of the photovoltaic power industry. However, a too high fine level causes the photovoltaic power industry to develop too fast, resulting in TGC oversupply and a rapid fall in TGC price. Moreover, the higher fine leads to the faster the rate of decline, which results in the rapid decline of the growth of photovoltaic power industry’s profits. Thus, although a high fine level can stimulate market transactions and promote industry’s development, it will lead to greater fluctuations in the TGC price, which increases the risks of market transactions and is not conducive to the growth of photovoltaic power industry’s profits.

4. Discussion

To facilitate the theoretical study, the study sets some assumptions in the modeling process. However, in the process of policy implementation, many uncertain factors, such as the assumptions, have complex impacts on the development of the renewable energy power industry. In this section, we will discuss several assumptions set in the study.

4.1. Technological Progress

Technological progress is an important factor affecting industrial development. Using China’s photovoltaic power industry as an example, technical progress can improve the stability and safety of photovoltaic modules and other equipment, and improve photovoltaic power utilization. Moreover, it reduces the costs of photovoltaic power infrastructure construction, operation, and maintenance, in addition to other costs. Thus, it reduces the leveled-out cost of electricity (LCOE) of generating photovoltaic power in China, increases industry’s profits, and improves industry’s development under FIT [46,47]. The decline in LCOE of photovoltaic power generation reduces the dependence of the photovoltaic power industry on subsidy prices. Thus, the government will also reduce the FIT level and subsidy price at intervals [48]. This study shows that the reduction in FIT and subsidy price contributes to the long-term development of the photovoltaic power industry under RPS. Overall, technical progress has a positive effect on the development of China’s photovoltaic power industry under FIT and RPS.

4.2. Energy Abandonment

Countries around the world have the phenomenon of energy abandonment, albeit to different extents. China’s photovoltaic power curtailment, for example, is very serious, reaching approximately 10% in recent years [49]. Many factors cause photovoltaic power curtailment: on the one hand, photovoltaic power cannot be on-grid because of damage to photovoltaic modules and the lack of peaking capacity of traditional power [50]. On the other hand, photovoltaic power cannot be scheduled in time because of the unreasonable power supply structure [51]. Although development of the photovoltaic power industry is rapid under FIT, photovoltaic power curtailment reduces the industry’s profits, thereby reducing the investors’ enthusiasm, and the desired goals of industry’s development cannot be met. When RPS is implemented, the development of the industry is more rapid, the photovoltaic modules are safer and more reliable, and there is rapid installation of related facilities, in addition to peak-shaving, a reasonable power supply structure, and photovoltaic power dispatching to ensure more photovoltaic power on-grid. Lack of reasonable policies to solve these problems may lead to more serious photovoltaic power curtailment, reduction both of industry’s profits and of investors’ enthusiasm, an insufficient TGC supply, and imbalanced market supply and demand, which will, ultimately, seriously affect the development of the photovoltaic power industry.

4.3. Imperfect Competition Market

In general, the electricity market has not been an ideal perfect competitive market for a long time. An imperfect competitive market cannot fully realize information symmetry and maximize the efficiency of resource allocation. Moreover, the transaction price is not directly determined by supply and demand, and the market price signal cannot accurately adjust the behavior of traders, eventually resulting in market failure. China’s electricity market, for example, is mainly dominated by five power generation groups, the China state grid, and the southern power grid company, although NDRC has issued policies to break the electricity market’s monopoly and establish a perfect competitive market in the 13th Five-Year Plan power reform system [52,53]. This study shows that RPS can help to promote the development of China’s photovoltaic power industry in the perfect competitive market, when compared with FIT. In contrast, Tamás et al. [54] and Li et al. [55] study the effect of FIT and RPS on electricity market in an oligopoly market, and show that the access threshold of the power industries is high, the traditional power enterprises form a monopoly, renewable energy power enterprises find it difficult to access the market, the transaction price is distorted, and FIT is more effective than RPS in promoting the development of the renewable energy in an imperfect competition market. Thus, the degree of market competition directly determines the policy effects of RPS for the development of China’s photovoltaic power industry.

5. Conclusion and Policy Implications

This paper establishes SD models and uses China’s photovoltaic power industry as an example to analyze the development of the renewable energy power industry under the FIT and RPS schemes. The simulation results show that in the perfect competitive market, the implementation of RPS can promote long-term and rapid development of China’s photovoltaic power industry given the constraints and actions of the mechanisms of RPS quota proportion, the TGC valid period, and fines, compared with FIT. Then, the paper conducts a sensitivity analysis of the three mechanisms, and finally discusses several assumptions set in the study for critical comments against current situation. In summary, some policy implications in this paper are given as follows when implementing RPS policy.
First, at the beginning of RPS implementation, policy makers should continue implementing FIT to give photovoltaic power subsidies. When the supply and demand in the TGC market tends to balance, policy makers can either gradually reduce or cancel the subsidy price. This will contribute to the sustainable development of China’s photovoltaic power industry.
Second, to promote the development of the photovoltaic power industry, policy makers can, on the one hand, appropriately increase the RPS quota proportion, the TGC valid period and fine level. In particular, the fine level should not be too high. On the other hand, based on continuous technological progress, policy makers should introduce policies to promote photovoltaic power on-grid, reduce photovoltaic power curtailment, and improve photovoltaic power utilization.
Third, to improve the effectiveness of RPS policy, policy makers should actively promote reform of the power system, establish a perfect competitive market, and improve relative market mechanisms as soon as possible.
This paper notes some limitations that are still to be improved upon. Future studies will consider more realistic factors, such as the inflection point of electricity demand load forecasting, the auxiliary policy, the environmental constraints, and other uncertain factors, to generate a more scientific and accurate simulation of the development of the renewable energy industry.

Acknowledgments

This paper is supported by the Beijing Municipal Social Science Foundation (Grant No. 16JDYJB031), the National Natural Science Foundation of China (Grant No. 71273088) and the Energy Service Company Energy design and research institute of State Grid Corporation (Grant No. SGJNSJ00SCTS1600079).

Author Contributions

Yuzhuo Zhang and Xingang Zhao conceived and designed the models; Lingzhi Ren simulated the models; Yi Zuo and Ling Wang analyzed the data; Yuzhuo Zhang wrote the paper.

Conflicts of Interest

The authors declare no conflict of interest.

Appendix A

Table A1. The description of the parameters used in all formulas.
ParametersDescription
s i the impact of subsidy price on investment
L M C r e n e w a b l e the long run marginal cost of renewable energy power
p i the impact of industry’s profits on investment
I P Industry’s profits
C P the construction plan under FIT
I C c u m u l a t i v e the cumulative installed capacity
E D equipment depreciation
I C c u m u l a t i v e 0 the initial value of the cumulative installed capacity when time equals zero
t i the impact of TGC price on investment
A P TGC annual price
C P the construction plan under RPS
t i the impact of TGC price on investment after adjustment
T G C s a l e s the expected TGC sales amount
f fine
m the maximum value of probable TGC price
T G C p TGC price
T G C p 0 the initial value of TGC price when time equals zero
T G C h p TGC held by renewable energy power plants
T G C p u r c h a s e s the expected amount of TGC purchases
T G C h d TGC held by demanders
T G C t TGC turned in for RPS
T G C p f TGC price fluctuation
T G C o TGC oversupply
t f p adjustment time of TGC price fluctuation
α , ε , ϕ , η , δ , and λ economic parameters

References

  1. Zhang, M.M.; Zhou, D.Q.; Zhou, P.; Liu, G.Q. Optimal feed-in tariff for solar photovoltaic power generation in China: A real options analysis. Energy Policy 2016, 97, 181–192. [Google Scholar] [CrossRef]
  2. Kang, C.A.; Brandt, A.R.; Durlofsky, L.J. Optimal operation of an integrated energy system including fossil fuel power generation, CO2 capture and wind. Energy 2011, 36, 6806–6820. [Google Scholar] [CrossRef]
  3. Safdarnejad, S.M.; Hedengren, J.D.; Baxter, L.L. Plant-level dynamic optimization of cryogenic carbon capture with conventional and renewable power sources. Appl. Energy 2015, 149, 354–366. [Google Scholar] [CrossRef]
  4. Safdarnejad, S.M.; Hedengren, J.D.; Baxter, L.L. Dynamic optimization of a hybrid system of energy-storing cryogenic carbon capture and a baseline power generation unit. Appl. Energy 2016, 172, 66–79. [Google Scholar] [CrossRef]
  5. Lund, P.D. Effects of energy policies on industry expansion in renewable energy. Renew. Energy 2009, 34, 53–64. [Google Scholar] [CrossRef]
  6. Sun, P.; Nie, P.Y. A comparative study of feed-in tariff and renewable portfolio standard policy in renewable energy industry. Renew. Energy 2015, 74, 255–262. [Google Scholar] [CrossRef]
  7. Intelligent Energy Europe. Renewable Energy Policy Country Profiles. Available online: http://www.reshaping-res-policy.eu/downloads/RE-SHAPING_Renewable-Energy-Policy-Country-profiles-2011_FINAL_1.pdf (accessed on 1 March 2011).
  8. Wesseh, P.K.; Lin, B. A real options valuation of Chinese wind energy technologies for power generation: Do benefits from the feed-in tariffs outweigh costs? J. Clean. Prod. 2015, 112, 1591–1599. [Google Scholar] [CrossRef]
  9. Intelligent Energy Europe. RE-Shaping: Shaping an Effective and Efficient European Renewable Energy Market. Available online: http://www.reshaping-res-policy.eu/downloads/Final%20report%20RE-Shaping_Druck_D23.pdf (accessed on 1 February 2012).
  10. Dong, C.G. Feed-in tariff vs. renewable portfolio standard: An empirical test of their relative effectiveness in promoting wind capacity development. Energy Policy 2012, 42, 476–485. [Google Scholar] [CrossRef]
  11. National Development and Reform Commission. Notice on Improving the Feed-In Tariff of Photovoltaic Power Generation. Available online: http://www.sdpc.gov.cn/zcfb/zcfbtz/201108/t20110801_426501.html (accessed on 24 July 2011). (In Chinese)
  12. National Development and Reform Commission. Notice on Trial Implementation of Renewable Energy Tradable Green Certificate Issuance and Voluntary Subscription Trading System. Available online: http://www.ndrc.gov.cn/gzdt/201702/t20170203_837121.html (accessed on 18 January 2017). (In Chinese)
  13. Ziaii, S.; Cohen, S.; Rochelle, G.T.; Edgar, T.F.; Webber, M.E. Dynamic operation of amine scrubbing in response to electricity demand and pricing. Energy Procedia 2009, 1, 4047–4053. [Google Scholar] [CrossRef]
  14. Ritzenhofen, I.; Birge, J.R.; Spinler, S. The structural impact of renewable portfolio standards and feed-in tariffs on electricity markets. Eur. J. Oper. Res. 2016, 255, 224–242. [Google Scholar] [CrossRef]
  15. Bianco, V.; Manca, O.; Nardini, S. Electricity consumption forecasting in Italy using linear regression models. Energy 2009, 34, 1413–1421. [Google Scholar] [CrossRef]
  16. Farooq, M.K.; Kumar, S.; Shrestha, R.M. Energy, environmental and economic effects of renewable portfolio standards (RPS) in a developing country. Energy Policy 2013, 62, 989–1001. [Google Scholar] [CrossRef]
  17. Qudrat-Ullah, H. Green power in Ontario: A dynamic model-based analysis. Energy 2014, 77, 859–870. [Google Scholar] [CrossRef]
  18. Ford, A.; Vogstad, K.; Flynn, H. Simulating price patterns for tradable green certificates to promote electricity generation from wind. Energy Policy 2007, 35, 91–111. [Google Scholar] [CrossRef]
  19. Naill, R.A. System dynamics model for natural energy policy planning. Syst. Dyn. Rev. 1992, 8, 1–19. [Google Scholar] [CrossRef]
  20. Ford, A. System dynamics and the electric power industry. Syst. Dyn. Rev. 1997, 13, 57–85. [Google Scholar] [CrossRef]
  21. Ochoa, P. Policy changes in the Swiss electricity market: A system dynamics analysis of likely market responses. Socio-Econ. Plan. Sci. 2007, 41, 336–349. [Google Scholar] [CrossRef]
  22. Ponzo, R.; Dyner, I.; Arango, S.; Larsen, E.R. Regulation and development of the Argentinean gas market. Energy Policy 2011, 39, 1070–1079. [Google Scholar] [CrossRef]
  23. Olaya, Y.; Dyner, I. Modelling for policy assessment in the natural gas industry. J. Oper. Res. Soc. 2005, 56, 1122–1131. [Google Scholar] [CrossRef]
  24. Kamarzaman, N.A.; Tan, C.W. A comprehensive review of maximum power point tracking algorithms for photovoltaic systems. Renew. Sustain. Energy Rev. 2014, 37, 585–598. [Google Scholar] [CrossRef]
  25. Ming, Z.; Zhang, K.; Dong, J. Overall review of China’s wind power industry: Status quo, existing problems and perspective for future development. Renew. Sustain. Energy Rev. 2013, 24, 379–386. [Google Scholar] [CrossRef]
  26. Guo, X.; Guo, X. China’s photovoltaic power development under policy incentives: A system dynamics analysis. Energy 2015, 93, 589–598. [Google Scholar] [CrossRef]
  27. Ming, Z.; Chen, L.I.; Chao, L.; Li, S.; Shao, O. Wind power investment decision-making model and policy analysis considering the electricity price subsidies of wind power. Power Syst. Prot. Control 2012, 23, 17–23. (In Chinese) [Google Scholar]
  28. Li, Q.; Chen, M. Real option theoretical and empirical analysis on feed-in tariff policy of wind electricity in China. Chin. J. Manag. Sci. 2016, 24, 65–73. (In Chinese) [Google Scholar]
  29. Currier, K.M. A regulatory adjustment process for the determination of the optimal percentage requirement in an electricity market with tradable green certificates. Energy Policy 2013, 62, 1053–1057. [Google Scholar] [CrossRef]
  30. Zhao, E.; Liu, P. Policy effects of feed-in tariff and tradable green certificate-based on the development of biomass power industry in China. J. Ind. Technol. Econ. 2013, 9, 125–137. (In Chinese) [Google Scholar]
  31. Moxnes, E. Interfuel substitution in OECO-European electricity production. Syst. Dyn. Rev. 1990, 6, 44–65. [Google Scholar] [CrossRef]
  32. Shun-Kun, Y.U.; Zhou, L.S.; Chen, L.I. System dynamic model design for green certificate trading based on renewable portfolio standard. East China Electr. Power 2013, 41, 281–285. (In Chinese) [Google Scholar]
  33. Dyner, I.; Bun, D. A System Simulation Platform to Support Energy Policy in Columbia. Available online: https://www.london.edu/faculty-and-research/academic-research/s/systems-simulation-platform-to-support-energy-policy-in-colombia#.WN20lmex-Uk (accessed on 28 March 2017).
  34. Tan, Z.; Liu, W.; Liu, P. Policy Effect of Tradable Green Certificate and Carbon Emission Trading on China’s Electric Power Market. Technol. Econ. 2014, 33, 74–84. (In Chinese) [Google Scholar]
  35. Zhao, X.; Feng, T.; Yang, Y. Impacting Mechanism of Renewable Portfolio Standard on China’s power source structure and its effect. Power Syst. Technol. 2014, 38, 974–979. (In Chinese) [Google Scholar]
  36. Forrester, J.W. Industrial Dynamics; MIT Press: Cambridge, MA, USA, 1961. [Google Scholar]
  37. Sterman, J. Business Dynamics: Systems Thinking and Modeling for a Complex World; McGraw Hill Irwin: Boston, MA, USA, 2000. [Google Scholar]
  38. Qudrat-Ullah, H. On the validation of system dynamics type simulation models. Telecommun. Syst. 2012, 51, 159–166. [Google Scholar] [CrossRef]
  39. Qudrat-Ullah, H.; BaekSeo, S. How to do structural validity of a system dynamics type simulation model: The case of an energy policy model. Energy Policy 2010, 38, 2216–2224. [Google Scholar] [CrossRef]
  40. Barlas, Y. Multiple Tests for validation of system dynamics type of simulation models. Eur. J. Oper. Res. 1989, 42, 59–87. [Google Scholar] [CrossRef]
  41. China Photovoltaic Industry Association. China Photovoltaic Power Development Roadmap. Available online: http://www.miit.gov.cn/n1146290/n4388791/c5494592/part/5494596.pdf (accessed on 28 December 2016). (In Chinese)
  42. China Electricity Council. China’s Electricity Demand Will Remain Medium-Speed Growth. Available online: http://www.chinaccm.com/22/20150702/221301_2740791.shtml (accessed on 2 July 2015). (In Chinese).
  43. National Development and Reform Commission. Notice on Improving the Feed-In Tariff of Onshore Wind Power and Photovoltaic Power Generation. Available online: http://www.sdpc.gov.cn/zcfb/zcfbtz/201512/t20151224_768573.html (accessed on 22 December 2015). (In Chinese)
  44. National Energy Administration. Solar Energy Development in 13th Five-Year Plan. Available online: http://guangfu.bjx.com.cn/news/20161216/797481.shtml (accessed on 16 December 2016). (In Chinese).
  45. China Intelligent Manufacturing Net. The Installed Capacity of China’s Photovoltaic Power Will Reach 50 GW. Available online: http://www.gkzhan.com/News/Detail/30970.html (accessed on 23 January 2013). (In Chinese).
  46. Zhao, X.; Zeng, Y.; Zhao, D. Distributed solar photovoltaics in China: Policies and economic performance. Energy 2015, 88, 572–583. [Google Scholar] [CrossRef]
  47. Yuan, J.; Sun, S.; Zhang, W.; Xiong, M. The economy of distributed PV in China. Energy 2014, 78, 939–949. [Google Scholar] [CrossRef]
  48. National Development and Reform Commission. Notice on Adjusting the Feed-In Tariff of Onshore Wind Power and Photovoltaic Power Generation. Available online: http://www.sdpc.gov.cn/gzdt/201612/t20161228_833065.html (accessed on 26 December 2016). (In Chinese)
  49. Bird, L.; Lew, D.; Milligan, M.; Carlini, E.M.; Estanqueiro, A.; Flynn, D.; Gomez, E.; Holttinen, H.; Menemenlis, N.; Orths, A.; et al. Wind and solar energy curtailment: A review of international experience. Renew. Sustain. Energy Rev. 2016, 65, 577–586. [Google Scholar] [CrossRef]
  50. Li, C.; Shi, H.; Cao, Y.; Wang, J.; Kuang, Y.; Tan, Y.; Wei, J. Comprehensive review of renewable energy curtailment and avoidance: A specific example in China. Renew. Sustain. Energy Rev. 2015, 41, 1067–1079. [Google Scholar] [CrossRef]
  51. Zeng, M.; Yang, Y.; Wang, L.; Sun, J. The Power Industry Reform in China 2015: Policies, Evaluations and Solutions. Renew. Sustain. Energy Rev. 2016, 57, 94–110. [Google Scholar] [CrossRef]
  52. NDRC. Opinions on Further Deepening the Electric Power System Reform. Available online: http://www.chinasmartgrid.com.cn/news/20150323/600488.shtml (accessed on 15 March 2015). (In Chinese).
  53. NDRC. Notice on the Issuance of Supporting Documents for the Electric Power System Reform. Available online: http://www.sdpc.gov.cn/zcfb/zcfbtz/201511/t20151130_760016.html (accessed on 26 November 2015). (In Chinese)
  54. Tamás, M.M.; Shrestha, S.O.B.; Zhou, H. Feed-in Tariff and Tradable Green Certificate in Oligopoly. Energy Policy 2010, 38, 4040–4047. [Google Scholar] [CrossRef]
  55. Li-Bo, W.U.; Sun, K.G.; Chen, Y.L. A comparison of renewable energy policies in imperfect competition electricity market. China Popul. Resour. Environ. 2015, 10, 53–60. (In Chinese) [Google Scholar]
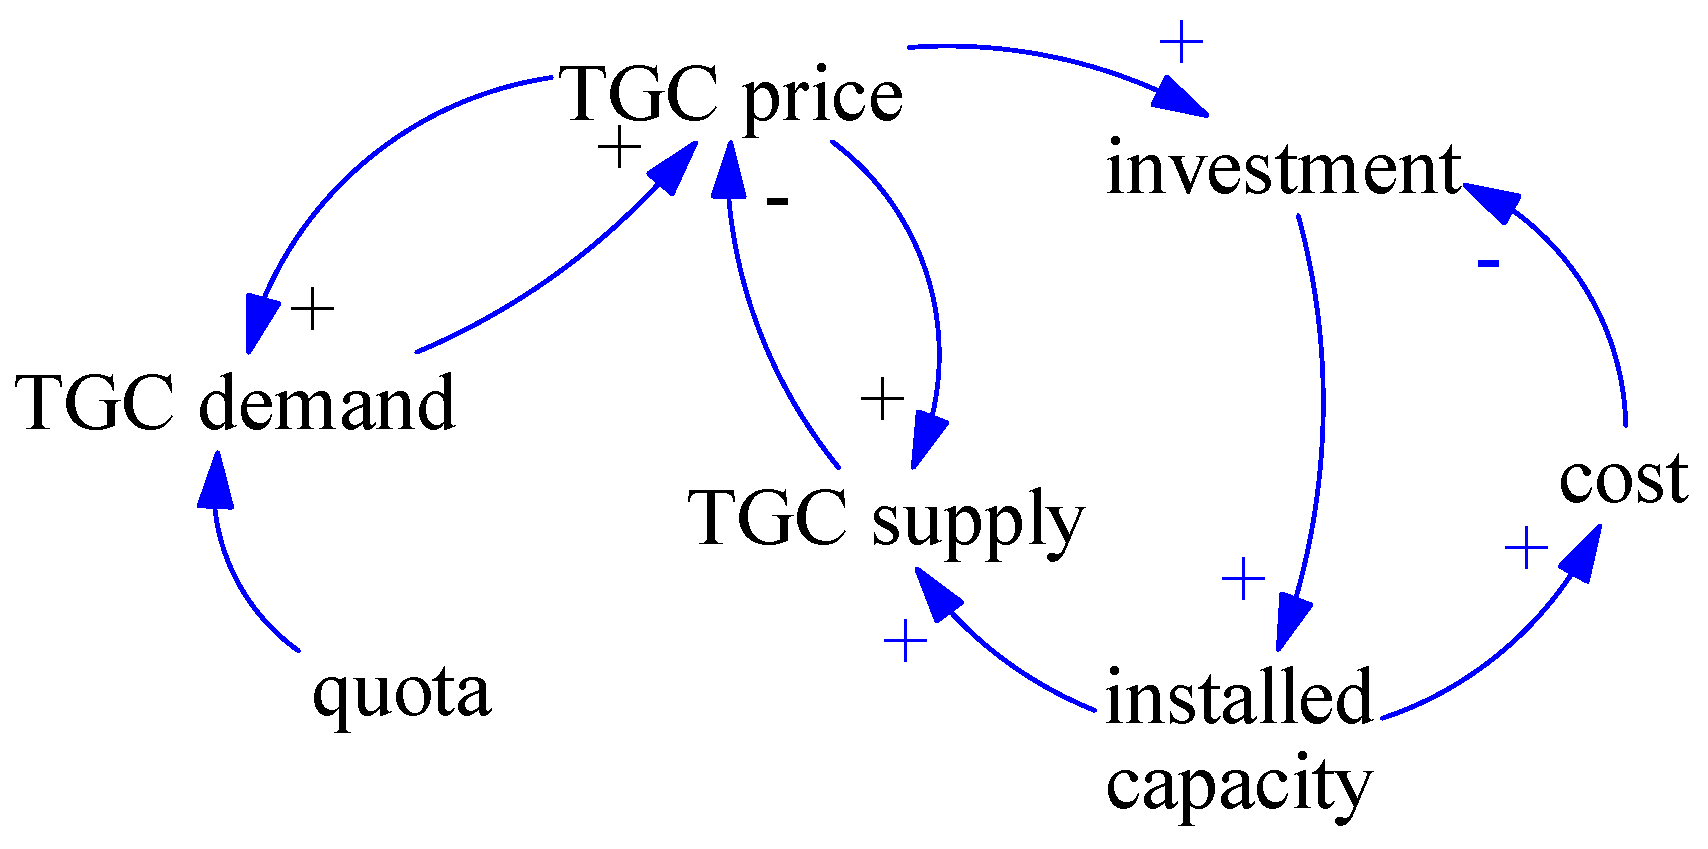
Figure 1. The dynamics of the variables in renewable energy power industry system.
Sustainability 09 00532 g001
Figure 2. The theoretical framing of renewable energy power industry development model.
Sustainability 09 00532 g002
Figure 3. The flow graph of renewable energy power industry development under FIT scheme.
Sustainability 09 00532 g003
Figure 4. The flow graph of renewable energy power industry development under RPS scheme.
Sustainability 09 00532 g004
Figure 5. Summary of the models boundary.
Sustainability 09 00532 g005
Figure 6. The simulation results of China’s photovoltaic power industry development under FIT.
Sustainability 09 00532 g006
Figure 7. The simulation results of China’s photovoltaic power industry development under RPS scheme.
Sustainability 09 00532 g007aSustainability 09 00532 g007b
Figure 8. The sensitivity analysis of RPS quota growth rate.
Sustainability 09 00532 g008aSustainability 09 00532 g008b
Figure 9. The sensitivity analysis of TGC valid period.
Sustainability 09 00532 g009aSustainability 09 00532 g009b
Figure 10. The sensitivity analysis of fine level.
Sustainability 09 00532 g010aSustainability 09 00532 g010b
Table 1. The models’ structures adopted from the existing work.
Structures/ConceptsRemarks
Investment incentive dynamics [33]Causal structure was adopted
RPS implementation process [18]Causal structure was adopted
Installed capacity structure [31]Structural formulation was adopted
Industry profits module [30]Structural formulation was adopted
Table 2. The key parameters and their practical initial values of China’s photovoltaic power industry.
Key ParametersInitial ValueUnitData Resource
RPS quota proportion1%-survey of the data from China Electricity Council
RPS quota growth rate1.5%-National Energy Administration
Electricity demand growth rate0.25%-National Energy Administration
Tax rate7.5%-China Statistical Yearbook
Lending rate6.9%-China Statistical Yearbook
Self-consumption of photovoltaic power plants2%-survey of the data from China Electricity Council
Long run marginal cost of photovoltaic power0.66Yuan/kWhsurvey of the data from China Electricity Council
Long run marginal cost of traditional power0.3Yuan/kWhsurvey of the data from China Electricity Council
FIT of photovoltaic power0.89Yuan/kWhNational Energy Administration
Operation maintenance unit cost0.053Yuan/kWhsurvey of the data from China Electricity Council
Annual utilization hours1200hour/annualsurvey of the data from China Electricity Council
Construction unit cost8000Yuan/kWsurvey of the data from China Electricity Council
Electricity demand3 × 1011kWhNational Energy Administration
Cumulative installed capacity31043MWNational Energy Administration
Construction period8monthsurvey of the data from China Electricity Council
Equipment life cycle20yearsurvey of the data from China Electricity Council
Table 3. The key parameters and their assumed values of China’s photovoltaic power industry.
Key ParametersAssumed ValueUnitReferences
Maximum value of probable TGC price1.3Yuan/kWh[35]
Fine1.4Yuan/kWh[32]
Adjustment time of TGC price trend3month[32]
Adjustment time of TGC price fluctuation2month[34]
TGC valid period12month[32,35]
Table 4. The compare results of simulation and planning in 2020 (Time = 60).
Installed Capacity (GW)Profits Annual Growth Rate (Time from 0 to 60)
Planning [44,45]609%
Simulation57.38.3%
Error4.5%7.8%