Article

A Carbon Emission Evaluation for an Integrated Logistics System—A Case Study of the Port of Shenzhen

School of Economics and Commerce, South China University of Technology, Guangzhou 510006, China
*
Author to whom correspondence should be addressed.
Sustainability 2017, 9(3), 462; https://doi.org/10.3390/su9030462
Submission received: 6 December 2016 / Revised: 16 March 2017 / Accepted: 17 March 2017 / Published: 20 March 2017

Abstract

:
The port is an important node in logistics, and its energy consumption constitutes a considerable proportion of the transportation industry. In port logistics, not only does the energy consumption generate carbon emissions, but other business activities do as well. This paper firstly characterizes the sources of carbon emissions and the basic elements in the port system, and proposes the concept of a port-integrated logistics system. Secondly, a case study of The Port of Shenzhen is conducted and a method is provided to measure the carbon emissions in the port-integrated logistics system. This paper then suggests two approaches to reducing carbon emissions, and their economic and environmental benefits are compared. Finally, some policies are put forward to reduce carbon emissions, such as improving the efficiency of loading and unloading, and replacing the heavy fuel oil by low sulfur fuel oil and shore power. The proposed method of carbon emission reduction for port-integrated logistics systems can be generalized for the analysis of various types of ports.

1. Introduction

Rapidly increasing greenhouse gases (GHGs) have become a world-wide issue. Energy is produced mainly via water conservancy, electric power, wind power, nuclear power, oil, and coal. Some of these produce carbon emissions, while others do not. Energy is currently produced mainly via oil and coal. Most energy consumption produces carbon emissions, especially carbon dioxide. Climate change has become a significant environmental threat, and carbon dioxide promotes climate change. The Kyoto Protocol has made people aware of the severity of CO2 pollution from transport. Thus, reducing CO2 emission makes a significant contribution to minimizing the adverse impacts of climate change. To effectively achieve CO2 emission reduction goals, solutions should be considered by governments when implementing sustainable freight distribution policies.
Ports are important nodes in that they improve modern logistics. In recent years, ports have enriched their logistics and business functions, and researchers have tried to develop an integrated logistics system. While ports obtain economic benefits, they also bring much pollution, including noise pollution, water pollution, and air pollution. The air pollution, of which the most far-reaching is carbon emission, is quite serious. Carbon emission is a general name and is an abbreviation of greenhouse gas emissions. It not only refers to CO2 emission but also that of other gases such as nitrous oxide, Freon, methane, hydrofluorocarbons, and sulfur hexafluoride [1]. The impacts of carbon emissions lie in increasing the greenhouse effect, resulting in global warming. Global warming is detrimental to the human food supply and the living environment. It also threatens the balance of natural ecosystems. Using low sulfur fuel oil (LSFO) can reduce most greenhouse gases in the port zone. Hong Kong, the European Union (EU), and some states of America have made related provisions and have required ships to use LSFO. California’s local government has forced berthed ships to use LSFO since July 2009. A port’s location, construction, operation, and development affect the living environment of nearby residents as well as the social and economic environment of the area. The environmental problems of ports are generally concerning. Therefore, to decrease the carbon emissions and be environmentally friendly, researchers suggest that fuel oil should be replaced by shore power or LSFO.
Shenzhen, located in the south of China, is a pivotal point for shipping lines crossing the Pacific Ocean and Southeast Asia. It has approximately 10 million people living on 1996 square kilometers of land, making it a populated city. Shenzhen’s economy is immensely dependent on foreign trade, with exports accounting for 24% of its gross domestic product in 2015. As a foreign trade city, maritime transportation plays an important role in Shenzhen’s economic development. The industrialization of Shenzhen’s economy relies more on non-renewable fossil fuels. Therefore, CO2 emission from energy consumption has dramatically increased. According to the chief of Shenzhen harbor authority, Wang [2] said that all construction materials, 90% of primary energy sources, 70% of the daily materials, and 60% of the foreign trade goods were developed by the port and waterway industry. The port industry system had developed into one of the pillars of the city’s social economy. In 2004, the Port of Shenzhen completed the container throughput of 7.618 million twenty feet equivalent unit (TEU). In recent years, the rapid development of the Port of Shenzhen has attracted attention. Handling most of the ocean liner routes in China, the Port of Shenzhen mostly completes 1/5 of port container throughput. In addition, direct traffic amounts to 1/3 of domestic coastal ports, and the economic promoting effect is obvious. Wang [2] emphasized that Shenzhen would try to improve the business environment and strive to build more than 100 international liner routes.
The 13th Five-Year Plan [3] on the transportation industry began in 2015 and will end in 2020. The unit energy consumption and carbon emission intensity should fall by 6% and 7%, respectively, on sailing ships. The rate of integrated energy consumption and carbon emissions should drop by 3% and 4%, respectively, with unit operation throughput in the ports. The retention rate of clean energy and new energy trucks should increase by 50%.
The Shenzhen government has paid great attention to carbon reduction as the proportion of ocean transportation in logistics has risen. The ports are forced to use clean energy step by step. However, while the existing literature mainly covers port-integrated logistics from the perspective of cost, few research has focused on carbon emission reduction. Thus, the main contributions of this paper are as follows. Firstly, we come up with the concept of a port-integrated logistics system from the perspective of carbon emission reduction. Secondly, we continually build a carbon emission calculation model, which is suitable for all port-integrated logistics systems. Through a mass of investigation data and literature research, related emission coefficients are determined. Thirdly, we put forward some concrete proposals to reduce carbon emissions, which are accepted by the Shenzhen government and are helpful for port development in the long run.
This paper takes the Port of Shenzhen as an example to optimize port operation from the perspective of carbon emission reduction. The proposed method can be generalized to analyze the port-integrated logistics system. It is organized as follows. Section 2 is a literature review of port-integrated logistics, the environmental protection of ports, and the application of carbon emission models. This is followed by a learning method in Section 3. Section 4 presents models that are used to estimate carbon emissions from transportation, heavy equipment, materials, and energy consumption. Section 5 presents the results of carbon emissions in the Port of Shenzhen from a scenario analysis. Finally, suggestions and conclusions are provided in Section 6 and Section 7, respectively.

2. Literature Review

Academics generally hold the view that the development of integrated logistics is a major current trend. Much literature has studied the development trend of port-integrated logistics. It is widely recognized that functional diversification and service integration will become the trend. Recently, research has focused on port logistics development strategies and the evaluation of ports [4]. Through conceptualizing ports from logistics management, it is possible to suggest a relevant framework of port performance [5]. Lu and Wu [6] recommended green port standards in green port construction for the Chinese government to develop and set up an environmental port logistics system. Their research emphasized the importance of port-integrated logistics, and they encouraged ports to provide multifunctional logistics services.
Ports play an important role in international commerce and provide various logistics services, but they also cause environmental problems. Research mainly focuses on the formation of environmental problems in port-integrated logistics. Currently, the world shipping industry has a common goal to provide environmentally friendly shipping services [7]. It is found that port site selection, energy utilization efficiency, and resource utilization are the main reasons for the environmental problems of ports [8]. Liu [9] points out that shipping, goods, dock, and city are the four main port pollution-influencing factors. He also proposes suggestions on environment and harbor transport. Berechman [10] considers that oil tankers, container ships, bulk carriers, and trucks are the main sources of emissions. Goulielmos [11] argues that environmental protection issues should be introduced into the production function of ports. In addition, he points out the conflicts of objectives between the two E.U. main directorates (Transport and Environment). Shang [12] stresses that environmental management plan should be prioritized in port construction. The planning and layout of green ports are discussed [13]. Acciaro [14] develops a method for quantifying the success of innovation with respect to a set of specific objectives. Onshore power supply and alternative fuels are used to solve the problem of port power. Palantzas [15] introduces the advanced experience of the New York–New Jersey port. Gou [16] lists standards in AHP and classifies the environmental factors of Shanghai Port based on the importance of environmental factors. Ling [17] establishes the evaluation indicators of green ports in Shanghai. He establishes an energy consumption evaluation indicator system and an energy consumption evaluation model [18]. A fuzzy analytic hierarchy process (FAHP) is used to evaluate energy saving and the consumption reduction of ports, and a practical case study is attached [19]. Research on ports’ environmental problems mainly studies influence factors, recommends methods on how to reduce them, and establishes evaluation indicators for green ports.
Severe environmental problems have attracted worldwide attention. A great number of developed and developing countries signed the Kyoto Protocol, and scholars then paid great attention to the study of carbon emissions. Recent studies have focused on the calculations of carbon emissions. Liu [20] analyzed existing carbon emission measurement methods and found that the discharge coefficient method is used most widely. Since measuring systems can be a reference for discharge coefficients, researchers concentrated on the characteristics of carbon emissions. Yu [21] and Song [22] calculated carbon emissions in mining coal and construction cycle logistics, respectively. Studying carbon emissions in the entire supply chain has had a significant effect. In the field of transportation, networks, and location, Benjaafar [23] analyzed the distribution of optimal carbon emissions between different factories’ and consumers’ locations. Kim [24] studied the carbon emissions of multimodal transport. After that, he focused on the carbon emission changes between different networks and various modes of transportation. Carbon emissions of the entire supply chain were studied, and related suggestions to reduce supply chain carbon emissions were then put forward [25]. Research has mainly focused on carbon emission calculations in logistics from the construction cycle, the transportation network, the location, and the whole supply chain.
After studying the supply chain, some scholars began to calculate carbon emissions in port logistics. Peng [26] took Jurong Port as an example and introduced methods to measure carbon emissions on container terminals and provided reduction suggestions in light of the results. Some statistical methods on energy consumption have been summarized [27], and a new model of energy consumption taking the characteristics of China’s ports into account has been raised. Chim [28] studied what the changes in carbon emissions would be if there were a new emerging port for inland container transport. Fitzgerald [29] proposed a calculation model of carbon dioxide emissions for the New Zealand maritime industry. Xiao [30] did research on a specific kind of emission source taking the container crane as an example, and introduced calculation models for port heavy equipment.
Above all, there is much literature on the environmental problems of ports and port-integrated logistics, and some scholars have begun to study the carbon emissions. Existing port carbon emission research has mostly focused on specific equipment or specific work systems. There has also been some research on carbon emissions at piers. However, very few have analyzed carbon emissions of the entire port logistics service. Among port logistics researchers, few are involved in environmental protection. Therefore, this paper helps to fill this theoretical gap. It quantifies carbon emissions from various kinds of services and aims to analyze the energy consumption in the integrated logistics service. This paper also optimizes the development pattern in practice, and provides a reference for port enterprises seeking to transform and upgrade.

3. Methods

Traditional port logistics mainly provides warehousing and transportation services. With the evolution of the port from generation to generation, port logistics functions are undergoing profound changes to satisfy the requirements of society. Ports focus on their logistics development and services [4]. The functions of ports are supplemented with processing, packaging, distribution, information processing, and other value-added modern logistics services. In addition, ports attract finance, insurance, information, and other modern service industries to the port service supply chain.

3.1. The Port-Integrated Logistics System

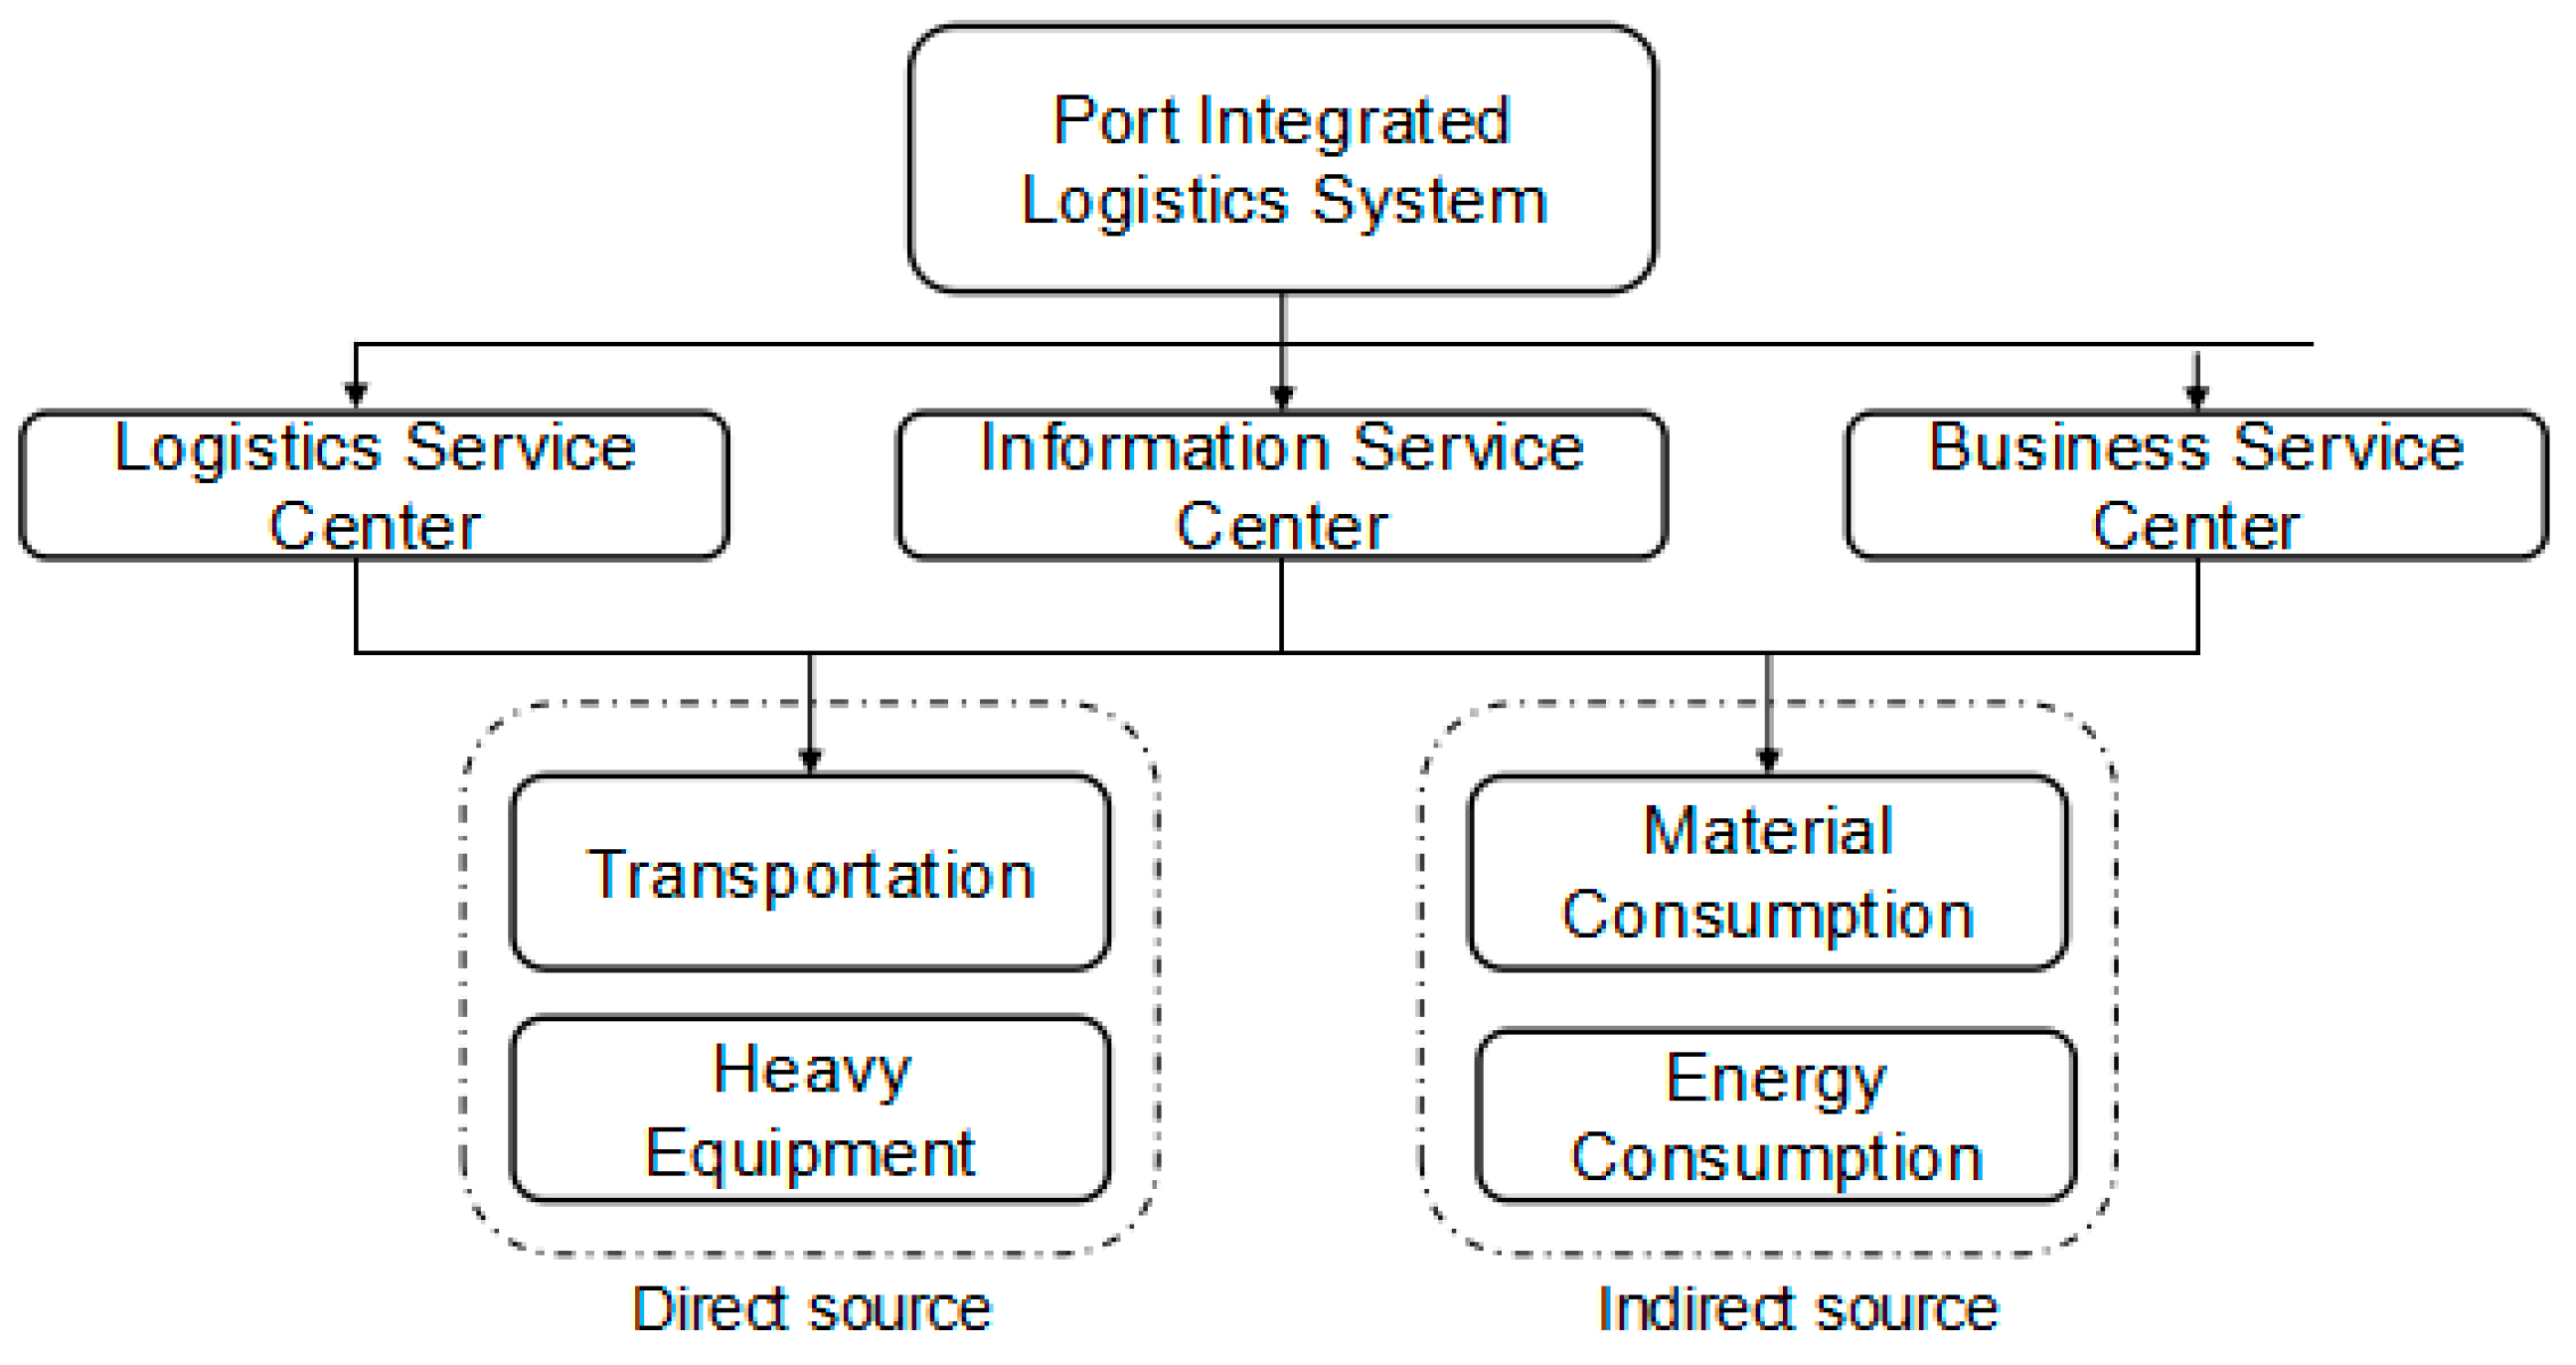
Port-integrated logistics is a system that provides comprehensive multi-purpose logistics service. It only provides warehousing and transport services, but also integrates purchasing agents, processing, distribution, logistics, and financial services, and information processing. In addition, it consists of a logistics service center, a business service center, and an information service center, which aim to provide users with multifunctional integrated logistics services [5]. The detailed functions of a port-integrated logistics system are shown as Figure 1.
The logistics service center is a key node for integrated logistics. Its functions come from traditional storage and transportation services. With evolution and development, other services such as procurement, shipping, and distribution processing have become integrated. To improve the efficiency of multimodal transport, ports provide comprehensive logistics services for different kinds of transportation and logistics nodes. The logistics service center aims to serve all kinds of customers. Therefore, ports need to provide transportation, warehousing, loading and unloading, processing, distribution, and other logistics services, and then integrate them into a complete service system. The service system can improve service efficiency, reduce cost, and provide customers with a multifunctional, integrative, and personalized service [5]. These ports will be more competitive in the market.
The information service center is a crucial node for port-integrated logistics, which distinguishes it from traditional port logistics. The main functions include information processing, information feedback on the logistics, trade, finance, and government affairs. Port-integrated logistics provides information services to customers that smooth the commercial flow, the material flow, and the funds flow in the business. Ports set up information databases and improve the level of information management, which aims to simplify the procedures and provide modern services for the global supply chain.
The business service center mainly provides insurance, banking, financial services, and procurement logistics. For example, ports develop the procurement logistics service by integrating and selecting sourcing resources for customers, and provide outsourcing supply chain services based on a port’s characteristics. In addition, it not only provides the display, exchange, and other policy advantages in the free trade zone, but also provides investment financing services, such as warehousing credits for logistics enterprises.

3.2. Carbon Emissions Sources

Carbon emissions in the port-integrated logistics system mainly come from four kinds of emission sources: transportation, heavy equipment, materials, and energy consumption. A logistics service center usually releases a great amount of direct carbon emissions. During the operation stage of the information service center and the business service center, information management only produces indirect carbon emissions due to its energy and materials consumption. Thus, there are direct and indirect emission sources in this system shown in Figure 2.
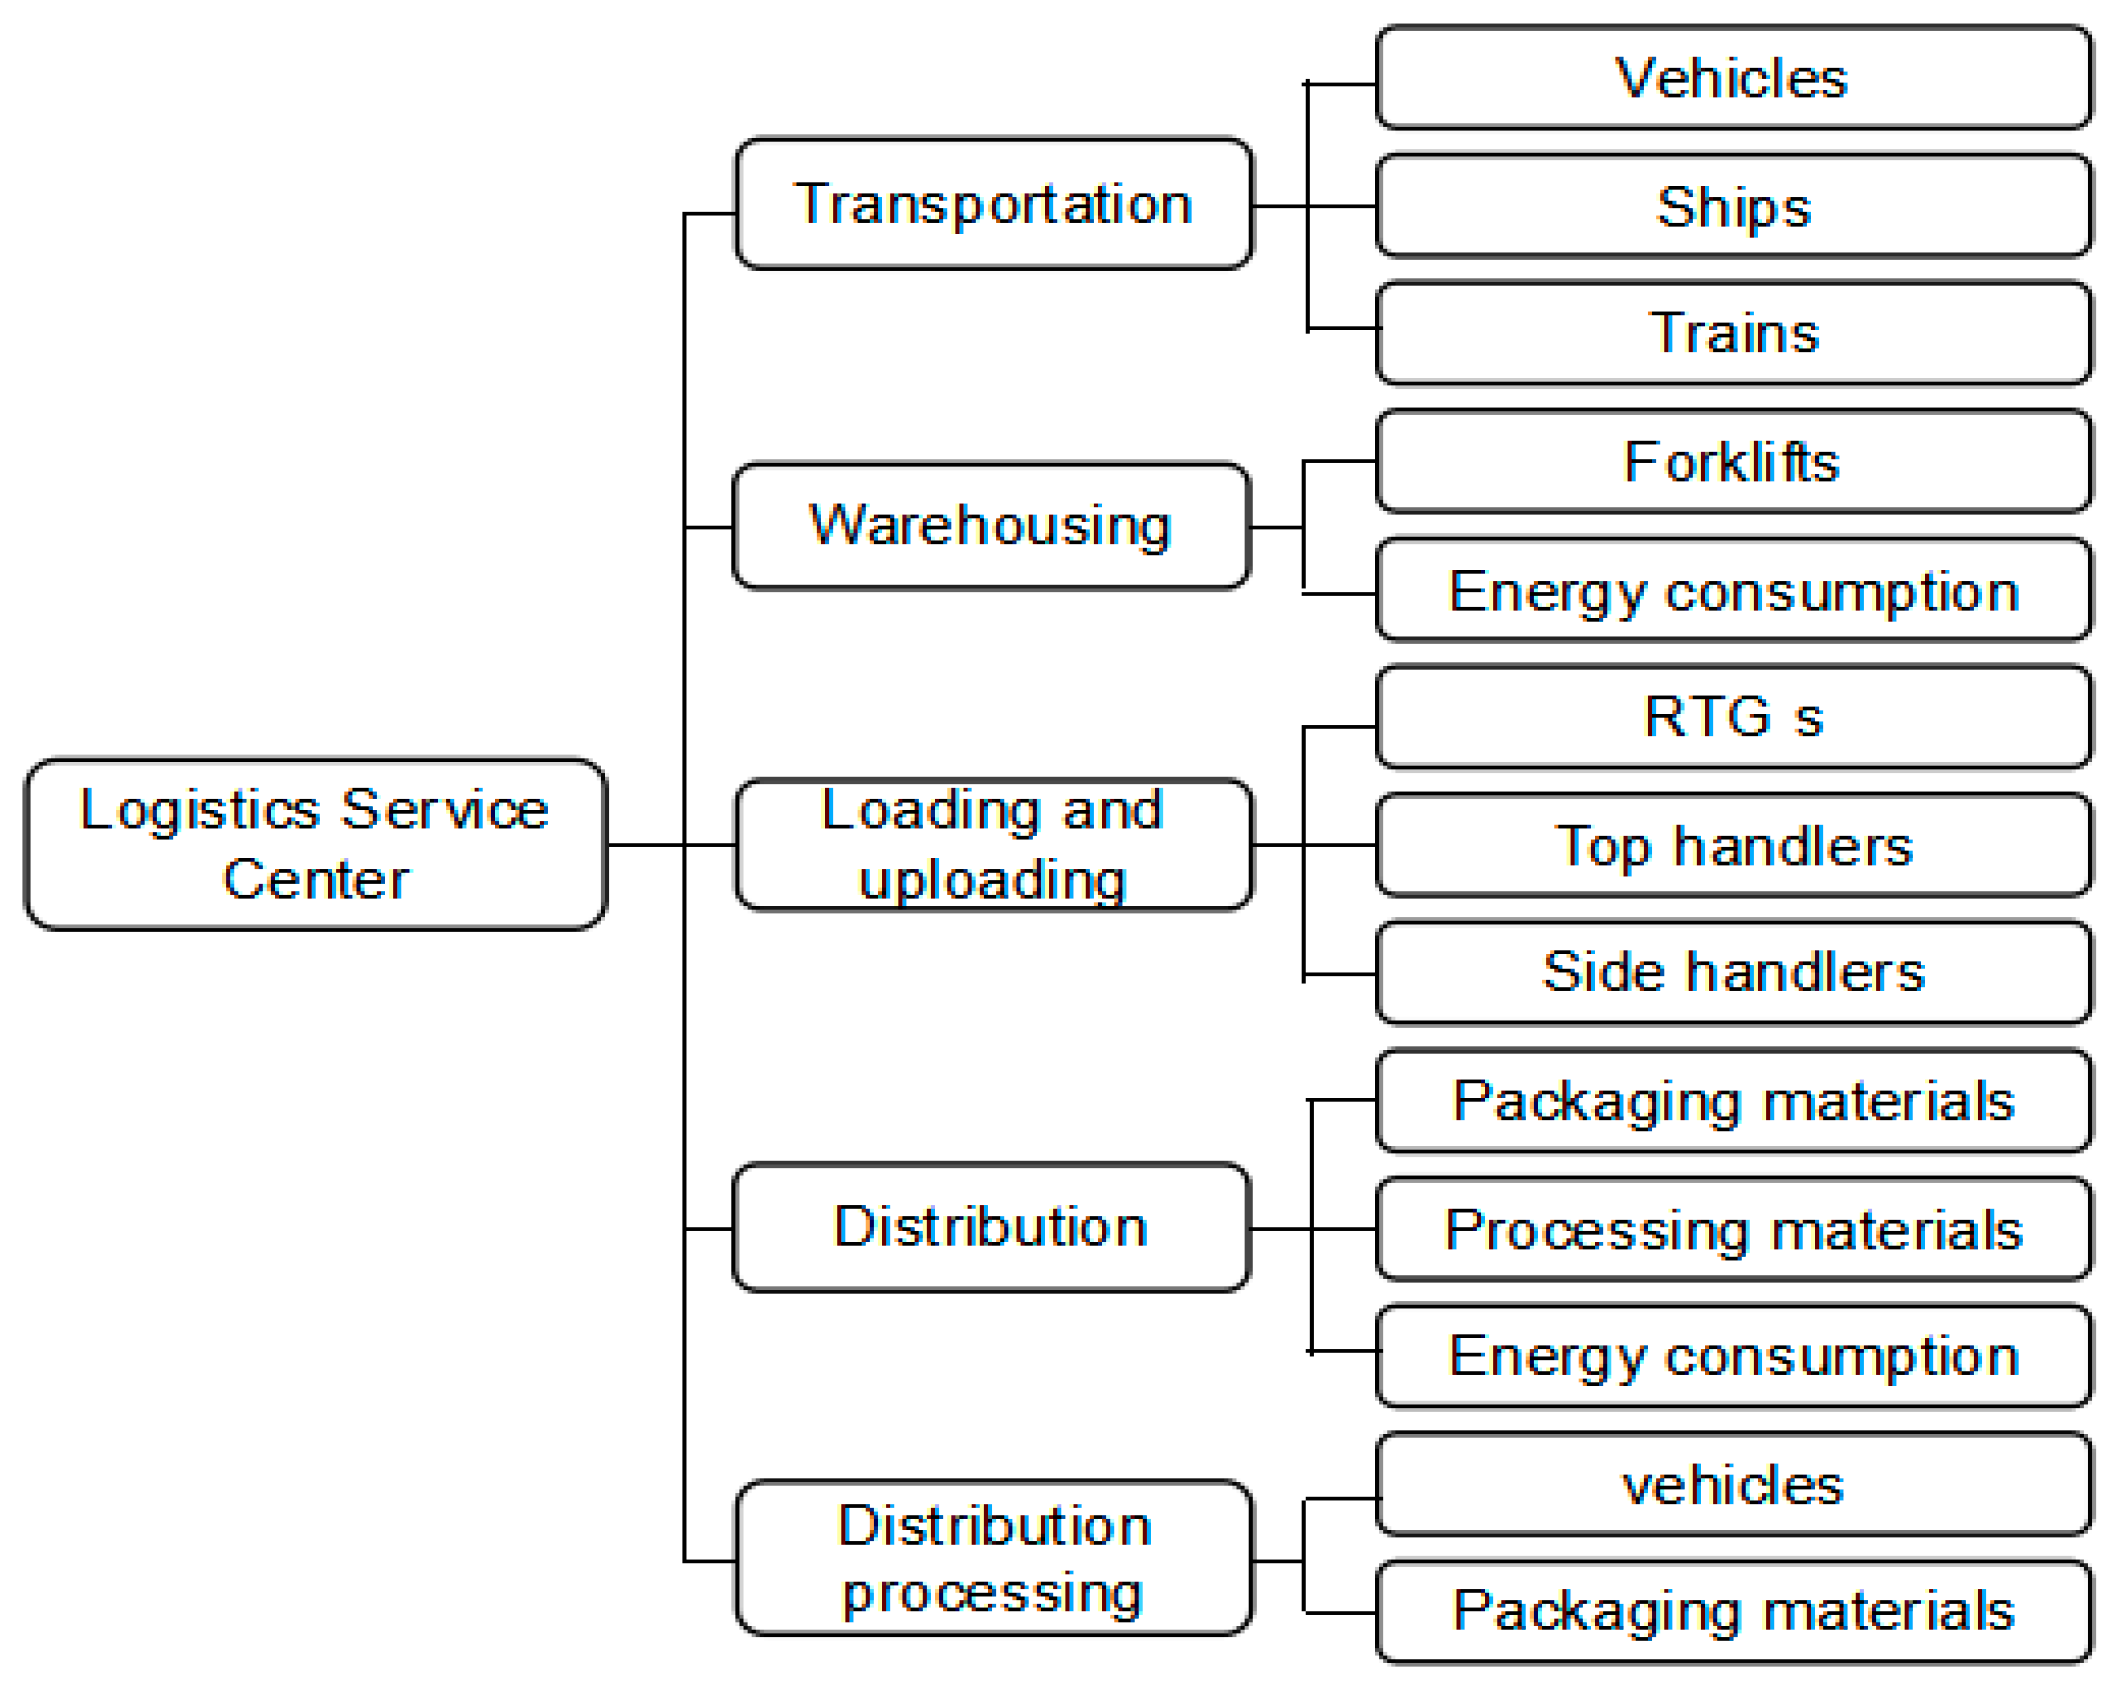
In a logistics service center, for transportation and distribution services, various types of vessels and vehicles become the main emission sources. For storage and handling services, RTGs, forklifts, side handlers, and Top handlers become the main emission sources for handling and stacking goods. Refrigerated storage consumes electric energy, which produces indirect carbon emissions. Processing and distribution services inevitably consume various materials, especially for packaging. Detailed emission sources in a logistics center can be seen in Figure 3, which is helpful in visualizing a carbon emission model in the following section.

4. Models

In this section, by using the discharge coefficient, we first establish a carbon emission model from transportation, heavy equipment, material consumption, and energy consumption. The quantity of carbon emissions is positive correlated with distance, the weight of goods, working time, and different kinds of fuels. With the method of undetermined coefficients, we directly establish a carbon emission formula [19]. Some parameters are estimated from a great amount of operation data in the port of Long Beach, and we label them with an asterisk. Others are from direct observation or calculation. Then, we collect the data from operation, fuel consumption, and the coefficient of emission sources.

4.1. The Scope of Carbon Emissions in Port-Integrated Logistics

The boundaries for integrated logistics are from two dimensions. One is from the geographical area of the port. The other is from the functions and services of the port. Every aspect of integrated logistics produces carbon emissions, mainly from three kinds of functions: a logistics service center, an information service center, and a business service center. These services consume different amounts of energy and different materials, causing the direct or indirect release of carbon emissions.
Integrated logistics services and functions are diversified. Different service processes contain different types of carbon emissions, including the following:
(1)
Carbon emissions from transportation: direct carbon emissions from trucks, ships, railway trains, and other vehicles, which consume energy to provide transportation services for customers.
(2)
Carbon emissions from heavy equipment: direct carbon emissions from the processes of port storage, loading and unloading, handling, and stacking services. The heavy equipment consumes fuel oils to provide warehousing, loading, and unloading services to customers.
(3)
Carbon emissions from material consumption: processing services and distribution, especially rework and packaging services, which produce carbon emissions during the recycling process. In addition, this paper takes documents’ consumption into consideration. Since these generally occur outside the port, they are considered indirect emissions in port-integrated logistics.
(4)
Carbon emissions from the consumption of electric power: these carbon emissions are mainly from the operation of information platforms and warehousing services, especially cold storage warehouses, which consume a large amount of electric power. Since these carbon emissions do not occur at the ports, they are also considered indirect.
As a logistics service center, ports provide transportation, storage, loading and unloading, processing, and distribution. In transportation and distribution services, various vessels and vehicles have become the main emission sources. The storage and loading and unloading services have become the main source of emissions because they consume a great amount of energy. In addition, cold storage consumes electric energy and releases carbon emissions indirectly. Processing and distribution services inevitably consume various materials, especially for packaging, and indirectly release carbon emissions. In addition, they consume a certain amount of energy in the process of machining.
To provide information services and business services, ports need to deal with logistics information, trade information, financial information, and administrative information for customers. In addition, ports also need to provide purchasing services, supply chain services, financing services, and financial services, which also consume a great amount of electronic and paper materials. To achieve the function of an information service and a business service, ports and related enterprises must generate electricity and consume materials, and thus cause indirect carbon emissions.

4.2. The Classification Models of Carbon Emissions in Port-Integrated Logistics

Transportation. Carbon emissions from transportation include those from various operating conditions of vehicles, trucks, ships, and trains. Emissions of trucks mainly come from two aspects: one is from the road state, and the other is from the waiting state. While running on the road, the emissions of vehicles ( E v ) can be estimated by travel distance, and ( D v ) stands for distance. ( R v * ) is the rate of carbon emissions. While in the waiting state, the emissions of vehicles ( E I ) can be estimated by waiting time, and ( T I ) is the waiting time, ( R I * ) is the emission rate for the waiting state. Taking Peng [26] as a reference, we estimate carbon emissions in transportation.
E V = D V × R V *
E I = T I × R I * .
The carbon emissions of ships ( E A , E T ) are due to engines and boilers. To estimate these carbon emissions in an integrated logistics system, this section focuses on the berth status and anchorage state of ships. The emissions of both auxiliary engines and boilers can be estimated by the power ( P A , P T ) and operation time ( T S ) , while ( R A * ) and ( R T * ) represent the emissions rates for auxiliary engines and boilers.
E A = P A × R A * × T S
E T = P T × R T * × T S
The carbon emissions of trains ( E S ) are determined by the type of model and fuel oil. To estimate these carbon emissions in an integrated logistics system, this section focuses on the running status. The emissions of trains can be estimated by the convert coefficient to standard coal ( R S ) , the emission coefficient of standard coal ( F S ) , and the total quantities of fuel consumption ( T Q ) .
E S = R S × F S × T Q .
Heavy equipment. The largest emissions in a port come from the heavy equipment, including equipment used for loading and unloading, handling, stacking, and warehousing. This equipment includes rubber-tired gantries (RTGs), forklifts, side handlers, top handlers, and any other high-power instruments [27]. Due to equipment operating in complex ways, it is very hard to calculate their emissions in different states. Instead, we take the operation time ( T E ) as one factor to simplify the calculation. Emissions from heavy equipment are also determined by their respective rated power ( P E ) . Coal used to generate electric power corresponds to an emission rate, so ( R E ) is the emission rate of coal corresponding to the generation method. ( α ) is the proportion of appointed generation that accounts for all power generation.
E E = α × T E × P E × R E .
Material consumption. Material consumption includes packaging and processing materials. Packaging materials come from distribution services, including different raw materials such as plastic and paper. Processing materials are consumed by distribution services and rework services, are hard to recycle, and are abandoned at incinerators and landfills.
The carbon emissions of material consumption E M ( i ) are caused by the material’s waste processes E M W ( i ) and recycling processes E M P ( i ) , and thus are indirect carbon emissions since they are not produced in ports.
Δ E T = E T × q 3 × ( 1 Δ R T / R T ) .
The carbon emissions of the waste process E M W ( i ) come from landfills, incineration, and decomposition, and are determined by the use of materials in different services U M ( i , j ) , the emission rates of different waste materials R M W * ( j ) , and their waste rate α j .
E M W ( i ) = j U M ( i , j ) × R M W * ( j ) × a j .
The carbon emissions of the recycling process are determined by materials in different services, the emission rate of materials in the recycling process R M P ( j ) , and their waste rates.
E M P = j U M ( i , j ) × [ 1 a j ] × R M P ( j ) .
Here, E M C ( i ) stands for the emissions of the waste process, which is not actually produced because of the recycling process. When materials are recycled, the circulating part of the material has not been abandoned; their emissions should be estimated in the next cycle. Here, b j stands for the recycling rate of different materials.
E M C ( i ) = j U M ( i , j ) × b j × R M W ( j ) .
In general, the actual consumption of the material is difficult to count. As an alternative, the material consumption can be estimated by the input–output table and the consumption in a specific industry. Based on the packaging industry and the regional input–output table, this study uses an alternative method of calculating the consumption of packaging materials. The emission rates of the materials reference IPCC publications [31].
Energy consumption of electric power. In the integrated logistics system, in addition to maintaining heavy equipment operation, energy is also consumed by maintaining various services, such as special warehousing and lighting for warehouses and yards. Though electricity is one kind of clean energy, it also produces carbon emissions in the electrical production process. Since electricity is generated in different ways, such as via coal, nuclear, or wind power, we take the proportion of electricity generation into consideration to calculate indirect carbon emissions. Therefore, the emissions of electric power energy consumption ( E E ) can be calculated based on its consumption of a different electricity generation process, ( U E j ) , and the emission rate of all processes, ( R E j * ) [26].
E E = j U E j × R E j * .
Energy consumption in the electricity generation process is determined by the power supply of a given area, including its total energy consumption, U E , and the proportion of the exact process in its total energy consumption, C j .
U E j = U E × c j .
The emission rate of the exact process can be calculated according to its fuel consumption of per kilowatt hour U F j , the emission rate of standard coal R F * , and the coefficient that fuel converts to standard coal d j .
R E j = U F j × R F * × d j .
According to the IPCC [31] the emission rate of processes in this area is 0.6379 tons per kilowatt hour.

5. Case Study—Port of Shenzhen

The Port of Shenzhen, located in Guangdong Province, is composed of two parts. One is the “East Block”, located in the east of the Pearl River Estuary. The other port is the “West Block”, located in the west of Dayawan in the South China Sea. The economic hinterland covers the whole Pearl River Delta economic circle, which is the most active economic area, with a prominent light industry. The main business of the Port of Shenzhen is cargo containers transportation. At the same time, it concurrently engages in bulk cargo of fertilizer, food, building materials, and petroleum, among others.

5.1. The Status of the Port-Integrated Logistics

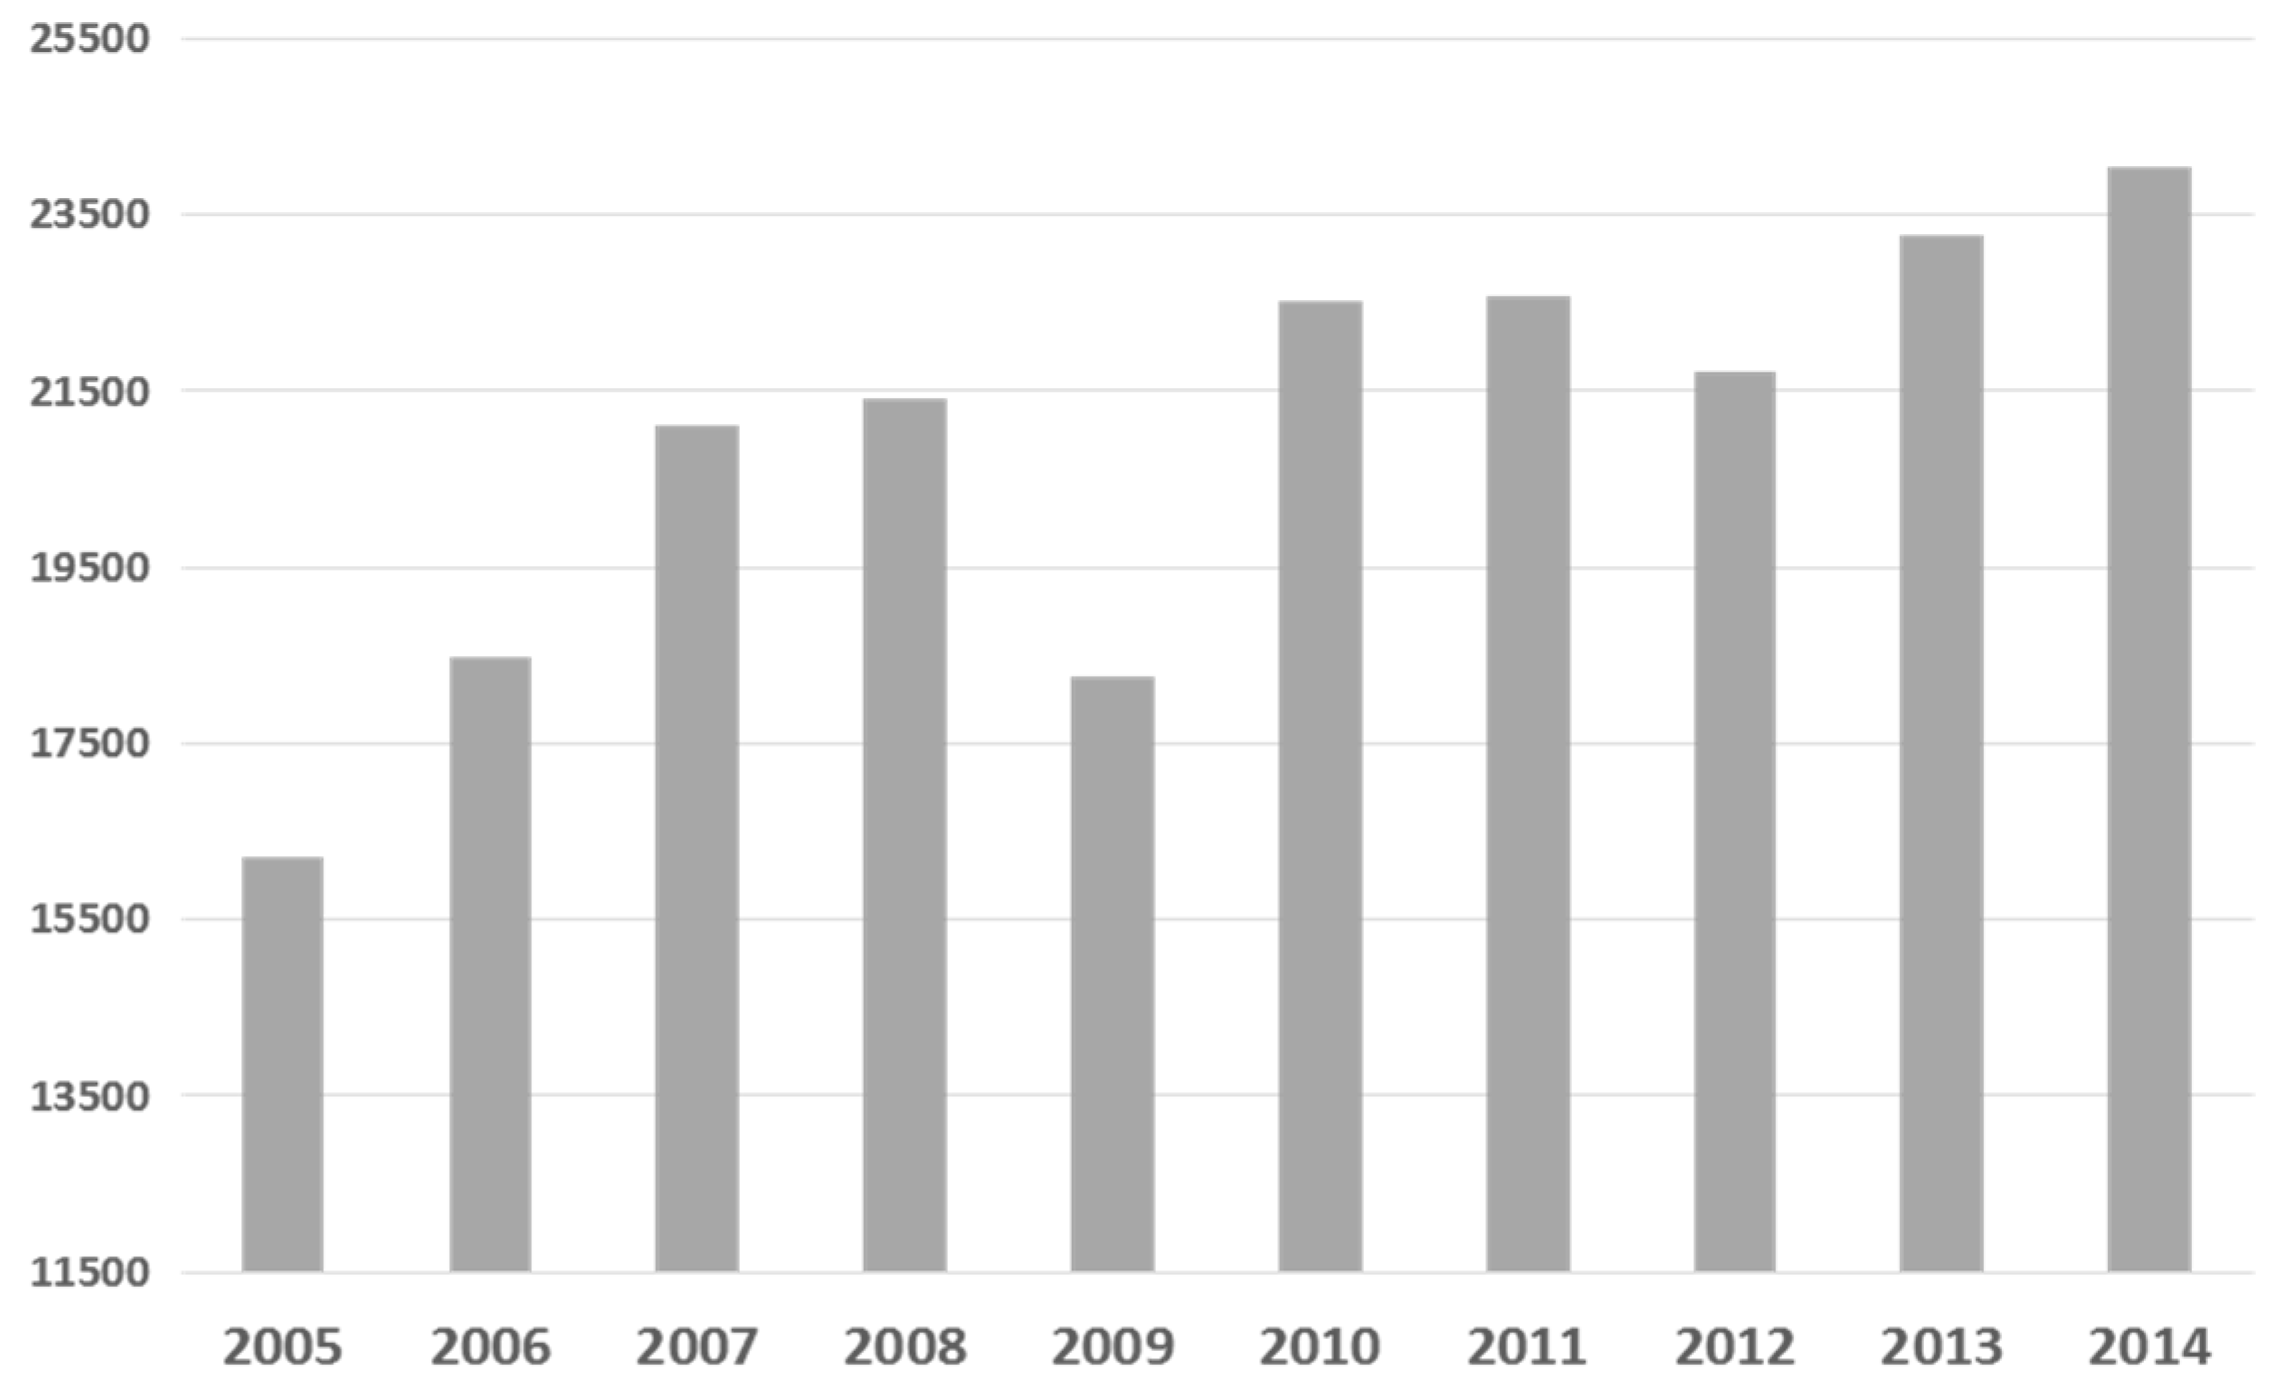
The Port of Shenzhen has become the third largest container port in the world since 2013. The throughput of the Port of Shenzhen in the last 10 years (in twenty-foot equivalent unit (TEU)) is shown in Figure 4. To deal with the huge throughput, the Port of Shenzhen has the most advanced facilities and equipment in the area. It provides a free trade zone with logistics services.
The Port of Shenzhen, with geographical advantages and bonded zone policies, provides procurement logistics services, international commodity display services, and commodity trading services. There are more than 300 supply chain management companies in Shenzhen. Providing supply chain services for many famous enterprises, the port services cover IT, FMCG, home appliance, medical, chemical, clothing, and other industries. Enterprises engaged in insurance, law, and other related services have been stationed at that port, which injects a new impetus for development.
The information system construction is domestically at the leading level. It has built a great number of information platforms. However, these platforms are only related to port enterprises or government oversight agencies, failing to cover entire port areas and their related service providers. Information systems of enterprises are basically not connected to each other. The most direct performance is the low efficiency of customs clearance. The general process of export trading in the Port of Shenzhen only needs one day, while the import process generally requires 1–3 days. Yet, both processes in the neighboring Hong Kong port take no more than a day.

5.2. Characteristics of Carbon Emissions

The characteristics of carbon emissions originate mainly from four different aspects: transportation, heavy equipment, materials, and energy consumption. The detailed characteristics and factors of carbon emissions are shown in Table 1.
In terms of road transportation, railway is only laid on the terminal of the bulk cargo such as the Ma Wan coal terminal. Carbon emissions decrease because of the improved efficiency in loading and unloading. Generally, carbon emissions decrease with the use of liquefied natural gas (LNG) and oil and gas.
In terms of heavy equipment, many significant accomplishments have been achieved in energy saving and emission reduction, especially the use of clean alternative energy sources. For example, the Port of Shenzhen started a plan to develop electric RTG cranes back in 2006. Since 2015, with the exception of emergency equipment, only electric RTG cranes have been approved for use.
Material consumption mainly comes from warehousing, distribution processing, rework, and distribution services. The material consumption of distribution processing and distribution includes ancillary operations, such as packaging, labeling, and repackaging. Compared to Southeast Asia, due to lower labor costs large population in China, distribution processing and rework services have gained the market favor. But hey have increased carbon emissions by consuming more materials.
Energy consumption comes from all kinds of office equipment, especially cold chain storage. Refrigerated warehouses are mainly built in the western port to store fresh goods. The eastern port has developed cold chain logistics due to the strong demand for middle-end and high-end consumer goods.

5.3. Carbon Emissions Sources in the Port of Shenzhen

This study estimates four main terminals of the Port of Shenzhen to be Yantian Port, Shekou Container Terminal, Chiwan Container Terminal, and Dachan Bay Terminal. We use the port of Long Beach (POLB) as a reference to establish carbon emission models. The throughputs of Long Beach Port are some of the largest in the world. The “Green Flag Project” is a large-scale funded project, aimed to reduce carbon emissions by slowing down the speed of ships near the harbor. It encourages the ships’ operators to use the waves at the shore (which we will henceforth refer to as “shore power”) instead of their diesel fuel engines [32]. The implementation of this project decreased thousands of tons of emissions in 2015. We applied the same emission sources and calculation methods from our study of port of Long Beach to the Port of Shenzhen. The data of the operation and emission sources for estimation were collected from an investigation group of authors, ENTEC [33], and the port of Long Beach [34]. The calculated results are based on the survey statistical data. So the results may vary when the methods are put into other ports. Moreover, this is just an example of a comparison of the carbon emissions of different services in port-integrated logistics, not a numerical example to reflect the reality of Shenzhen carbon emissions.
While collecting the data, we first standardized the data to weed out measurement errors. Then, we used multiple measurements to reduce human error. To deal with the outliers, we handled and eliminated them by a statistical criterion method. Statistical criteria give a confidence probability of 95% and determine a confidence limit. We considered any data beyond the limit errors not as random errors, but as outliers.
Based on the statistics information of different carbon sources in Appendix A (Table A1, Table A2, Table A3, Table A4, Table A5, Table A6, Table A7, Table A8, Table A9, Table A10, Table A11, Table A12 and Table A13) and their own carbon emission intensities, by applying the above Equations (1)–(13), some statistical data can be calculated. Various carbon emissions in the Port of Shenzhen are shown in Table 2.
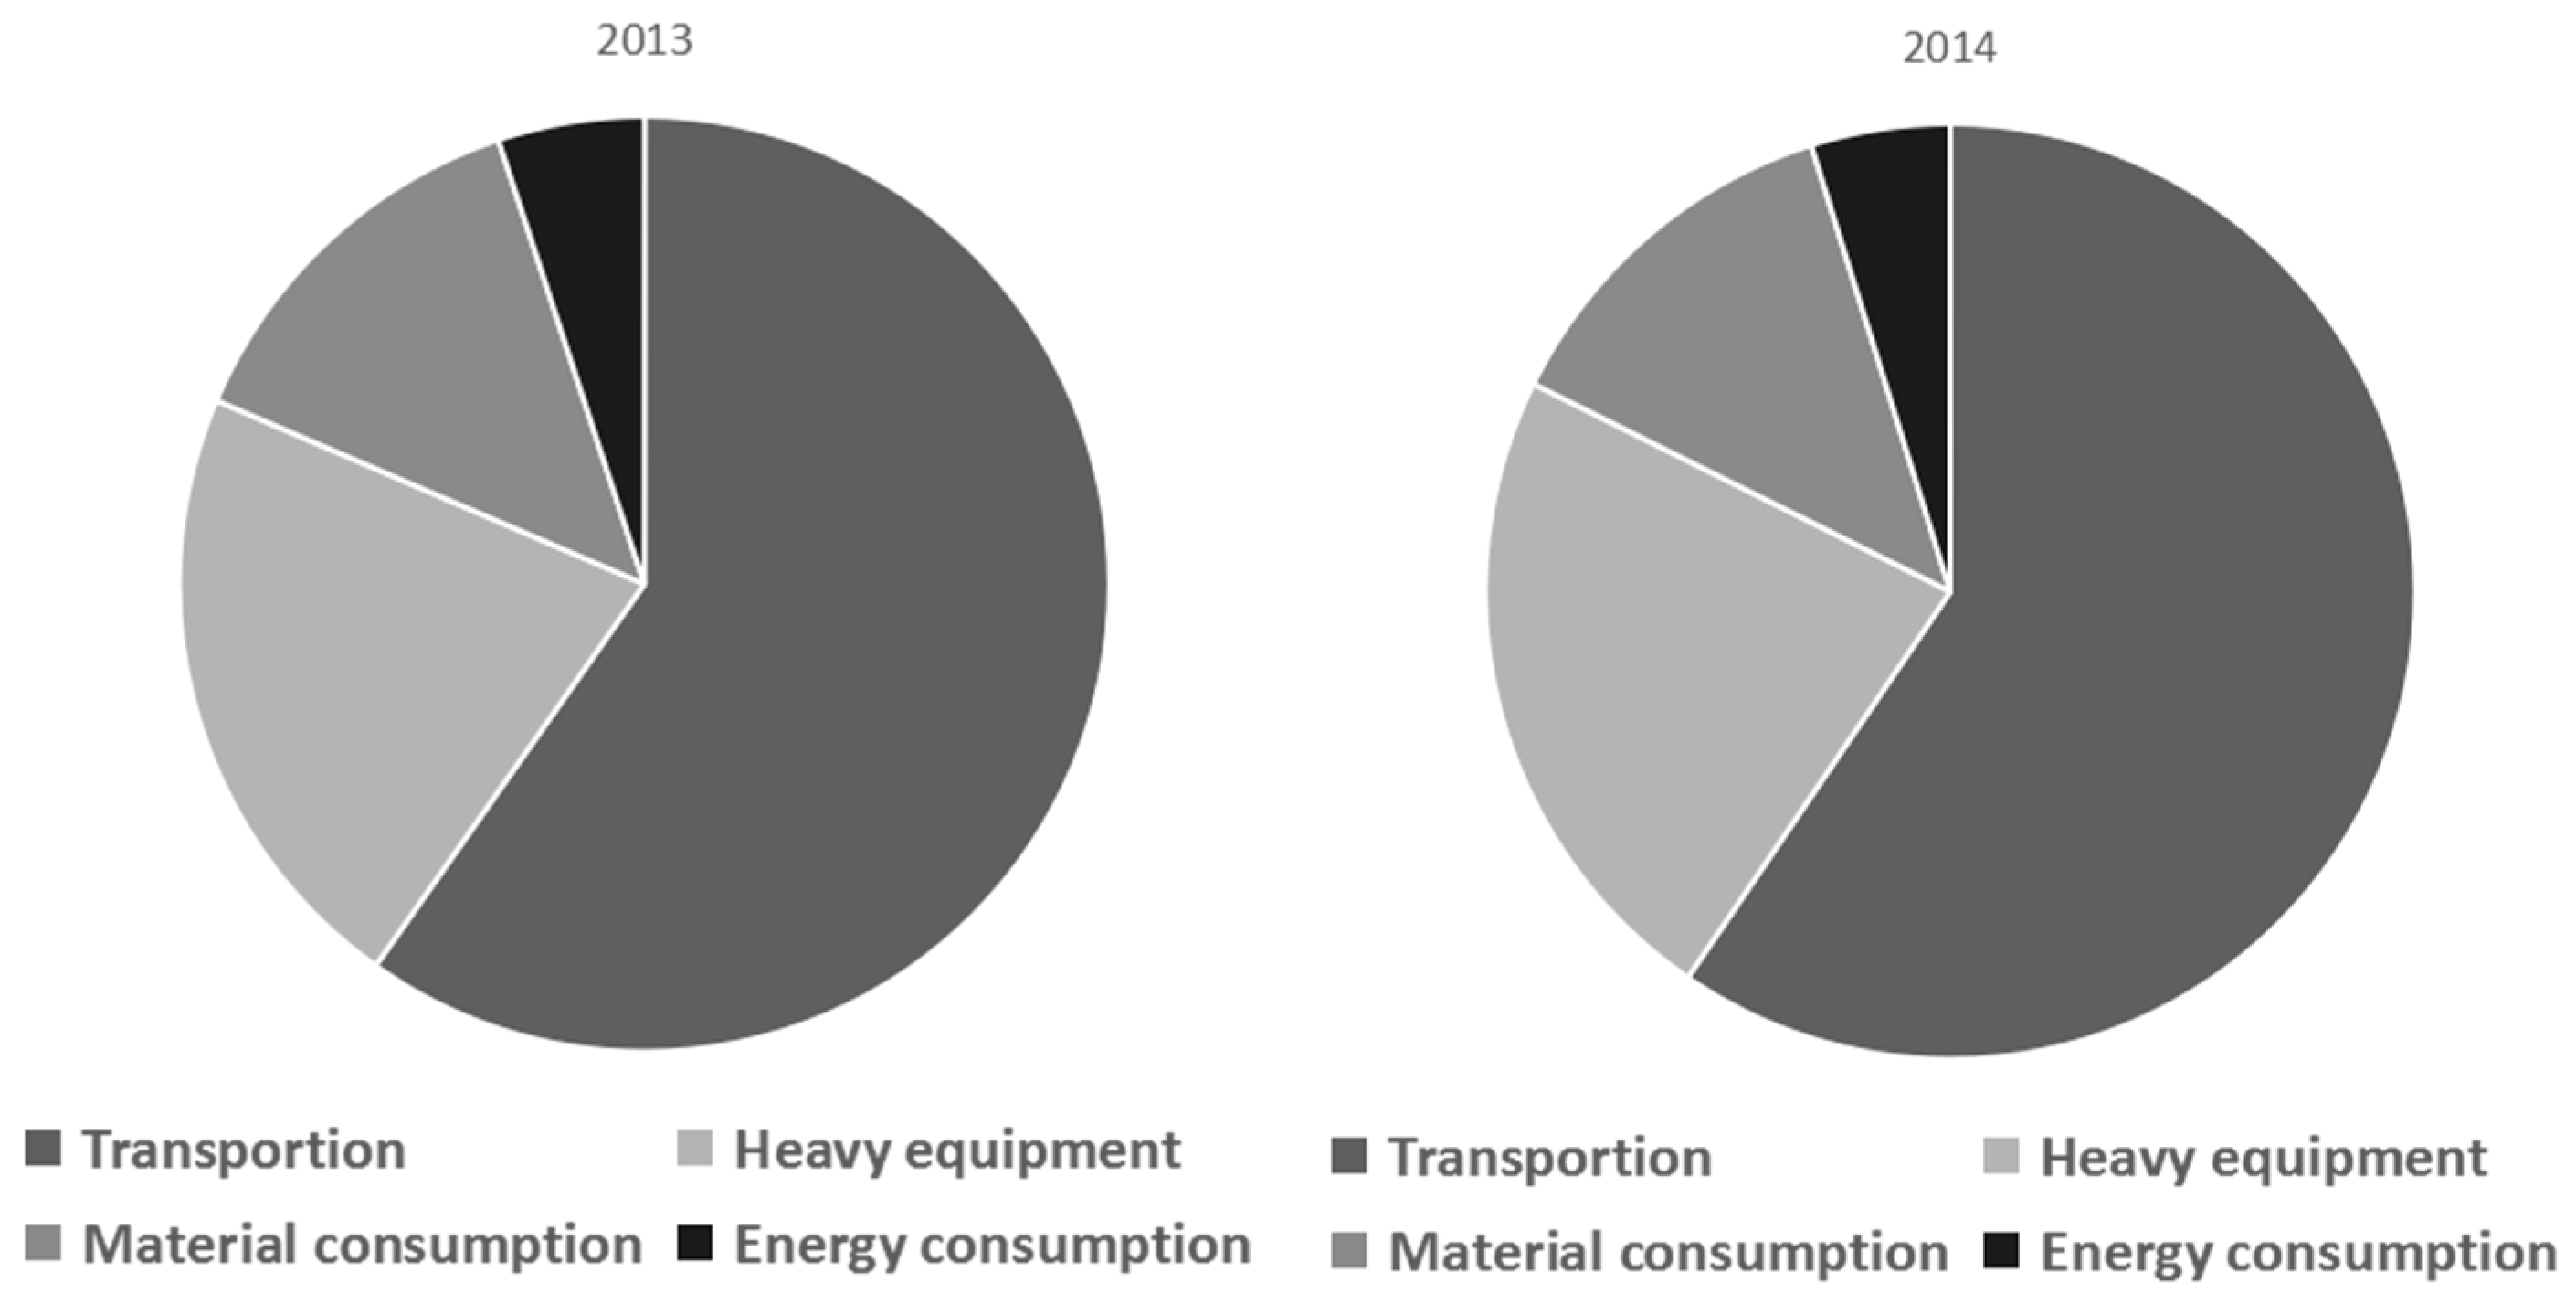
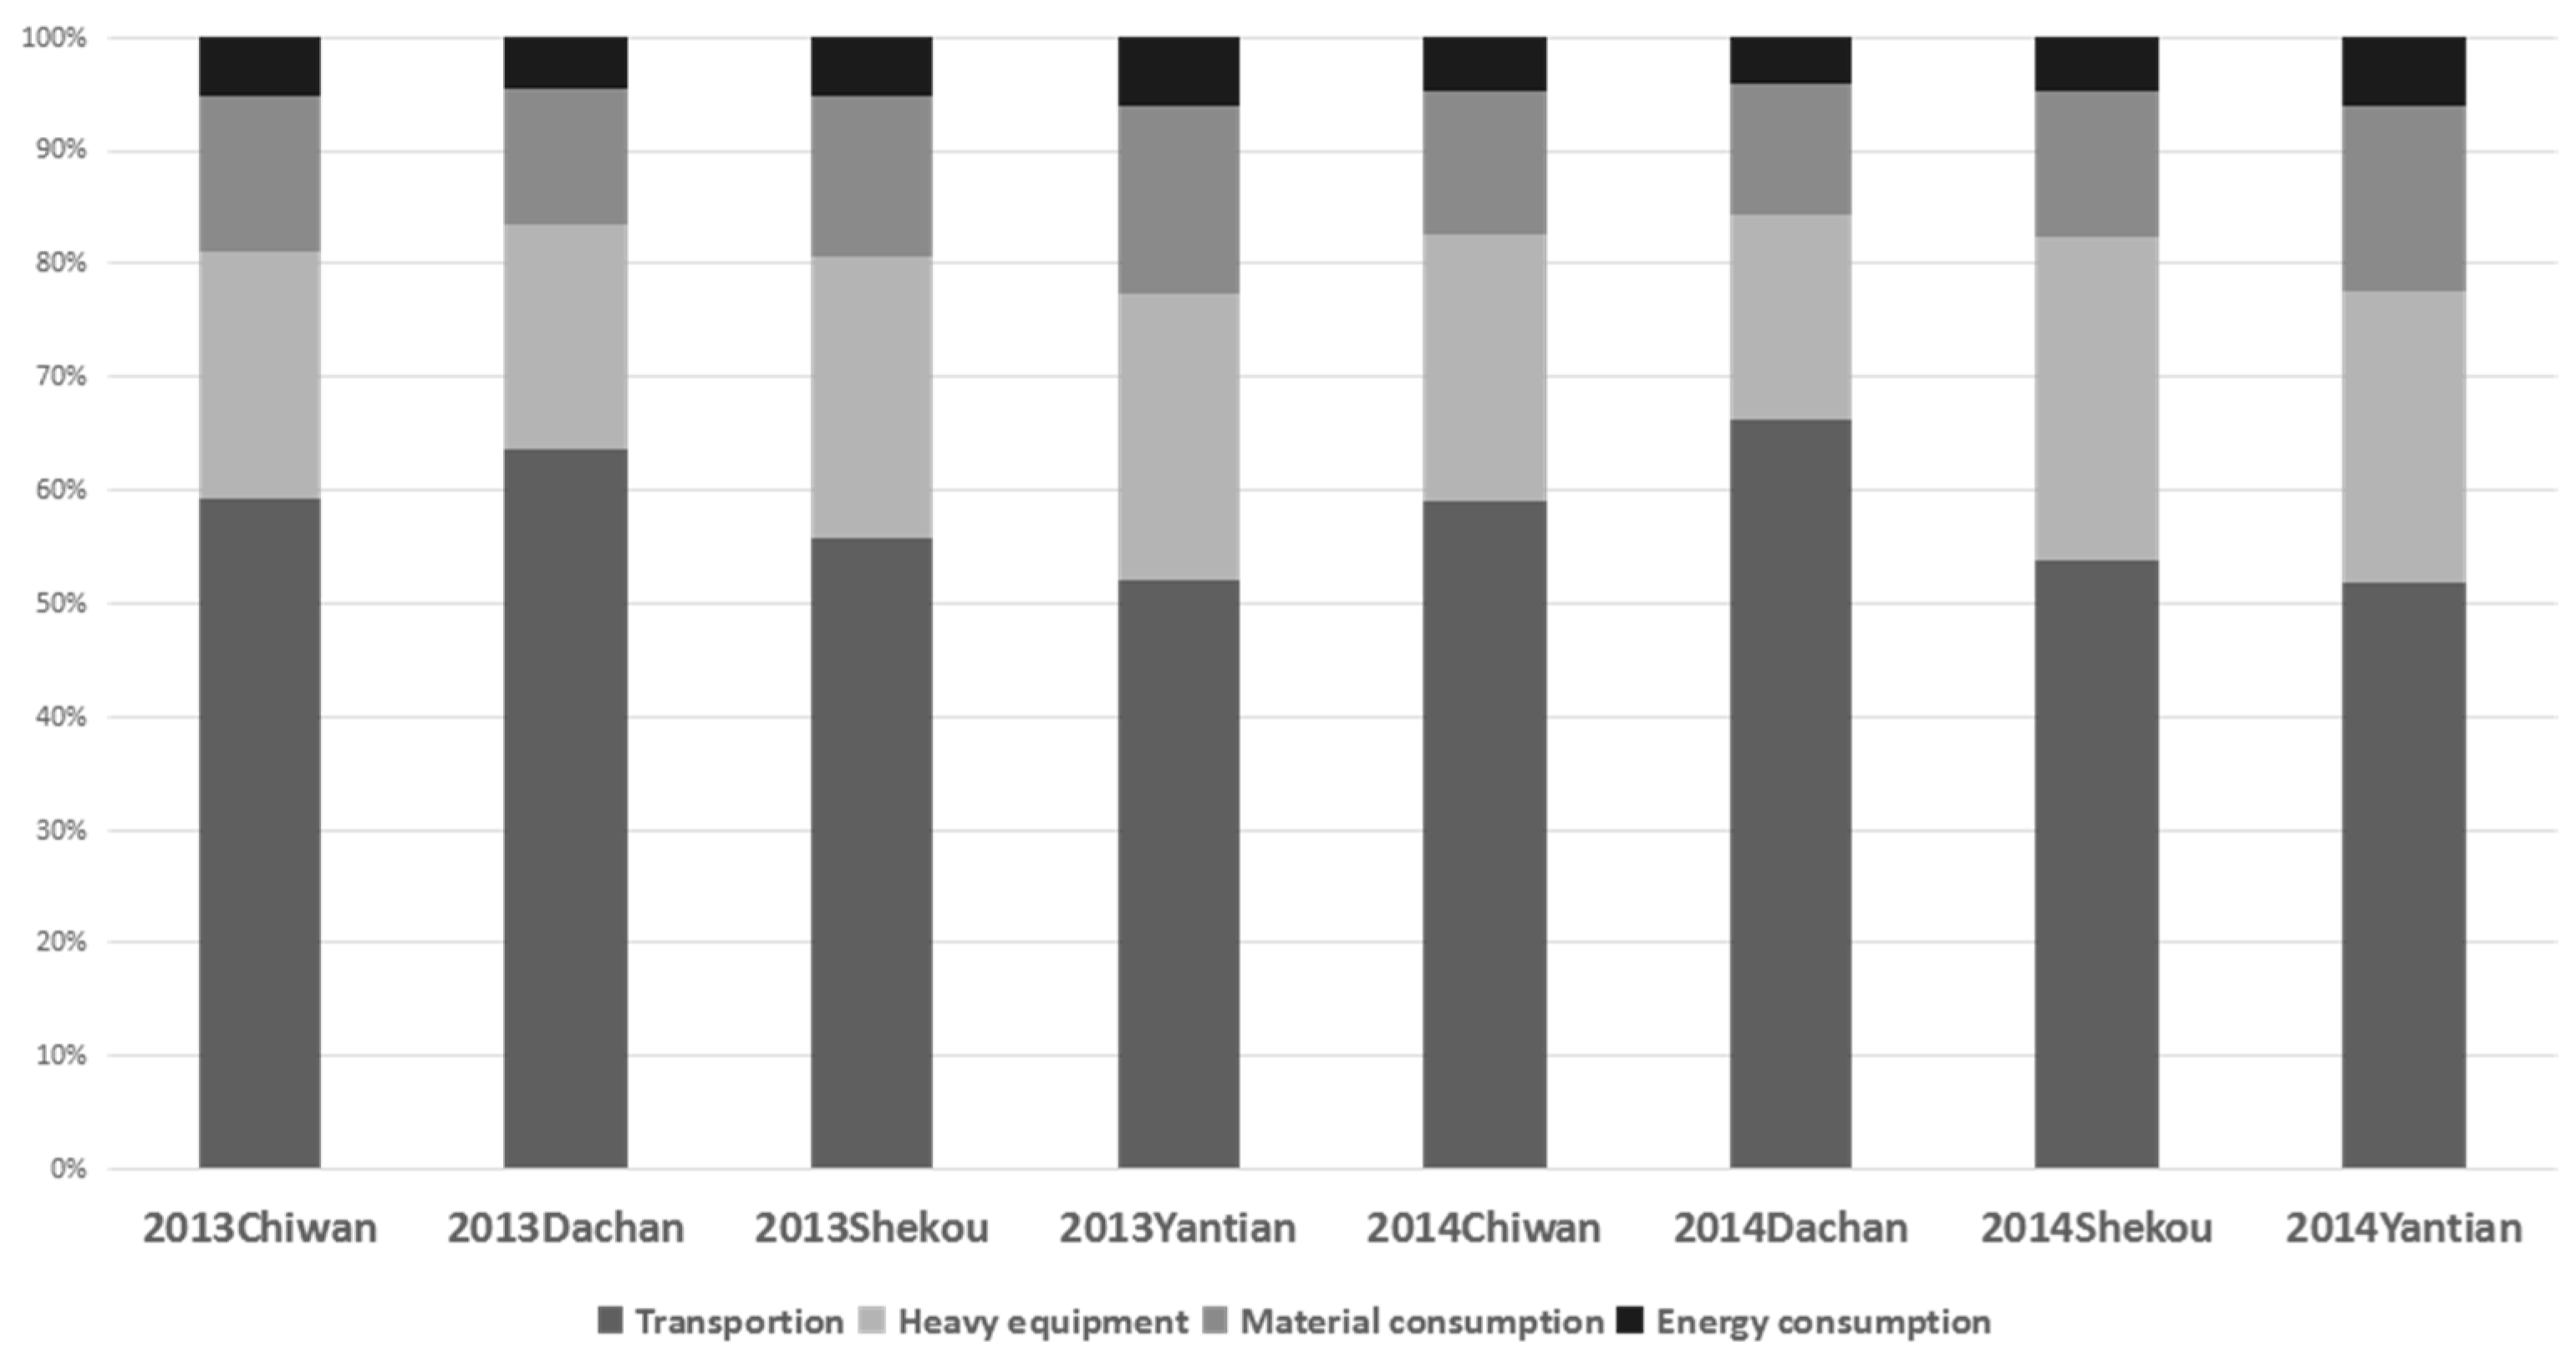
Carbon emissions from the Port of Shenzhen in 2013 comprised about 580,128.02 tons, among which the most significant part comes from transportation, accounting for 59.80%. Emissions from the ship at berth are the highest of that transportation, reaching 38% of emissions from transportation, which most urgently needs to be reduced. The second is followed by heavy equipment for loading and unloading, handling, and stacking operations, contributing to 21.61% of total emissions, which is more than 120,000 tons. Due to a lack of data, this study only estimates carbon emissions from packaging materials, which is 78,342.42 tons. Carbon emissions almost remained the same in 2014, with a slight reduction in emissions from material and energy consumption. The comparison and detail data of emission sources in the Port of Shenzhen are shown in Figure 5.
Contributions from the same emission sources show few differences between each terminal, because of the different characteristics in services and equipment. A comparison of emission sources in the Port of Shenzhen is shown in Figure 6. For example, Dachan Bay Terminal is newly built with advanced equipment, which is more outstanding in environmental protection. By using electric RTGs, there are obviously fewer emissions from heavy equipment compared to other terminals.
In terms of services, emissions from logistics services account for the largest proportion, which can reach up to 95%. Thus, reducing emissions from logistics services will be maximally efficient. Based on the above analysis, the emissions from the ships at dock need to be reduced the most.

6. Suggestions

Based on the carbon emission analysis, suggestions are proposed from the perspectives of loading and uploading efficiency, the substitution of shore power, and LSFO. Moreover, the emissions from ships at dock need to be reduced the most.

6.1. Improving the Efficiency of Loading and Unloading

According to Equations (3) and (4), emissions from the ships at berth are proportional to their docking time. The Port of Shenzhen can save time by improving the efficiency of loading and unloading. Carbon emissions from the Port of Shenzhen in 2013, after efficiency was improved, are shown in Figure 7.
First, port layout needs to be optimized and working efficiency should be improved. Taking high efficient operation into consideration, the Port of Shenzhen should set up a reasonable number of berthed ports in the future. On one hand, it would decrease the amount of berthed ships from excessive idle resources. On the other hand, it would reduce the waiting time of cargo ships. Based on the actual ship type distribution, wharf properties, water, and topography, we should reasonably allocate the port’s berth length, width, and depth in order to meet the actual needs of port operation. At the same time, the Port of Shenzhen needs to build a multi-purpose wharf.
Secondly, the loading and unloading process needs to be optimized to improve the overall efficiency. On the one hand, the port should use existing manpower, machinery and equipment, facilities, and other resources effectively. In addition, it should compress the process interruption time, shorten the transportation distance, and improve the process of security. On the other hand, the port should modernize port machinery to substantially increase mechanical efficiency. At the same time, by improving equipment and installing dust removal and spray systems, a greening of processing equipment can occur, leading to environmental protection. The emission reduction of auxiliary engines Δ E A and boilers Δ E T in ships are determined by their emission rates. The reduction in docking time, Δ T S , is determined by the improvement of loading and unloading efficiency q 1 .
Δ E A = P A × R A × Δ T S
Δ E T = P T × R T × Δ T S
Δ T S = ( 1 q 1 ) T S .

6.2. Using Shore Power

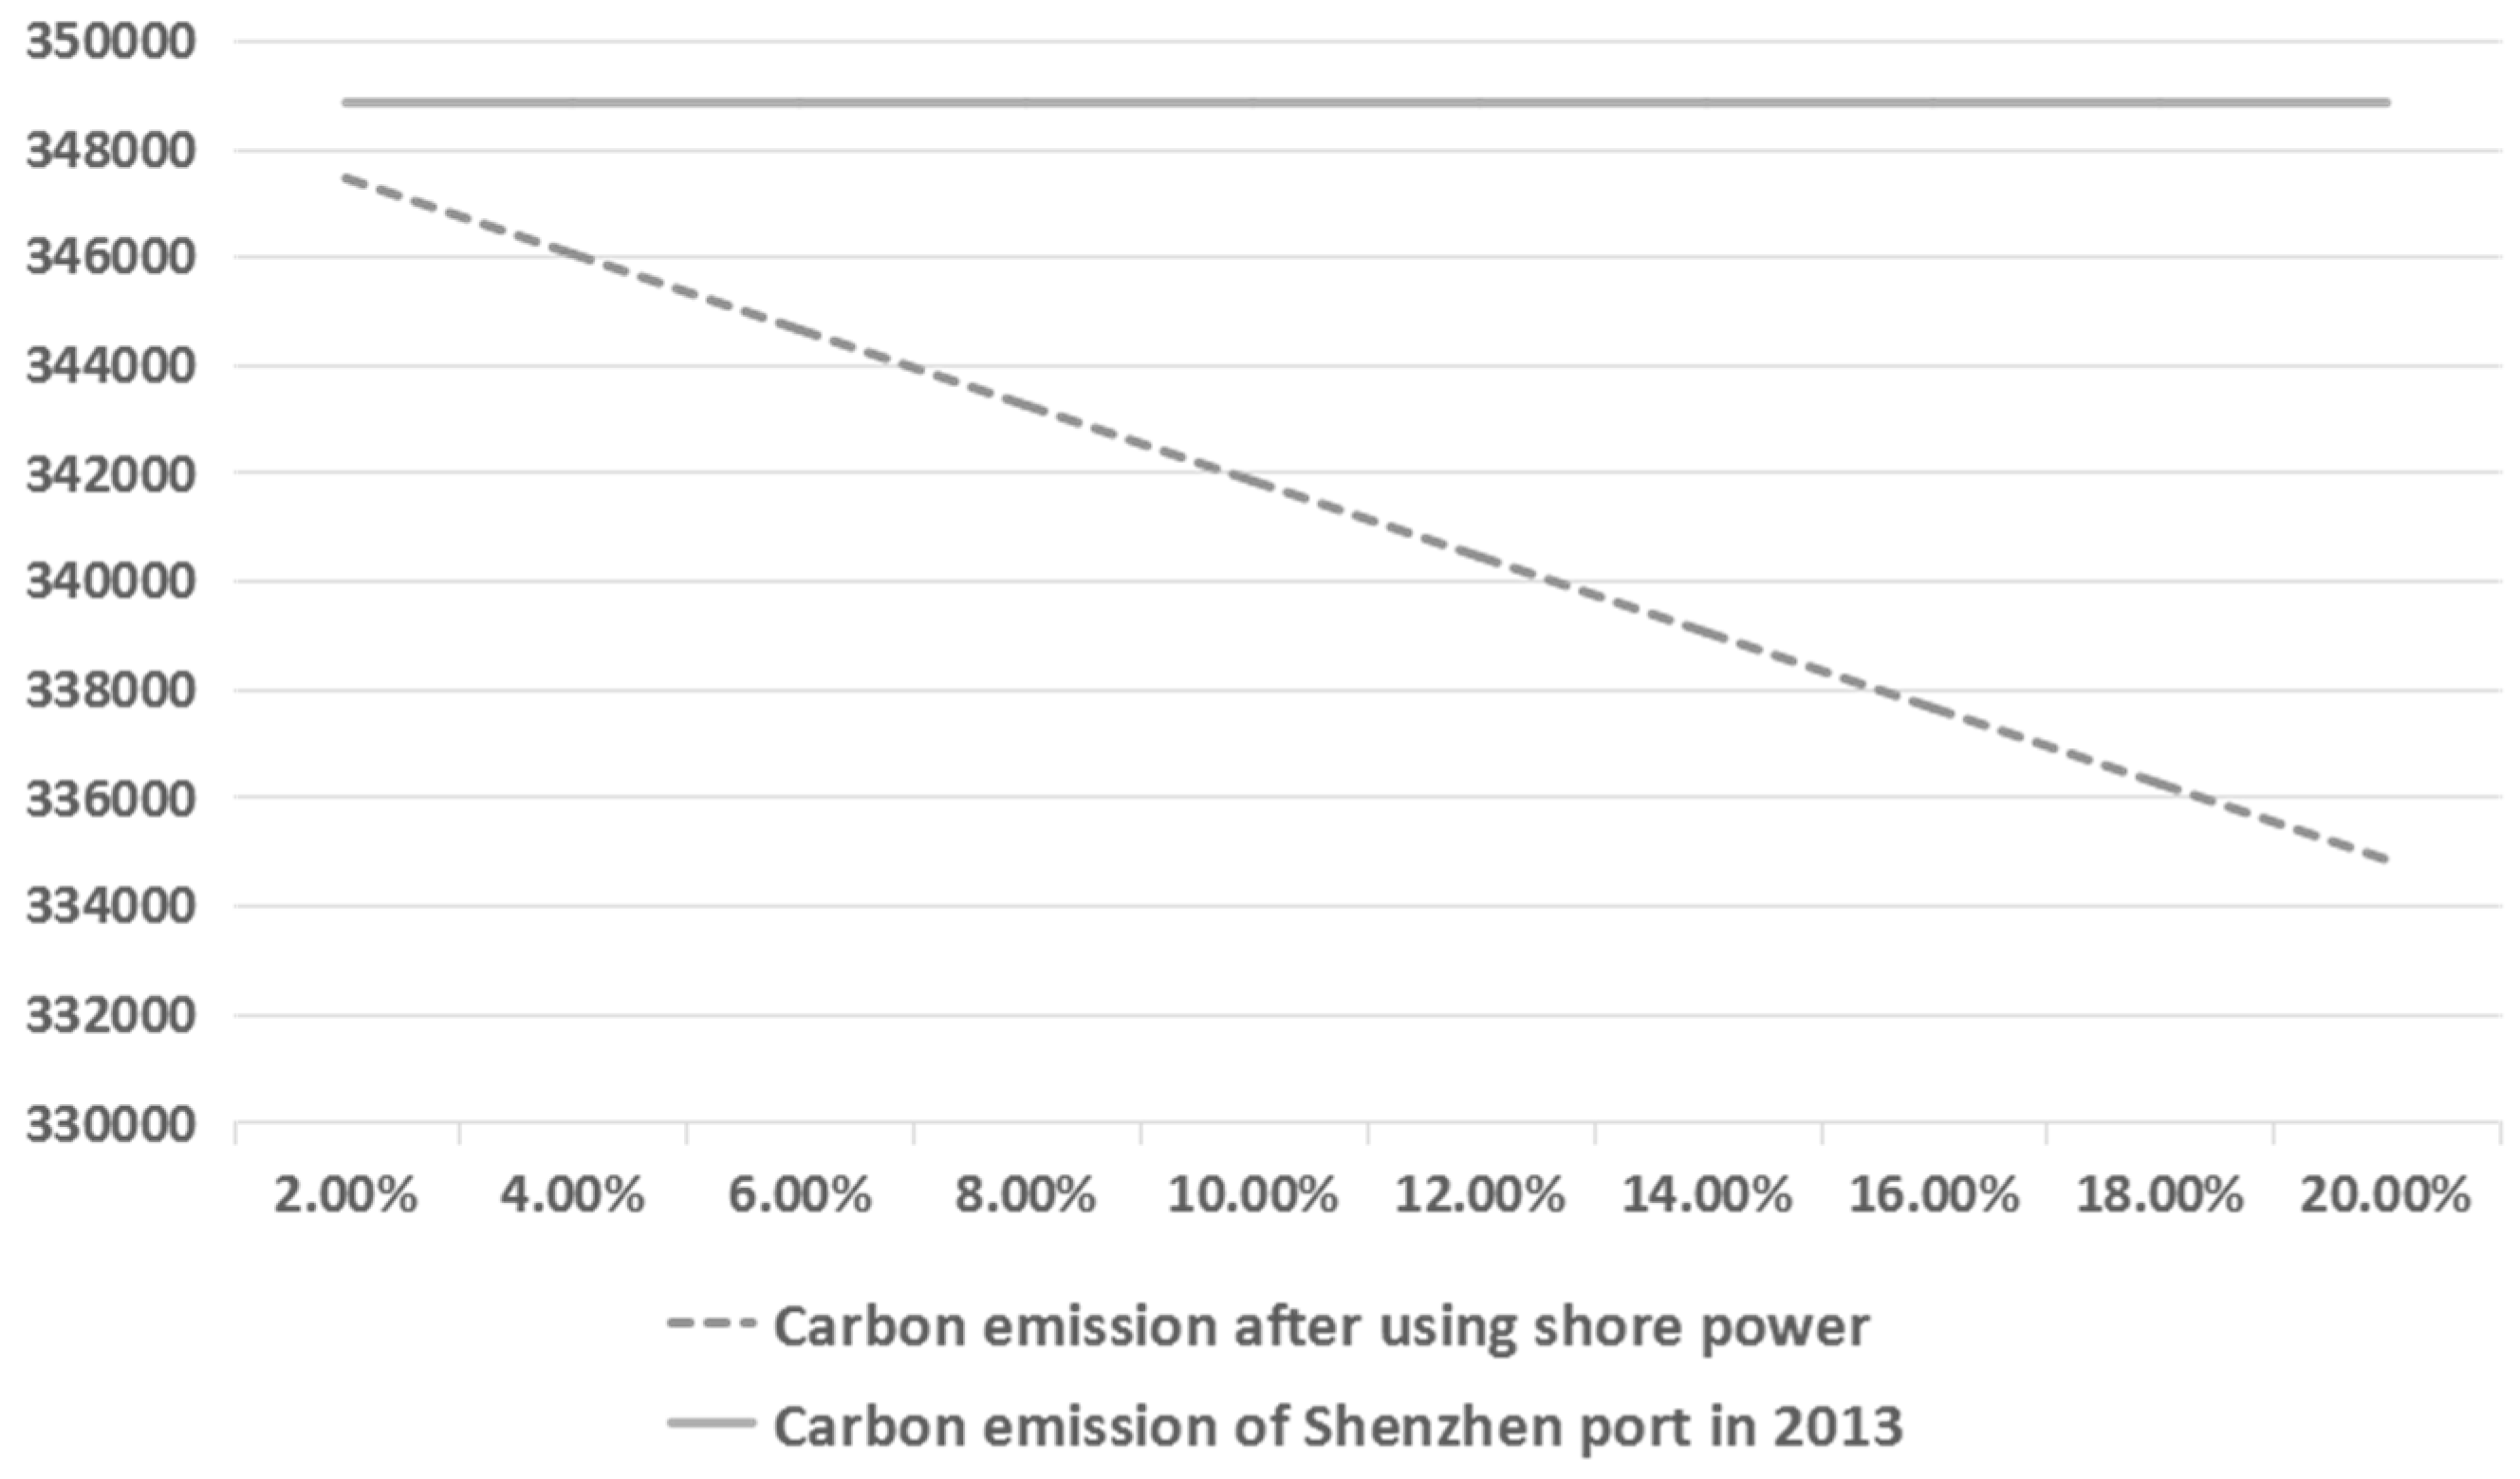
Ships begin to use electricity after berthing, provided by terminal instead of operating any engines or boilers. According to an estimation of Shekou Container Terminal, a medium-sized ship can save 7 tons of fuel every day by using shore power, which equals to a reduction of 0.11 tons of carbon emissions per day. Carbon emissions from the Port of Shenzhen in 2013 after using shore power in different proportions are shown in Figure 8.
Ships by themselves basically produce no carbon emissions while using shore power, but it takes time to connect with shore power systems at berth, during which time they may produce carbon emissions. According to the detection results of the Shekou Container Terminal, the connection of a high-voltage ship to the shore power system takes 40 min, while the low-voltage one takes 80 min when disconnected.
Therefore, the reduction in carbon emissions can be calculated based on the following equations. Δ E A and Δ E T stand for emissions reduction from engines and boilers, respectively. q 2 represents the proportion of ships of shore power, and q stands for the proportion of ships, operating in low voltage.
Equation (17) indicates the reduction of auxiliary engines, and we should aim to save the quantity of E A × q 2 . However, connection to ships with shore power takes 40 min for high-voltage ships and 80 min for low-voltage ships. Voltage determines the extent to which ships release carbon emissions during connection. Therefore, the quantity of carbon emissions is [ 80 × q + 40 × ( 1 q ) ] / T s × E A × q 2 . The same calculation can be applied to Equation (18). Equations (17) and (18) are the reduction for auxiliary engines and boilers.
Δ E A = E A × q 2 [ 80 × q + 40 × ( 1 q ) ] / T s × E A × q 2
Δ E T = E T × q 2 [ 80 × q + 40 × ( 1 q ) ] / T s × E T × q 2 .
The Port of Shenzhen uses a four-stroke diesel engine and a single generator with a rated power ranging from 197 KW to 2780 KW. When ships are on berth, the actual power is about 1000–1490 KW. For the 4250 TEU ships, the single power supply is 1000 KW with 0.18 $/kWh. The consumption rate of four-stroke diesel engine fuel is 0.216 kg/kWh, the price of heavy oil is 629 $/ton, and the marine diameter quality diesel oil is 1070 $/ton. The RMB exchange rate with dollars is 1:6.12, the intermedia fuel oil (IFO) price is 3849.48 yuan/ton, equivalent to 3.85 yuan/kg, and the marine gas oil (MGO) price is 6548.4 yuan/ton. Under the same circumstances, if the marine uses IFO, the wattage of electricity will cost 83 yuan, while MGO will cost 1.41 yuan. The direct use of shore power once will cost 1.1 yuan. The specific calculation is shown in Table 3.
Table 3 shows that, when the 4250 TEU ships use heavy oil, the cost of power generation is less than that of shore power. When using marine light diesel (MGO) power generation, cost is much higher than the shore power.
Based on the above calculation, we can conclude that the cost of heavy oil power generation is far below shore power. Thus, shipping companies will not use shore power. If a country has more strict air pollution control laws and regulations, it can strictly control the air pollution of its ships. Hong Kong ships only use marine light oil power instead of heavy oil power, so the cost of shore power would be much lower than that of a light oil ship. Shipping companies will actively consider modifying their shipping facilities and using shore power. In addition, if the oil price continues to rise and the price of electricity remains unchanged, the cost of shore power will be lower than heavy oil power. In this case, shipping companies will begin to use shore power instead of a heavy oil generation scheme. If the cost of shore power is lower than heavy oil, shipping companies will use shore power instead of heavy oil power. The specific solutions are shown in Table 4.
The facility renovation of shore power costs an average of 3 million yuan. Compared to the price of shore power, that is a difference of 0.31–1.41 yuan/kWh using the marine light diesel generator; and 1.10 yuan/kWh using shore power). When the ports cost 3 million to renovate, they need to use 9.6774 million kWh of electricity to recover the cost. Based on Shenzhen statistics data from 2015, the ships stay on average for 15 h in the port. If all 4250 TEU container ships use shore power, the average power consumption is about 1000 kWh, and the ships require 15,000 kWh of power consumption when the ships dock. According to the schedule arrangement, the 4250 TEU container ships dock 12 times a year. Without funding support, the return time on investment is far too long, longer than the years of vessel decommission. Thus, it is difficult to persuade shipping companies to abandon traditional fuel power generation and use shore power.
Generally, the price of heavy oil is low, and the price of shore power is high. Because of the high cost of shore power equipment, shipping companies will not replace the fuel oil with shore power. To promote shore power, the Shenzhen government should carry out measures to improve the efficiency of the loading and unloading or of terminal operations. Since the connection of shore power requires 20–40 min at a time, the average berthing time in the Port of Shenzhen is generally about 10–12 h. Thus, shore power will take a larger proportion of a ship’s docking time. Improvement measures are needed to make up for the consumption of connecting time. Besides improving the efficiency of the loading and unloading, the Port of Shenzhen should also consider encouraging ships to use shore power or to prioritize departure scheduling.

6.3. Using Marine Low Sulfur Fuel Oil

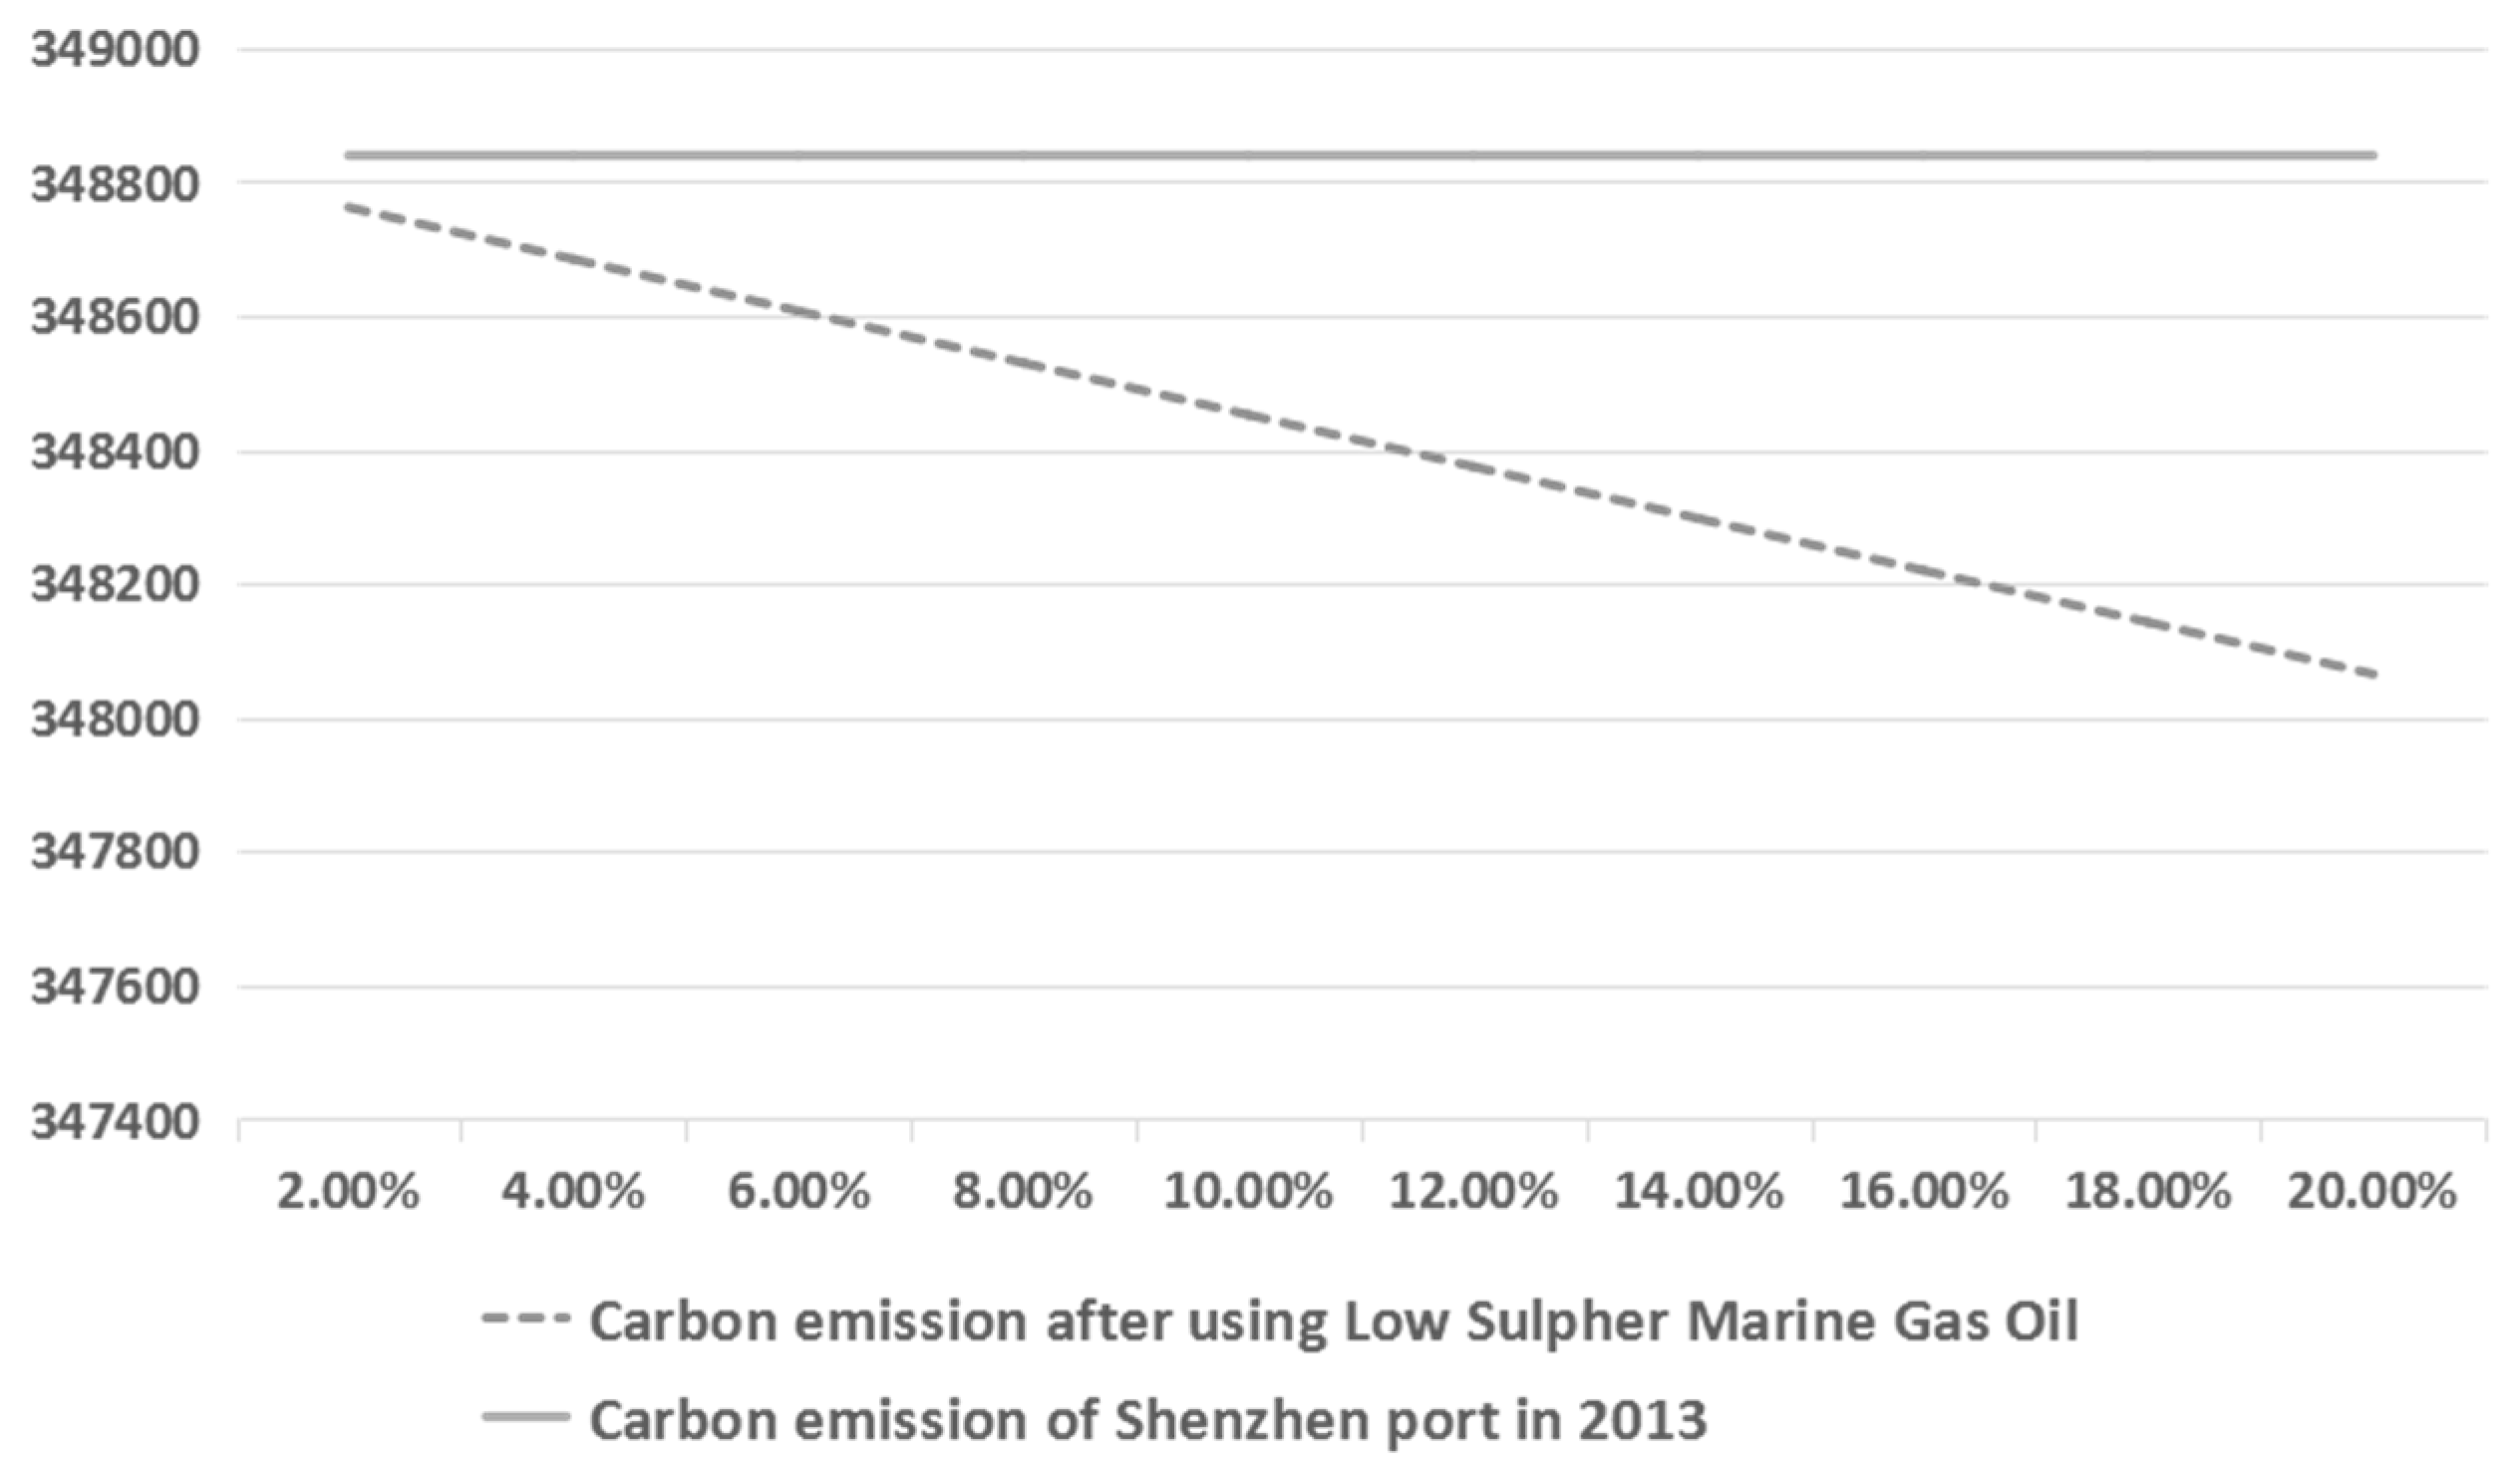
Emission reductions of low sulfur fuel oil (LSFO) are obvious. By using the LSFO, the average reduction among NO, PM, SO, and CO is 8% [34]. The supervision of marine low sulfur bunker fuel is proposed. Before October 2015, the bonded ship with fuel supply implemented ISO standards and used marine fuel oil. Social private producers reduce costs and use harmonic bunker fuel with non-petroleum base components. In GBl7411, it defines what kind of the distillate and residue fuel can be used. State standards of marine fuel oil will adopt a mandatory implementation to standardize the marine fuel oil market. The sulfide content control index is much clearer. In addition, scientists should develop vegetable oils. Being renewable, they have a sulfur content close to zero and hence cause less environmental damage (lower greenhouse effect) than does diesel [35]. The carbon emissions from the Port of Shenzhen after using LSFO in different proportions are shown in Figure 9.
Low sulfur fuel oil (LSFO), compared with heavy fuel oil (HFO), reduces not only marine sulfur and nitrogen oxide emissions, but also carbon emissions. Compared with the usage of HFO, an auxiliary engine of ships can reduce 34 grams of carbon emissions when 1 kilowatt-hour electricity is generated using LSFO, while a boiler can reduce 48 grams. Since energy consumption is 1.56 billion kilowatt of electricity, it produces 1.56 million kilograms of carbon emissions.
The reduction in carbon emissions by using shore power can be calculated based on the following equations. Δ E A and Δ E T stand for the reduction in emission from engines and boilers, q 3 stands for the proportion of ships that use LSFO, Δ R A and Δ R T stand for the emission rate differences between the auxiliary engines and boilers using LSFO and using HFO.
Δ E A = E A × q 3 × ( 1 Δ R A / R A )
Δ E T = E T × q 3 × ( 1 Δ R T / R T ) .
Shenzhen Green Conventions are guided by the Shenzhen municipal government. The signing of the convention aims to create a green port and protect the environment. Through the port machinery, “oil change electricity”, “oil change gas (LNG)”, shore power, and low sulfur oil, such measures can reduce air pollutant emissions and improve the quality of the air in Shenzhen.
The first batch of companies that joined the Shenzhen green conventions are Yantian, Chiwan, Shekou, Dachan Bay, and the Mawan power plant. Hong Kong, COSCON, Yang Ming Shipping, Maersk, Herb, Shipping and Orient overseas, seven international shipping companies, and a total of 66 container ships were involved in the first registration. In addition, LSFO was not only used at berth, but in the navigation. Some countries and regions set up sulfur emission control areas and required ships to use LSFO after entering those areas. There are four sulfur emission control areas operating now.

7. Discussion and Conclusions

Integrated logistics in the Port of Shenzhen has developed rapidly. Due to the higher efficiency of loading and unloading, it has lower carbon emissions. Advanced heavy equipment can also decrease emissions. Because of the processing and rework services, material consumption brings a certain amount of carbon emissions. This paper proposes the concept of a port-integrated logistics system, elements of that system, and the relationship between internal and external systems. By studying the characteristics of carbon emission sources and using the discharge coefficient method, calculation methods of four kinds of emission sources were obtained. Ports around the world have similar functions and operation modes, so this method can be generalized to various types of ports. This paper takes the Port of Shenzhen as an example and estimates the carbon emissions in an integrated logistics system from four main sources. Carbon emissions from transportation and heavy equipment are the largest among the four kinds of emission sources, while emissions from logistics services are the largest of three kinds of services. After analyzing the results, we found that emissions from the ship at berth are the highest. With the development background of the 13th Five-Year Plan, the most efficient ways to reduce carbon emissions are the improvement of loading and unloading efficiency, and the usage of shore power and LSFO. The efficiency of loading and unloading can be improved by optimizing the port layout and the loading and unloading processes.
In terms of energy, the use of shore power and LSFO are emphasized. In China, the emission control zone (ECZ) requirement is lower than the emission control area (ECA). The requirement of sulfur content for ships is under the limit of 0.5%. Currently, the government only controls sulfur oxide emissions without any other special nitric oxide emission control implementations. In addition, within the scope of ECZ, the implementation of the control requirement must be done in stages. The ships should keep sulfur content under the limit of 0.5% in the core control area. Finally, all ships are required to use the upper limit of sulfur content of 0.5% oil. When ships are on the port, the pollutant discharge has been changed from a “mobile source” to a “fixed source”. The use of LSFO and shore power can achieve the goal of reducing atmospheric port pollution.
With the low sulfur oil government policy in Shenzhen, ship companies that keep sulfur content between 0.1% and 0.5% will earn subsidies for 75% of the price difference. Ship companies that keep sulfur content under 0.1% will gain full subsidies for the price difference. For the difference between the electricity cost and the electricity fee, the government provides full subsidies. Moreover, on the basis of shore power facility maintenance costs, port enterprises can gain an extra subsidies of 0.07 yuan per kilowatt-hour. When ships use shore power, they eliminate the use of auxiliary fuel power generation and transfer atmospheric pollutants to power plant areas. To realize the goal of green port construction, the Shenzhen government invests 200 million yuan a year for subsidies. Shore power facilities require a large amount of capital and need to be carried out in stages. Establishing an operational pilot area provides a sufficient basis and reference for subsequent shore power facilities.
During the rapid development period, to continually improve in global competitiveness, the Shenzhen government has introduced advanced equipment and has improved the efficiency of loading and unloading. In 2015, the Yantian port has also been rewarded as an “outstanding terminal with a high efficiency of loading and unloading at China ports” [36]. By the end of 2016, twelve electrical facilities berths had been completed to provide ocean ships with shore power. Nowadays, the Port of Shenzhen has the highest number of berths in China. In 2017, the Shenzhen government will continue to promote shore power facility construction and encourage port ships to use shore power and LSFO [37].
In addition, due to the limited capability of the authors, this paper establishes a carbon emission calculation model for the integrated logistics of the Port of Shenzhen. Some research objects are limited here, but the parameters cannot be fully applied to other ports. We simply propose the concept of integrated logistics, but the concept is not widely accepted by the public. To complete and promote the concept of integrated logistics, related parameters on carbon emission models can be adjusted to apply to other ports. Innovative research is recommended in the future for further research in these areas.

Acknowledgments

This work was supported by the National Natural Science Foundation of China (71572058, 71101054).

Author Contributions

Lei Yang conceived the model and designed the experiments; Yiji Cai and Xiaozhe Zhong wrote the paper; Yongqiang Shi and Zhiyong Zhang revised the whole details.

Conflicts of Interest

The authors declare no conflict of interest.

Appendix A

Variables of Estimation. Some are based on ENTRC [33] or the port of Long Beach [34], while others are collected by our derivation or our investigation group.
Table A1. Emission rate of vehicles [33].
SpeedEmission RateSpeedEmission Rate
04933 g/h26–30 km/h1355.248 g/km
1–10 km/h2533.400 g/km31–40 km/h1264.525 g/km
11–15 km/h2092.835 g/km41–50 km/h1187.473 g/km
16–25 km/h1718.138 g/km51–60 km/h1122.848 g/km
Table A2. Operation data of vehicles. (* means that the datum are from calculation).
TerminalVariable20132014
MaxMinAvgMaxMinAvg
Chiwan Container TerminalSpeed30 km/h5 km/h11.3 km/h30 km/h5 km/h11.3 km/h
Avg Distance *————1.09 km————1.09 km
Idling time11 min03.8 min13 min03.7 min
Total distance *577,498.78 km622,703.96 km
Dachan Bay TerminalSpeed30 km/h5 km/h10 km/h30 km/h5 km/h10 km/h
Avg Distance *————1.37 km————1.37 km
Idling time21 min05.2 min17 min04.6 min
Total distance *184,333.32 km160,779.86 km
Shekou Container TerminalSpeed30 km/h5 km/h11.5 km/h30 km/h5 km/h11.5 km/h
Avg Distance *————1.12 km————1.12 km
Idling time14 min03.7 min14 min03.8 min
Total distance *624,585.99 km722,486.71 km
Yantian PortSpeed60 km/h5 km/h15.2 km/h60 km/h5 km/h15.2 km/h
Avg Distance *————2.42 km————2.42 km
Idling time38 min04.4 min30 min04.2 min
Total distance *3,026,111.76 km2,798,831.91 km
Table A3. Operation data of ships in Chiwan Container Terminal (hours).
Type2013 at Berth2013 at Anchorage 2014 at Berth2014 at Anchorage
Container (0 TEU–1000 TEU)137.937.80124.1476.09
Container (1000 TEU–2000 TEU)205.890.00178.2111.95
Container (2000 TEU–3000 TEU)240.080.00110.5628.89
Container (3000 TEU–4000 TEU)1113.460.00560.6222.63
Container (4000 TEU–5000 TEU)855.420.29360.3031.51
Container (5000 TEU–6000 TEU)4.700.0026.780.00
Container (6001 TEU–7000 TEU)39.960.3832.390.43
Container (7000 TEU–8000 TEU)290.520.00894.4272.44
Container (8000 TEU–9000 TEU)176.931.35362.5424.87
Container (9000 TEU–10000 TEU)36.911.86290.4029.04
Container (10,000 TEU–11,000 TEU)130.770.17301.5926.55
Container (11,000 TEU–12,000 TEU)22.440.0011.180.00
Container (12,000 TEU–13,000 TEU)48.510.11161.3413.20
Container (>13,000 TEU)11.250.000.000.00
Bulk carrier560.14573.45613.50659.29
Cruise73.950.00141.570.00
Others839.410.00661.320.69
Table A4. Operation data of ships in Dachan Bay Terminal (hours).
Type2013 at Berth 2013 at Anchorage 2014 at Berth2014 at Anchorage
Container (0 TEU–1000 TEU)32.681.8535.8821.99
Container (1000 TEU–2000 TEU)48.780.0051.503.45
Container (2000 TEU–3000 TEU)56.880.0031.958.35
Container (3000 TEU–4000 TEU)263.790.00162.026.54
Container (4000 TEU–5000 TEU)202.660.07104.139.11
Container (5000 TEU–6000 TEU)1.110.007.740.00
Container (6001 TEU–7000 TEU)9.470.099.360.12
Container (7000 TEU–8000 TEU)68.830.00258.4820.93
Container (8000 TEU–9000 TEU)41.920.32104.777.19
Container (9000 TEU–10000 TEU)8.750.4483.928.39
Container (10,000 TEU–11,000 TEU)30.980.0487.167.67
Container (11,000 TEU–12,000 TEU)5.320.003.230.00
Container (12,000 TEU–13,000 TEU)11.490.0346.633.82
Container (>13,000 TEU)2.670.000.000.00
Bulk carrier132.70135.86177.30190.53
Cruise17.520.0040.910.00
Others198.870.00191.120.20
Table A5. Operation data of ships in Shekou Container Terminal (hours).
Type2013 at Berth 2013 at Anchorage 2014 at Berth2014 at Anchorage
Container (0 TEU–1000 TEU)166.309.40135.4883.04
Container (1000 TEU–2000 TEU)248.230.00194.4913.04
Container (2000 TEU–3000 TEU)289.460.00120.6631.53
Container (3000 TEU–4000 TEU)1342.440.00611.8524.70
Container (4000 TEU–5000 TEU)1031.330.34393.2234.39
Container (5000 TEU–6000 TEU)5.670.0029.230.00
Container (6001 TEU–7000 TEU)48.180.4635.350.47
Container (7000 TEU–8000 TEU)350.260.00976.1479.06
Container (8000 TEU–9000 TEU)213.311.62395.6727.14
Container (9000 TEU–10000 TEU)44.512.24316.9331.69
Container (10,000 TEU–11,000 TEU)157.660.20329.1428.98
Container (11,000 TEU–12,000 TEU)27.060.0012.210.00
Container (12,000 TEU–13,000 TEU)58.480.13176.0814.41
Container (>13,000 TEU)13.570.000.000.00
Bulk carrier675.32691.38669.56719.53
Cruise89.160.00154.510.00
Others1012.030.00721.740.75
Table A6. Operation data of ships in Yantian Port (hours).
Type2013 at Berth 2013 at Anchorage 2014 at Berth2014 at Anchorage
Container (0 TEU–1000 TEU)303.3417.15320.0783.04
Container (1000 TEU–2000 TEU)452.790.00459.4713.04
Container (2000 TEU–3000 TEU)527.990.00285.0531.53
Container (3000 TEU–4000 TEU)2448.710.001445.4424.70
Container (4000 TEU–5000 TEU)1881.220.63928.9634.39
Container (5000 TEU–6000 TEU)10.350.0069.060.00
Container (6001 TEU–7000 TEU)87.890.8483.520.47
Container (7000 TEU–8000 TEU)638.900.002306.0579.06
Container (8000 TEU–9000 TEU)389.102.96934.7327.14
Container (9000 TEU–10000 TEU)81.184.09748.7331.69
Container (10,000 TEU–11,000 TEU)287.590.37777.5728.98
Container (11,000 TEU–12,000 TEU)49.360.0028.840.00
Container (12,000 TEU–13,000 TEU)106.670.24415.9814.41
Container (>13,000 TEU)24.750.000.000.00
Bulk carrier1231.841261.121581.78719.53
Cruise162.630.00365.010.00
Others1846.010.001705.050.75
Table A7. Emission rate of ships.
FuelAuxiliary EngineBoiler
HFO683 g/kw-h970 g/kw-h
MLSFO649 g/kw-h922 g/kw-h
Table A8. Power of ships (kw).
TypeAuxiliary Engine at BerthAuxiliary Engine at AnchorageBoiler
Container (0 TEU–1000 TEU)720957241
Container (1000 TEU–2000 TEU)1039985325
Container (2000 TEU–3000 TEU)641747474
Container (3000 TEU–4000 TEU)11361403492
Container (4000 TEU–5000 TEU)11281316630
Container (5000 TEU–6000 TEU)8041162565
Container (6001 TEU–7000 TEU)8451220551
Container (7000 TEU–8000 TEU)10081457525
Container (8000 TEU–9000 TEU)10301488547
Container (9000 TEU–10000 TEU)10751375749
Container (10,000 TEU–11,000 TEU)15002000600
Container (11,000 TEU–12,000 TEU)20002500600
Container (12,000 TEU–13,000 TEU)17002600600
Container (>13,000 TEU)30003000700
Bulk carrier221318132
Cruise544554451393
Others718661254
Table A9. Operation data of heavy equipment.
TerminalEquipmentFuelAvg PowerAvg Load2013 Operation Time2014 Operation Time
Chiwan Container TerminalRTGDiesel/electric617.4 kw22%48,557.48 h52,198.50 h
Top handlers and side handlersDiesel148.9 kw58%120,102.02 h139,388.32 h
forkliftsDiesel/LPG73.9 kw31%31,542.51 h32,225.95 h
other equipmentDiesel/LPG/electric115.2 kw57%6676.26 h7027.64 h
Dachan Bay TerminalRTGElectric617.4 kw22%12,293.23 h13,215.03 h
Top handlers and side handlersDiesel148.9 kw58%30,406.07 h35,288.76 h
forkliftsDiesel/LPG73.9 kw31%7985.58 h8158.60 h
other equipmentDiesel/LPG/electric115.2 kw57%1690.22 h1779.18 h
Shekou Container TerminalRTGDiesel/electric617.4 kw22%51,067.07 h54,896.27 h
Top handlers and side handlersDiesel148.9 kw58%126,309.24 h146,592.32 h
forkliftsDiesel/LPG73.9 kw31%33,172.72 h33,891.48 h
other equipmentDiesel/LPG/electric115.2 kw57%7021.31 h7390.85 h
Yantian PortRTGDiesel/electric617.4 kw22%114,401.72 h122,979.98 h
Top handlers and side handlersDiesel148.9 kw58%282,961.09 h328,399.74 h
forkliftsDiesel/LPG73.9 kw31%74,314.34 h75,924.53 h
other equipmentDiesel/LPG/electric115.2 kw57%15,729.30 h16,557.16 h
Table A10. Emission rate of heavy equipment.
FuelPowerEmission Rate
Diesel 762 g/kw-h
LPG0–38 kw1050 g/kw-h
LPG39–90 kw1038 g/kw-h
LPG91–999 kw981 g/kw-h
Table A11. Emission rate of materials (ton/thousand RMB yuan).
MaterialEmission Rate
Paper material0.25
Plastic material0.37
Wood and other materials0.19
Table A12. Packaging materials consumption in the Port of Shenzhen (thousand RMB yuan).
TerminalMaterial20132014
Chiwan Container TerminalPaper material30,00527,827
Plastic material26,76124,819
Wood and other materials24322256
Dachan Bay TerminalPaper material61497047
Plastic material54846285
Wood and other materials498571
Shekou Container TerminalPaper material33,90029,282
Plastic material30,23526,116
Wood and other materials27482374
Yantian PortPaper material60,59365,431
Plastic material54,04258,358
Wood and other materials49125305
Table A13. Energy consumption in the Port of Shenzhen (thousand kw-h).
Terminal20132014
Chiwan Container Terminal10,6089838
Dachan Bay Terminal21742491
Shekou Container Terminal11,98510,352
Yantian Port21,42223,132

References

  1. Amit, G.; Manmohan, K. The sectoral trends of multi-gas emissions inventory of India. Atmos. Environ. 2006, 40, 4608–4620. [Google Scholar]
  2. Port Economy Becomes the Engine of Shenzhen Economy. Shenzhen Business Newspaper. 2003. Available online: http://www.docin.com/p-1087726194.html (accessed on 10 March 2015).
  3. Guangdong Province the 13th “Five-Year” Planning about Energy and Emissions Reduction in Transportation. 2016. Available online: http://max.book118.com/html/2016/1208/69952439.shtm (accessed on 8 December 2016).
  4. An, X.; Huang, Z. The advent of the era of integrated logistics and the evolution of the port function. Trop. Geogr. 2001, 21, 276–281. [Google Scholar]
  5. Khalid, B.; Richard, G. A logistics and supply chain management approach to port performance measurement. Marit. Policy Manag. 2007, 31, 47–67. [Google Scholar]
  6. Lu, Y.; Hu, W. Sydney harbour green port practice and its enlightenment to our country. Chin. Navig. 2009, 32, 72–76. [Google Scholar]
  7. Winebrake, J.J.; Corbett, J.J. Mitigating the health impacts of pollution from oceangoing shipping: An assessment of low-sulfur fuel mandates. Environ. Sci. Technol. 2009, 43, 4776–4782. [Google Scholar] [CrossRef] [PubMed] [Green Version]
  8. Karim, A. Sustainable and green ports: Application of sustainability principles to port development and operation. In Proceedings of the 11th Triennial International Conference on Ports, San Diego, CA, USA, 25–28 March 2007; pp. 25–28.
  9. Liu, C.; Gao, B. Analysis of energy-saving measures in ports. In Proceedings of the 2010 Asia-Pacific Power and Energy Engineering Conference (APPEEC), Chengdu, China, 28–31 March 2010; pp. 28–31.
  10. Berechman, J.; Tseng, P. Estimate the environmental costs of port related emissions: The case of Kaohsiung. Transp. Res. Part D Transp. Environ. 2012, 1, 35–38. [Google Scholar] [CrossRef]
  11. Goulielmos, M. European Policy on Port Environmental Protection. Glob. NEST 2000, 2, 189–197. [Google Scholar]
  12. Shang, R. Port environmental protection counter-measure research based on the sustainable development. Adv. Mater. Res. 2013, 8, 726–731. [Google Scholar]
  13. Xu, B. The planning and layout of green port. China’s Water Transp. 2015, 4, 12–21. [Google Scholar]
  14. Acciaro, M.; Lee, K. Environmental sustainability in seaports: A framework for successful innovation. Marit. Policy Manag. 2014, 8, 480–500. [Google Scholar] [CrossRef]
  15. Palantzas, G. Management of environmental issues in port activities: The Hellenic caste study. Int. J. Inf. Syst. Supply Chain Manag. 2014, 7, 40–55. [Google Scholar] [CrossRef]
  16. Gou, M. The 2nd international conference on computer and automation engineering. IEEE Comput. Soc. 2010, 4, 26–28. [Google Scholar]
  17. Ling, Q. Study on the evaluation index system of green port. Shanghai Port Technol. 2010, 1, 4–7. [Google Scholar]
  18. Yang, B.; Gao, Y. Research on the energy consumption evaluation model of container terminal logistics system. J. Appl. Mech. Mater. 2012, 157, 1224–1229. [Google Scholar] [CrossRef]
  19. Liu, J.; Bian, Z. Evaluation of energy-efficient production for container terminal. J. Appl. Mech. Mater. 2012, 524, 2557–2561. [Google Scholar]
  20. Liu, Q. Based on principal component analysis of Tianjin port logistics development trend research. Manag. Sci. 2010, 10, 39. [Google Scholar]
  21. Yu, H. The Coal Supply Chain Carbon Emissions Measurement and Control Research. Master’s Thesis, Beijing Jiaotong University, Beijing, China, 2011. [Google Scholar]
  22. Song, Y. Low Carbon Construction Cycle Logistics System Effect Research. Master’s Thesis, Beijing Jiaotong University, Beijing, China, 2011. [Google Scholar]
  23. Benjaafar, S.; Li, Y. Carbon Footprint and the Management of Supply Chains: Insights from Simple Models. IEEE Trans. Autom. Sci. Eng. 2013, 10, 99–116. [Google Scholar] [CrossRef]
  24. Kim, N.S.; Janic, M. Trade-off between Carbon Dioxide Emissions and Logistics Costs Based on Multi-objective Optimization. Transp. Res. 2009, 2139, 107–116. [Google Scholar]
  25. Balan, S.; Robertde, S. Modeling Carbon Footprints across the Supply Chain. Int. J. Prod. Econ. 2010, 128, 43–50. [Google Scholar]
  26. Peng, C. Port carbon accounting methods—Case study of Jurong Port carbon footprint report 2010 in Singapore. Navig. Res. 2012, 7, 5–9. [Google Scholar]
  27. Wang, W.; Zhang, Y. Carbon emissions calculation methods of port container handling operation. Port Tech. 2013, 50, 6–7. [Google Scholar]
  28. Chim, H.; Po-Hsing, T. The impact of an emerging port on the carbon dioxide emissions of inland Container transport: An empirical study of Taipei port. Energy Policy 2010, 38, 5251–5257. [Google Scholar]
  29. Warren, B.F.; Howitt, A. Green-house gas emissions from the international maritime transport of New Zealand’s imports and exports. Energy Policy 2011, 39, 1521–1531. [Google Scholar]
  30. Xiao, Y.; Liu, S. Study on measurement of energy consumption for cranes and designing of energy saving device. Appl. Mech. Mater. 2012, 159, 326–330. [Google Scholar] [CrossRef]
  31. The Intergovernmental Panel on Climate Change (IPCC). The 2006 IPCC National Greenhouse Gas Emissions Listing Guide; Japan Hayama Global Environmental Institute for Strategic Studies (IGES): Miura District, Japan, 2006. [Google Scholar]
  32. The Air China Trade. Available online: http://www.snet.com.cn/106/2016_3_3/3_106_323392_373_1_1456979400406.html (accessed on 3 March 2016).
  33. Whall, C.; Cooper, D.; Archer, K. Quantification of Emissions from Ships Associated with Ship Movements between Ports in the European Community; Entec UK Ltd.: Halesowen, UK, 2002. [Google Scholar]
  34. Port of Long Beach 2012–2014 Air Emissions Inventory; Port of Long Beach The Green Port. Available online: http://www.polb.com/environment/air/emissions.asp (accessed on 10 February 2015).
  35. Diane, B.; Gina, S. Pollution prevention at ports: Clearing the air. Environ. Impact Assess. Rev. 2004, 24, 749–774. [Google Scholar]
  36. Top 10 Events in Shenzhen Port and Waterway. Jinyang Network News. Available online: http://news.163.com/17/0110/18/CAEKTERU00014AEE.html (accessed on 10 January 2017).
  37. Shenzhen Special Zone Newspaper. Available online: http://sz.people.com.cn/n2/2017/0213/c202846-29704755.html (accessed on 13 February 2017).
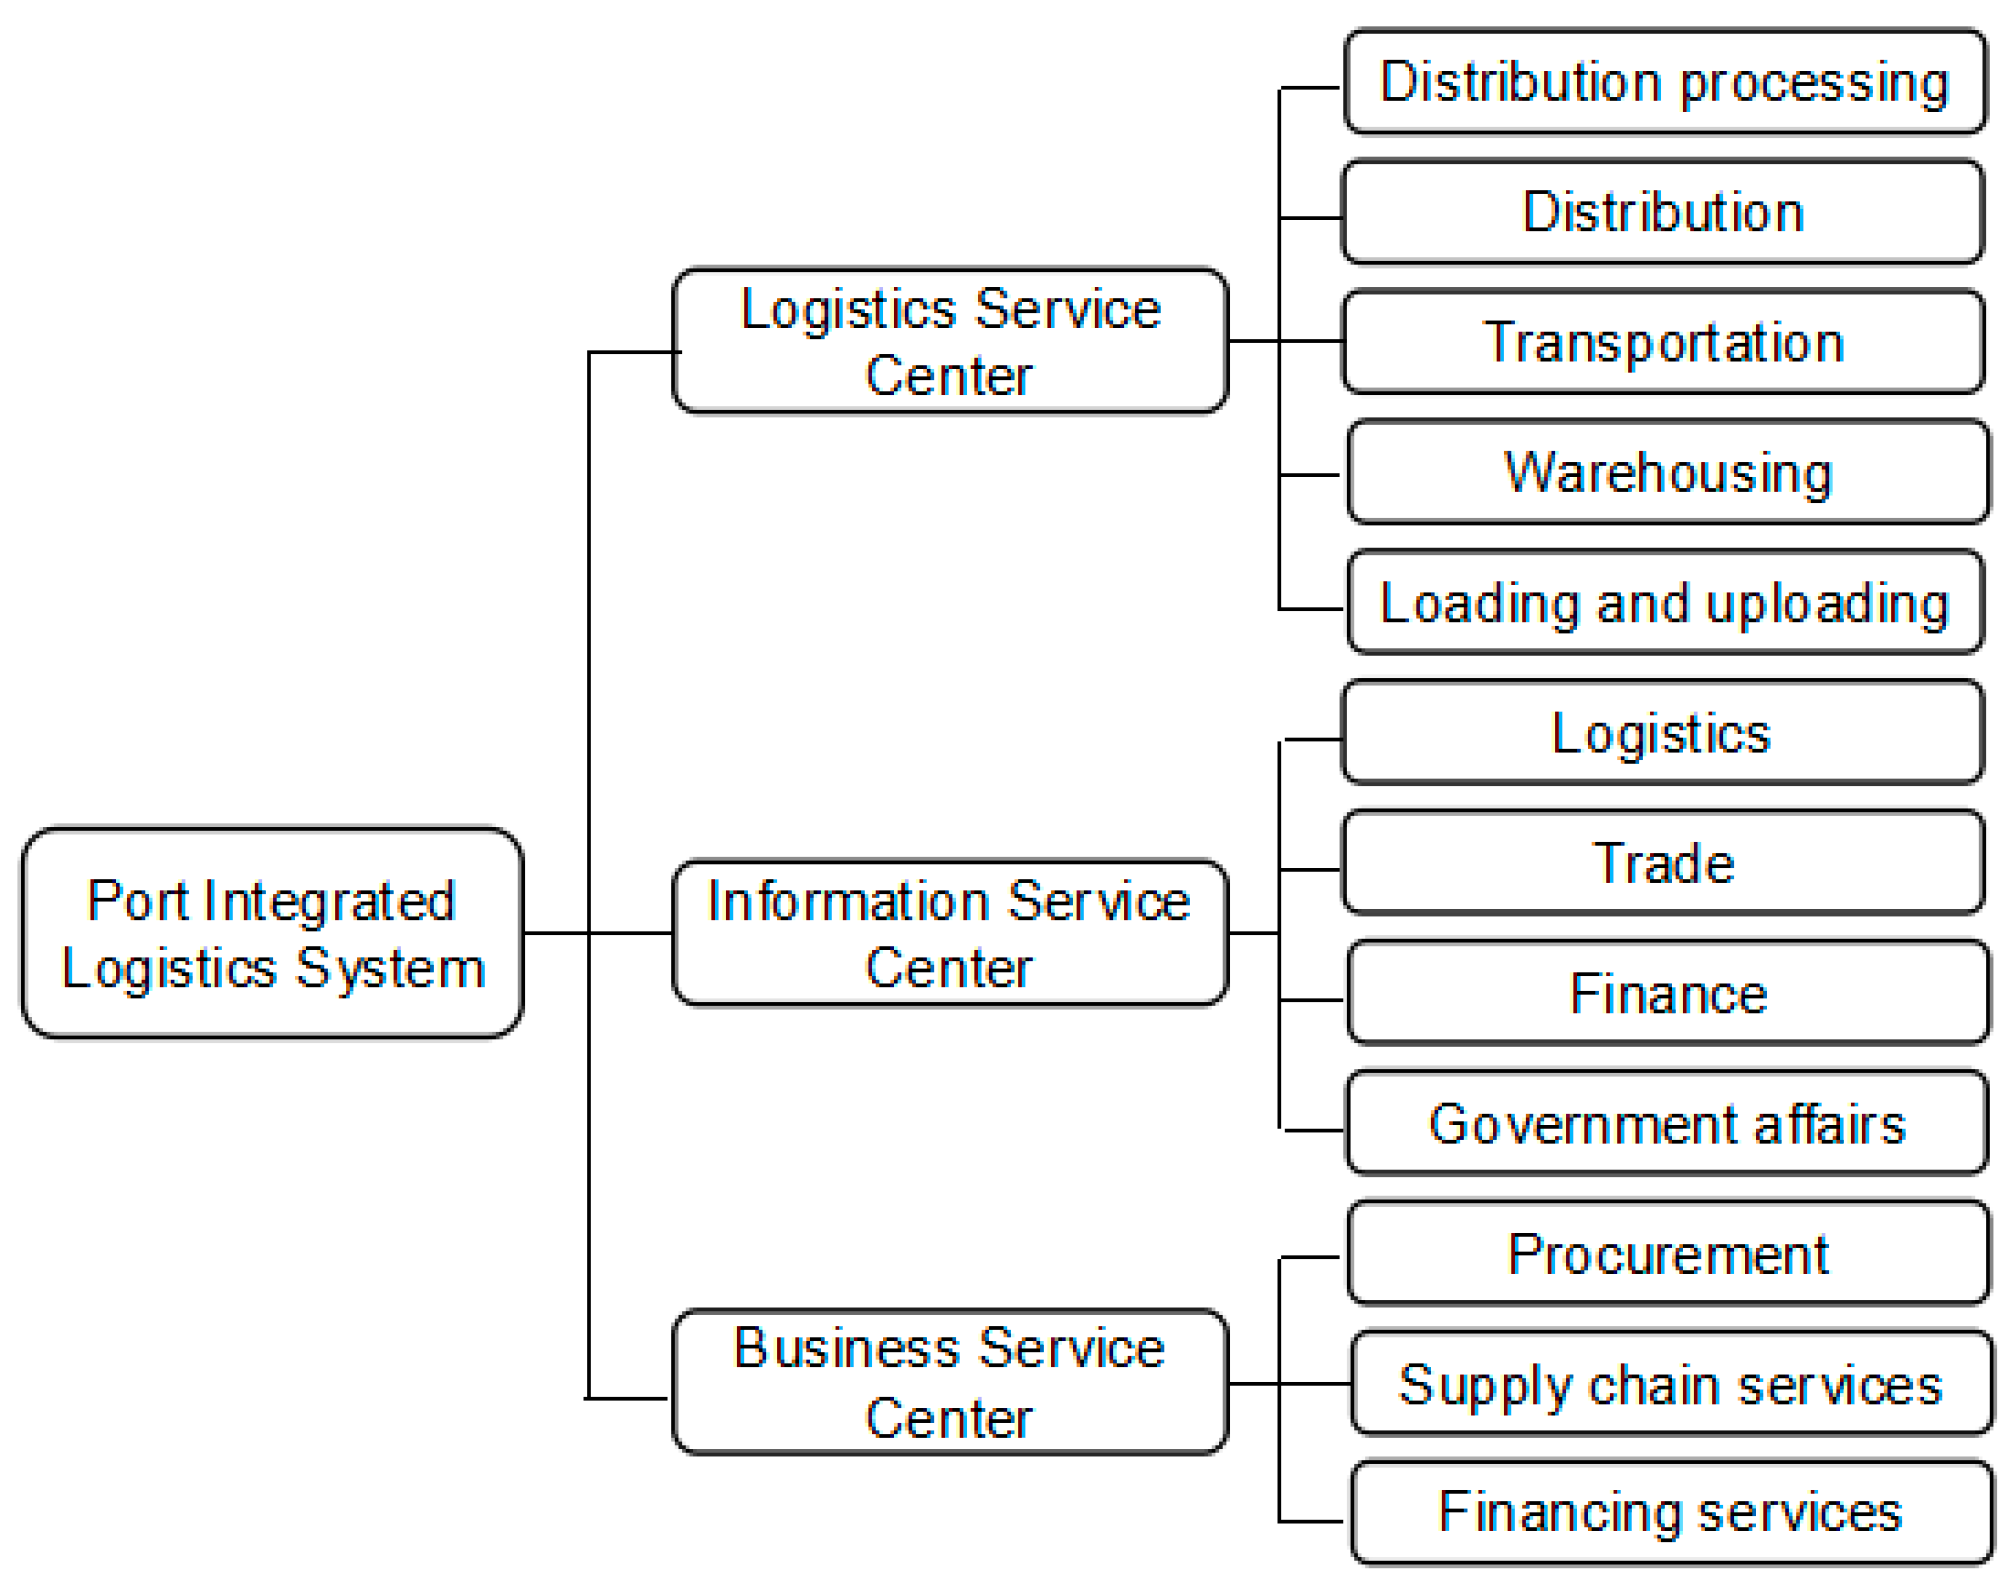
Figure 1. Function of a port-integrated logistics system.
Sustainability 09 00462 g001
Figure 2. Emission sources in port-integrated logistics system.
Sustainability 09 00462 g002
Figure 3. Emission sources in a logistics service center.
Sustainability 09 00462 g003
Figure 4. Throughput of the Port of Shenzhen in the last 10 years (1000 TEU).
Sustainability 09 00462 g004
Figure 5. Comparison of emission sources in the Port of Shenzhen.
Sustainability 09 00462 g005
Figure 6. Comparison of emission sources in the Port of Shenzhen.
Sustainability 09 00462 g006
Figure 7. Carbon emissions from the Port of Shenzhen in 2013 after improving the efficiency of loading and unloading to different degrees (tons).
Sustainability 09 00462 g007
Figure 8. Carbon emissions from the Port of Shenzhen in 2013 after using shore power in different proportions.
Sustainability 09 00462 g008
Figure 9. Carbon emissions from the Port of Shenzhen in 2013 after using low sulfur fuel oil in different proportions (tons).
Sustainability 09 00462 g009
Table 1. Characteristics and factors of carbon emissions in the Port of Shenzhen.
SourceCharacteristicsFactors
TransportationFew railways in terminals Road is more convenient for container transport
Less carbon emissions from ships at berthHigh loading and unloading efficiency, short berthed time
Heavy EquipmentHeavy equipment is mainly for container operationsMainly engaged in container cargo
Little carbon emissions from rubber-tired gantry (RTG) craneUse electric RTG crane only
Material ConsumptionLarge material consumption, especially packaging materialsMany kinds of distribution processing and rework services, especially in bonded zone
Energy ConsumptionEnergy consumption, especially on the cold chain storageCold chain logistics develops quickly in the western port area
Consumption on information system operationInformation communication obstacles bring the extra work
Table 2. Carbon emissions from the Port of Shenzhen (tons).
TerminalsEmissions SourcesDetails20132014
Chiwan Container TerminalTransportationVehicles on road9982.869258.15
Vehicles idling4000.893810.72
Ships at berth55,161.7253,163.42
Ships at anchorage7418.4310,978.32
Heavy equipmentRTG360.00386.99
Top handlers and side handlers12,048.8513,983.69
Forklifts768.43785.08
Other equipment14,776.9915,554.72
Material consumptionPaper material7531.256984.53
Plastic material9981.939257.30
Wood and other materials479.27444.47
Energy consumption 6766.656275.47
Dachan Bay TerminalTransportationVehicles on road2730.243130.20
Vehicles idling868.411125.51
Ships at berth14,149.6816,634.97
Ships at anchorage1522.353435.06
Heavy equipmentRTG00
Top handlers and side handlers2632.673055.43
Forklifts167.90171.54
Other equipment3228.763398.70
Material consumptionPaper material1543.411768.77
Plastic material2045.642344.34
Wood and other materials98.22112.57
Energy consumption 1386.731589.20
Shekou Container TerminalTransportationVehicles on road10,996.989506.85
Vehicles idling4513.533799.23
Ships at berth56,572.6849,355.46
Ships at anchorage7608.1810,191.99
Heavy equipmentRTG427.86459.94
Top handlers and side handlers15,255.8617,705.69
Forklifts972.96994.04
Other equipment18,710.1419,694.88
Material consumptionPaper material8508.927349.81
Plastic material11,277.739741.42
Wood and other materials541.48467.72
Energy consumption 7645.106603.67
Yantian PortTransportationVehicles on road40,461.8743,747.59
Vehicles idling8026.808890.29
Ships at berth108,346.98122,422.14
Ships at anchorage14,571.0610,701.03
Heavy equipmentRTG677.95728.79
Top handlers and side handlers24,173.1228,054.9
Forklifts1541.661575.06
Other equipment29,646.4731,206.81
Material consumptionPaper material15,208.8716,423.41
Plastic material20,157.8521,767.61
Wood and other materials967.851045.14
Energy consumption 13,664.8414,756.09
Table 3. Diesel generator and shore power cost analysis of the ship.
Comparison between Marine Diesel and Shore PowerMarine Diesel Generating ElectricityShore Power
IFO ConsumptionUnit PriceMGO ConsumptionUnit PriceUnit Price
0.216 kg/kWh3.85 yuan/kg0.216 kg/kWh6.59 yuan/kg1.10 yuan/kWh
Fee0.83 yuan/kWh1.41 yuan/kWh1.10 yuan/kWh
Compare with shore powerLower 0.27 yuanHigher 0.31yuan/
Table 4. The situation company use shore power.
The Scenario in Which a Company Uses Shore Power
1Country has stricter air pollution control regulations, mandatory banning the use of heavy oil power generation
2International oil prices rise, with heavy oil power generation cost is greater than the cost of the shore power