
Overall Urban–Rural Coordination Measures—A Case Study in Sichuan Province, China

Abstract
:1. Introduction
2. Literature Review
2.1. Researches on Overall Urban–Rural Development
- (1)
- Studies on urban–rural related concepts and economic phenomena. Urbanization and urban–rural dual economic structure were formulated earlier than the overall urban–rural coordination. The interactions relationships and networks had revealed the back ground and basic situation overall urban–rural [10,11,12,13,14,15]. Urban and rural differences were different in different regions. However, the first performance tested was income inequality between urban and rural residents, and was thus accompanied by unequal treatments on other services. Overall urban–rural development was affected by multiple factors. Fertner studied three migration models of ex-urbanization, displaced urbanization, and anti-urbanization, and found that displaced urbanization was the most susceptible to be impacted by general development [16]. Based on the current situation of the imbalanced urban–rural development in Bucharest, Zamfir discussed the process of structural evolution, and finally put forward sustainable development interventions [17]. Jong-Sup showed that urban social development expenditures on urban and rural integration tended to have a positive impact on regional economic development, which was greater than economic development spending and administrative expenditure. Social development expenditure was a significant investment to promote urban–rural integration [18]. Zhao found that financial development improved access to urban finance, and farmers became the providers of capital, further increasing the urban–rural divide [19]. Berdegué found that small and medium-sized cities were more capable of promoting economic development and narrowing the gap between the rich and the poor [20]. Van found a similar result [21].
- (2)
- Explore the problems and improvement of urban–rural development subsystems. That is, focusing on refinement aspects involved in urban and rural development, such as issues about employment equity, social security, medical services, education resources, and environmental pollution [22,23,24,25,26]. Gu used a social security Gini coefficient and a modified Gini coefficient to analyze the vigilance of old-age security and health care in both urban and rural environments, and found that the social security system in China was unable to effectively regulate the income gap between urban and rural areas [27]. Mushtaq and others found that residents generally do not have a strong awareness of tuberculosis (TB), especially in rural areas. It was recommended that the information dissemination channels to consider more in-depth transmission of TB prevention information [28]. Singh analyzed the 15 years of panel data for 6 regions in India, and found that urban and rural differences and gender differences in immunization had declined, but rural children and female children were still at disadvantaged status. Regular medical assessment and coordination of multiple-health work services include strong immunization systems, broad health systems, and other primary health care delivery programs were required for increasing immunization coverage [29]. Zeng divided the urban and rural areas, and built a core-edge model made up of urban–rural labor migration and environmental pollution [30]. Soffer took the case of Moshavas an example, and the identity of the farmers became diversified due to changes in the agricultural structure, and non-agricultural income had become the main source of narrowing the income gap between urban and rural areas [31]. Angelescu pointed out that narrowing the gap between urban and rural regions was conducted by the motivation and design of strategies. With Rome as the individual case, improving education level to ensure the basic skills could increase the employment rate [32]. Clarke thought that serious public library service inequality caused by economic inequality in China, which can only be evidently reduced by state intervention [33].
- (3)
- Measure and cause analysis on development level of overall urban–rural development. Following studies focused on causes, using a variety of technical methods which have provided an empirical basis for further strategic adjustment and correlation analyses, and urban–rural evaluation systems were developed to evaluate overall regional development [34,35]. The urban–rural income gap has been identified as an important indicator when seeking to measure the overall situation. Sun built an urban–rural income gap suitability evaluation system based on economic growth, resource allocation efficiency, social stability, and the equitable distribution of income [36]. Ding constructed a harmonization index system to describe the urban–rural development stage characteristics with farmland transfers, labor migration, and urbanization interaction [37]. Cao used land quantity control, landform compactness, and land use efficiency as the evaluation bases to measure the level of smart land use [38]. Afrakhteh assessed the land use planning in urban–rural areas of Falavarjan Township, using a variety of modeling methods for analysis. He suggested that the land surface temperature factor could be applied in future land use planning [39]. Wang suggested that initial measurements could be implemented with objective indicators rather than index systems. The support vector machine method is a learning theory of Vapnik-Chervonenkis Dimension, an indicator about the speed and generalization of uniform convergence, and structural risk minimization principle on the basis of statistics, to find the best compromise according to the limited sample information in model complexity (i.e., learning accuracy of specific training samples) and learning ability (i.e., error free to identify any samples). Based on SVM, an urban–rural development integration level measurement and classification model was developed, and validity and reliability were verified [40].
2.2. Summary on Previous Results and Research Innovation
- (1)
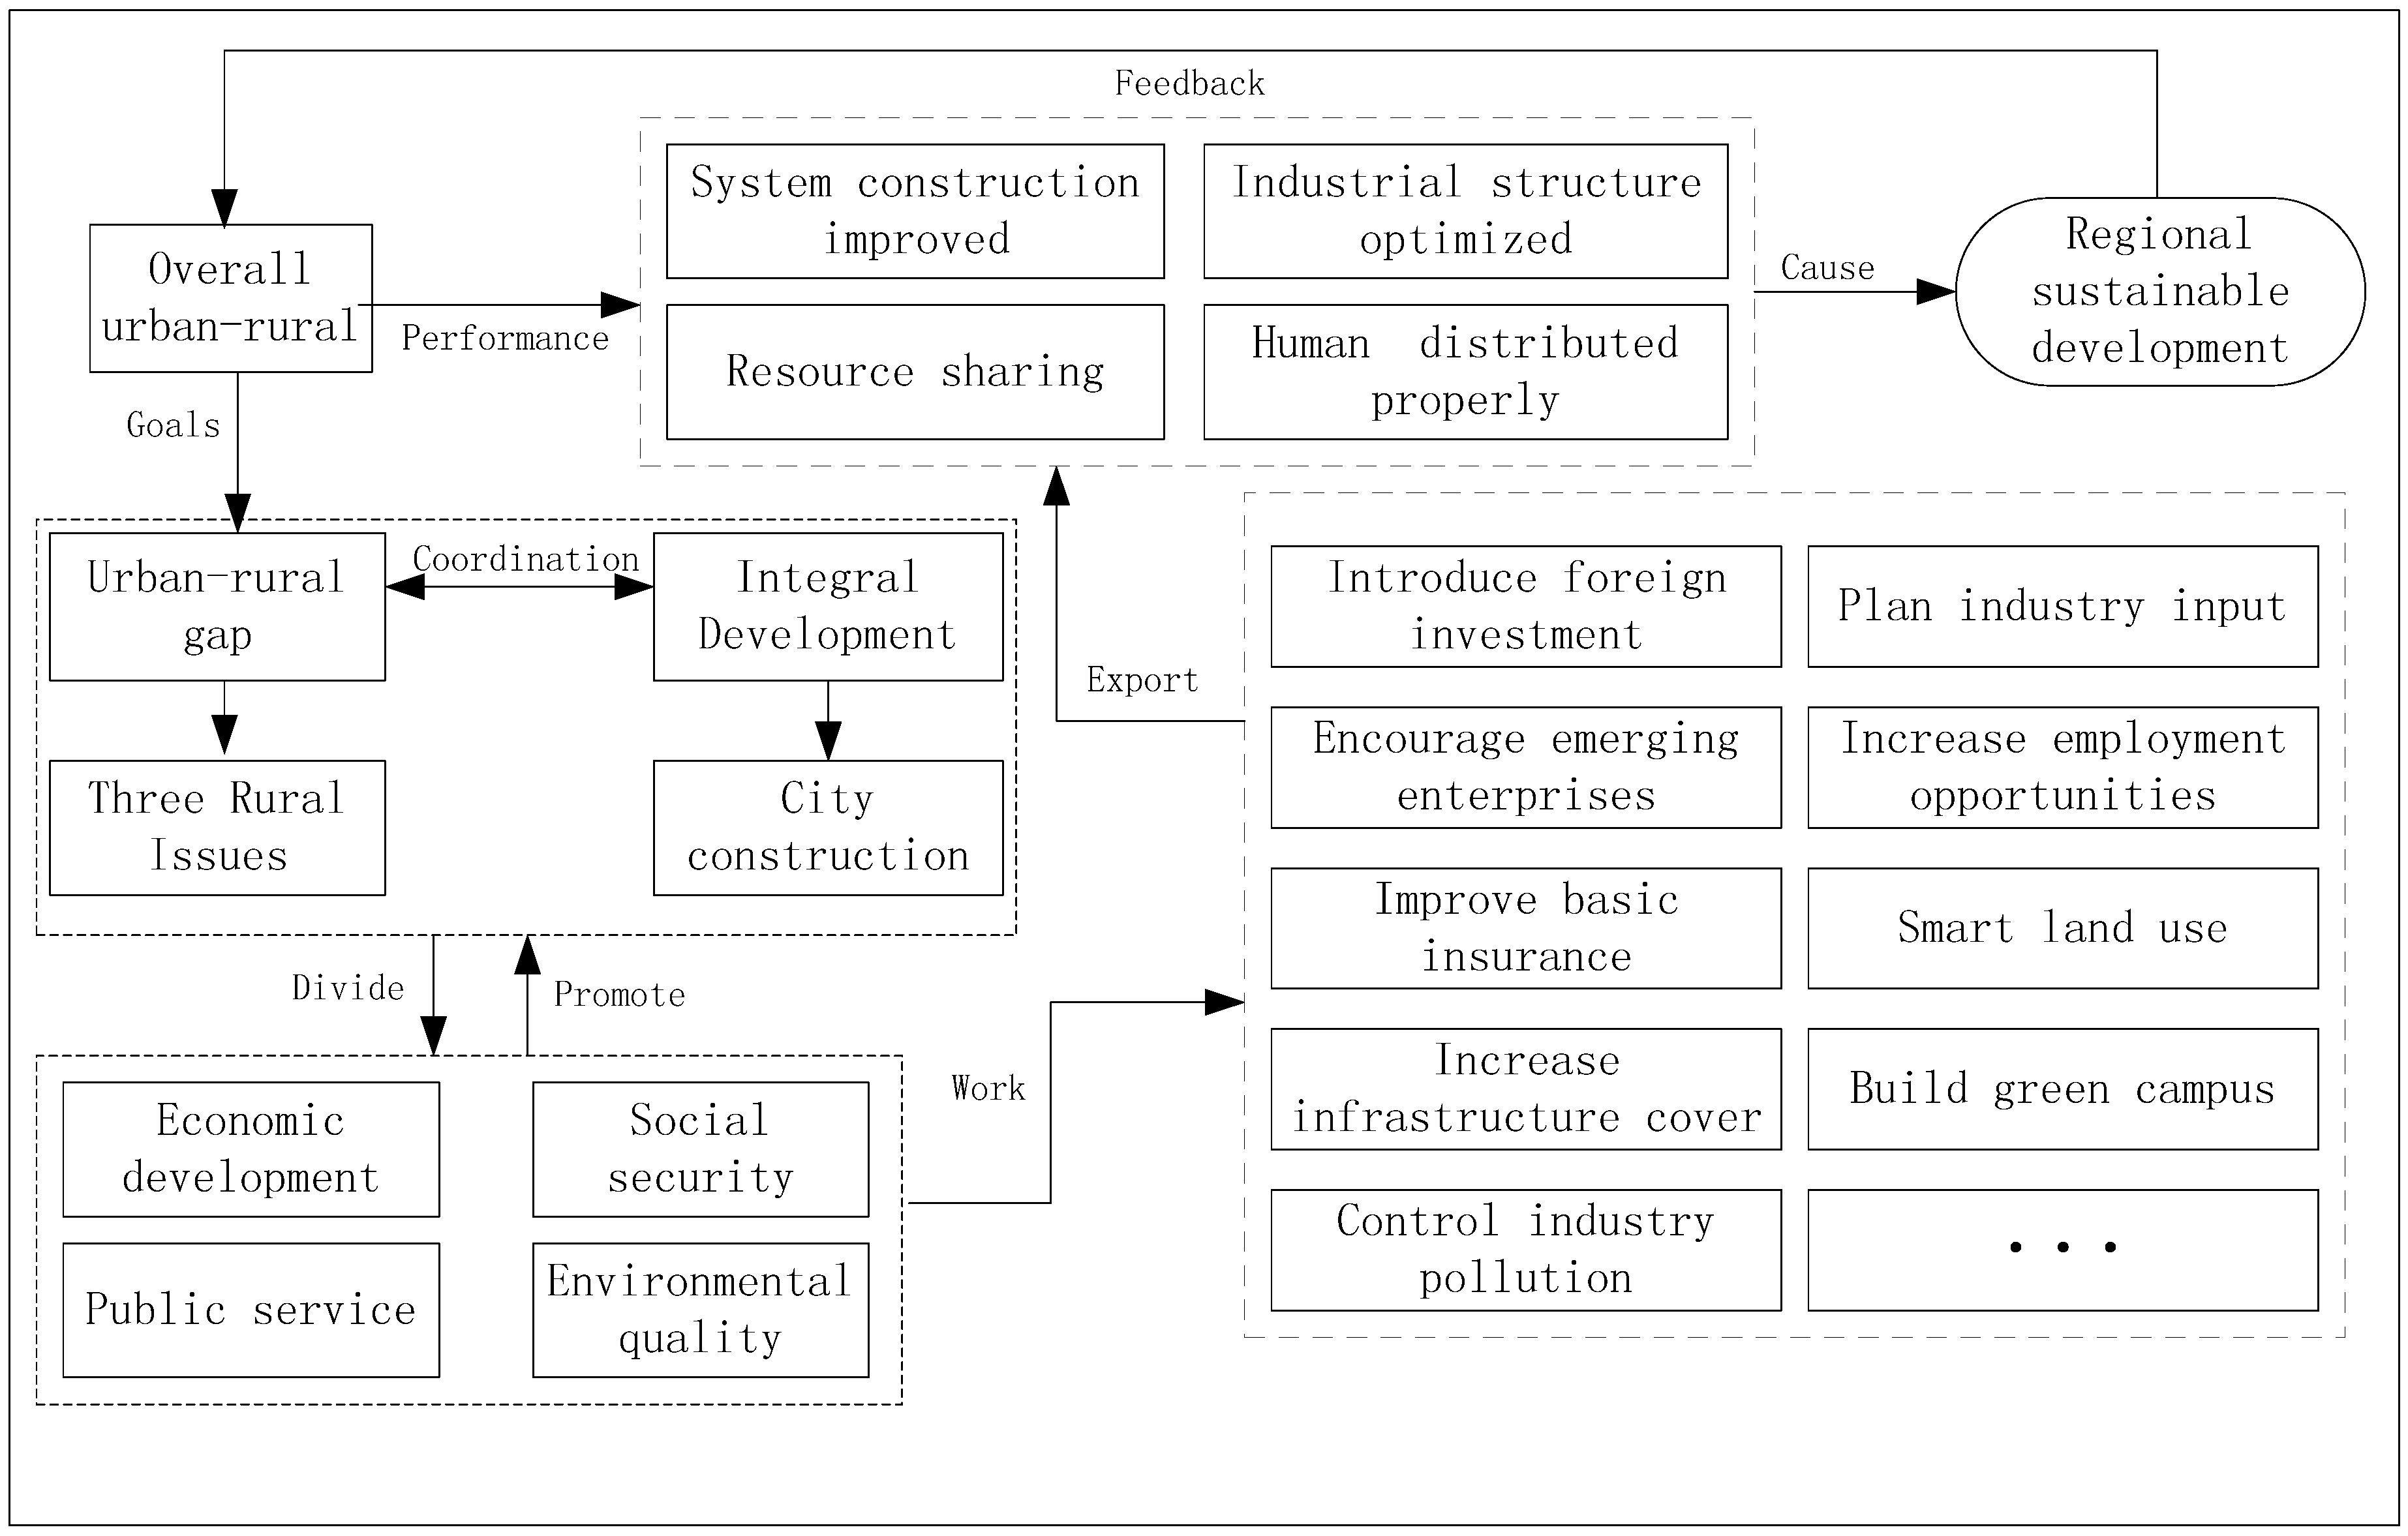
- There was a limited understanding about overall urban–rural issues. Most scholars focused alone on absolute improvement in the living standard of rural areas, or on narrowing the gap between urban and rural areas to evaluate the implementation effect of overall urban–rural work, ignoring the overall effectiveness of integral regional development. China has entered the middle stage of industrialization, and agriculture is no longer the economy-leading industry. The economic environment requires harmonious development between industry and agriculture, city and rural, to ensure nurturing relationships. The best overall urban–rural status is common prosperity and common development within the acceptable urban–rural gap [9]. This highly coordinated condition exists in each aspect, which means that the urban–rural gap and integral development are highly consistent in pace, which conducts sustainable social development, and then leads to the concept of coordinated development. Narrowing the urban–rural gap and coordinating integral development are prerequisites to regional sustainable development, which requires a joint consideration of the economic, societal, and environmental situations.
- (2)
- A single technological approach failed to study urban and rural issues scientifically. Traditional evaluation methods were unable to fully reflect the interval differences between the measurement values. For example, the analytic hierarchy (AHP) method didn’t explain regional factors and internal relationships among factors. Results were obtained by calculating the score of urban–rural factors and their weights given by experts, which had certain subjectivity and fuzziness. However, due to the differences of the research objects, a single technical method was not applicable to all scenarios, and even led to misleading results, and it was difficult to accurately determine the true level of development of urban and rural planning.
- (3)
- The research dimension was too single. Research levels were diverse, but most were limited to a certain dimension, such as unbalanced education development, urban–rural integral development, or the level of the economic gap. This is especially evident for results presented as a static evaluation, which reflected the overall urban–rural situation at a certain point of time or in a period of time, while dynamic studies were few. Consequently, it was difficult to judge the level and trend of overall urban–rural development.
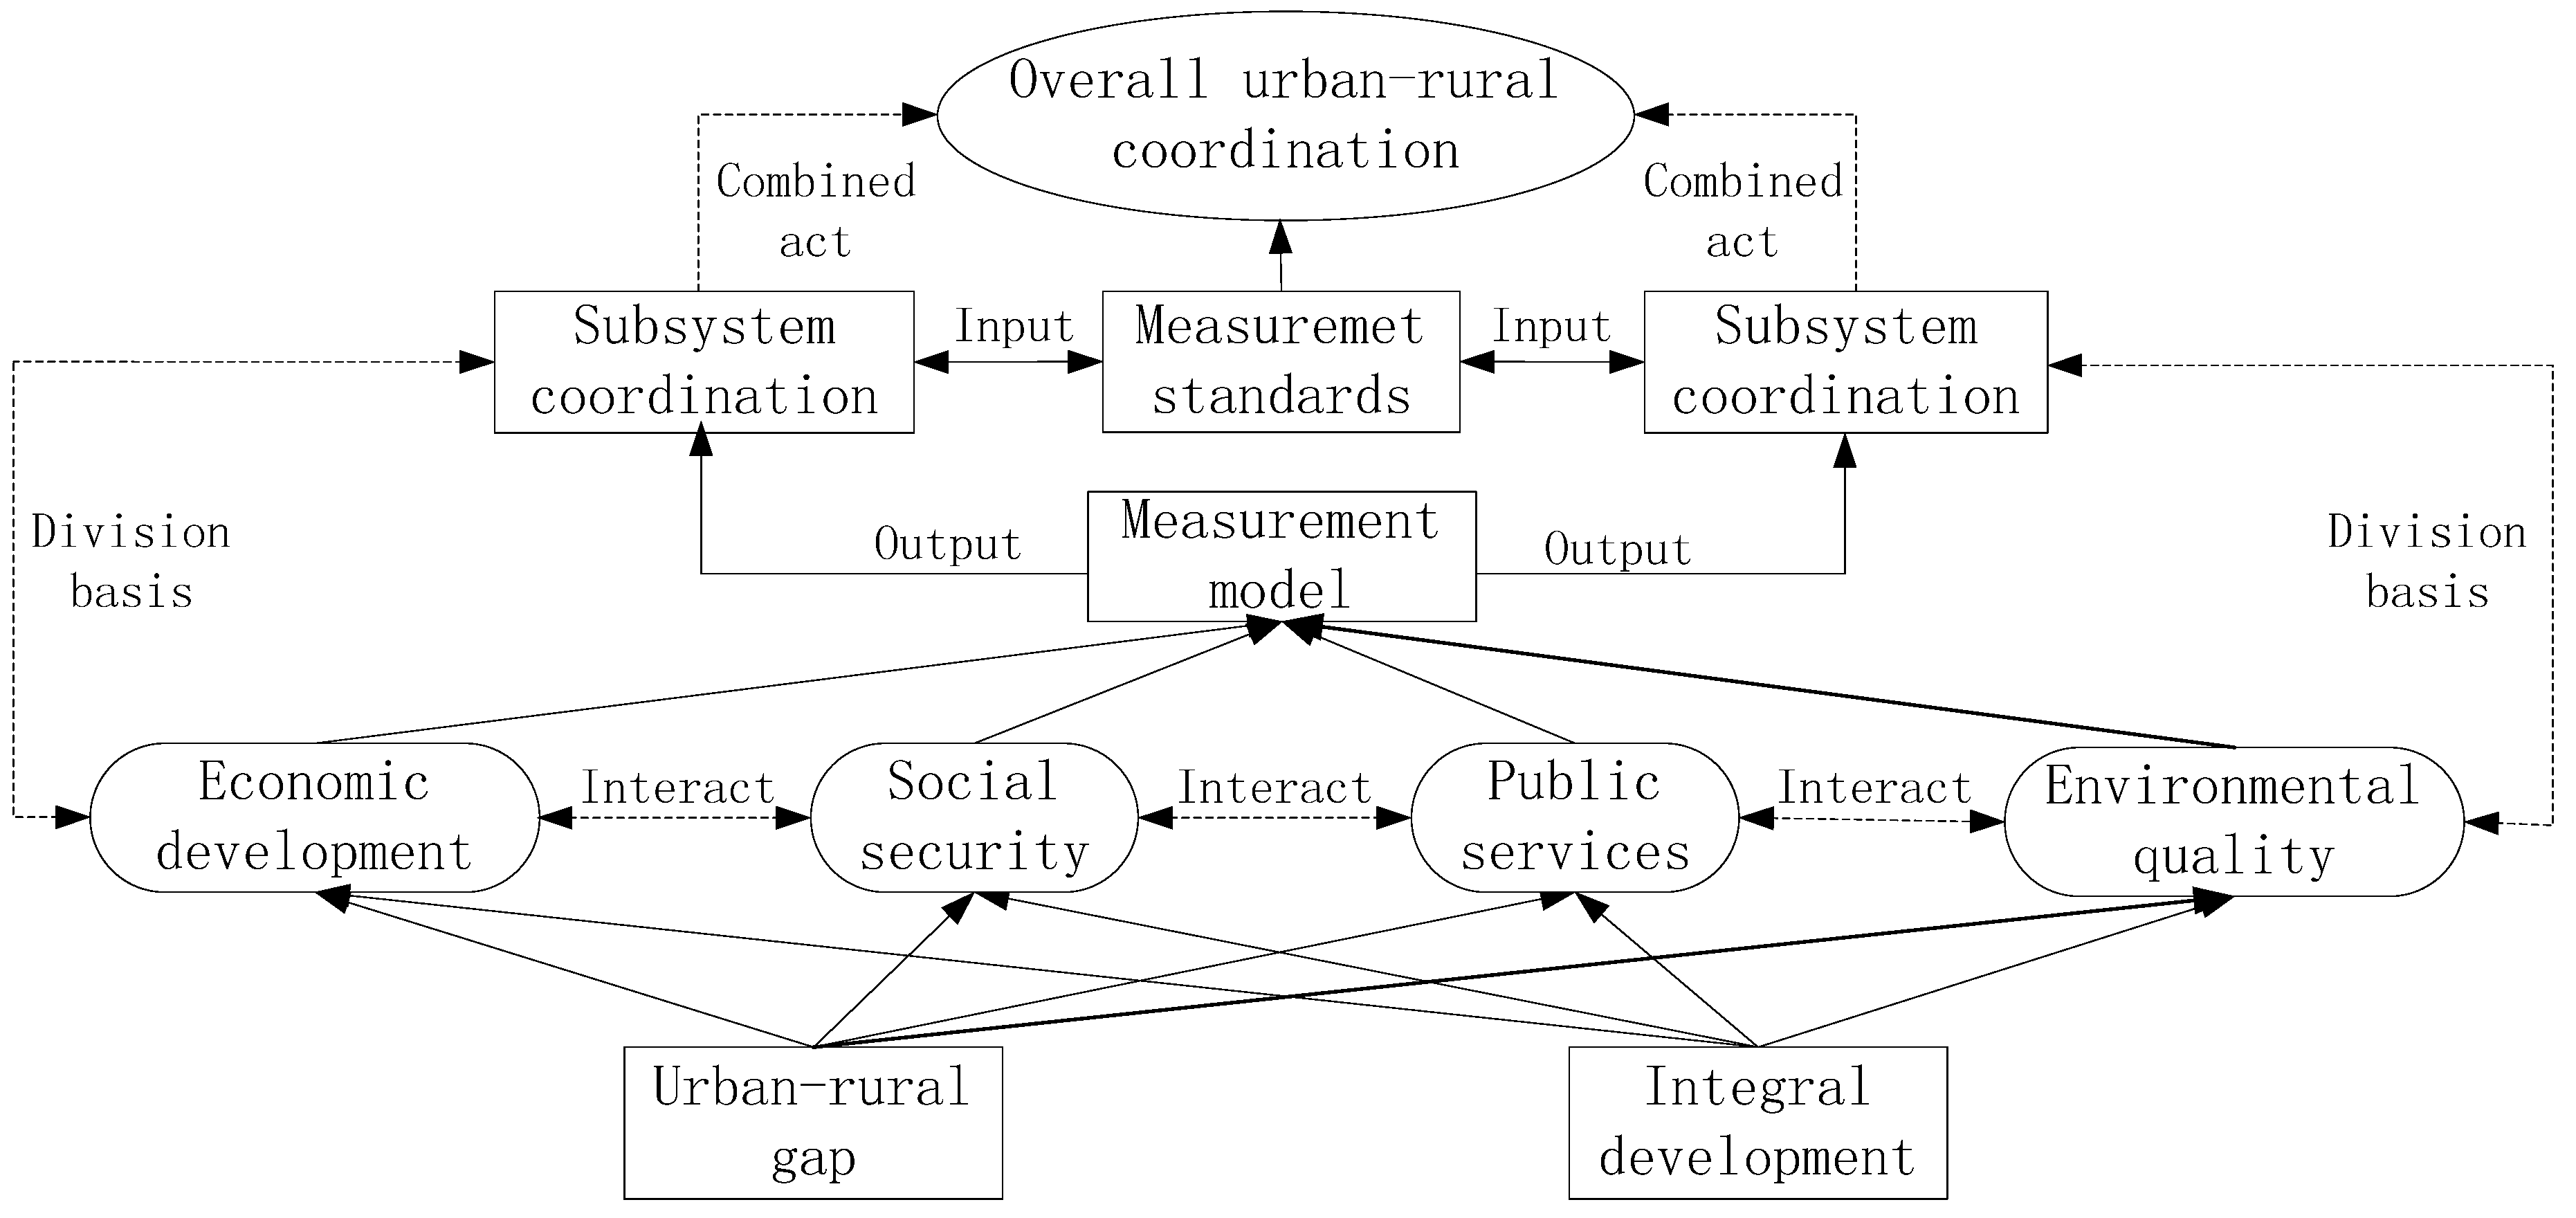
- (1)
- Classify indicators from dimensions, urban–rural gap, and integral development. Urban–rural gap refers to the gap between rural residents and urban residents in income level, education level, public services, and other aspects, reflecting the inequality between urban and rural areas. Integral development responds to the overall development situation of the region, including urban and rural areas at the same time. Overall urban–rural development aims to reduce the gap between urban and rural areas and achieve the coordinated development of urban and rural areas. As the index system is large, accurately distinguishing the corresponding indicators for integral development to narrow the urban–rural gap is necessary to ensure that measurement results are scientific and rational.The same attribute ratios for both urban and rural areas were chosen as the key indicators to reflect the urban–rural gap; the urban–rural resident income difference coefficient, the primary industry to GDP ratio, and the agricultural production utility. Industrial added value, urbanization rate/speed of industrialization, and basic public services growth rate/urban population growth rate, (such per capita income, and integration indicators) were used to measure integral development. Two indicator system sets were selected, based on the above classification criteria.
- (2)
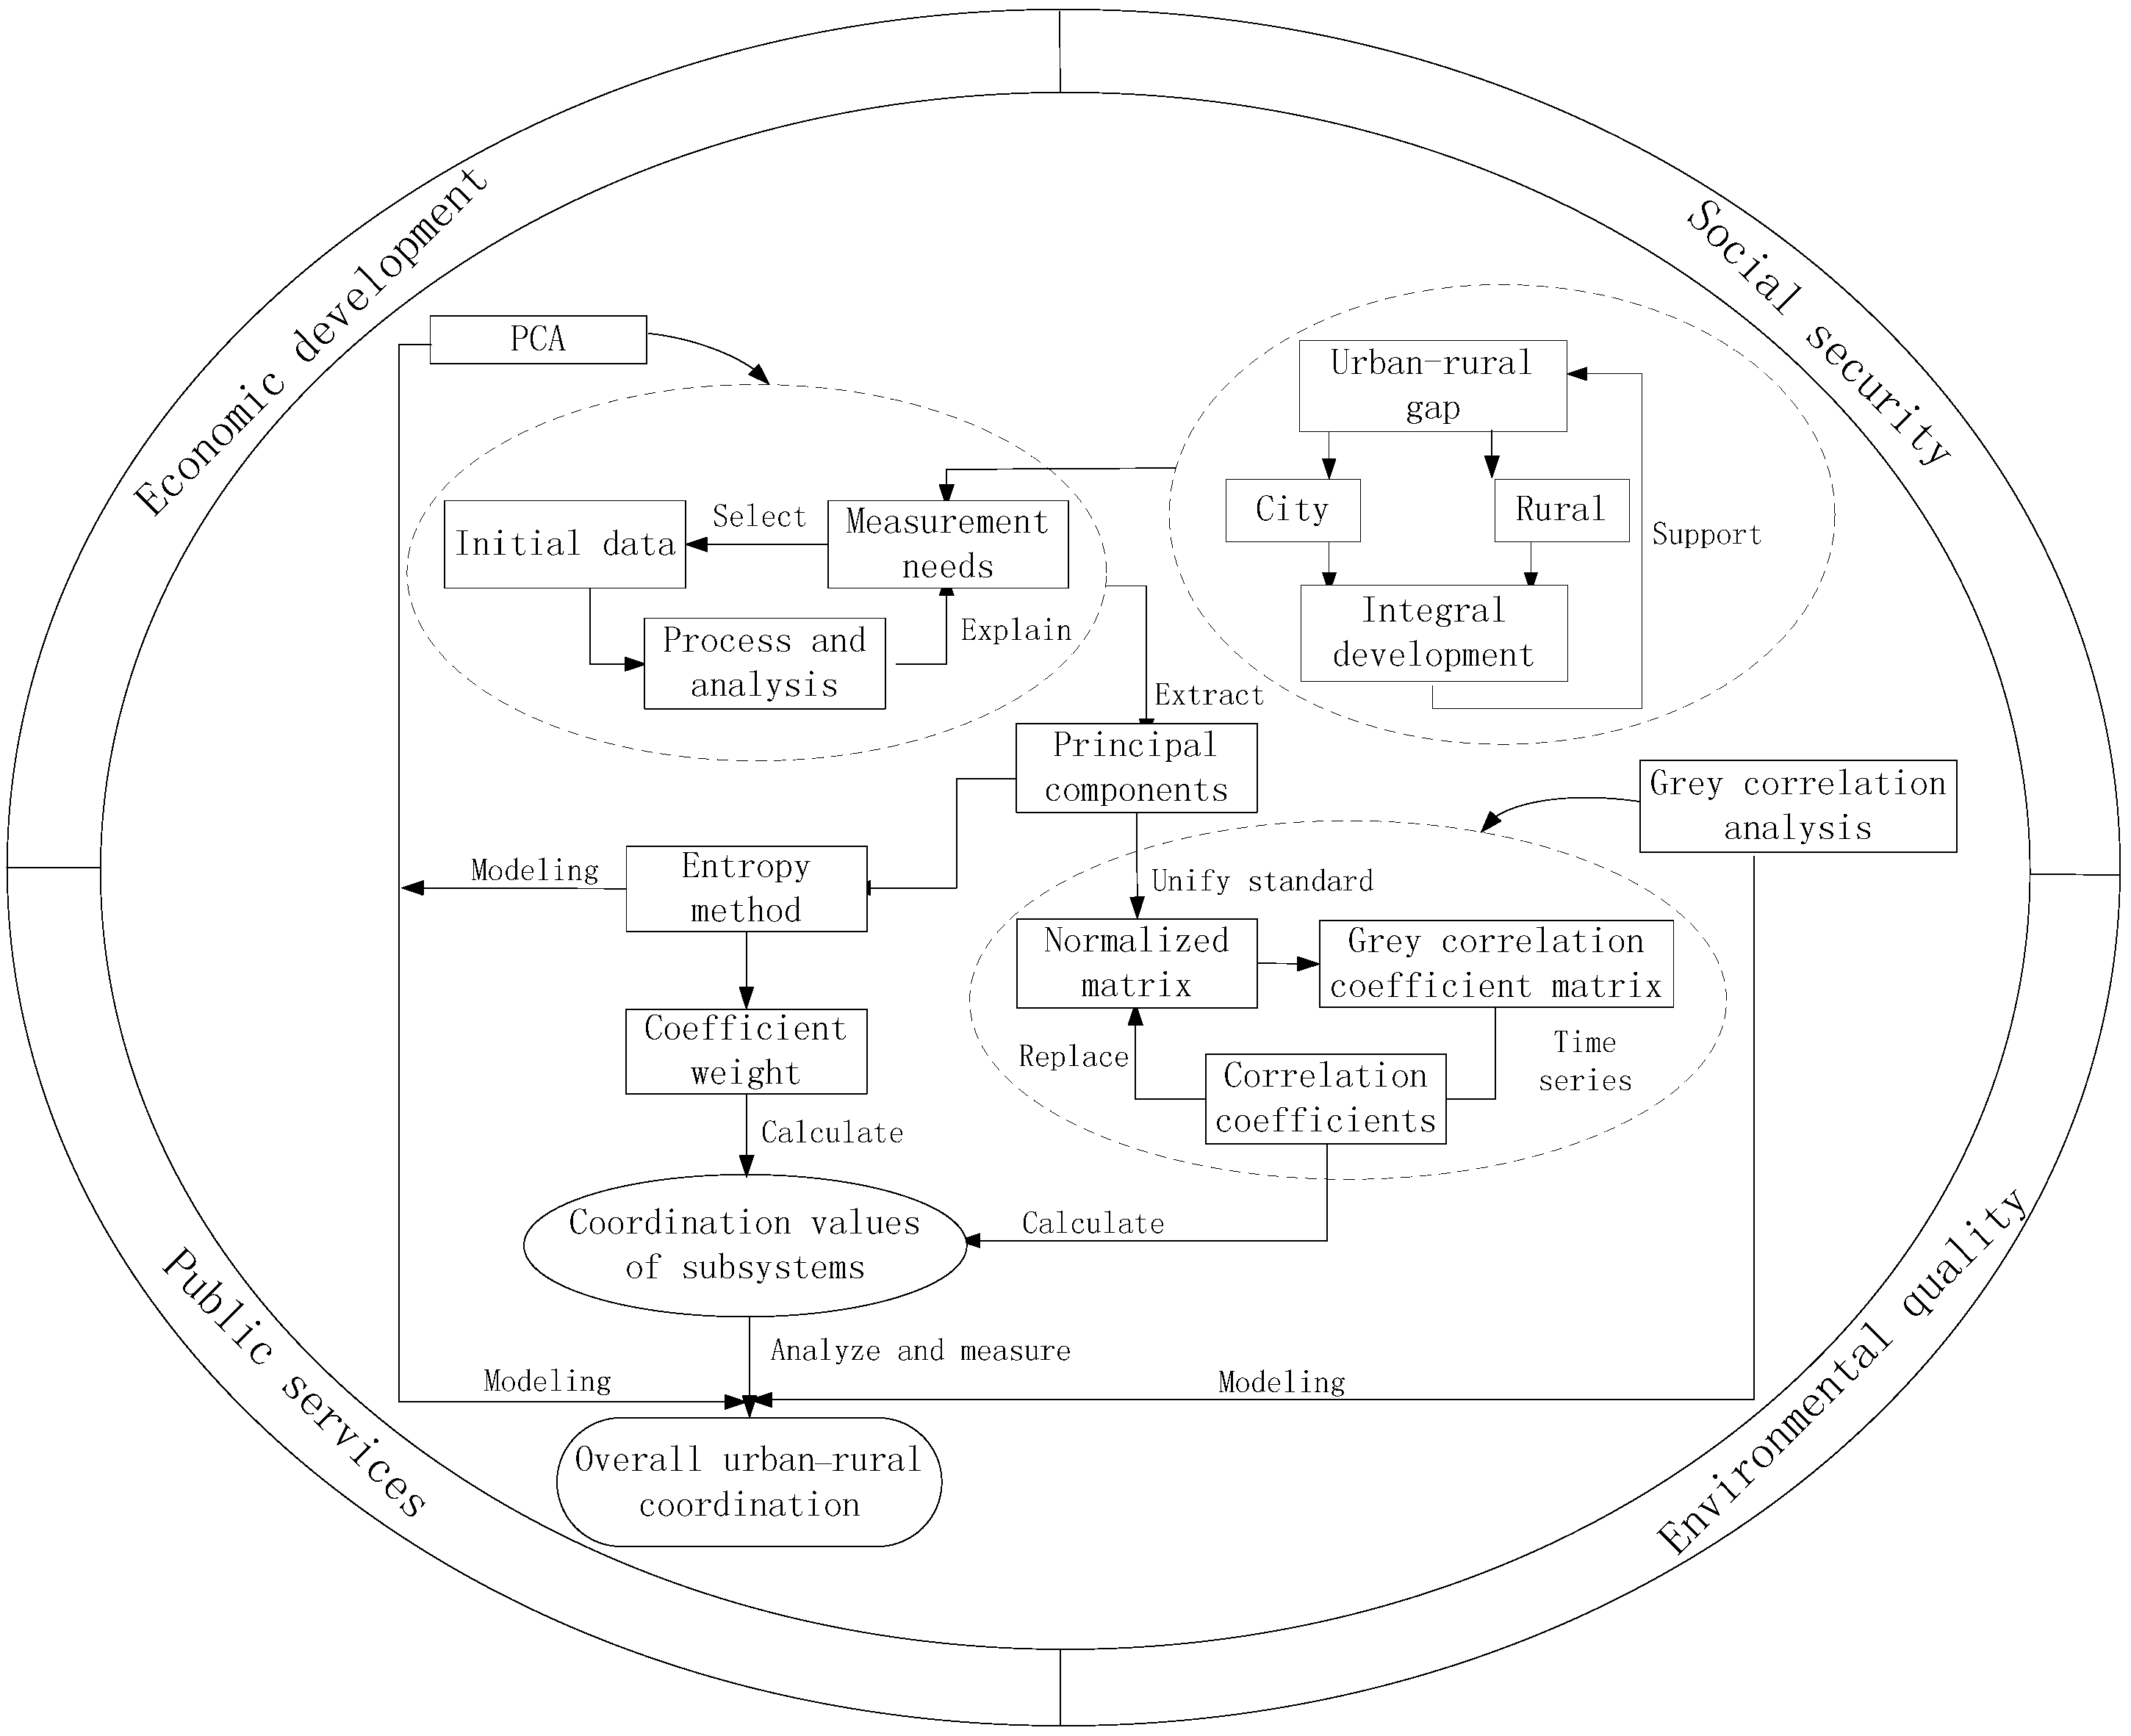
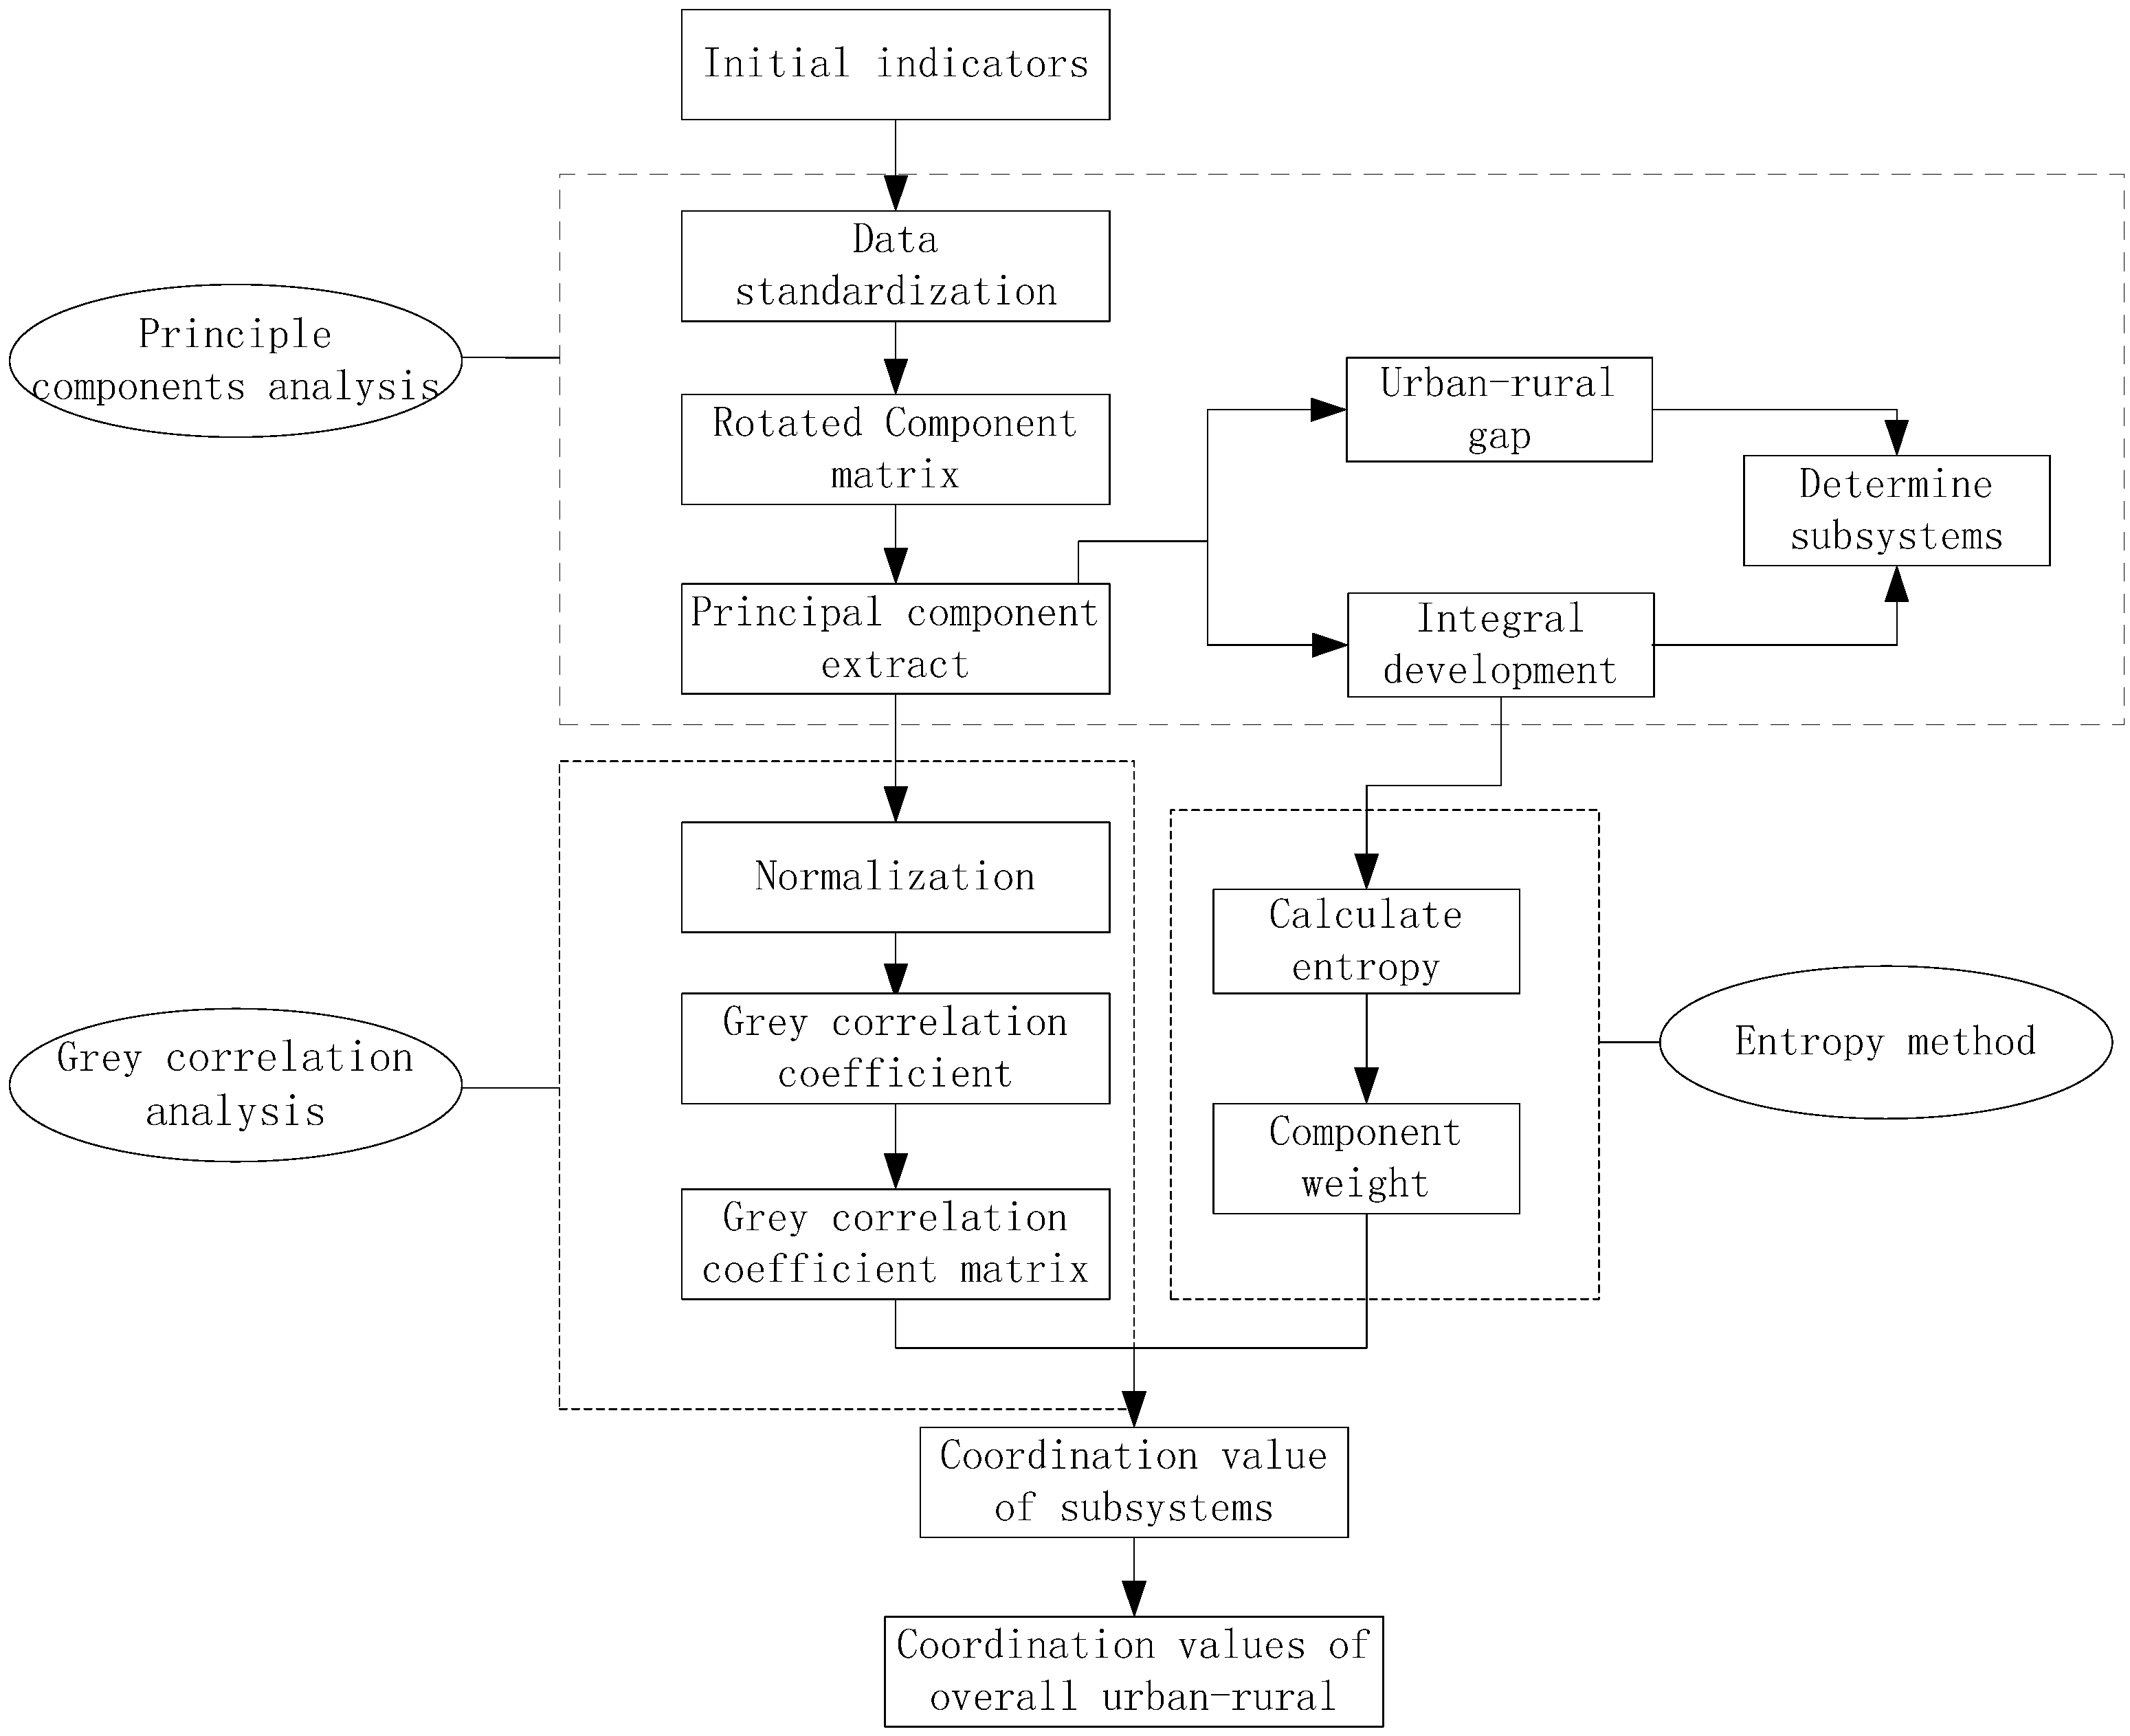
- Comprehensive technical methods were fit to study the scene to ensure the objectivity and impartiality of the research results. This paper proposed a principal component analysis (PCA)-Grey Entropy measurement model. First, PCA was used to extract the main components and the variable contribution rates from the urban–rural gap system and the integral development system. Then, these were processed using normalized standardization, after that, the model was used to calculate the grey correlation coefficients between the principal integral development system and urban–rural gap system components. A Grey correlation coefficient matrix was then constructed, and the entropy method was used to determine the weights for the principal components of integral development system. After multiplying the weights by the coefficients and summing these up, the single principal component coordination values were obtained. Finally, the overall coordination values in the system were determined by applying the mean method to process the data.
- (3)
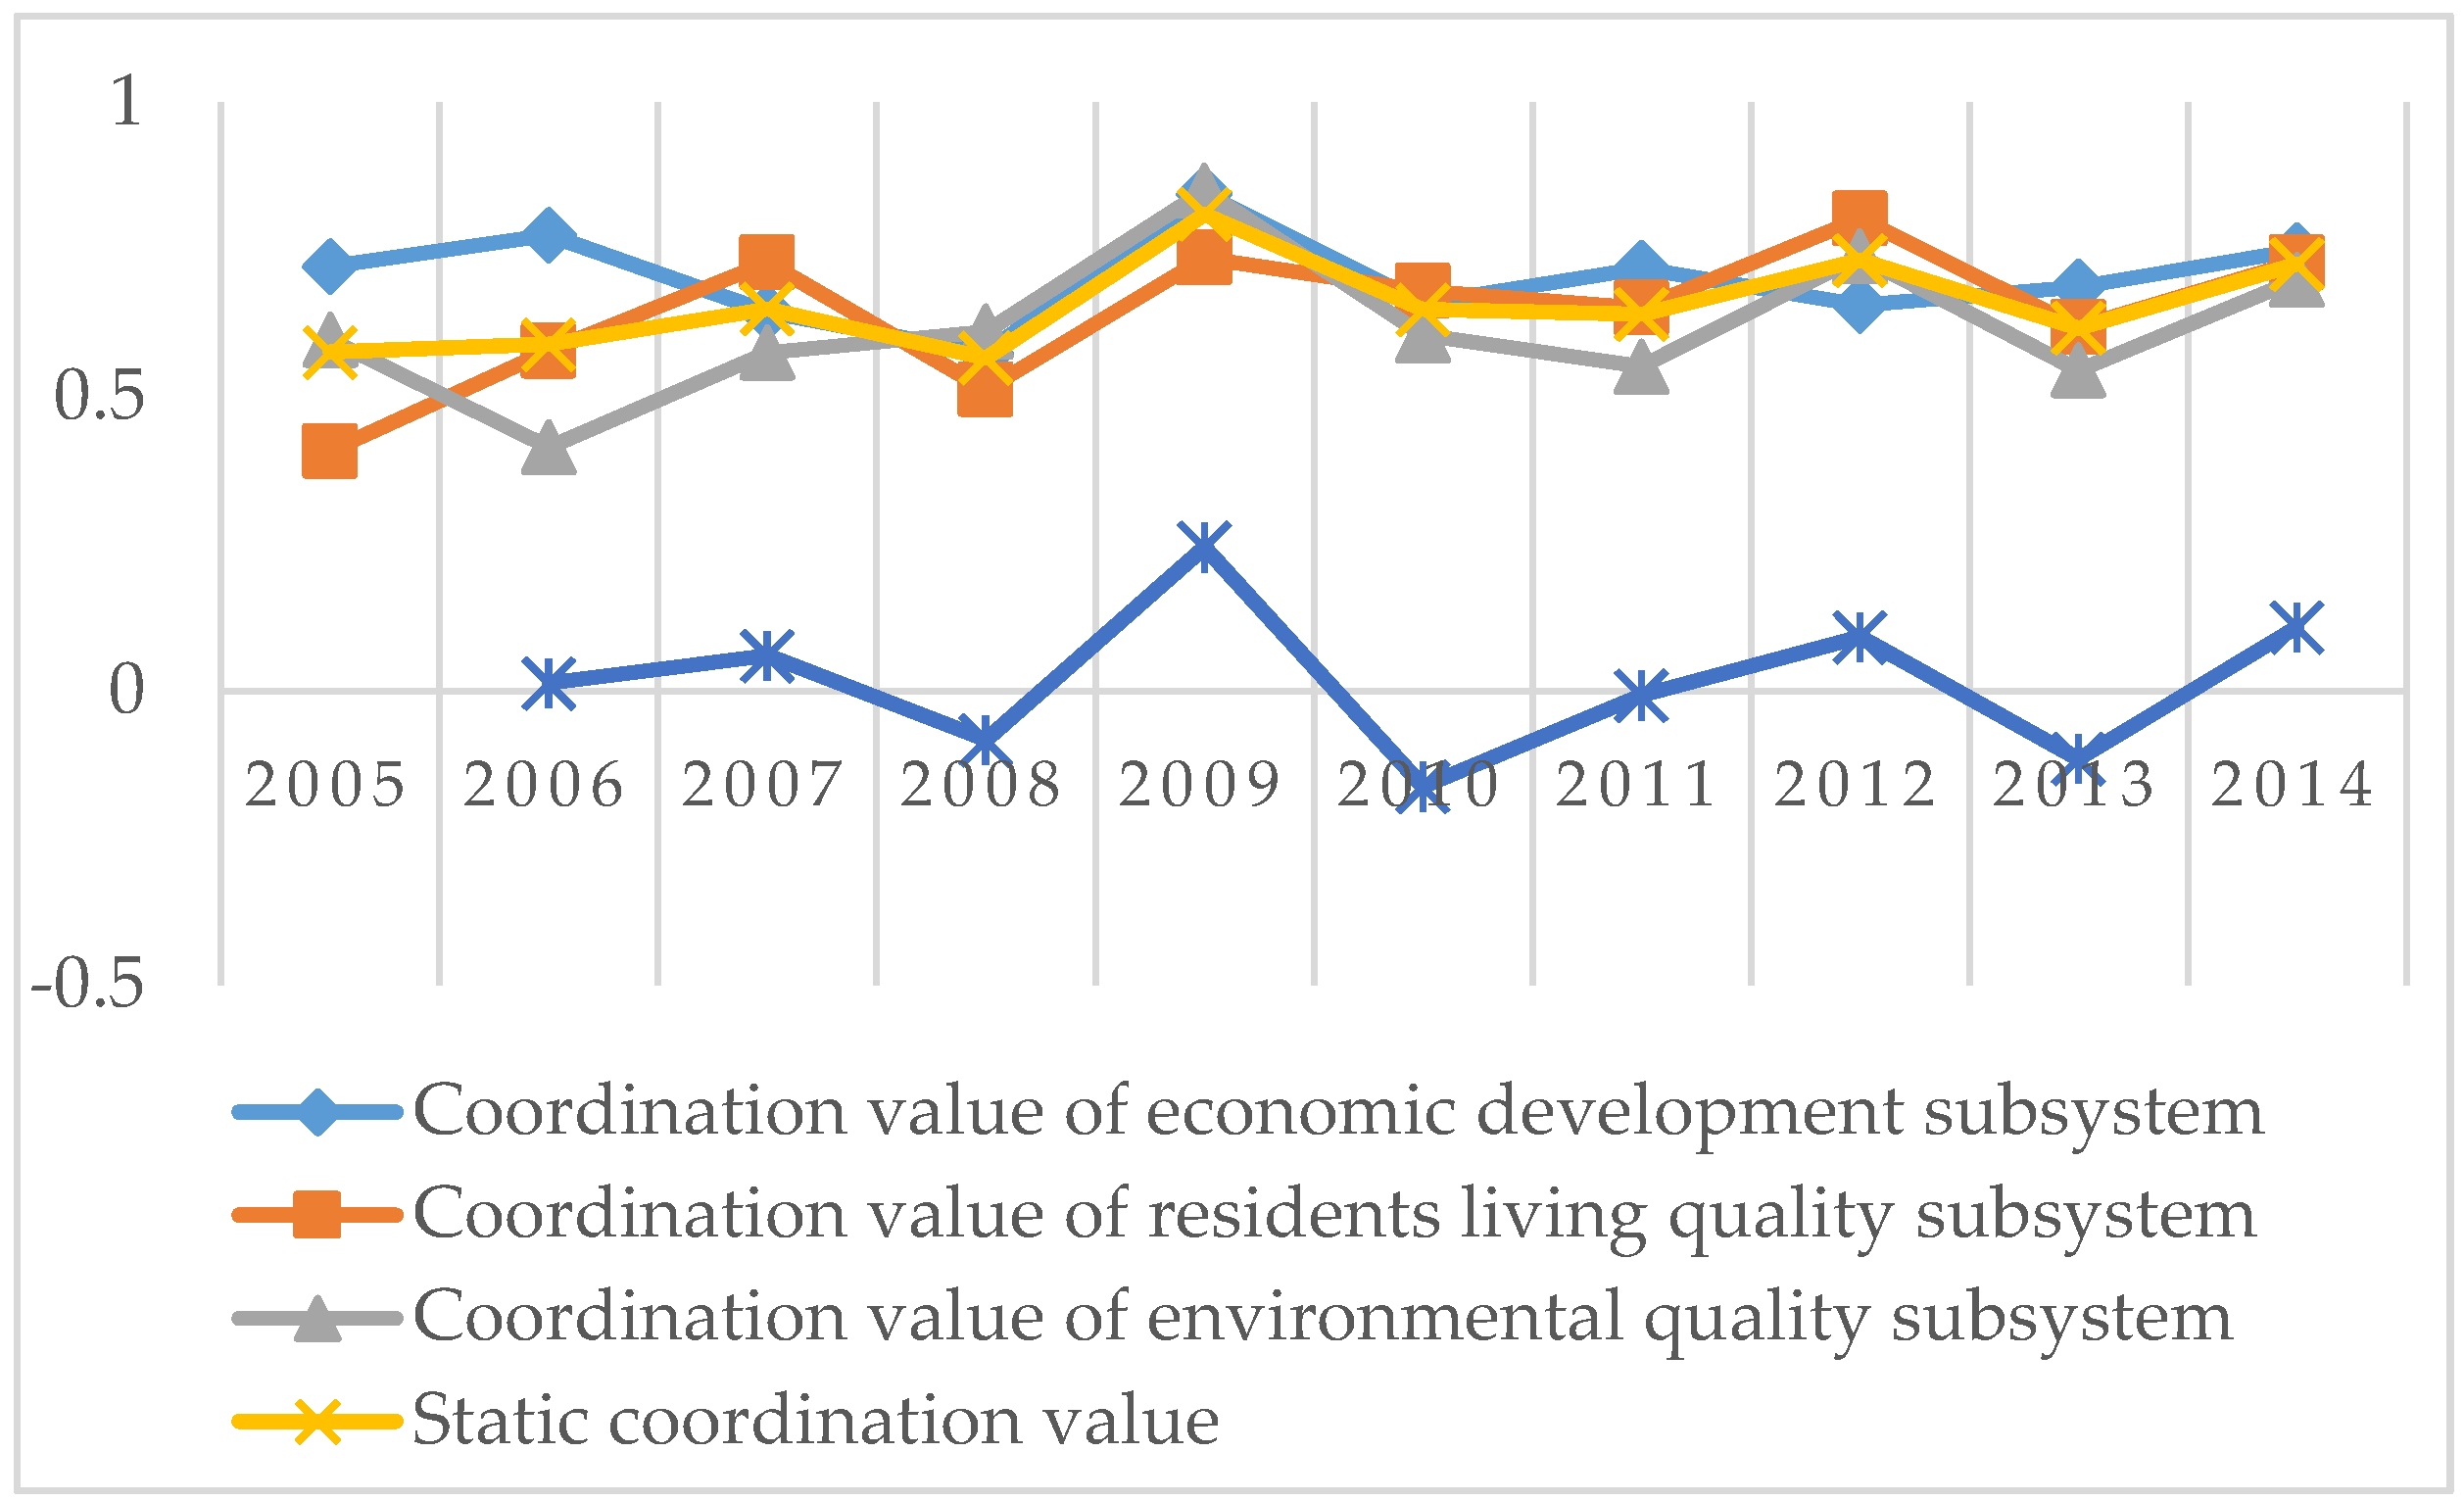
- Results of the research showed that the coordination degrees of the subsystems and the static and dynamic coordination degrees and demonstrated the overall urban–rural development and evolution law. The overall situation of urban–rural development and weaknesses were demonstrated. Each subsystem’s coordination degree reflects the coordinated development of urban and rural areas in relative economic development, social security, public services, and environmental quality. Resident quality of life subsystem and the environmental quality subsystem continued to fluctuate and developed slower than economic development, which resulted in a large environment maintenance cost. The static coordination degree reflects the development of overall urban–rural coordination, while the dynamic coordination degree represents the fluctuation range of overall coordination each year. The cyclical fluctuations of dynamic coordination degree mean the necessary consolidation of work.
3. Overall Urban–Rural Cooperation Model Analysis of Regional Sustainable Development
3.1. Overall Urban–Rural Dynamic Factor Analysis
3.2. Overall Urban–Rural Development Cooperation Model
4. Overall Urban–Rural Coordination Measurement Index System
5. Overall Urban–Rural Coordination Measurement Method
5.1. Measurement Model
5.2. Measurement Steps
- (1)
- Data preprocessing. First, the indicator properties were distinguished, and statistics with the same trends were dealt with. The inverse indexes and the moderate indexes were converted to positive indicators, allowing for comparability. Then, the mean value processing was used to eliminate the differences in the dimensions and magnitudes. The conversion functions used were as follows:
- (2)
- Determine the principal components sum matrices, and . PCA was employed to extract the main indicators affecting the coordination of overall urban–rural development, after which the characteristic values, variance contribution rates, and cumulative variance contribution rates were identified. A cumulative variance contribution rate of more than 85% for the j-th component was determined to be main component. The PCA mathematical model was as follows:Formula (3) only reflects the value at a certain time point .
- (3)
- Build the grey correlation coefficient matrices . The principal components for urban–rural gap and for the integral development system were normalized, and the grey correlation coefficients between each group with were used as reference sequences, such as , and were calculated for each year.In the formula, is the distinguishing coefficient, the general value for which is 0.5.And is the number of principal components of the urban–rural gap system, while represents the number for the integral development system. Thus, the number of grey correlation coefficient matrices will be .
- (4)
- Calculate the coordinated value for the j-th subsystem. Entropy weights were determined, and correlation coefficients of matrix were multiplied by weight separately, after which they were summed.In the formula, is the principal component standardization matrix.
- (5)
- Determine the static and dynamic coordination values. The formulas used were as follows:After the calculations from the steps above, the final analysis results would be composed of , , and .
6. Case Analysis
7. Results Analysis
- (1)
- Overall static urban–rural coordination was steady. Before 2008, the subsystem values differed significantly. After 2008, the overall urban–rural coordination values ranged from 0.5 to 0.8, and followed the same trend as the subsystems, indicating that the region had emerged from a relatively uncoordinated situation. In June 2007, the Chengdu-Chongqing region was classified as an experimental urban–rural reform zone. Since that time, Sichuan province has focused on supporting a series of urban–rural projects, and the government has refocused their attention from economic development to social life and environmental construction, leading to an increase in these values in 2009. Agricultural support has been changed to focus more on resource sharing. The overall coordination value reached a peak of 0.7325 in 2012; however, due to national policy changes, the value declined marginally over the subsequent two years. Before 2007, large differences existed among the coordination values of three subsystems. Economic development subsystem coordination value was the highest, followed by living quality and the environmental quality, which reflected the previous emphasis on economic development and the neglect of the environment. Excessive economic development had consumed environmental resources. Both of them restrict and stimulate each other [82].
- (2)
- The economic development subsystem was basically coordinated. Compared with other subsystems, more attention had been paid to the economy. From the minimum value in 2008, the economic development subsystem coordination values have fluctuated between 0.6 and 0.84.The government has attached great importance to the regional economy, rural labor transfers, and the development of township enterprises, which has led to basically coordinated economic development in Sichuan province. While the urban–rural income ratio dropped from 3.11 to 2.76, the income gap was still large, but there was an obvious shrinking trend; however, the ratio did not influence the fluctuations in the economic development coordination subsystem.
- (3)
- The resident quality of life subsystem and the environmental quality subsystem continued to fluctuate. The resident quality of life subsystem implies a basic livelihood and public service provision guarantee. However, as can be seen, the value was only 0.4083 in 2005, and the system was on the verge of being seriously uncoordinated, indicating that the quality of life was low and there was a lack of rural infrastructure. By 2012, the value had risen significantly to 0.8028; however, the actual rural medical insurance reimbursement rate was low, and the public service and social security systems needed to be improved. The environmental quality subsystem was mildly to moderately uncoordinated, which improved to mildly coordinated in 2014, and was the most volatile subsystem. Agricultural and non-agricultural production can both cause environmental pollution, so if agricultural production efficiency is less than the environmental pollution effectiveness, the urban–rural gap could enlarge, and urban–rural coordination would decline. With mature pollution treatment technologies, regional industrial structures can influence the utility of the agricultural and non-agricultural production, causing large fluctuations in coordination in the environmental quality subsystem. As economic strategies in China and globally constantly change, the internal subsystems are becoming increasingly complex. It is necessary to improve the quality of life of the residents and to ensure environmental protection requirements. The government should pay attention to coordinating development to enhance quality of life investments and take environmental protection measures to ensure the future sustainable development of the regional economy. Therefore, industrial development needs to focus on green production and strengthening environmental governance.
- (4)
- The overall dynamic of urban–rural coordination had cyclical fluctuations. From Figure 5, it can be seen that the dynamic coordination annual fluctuation value remained static at 0.1, indicating that urban–rural coordination development was unstable and had poor ineffective feedback. Although the overall urban–rural development so far has improved the urban–rural coordination, the varying focus on different urban–rural development factors has led to large fluctuations. The Sichuan provincial government needs to analyze the weaknesses in their work plans and continue to strengthen their top-level systems design. As stable overall urban–rural development and sustainable economic and social development are required, there needs to be a focus on long-term urban and rural development convergence.
- (5)
- Large space of overall urban–rural development. The analysis results from the various subsystems showed that Sichuan Province has maintained a basically coordinated economic development. With the activation of the 13th Five Year Plan and the attention on the Three Rural Issues, as the economic center of the southwest, Sichuan Province still has room for development. The guiding principles of the 13th Five Year Plan, including balance in promoting economic development, political construction, cultural construction, social construction, ecological civilization construction, and Party building need to be considered to ensure that the well-off society is built on schedule. Agricultural modernization shall have significant progress made in people’s living standards, and quality of life shall have been improved generally. The rural poor population in China under the current standard and in poor counties shall have been lifted out of poverty. Regional overall poverty will have been solved. Therefore, the rural areas as the focus of government work to achieve modernization and reduce poverty. Overall urban–rural development will remain as an important strategy, combined with targeted poverty alleviation, to achieve a better development of urban and rural areas.
8. Conclusions
- (1)
- Coordination research can scientifically reflect the systematic characteristics of overall urban–rural systems scientifically. The coordination value of the urban–rural gap and integral development is the evaluation criteria of overall urban–rural work, rather than measuring the urban–rural gap or integral development alone. The higher coordination degree means the pace of narrowing the gap and integral development in urban and rural areas tends to be consistent, and the overall urban–rural coordination has reached a high level.
- (2)
- Comprehensive method can scientifically obtain data results. Based on the PCA dimension reduction principle, the large and cumbersome index system is replaced with a few principal components to explain the information, thus simplifying the calculation and reducing the interference of irrelevant information. The urban–rural gap and integral development PCA-Grey Entropy measurement model includes subsystem measurements and data analyses, meaning that the various subsystem and overall urban–rural coordination measurement results are more objective.
- (3)
- The situation of overall urban–rural development is comprehensively reflected from multi-dimensional perspectives, including subsystems, static and dynamic aspects, and provides evaluation ideas for development work. When we are addressing urban and rural issues, in addition to the overall situation, the internal structure and the dynamic changes should also be analyzed. It helps to grasp the study area in order to carry out the distribution of work in economic, public service, environmental protection and so on. The changes from the coordination subsystems can reflect which section of the overall urban–rural development is relatively weak, and, combined with the regional background, well-directed suggestions for future development planning can be put forward.
Acknowledgments
Author Contributions
Conflicts of Interest
References
- Tolbert, C.; Horan, P.M.; Beck, E.M. The structure of economic segmentation: A dual economy approach. Am. J. Sociol. 1980, 85, 1095–1116. [Google Scholar] [CrossRef]
- Baade, P.D.; Youlden, D.R.; Coory, M.D. Urban–rural differences in prostate cancer outcomes in Australia: What has changed? Med. J. Aust. 2011, 194, 293–296. [Google Scholar] [PubMed]
- Cole, A.M.; Jackson, J.E.; Doescher, M. Urban–rural disparities in colorectal cancer screening: Cross-sectional analysis of 1998–2005 data from the Centers for Disease Control’s Behavioral Risk Factor Surveillance Study. Cancer Med. 2012, 1, 350–356. [Google Scholar] [CrossRef] [PubMed]
- Tran, T.K.; Nguyen, C.T.K.; Nguyen, H.D. Urban–rural disparities in antenatal care utilization: A study of two cohorts of pregnant women in Vietnam. BMC Health Serv. Res. 2011, 11, 120. [Google Scholar] [CrossRef] [PubMed]
- Hu, Z.C.; Wang, Y.Z. Spatio-temporal patterns of urban–rural development and transformation in east of the “Hu Huanyong Line”, China. ISPRS Int. J. Geo-Inf. 2016, 5, 24. [Google Scholar] [CrossRef]
- Ann, T.W.; Wu, Y. The key causes of urban–rural conflict in China. Habitat Int. 2015, 49, 65–73. [Google Scholar]
- Pain, A. Middle India and urban–rural development: Four decades of change. J. South Asian Dev. 2016, 11, 141–144. [Google Scholar] [CrossRef]
- Liu, Y.; Lu, S.; Chen, Y. Spatio-temporal change of urban–rural equalized development patterns in China and its driving factors. J. Rural Stud. 2013, 32, 320–330. (In Chinese) [Google Scholar] [CrossRef]
- Liu, J.M.; Lv, B. Characteristics of change in integrated rural–urban development: A case study of Sichuan province and Chongqing municipality. Prog. Geogr. 2015, 34, 1266–1274. (In Chinese) [Google Scholar]
- Su, C.W.; Liu, T.Y. Is urbanization narrowing the urban–rural income gap? A cross-regional study of China. Habitat Int. 2015, 48, 79–86. (In Chinese) [Google Scholar] [CrossRef]
- Shi, Z. Urban and rural overall development level measurement based on sorting selection model. Stat. Decis. 2015, 8, 41–44. (In Chinese) [Google Scholar]
- Zhang, S.F. Co-integration analysis between industrial structure and urban–rural development in Shandong province. Stat. Decis. 2015, 23, 148–150. (In Chinese) [Google Scholar]
- Zhou, L.Y.; Wang, M.Y. Method research on promoting urban–rural development by industry. Econ. Rev. 2014, 12, 89–92. (In Chinese) [Google Scholar]
- Binelli, C.; Loveless, M. The urban–rural divide: Perceptions of income and social inequality in Central and Eastern Europe. Econ. Transit. 2016, 24, 211–231. [Google Scholar] [CrossRef]
- Wang, S.J.; Bai, Y.X. Transformation trend and influence factors of China’s dual economy: Measure and analysis based on industrial-spatial division. China Soft Sci. 2013, 8, 92–103. (In Chinese) [Google Scholar]
- Fertner, C. The emergence and consolidation of the urban–rural region: Migration patterns around Copenhagen 1986–2011. Tijdschr. Econ. Soc. Geogr. 2013, 104, 322–337. [Google Scholar] [CrossRef]
- Zamfir, D.; Pascariu, G.; Talanga, C. Sustainable development of the urban–rural interface of Bucharest city. In Proceedings of the 12th International Multidisciplinary Scientific Geo Conference SGEM 2012, Albena, Bulgaria, 17–23 June 2012.
- Jong-Sup, K. An empirical analysis on the impact of social development expenditure in urban–rural integration city: Focusing on the Gangwon province. J. Soc. Sci. 2014, 53, 85–122. [Google Scholar]
- Zhao, J.L.; Yu, X.J. An empirical study on relationship between financial development and urban–rural income gap. Tax. Econ. 2013, 4, 11. (In Chinese) [Google Scholar]
- Berdegué, J.A.; Carriazo, F. Cities, territories, and inclusive growth: Unraveling urban–rural linkages in Chile, Colombia, and Mexico. World Dev. 2015, 73, 56–71. [Google Scholar] [CrossRef]
- Van, L.E. Urban–rural Synergies: An explorative study at the NUTS3 Level. Appl. Spat. Anal. Policy. 2015, 8, 273–289. [Google Scholar]
- Xu, J.X.; Zheng, Y.F. Public employment services of urban and rural gap measurement and cause analysis in Fujian province. Southeast Acad. Res. 2013, 1, 97–104. (In Chinese) [Google Scholar]
- Yuan, T.; Qiu, Y.L. Experience and enlightenment of urban and rural areas in China medical insurance. Soc. Secur. Stud. 2016, 1, 55–60. (In Chinese) [Google Scholar]
- Liao, J.; Xiong, H. Access to maternal care among urban, rural non-minority, andrural minority populations in Sichuan: A study based on three cross-sectional surveys of national health service. Lancet 2015, 386, S73. (In Chinese) [Google Scholar] [CrossRef]
- Amini, C.; Nivorozhkin, E. The urban–rural divide in educational outcomes: Evidence from Russia. Int. J. Educ. Dev. 2015, 44, 118–133. [Google Scholar] [CrossRef]
- Yan, D. Empirical analysis on relationship between FDI and urban–rural income gap under context of urban–rural coordinating development: Based on data of Guangdong province. Technol. Econ. 2015, 34, 58–62. (In Chinese) [Google Scholar]
- Gu, H.B.; Zhang, S.T. Method and evaluation of urban–rural social security evenness degree of China. Finance Trade Econ. 2012, 11, 37–47. (In Chinese) [Google Scholar]
- Mushtaq, M.U.; Shahid, U.; Abdullah, H.M. Urban–rural inequities in knowledge, attitudes and practices regarding tuberculosis in two districts of Pakistan’s Punjab province. Int. J. Equity Health. 2011, 10, 1. [Google Scholar] [CrossRef] [PubMed]
- Singh, P.K. Trends in child immunization across geographical regions in India: Focus on urban–rural and gender differentials. PLoS ONE 2013, 8, e73102. [Google Scholar] [CrossRef] [PubMed]
- Zeng, W.J. An analysis of the utility gap between urban and rural residents based on the Core-Periphery model. Areal Res. Dev. 2013, 32, 22–26. (In Chinese) [Google Scholar]
- Sofer, M.; Applebaum, L. The rural space in Israel in search of renewed identity: The case of the Moshav. J. Rural Stud. 2006, 22, 323–336. [Google Scholar] [CrossRef]
- Angelescu, C.; Stanef, M.R.; Chenic, A.S. Reducing urban–rural economic gaps and the labor market integration of the rural population: Case study Romania. In Proceedings of the 17th International-Business-Information-Management-Association Conference, Milan, Italy, 14–15 November 2011; pp. 689–699.
- Clarke, C.; Yu, L.; Yu, C. How far can we go in ensuring equality of access to public library services? The re-visitation of a core professional value in the context of regional and urban–rural inequalities in China. Libri 2011, 61, 23–36. (In Chinese) [Google Scholar] [CrossRef]
- Ding, Z.W.; Zhang, G.S. State evaluation and promoting proposal of urban–rural integrated development in Henan province. Areal Res. Dev. 2016, 35, 41–46. (In Chinese) [Google Scholar]
- Li, X.J. Based on method of the coordination degree of comprehensive evaluation on urban and rural harmonious development in Hebei province. Hubei Agric. Sci. 2016, 55, 1351–1360. (In Chinese) [Google Scholar]
- Sun, J.S.; Wang, Q.Z. The suitability measurement of urban–rural income gap–A case study in Zhejiang province. J. Agrotech. 2012, 8, 72–80. (In Chinese) [Google Scholar]
- Ding, J.L.; Liu, G.Y. The research of rural land circulation, labor transfer and coupling coordination degree of urbanization–Based on the perspective of integration of urban and rural development. Chin. J. Agric. Resour. Reg. Plan. 2016, 2, 5. (In Chinese) [Google Scholar]
- Cao, W.; Zhou, S.L. Design and application of the integrated measure indicator system on urban–rural land smart use. Resour. Environ. Yangtze Basin. 2013, 22, 1–7. (In Chinese) [Google Scholar]
- Afrakhteh, R.; Asgarian, A.; Sakieh, Y. Evaluating the strategy of integrated urban–rural planning system and analyzing its effects on land surface temperature in a rapidly developing region. Habitat Int. 2016, 56, 147–156. [Google Scholar] [CrossRef]
- Wang, Y.; Bai, Y.X. Present situation of the integration of urban and rural development level measurement and method of improvement. Stat. Decis. 2015, 2, 91–93. (In Chinese) [Google Scholar]
- Chen, X.F.; Yao, S.M. The theory and practice of urban–rural integration in China under the new urbanization. Sci. Geogr. Sin. 2016, 36, 188–195. (In Chinese) [Google Scholar]
- Kasarda, J.D.; Crenshaw, E.M. Third world urbanization: Dimensions, theories, and determinants. Annu. Rev. Sociol. 1991, 17, 467–501. [Google Scholar] [CrossRef] [PubMed]
- Easterlin, R.A.; Angelescu, L.; Zweig, J.S. The impact of modern economic growth on urban–rural differences in subjective well-being. World Dev. 2011, 39, 2187–2198. [Google Scholar] [CrossRef]
- Zhou, J.Y.; Bai, Y.X. The Chinese provincial level of the integration of urban and rural development: Theory and measurement. Chin. Rural Econ. 2014, 6, 4. (In Chinese) [Google Scholar]
- Zhao, J.; Guo, H.X. Evaluation and spatial-temporal analysis of urban and rural development. Stat. Decis. 2015, 9, 102–105. (In Chinese) [Google Scholar]
- Sichuan Bureau of Statistics. Sichuan Statistical Yearbook 2006; China Statistics Press: Beijing, China, 2006. (In Chinese)
- Sichuan Bureau of Statistics. Sichuan Statistical Yearbook 2007; China Statistics Press: Beijing, China, 2007. (In Chinese)
- Sichuan Bureau of Statistics. Sichuan Statistical Yearbook 2008; China Statistics Press: Beijing, China, 2008. (In Chinese)
- Sichuan Bureau of Statistics. Sichuan Statistical Yearbook 2009; China Statistics Press: Beijing, China, 2009. (In Chinese)
- Sichuan Bureau of Statistics. Sichuan Statistical Yearbook 2010; China Statistics Press: Beijing, China, 2010. (In Chinese)
- Sichuan Bureau of Statistics. Sichuan Statistical Yearbook 2011; China Statistics Press: Beijing, China, 2011. (In Chinese)
- Sichuan Bureau of Statistics. Sichuan Statistical Yearbook 2012; China Statistics Press: Beijing, China, 2012. (In Chinese)
- Sichuan Bureau of Statistics. Sichuan Statistical Yearbook 2013; China Statistics Press: Beijing, China, 2013. (In Chinese)
- Sichuan Bureau of Statistics. Sichuan Statistical Yearbook 2014; China Statistics Press: Beijing, China, 2014. (In Chinese)
- Sichuan Bureau of Statistics. Sichuan Statistical Yearbook 2015; China Statistics Press: Beijing, China, 2015. (In Chinese)
- Sichuan Government. Sichuan Rural Yearbook; University of Electronic Science and Technology Press: Sichuan, China, 2006. (In Chinese)
- Sichuan Government. Sichuan Rural Yearbook; University of Electronic Science and Technology Press: Sichuan, China, 2007. (In Chinese)
- Sichuan Government. Sichuan Rural Yearbook; University of Electronic Science and Technology Press: Sichuan, China, 2008. (In Chinese)
- Sichuan Government. Sichuan Rural Yearbook; University of Electronic Science and Technology Press: Sichuan, China, 2009. (In Chinese)
- Sichuan Government. Sichuan Rural Yearbook; University of Electronic Science and Technology Press: Sichuan, China, 2010. (In Chinese)
- Sichuan Government. Sichuan Rural Yearbook; University of Electronic Science and Technology Press: Sichuan, China, 2011. (In Chinese)
- Sichuan Government. Sichuan Rural Yearbook; University of Electronic Science and Technology Press: Sichuan, China, 2012. (In Chinese)
- Sichuan Government. Sichuan Rural Yearbook; University of Electronic Science and Technology Press: Sichuan, China, 2013. (In Chinese)
- Sichuan Government. Sichuan Rural Yearbook; University of Electronic Science and Technology Press: Sichuan, China, 2014. (In Chinese)
- Department of Population and Employment Statistics National Bureau of Statistics of China. China Population & Employment Statistics Yearbook; China Statistics Press: Beijing, China, 2006. (In Chinese)
- Department of Population and Employment Statistics National Bureau of Statistics of China. China Population & Employment Statistics Yearbook; China Statistics Press: Beijing, China, 2007. (In Chinese)
- Department of Population and Employment Statistics National Bureau of Statistics of China. China Population & Employment Statistics Yearbook; China Statistics Press: Beijing, China, 2008. (In Chinese)
- Department of Population and Employment Statistics National Bureau of Statistics of China. China Population & Employment Statistics Yearbook; China Statistics Press: Beijing, China, 2009. (In Chinese)
- Department of Population and Employment Statistics National Bureau of Statistics of China. China Population & Employment Statistics Yearbook; China Statistics Press: Beijing, China, 2010. (In Chinese)
- Department of Population and Employment Statistics National Bureau of Statistics of China. China Population & Employment Statistics Yearbook; China Statistics Press: Beijing, China, 2011. (In Chinese)
- Department of Population and Employment Statistics National Bureau of Statistics of China. China Population & Employment Statistics Yearbook; China Statistics Press: Beijing, China, 2012. (In Chinese)
- Department of Population and Employment Statistics National Bureau of Statistics of China. China Population & Employment Statistics Yearbook; China Statistics Press: Beijing, China, 2013. (In Chinese)
- Department of Population and Employment Statistics National Bureau of Statistics of China. China Population & Employment Statistics Yearbook; China Statistics Press: Beijing, China, 2014. (In Chinese)
- The ministry of Health of the People’s Republic of China. China Health Statistics Yearbook 2006; Pecking Union Medical College Press: Beijing, China, 2006. (In Chinese)
- The ministry of Health of the People’s Republic of China. China Health Statistics Yearbook 2007; Pecking Union Medical College Press: Beijing, China, 2007. (In Chinese)
- The ministry of Health of the People’s Republic of China. China Health Statistics Yearbook 2008; Pecking Union Medical College Press: Beijing, China, 2008. (In Chinese)
- The ministry of Health of the People’s Republic of China. China Health Statistics Yearbook 2009; Pecking Union Medical College Press: Beijing, China, 2009. (In Chinese)
- The ministry of Health of the People’s Republic of China. China Health Statistics Yearbook 2010; Pecking Union Medical College Press: Beijing, China, 2010. (In Chinese)
- The ministry of Health of the People’s Republic of China. China Health Statistics Yearbook 2011; Pecking Union Medical College Press: Beijing, China, 2013. (In Chinese)
- The ministry of Health of the People’s Republic of China. China Health Statistics Yearbook 2012; Pecking Union Medical College Press: Beijing, China, 2013. (In Chinese)
- The ministry of Health of the People’s Republic of China. China Health Statistics Yearbook 2013; Pecking Union Medical College Press: Beijing, China, 2014. (In Chinese)
- Nagy, R.C.; Lockaby, B.G. Urbanization in the Southeastern United States: Socioeconomic forces and ecological responses along an urban–rural gradient. Urban Ecosyst. 2011, 14, 71–86. [Google Scholar] [CrossRef]


| Target Layer | First Level Indicators | Secondary Indicators | Tertiary Indicators |
|---|---|---|---|
| Overall urban–rural coordination | Urban–rural gap | Economic development A1 | Primary industry to GDP ratio A11 |
| Urban–rural Engle‘s coefficient ratio A12 | |||
| Agricultural mechanization level A13 | |||
| Per capita agricultural production utility A14 | |||
| Urban–rural residents income difference coefficient A15 | |||
| Ratio of agricultural and non-agricultural production efficiency A16 | |||
| Social security A2 | Rural deposit balance A21 | ||
| Ratio of urban–rural employed persons A22 | |||
| Ratio of urban–rural medical security benefits A23 | |||
| Ratio of per capita urban–rural consumption to expenditure A24 | |||
| Ratio of urban–rural residents under basic provision protection A25 | |||
| Public services A3 | Popularization rate of latrines A31 | ||
| Ratio of urban–rural telephone users A32 | |||
| Rural primary school cultural penetration A33 | |||
| Ratio of urban–rural basic medical expenses A34 | |||
| Rate of population which benefits from tap water A35 | |||
| Ratio of urban–rural entertainment consumption expenditure A36 | |||
| Decrease in cultivated land area/Increase in built-up district area A37 | |||
| Environmental quality A4 | Area of urban green built districts A41 | ||
| New sales for forest development in current year A42 | |||
| Green covered area as percentage of built districts A43 | |||
| Integral development | Economic development B1 | Per capita GDP B11 | |
| GDP growth ratio B12 | |||
| Industrial added value B13 | |||
| Total investment in fixed assets B14 | |||
| Urbanization rate/speed of industrialization B15 | |||
| Social security B2 | Unemployment rate in urban area B21 | ||
| Per capita total retail sales for consumer goods B22 | |||
| Special fund to support agriculture in finance ratio B23 | |||
| Expenditure for social safety net and employment effort B24 | |||
| Urbanization ratio B25 | |||
| Public services B3 | Doctors per 10,000 people B31 | ||
| Per 100 capita cultivated land area B32 | |||
| Full-time teachers per 10,000 students B33 | |||
| Public service expenditure to GDP ratio B34 | |||
| Per capital living floor space of rural residents B35 | |||
| Per capital living floor space of urban residents B36 | |||
| Basic public services growth /urban population growth rate B37 | |||
| Per capita business volume of post and telecommunication services B38 | |||
| Environmental quality B4 | Forest-coverage rateB41 | ||
| Per capita public green space B42 | |||
| Industrial pollution production utility B43 | |||
| Total investment in environmental pollution to GDP ratio B44 |
| Ingredients | Initial Eigenvalue | Extracting the Square and Load | ||||
|---|---|---|---|---|---|---|
| Total | Variance % | Cumulative % | Total | Variance % | Cumulative % | |
| 1 | 15.932 | 75.865 | 75.865 | 15.932 | 75.865 | 75.865 |
| 2 | 2.247 | 10.701 | 86.566 | 2.247 | 10.701 | 86.566 |
| 3 | 1.018 | 4.850 | 91.415 | 1.018 | 4.850 | 91.415 |
| 4 | 0.867 | 4.127 | 95.543 | |||
| L | L | L | L | |||
| 21 | −1.611 × 10⁻¹⁵ | −7.67 × 10⁻¹⁵ | 100.000 | |||
| Ingredients | Initial Eigenvalue | Extracting the Square and Load | ||||
|---|---|---|---|---|---|---|
| Total | Variance % | Cumulative % | Total | Variance % | Cumulative % | |
| 1 | 14.617 | 66.441 | 66.441 | 14.617 | 66.441 | 66.441 |
| 2 | 2.557 | 11.621 | 78.062 | 2.557 | 11.621 | 78.062 |
| 3 | 1.597 | 7.259 | 85.321 | 1.597 | 7.259 | 85.321 |
| 4 | 1.126 | 5.120 | 90.441 | 1.126 | 5.120 | 90.441 |
| 5 | 0.905 | 4.114 | 94.555 | |||
| L | L | L | L | |||
| 22 | −9.649 × 10⁻¹⁶ | −4.386 × 10⁻¹⁵ | 100.000 | |||
| Year | Urban–Rural Gap | Integral Development | |||||
|---|---|---|---|---|---|---|---|
| F1 | F2 | F3 | G1 | G2 | G3 | G4 | |
| 2005 | −1.06 | 1.99 | −1.56 | −1.26 | 0.26 | −1.20 | 0.18 |
| 2006 | −1.18 | 0.62 | 1.18 | −1.17 | −0.12 | −1.30 | −0.13 |
| 2007 | −1.08 | −0.51 | 0.95 | −0.94 | 0.49 | 0.29 | −0.19 |
| 2008 | −0.77 | −1.11 | 0.42 | −0.71 | 1.02 | 1.90 | 0.76 |
| 2009 | −0.17 | −0.70 | −0.30 | −0.22 | −0.34 | 0.81 | −0.36 |
| 2010 | 0.10 | −0.84 | −0.66 | 0.24 | −1.70 | 0.94 | −0.87 |
| 2011 | 0.61 | −0.55 | −1.01 | 0.53 | −1.41 | −0.21 | 0.90 |
| 2012 | 0.88 | −0.54 | −0.78 | 0.91 | −0.36 | −0.64 | −0.23 |
| 2013 | 1.25 | 0.65 | 0.44 | 1.21 | 1.38 | −0.23 | −1.85 |
| 2014 | 1.41 | 0.98 | 1.32 | 1.41 | 0.79 | −0.34 | 1.78 |
| Year | F1 | F2 | F3 | |||||||||
|---|---|---|---|---|---|---|---|---|---|---|---|---|
| G1 | G2 | G3 | G4 | G1 | G2 | G3 | G4 | G1 | G2 | G3 | G4 | |
| 2005 | 0.8857 | 0.5401 | 0.9172 | 0.5556 | 0.3333 | 0.4844 | 0.3375 | 0.4731 | 0.8052 | 0.4052 | 0.775 | 0.4161 |
| 2006 | 0.9936 | 0.5939 | 0.9281 | 0.5962 | 0.4758 | 0.6871 | 0.4584 | 0.6842 | 0.3454 | 0.4882 | 0.3333 | 0.4863 |
| 2007 | 0.9172 | 0.4968 | 0.5308 | 0.6352 | 0.7908 | 0.619 | 0.6701 | 0.8355 | 0.3962 | 0.7294 | 0.6526 | 0.521 |
| 2008 | 0.9627 | 0.4641 | 0.3673 | 0.5032 | 0.8025 | 0.4328 | 0.3506 | 0.4649 | 0.5232 | 0.6739 | 0.4559 | 0.7848 |
| 2009 | 0.9688 | 0.9012 | 0.6126 | 0.8908 | 0.772 | 0.8186 | 0.5183 | 0.827 | 0.9394 | 0.9688 | 0.5277 | 0.9538 |
| 2010 | 0.9172 | 0.4627 | 0.6485 | 0.6151 | 0.6007 | 0.6539 | 0.4772 | 0.9819 | 0.5794 | 0.5439 | 0.4366 | 0.8552 |
| 2011 | 0.9509 | 0.4342 | 0.654 | 0.8424 | 0.6007 | 0.6539 | 0.827 | 0.5285 | 0.446 | 0.7561 | 0.6078 | 0.3937 |
| 2012 | 0.981 | 0.5556 | 0.5049 | 0.5827 | 0.5285 | 0.9003 | 0.942 | 0.8398 | 0.5566 | 0.8147 | 0.6881 | 0.8908 |
| 2013 | 0.9748 | 0.9226 | 0.5116 | 0.3333 | 0.7437 | 0.69 | 0.6487 | 0.3939 | 0.6169 | 0.5688 | 0.6492 | 0.3513 |
| 2014 | 1 | 0.7143 | 0.4697 | 0.8073 | 0.7908 | 0.8953 | 0.5518 | 0.6701 | 0.9323 | 0.7006 | 0.4276 | 0.7294 |
| Year | C1 | C2 | C3 | Cs | Cd |
|---|---|---|---|---|---|
| 2005 | 0.7216 | 0.4083 | 0.5973 | 0.5757 | |
| 2006 | 0.7751 | 0.5782 | 0.4146 | 0.5893 | 0.0136 |
| 2007 | 0.6444 | 0.7286 | 0.5754 | 0.6495 | 0.0602 |
| 2008 | 0.5744 | 0.5128 | 0.6113 | 0.5662 | −0.0833 |
| 2009 | 0.8452 | 0.7361 | 0.8504 | 0.8106 | 0.2444 |
| 2010 | 0.6592 | 0.6803 | 0.605 | 0.6482 | −0.1624 |
| 2011 | 0.7188 | 0.6512 | 0.5517 | 0.6406 | −0.0076 |
| 2012 | 0.6558 | 0.8028 | 0.7389 | 0.7325 | 0.0919 |
| 2013 | 0.6873 | 0.6188 | 0.5456 | 0.6172 | −0.1153 |
| 2014 | 0.7492 | 0.7291 | 0.6991 | 0.7258 | 0.1086 |
| Coordination Value | Coordination Level |
|---|---|
| 0 < Ci ≤ 0.4 | Seriouslyuncoordinated |
| 0.4 < Ci ≤ 0.5 | Moderately uncoordinated |
| 0.5 < Ci ≤ 0.6 | Mildly uncoordinated |
| 0.6 < Ci ≤ 0.7 | Mildly coordinated |
| 0.7 < Ci ≤ 0.8 | Moderately coordinated |
| 0.8 < Ci ≤ 0.9 | Well coordinated |
| Ci > 0.9 | Highly coordinated |
© 2017 by the authors. Licensee MDPI, Basel, Switzerland. This article is an open access article distributed under the terms and conditions of the Creative Commons Attribution (CC BY) license ( http://creativecommons.org/licenses/by/4.0/).
Share and Cite
Zhu, H.; Deng, F.; Liang, X. Overall Urban–Rural Coordination Measures—A Case Study in Sichuan Province, China. Sustainability 2017, 9, 189. https://doi.org/10.3390/su9020189
Zhu H, Deng F, Liang X. Overall Urban–Rural Coordination Measures—A Case Study in Sichuan Province, China. Sustainability. 2017; 9(2):189. https://doi.org/10.3390/su9020189
Chicago/Turabian StyleZhu, Hui, Fumin Deng, and Xuedong Liang. 2017. "Overall Urban–Rural Coordination Measures—A Case Study in Sichuan Province, China" Sustainability 9, no. 2: 189. https://doi.org/10.3390/su9020189
APA StyleZhu, H., Deng, F., & Liang, X. (2017). Overall Urban–Rural Coordination Measures—A Case Study in Sichuan Province, China. Sustainability, 9(2), 189. https://doi.org/10.3390/su9020189