Article

Operation Performance Evaluation of Power Grid Enterprise Using a Hybrid BWM-TOPSIS Method

1
Department of Finance, Accounting and Auditing Research, State Grid Energy Research Institute, Beijing 102209, China
2
School of Economics and Management, North China Electric Power University, Beijing 102206, China
3
Beijing Key Laboratory of New Energy and Low-Carbon Development, North China Electric Power University, Changping, Beijing 102206, China
*
Author to whom correspondence should be addressed.
Sustainability 2017, 9(12), 2329; https://doi.org/10.3390/su9122329
Submission received: 7 November 2017 / Revised: 2 December 2017 / Accepted: 12 December 2017 / Published: 15 December 2017

Abstract

:
Electricity market reform is in progress in China, and the operational performance of power grid enterprises are vital for its healthy and sustainable development in the current electricity market environment. In this paper, a hybrid multi-criteria decision-making (MCDM) framework for operational performance evaluation of a power grid enterprise is proposed from the perspective of sustainability. The latest MCDM method, namely the best-worst method (BWM) was employed to determine the weights of all criteria, and the technique for order preference by similarity to an ideal solution (TOPSIS) was applied to rank the operation performance of a power grid enterprise. The evaluation index system was built based on the concept of sustainability, which includes three criteria (namely economy, society, and environment) and seven sub-criteria. Four power grid enterprises were selected to perform the empirical analysis, and the results indicate that power grid enterprise A1 has the best operation performance. The proposed hybrid BWM-TOPSIS-based framework for operation performance evaluation of a power grid enterprise is effective and practical.

1. Introduction

The electric power industry is a pillar industry that affects national energy security and economic development [1,2]. Power grid enterprises are a very important part of the electricity industry chain, which undertake several important functions, such as power grid construction, safe and stable power supply, and universal electric service [3,4,5]. During the “Twelfth Five-Year Plan” period in China, the total investment in the electric power grid reached 1.99 trillion RMB, and the amount of electricity sold was about 21 trillion kWh. Currently, China is in the top rank in several areas, such as power grid interconnection, power supply reliability, and installed capacity of new energy [6,7,8,9]. However, due to the issues faced relating to global economic turmoil, state-owned enterprise reform, economic downturn, and the rise of corporate social responsibility and environmental pollution, the power grid enterprises in China are confronting challenges from economic, social, and environmental aspects.
In 2015, China began to implement a new round of electric power system reform, which aims to restore the commodity attribute of electrical energy, build a competitive electricity market, and promote effective and orderly development of the electric power industry via the establishment of market-oriented operation and management mechanisms [10,11,12]. Meanwhile, this new round of electric power system reform has proposed some requirements on power grid enterprises. Specifically speaking, the power grid enterprises still need to manage the transmission and distribution power networks that hold the characteristic of a natural monopoly. Furthermore, the power grid enterprises also need to link up in an orderly manner with power generation enterprises and electricity-selling enterprises, which have competitive characteristics. With the deepening of electricity market reform, many electricity-selling enterprises will be established and they will compete against the power grid enterprises. This will bring challenges and risks to power grid enterprises in terms of electricity marketing [11,13]. Moreover, the transmission and distribution tariff reform, which proposes the transmission and distribution tariff should be set based on the “allowable cost plus reasonable return”, will also push power grid enterprises to enhance regulatory asset management and improve operation performance.
Under the background of electric power system reform, many electricity-selling enterprises have been established in several provinces and cities in China, such as Beijing city, Shanxi province, and Chongqing city, which can sell electricity to consumers. However, prior to this round of electric power system reform, only power grid enterprises show marketization of electricity-selling businesses. Therefore, it can be said that the monopolistic characteristic of power grid enterprises related to electricity marketing have been broken. The economic profit of power grid enterprises in China is mainly in the form of electricity marketing. If the original electricity consumers of power grid enterprises switch to purchase electricity from electricity-selling enterprises, then the economic profit of power grid enterprises will be adversely impacted. Therefore, the power grid enterprises need to study the marketing strategy and enhance operation management. Meanwhile, the new setting principle and method for the transmission and distribution tariff also require the power grid enterprises to enhance operation management and improve operation performance, which can effectively guarantee their profit and promote sustainable development. Therefore, under this new market environment, the power grid enterprises must urgently study the innovative marketing and management strategies to improve their operation performances, which can achieve healthy and sustainable development under the new policy environment and competitive situation.
In this paper, the operation performance of a power grid enterprise under the environment of electric power system reform is studied from the perspective of sustainability. Conventional sustainability includes three aspects, namely economy, society, and environment [14,15]. Referring to this concept, a framework for evaluating operation performance of a power grid enterprise will be built, which includes economic criteria, social criteria, and environmental criteria. Meanwhile, these three criteria contain several sub-criteria, respectively. Thus, the operation performance of a power grid enterprise can be evaluated by using a multi-criteria decision-making (MCDM) technique. Currently, there are several MCDM methods, such as the technique for order preference by similarity to an ideal solution (TOPSIS) [16], preference ranking organization methods for enrichment evaluations (PROMETHEE) [17], Vlsekriterijumska Optimizacija I Kompromisno Resenje (VIKOR) [18], elimination and choice translating reality (ELECTRE) [19], and the analytic hierarchy process (AHP) [20]. Due to the logical computational process and ease of operation, the TOPSIS method has been successfully employed in many cases [21,22,23,24,25,26,27,28,29,30]. Therefore, the TOPSIS method is employed to evaluate the operation performance of a power grid enterprise in this paper. Additionally, determining the weights of the criteria are also quite important for operation performance evaluation of a power grid enterprise. In this paper, a latest MCDM method, namely the best-worst method (BWM) [31] is employed to determine the weights of all criteria. Similar to AHP, the BWM also needs to perform pairwise comparisons among different criteria by using a 1–9 scale [32]. However, the BWM only performs reference comparisons, which means the preferences of all criteria over the worst criterion and the preferences of the best criterion over all criteria [31,33]. Therefore, the BWM shows much easier operation and less inconsistency compared to AHP [34,35,36]. Since the BWM was proposed, it has gained extensive attentions and has been used in several practical problems [37,38,39,40,41]. Thus, a hybrid MCDM technique, namely the BWM-TOPSIS framework, is proposed to evaluate operation performance of a power grid enterprise in this paper. This proposed framework has several merits: (1) the latest MCDM method, namely BWM, is employed for criteria weight determination, which can perform much easier operation than other methods, such as AHP; and (2) the commonly-used MCDM method, namely TOPSIS, is used for ranking operation performance of a power grid enterprise, the ranking procedure of which is much clearer and easier to implement compared with other MCDM methods, such as VIKOR.
Currently, the operation performance of power grid enterprise has been rarely researched. This paper evaluates the operation performance of a power grid enterprise from the perspective of sustainability, which can fill this research gap. Meanwhile, the BWM and TOPSIS, which have been used in many decision-making issues, are firstly used for the management issue of a power grid enterprise, which extends the application domains of TOPSIS and BWM methods.

2. Basic Theories of BWM and TOPSIS Methods

2.1. BWM for Criteria Weight Determination

For the operation performance evaluation of a power grid enterprise, the weights of criteria need to be determined firstly. Reasonable and scientific determination related to criteria weight is very important, which will directly affect the comprehensive evaluation on operation performance of a power grid enterprise and the corresponding decision-making. In this paper, the latest MCDM technique, namely BWM, is employed to determine the weights of the criteria.
The BWM was proposed by professor Rezaei in 2015 [31]. Similar to AHP, the BWM is based on the idea of pairwise comparison, namely the comparison between two criteria. However, the BWM is different from AHP in terms of pairwise comparison. It is not an arbitrary pairwise comparison in BWM, but rather a systematic one. For BWM, the best criterion and the worst criterion will be firstly determined according to the comments of decision-makers. Secondly, the reference comparisons related to the best criterion and the worst criterion will be performed, namely the pairwise comparisons between the best criterion and other criteria, and the pairwise comparisons between the worst criterion and other criteria. Thirdly, based on the philosophy that the pairwise comparison value (represented as a 1–9 scale) between two criteria should equal to the ratio of these two criteria weights as much as possible, a constrained objective optimization problem will be built. Finally, solving the built constrained objective optimization problem, the weights of the criteria can be obtained. The specific steps of BWM are as follows:
Step 1: According to the research issue, a reasonable decision-making criteria system should be built firstly, which can reflect the performances of different alternatives. Suppose there are n criteria in the decision-making criteria system, namely { c 1 , c 2 , , c n } .
Step 2: Select the best criterion C B and the worst criterion C W in the decision-making criteria system.
Step 3: Determine the preference of the best criterion over all criteria by using a 1–9 scale. The 1–9 scale indicates the importance of the best criterion over the other criteria. Specifically speaking, if the best criterion is as important as a selected criterion, the preference of the best criterion over this selected criterion is assigned a value of 1. If the best criterion is absolutely important compared to the selected criterion, the preference of the best criterion over this selected criterion should be assigned as 9. In this way, a best-to-others vector A B = ( a B 1 , a B 2 , , a B n ) can be obtained, where a B i represents the preference of the best criterion C B over criterion C i .
Step 4: Determine the preference of all criteria over the worst criterion by using a 1–9 scale. Just like Step 3, an others-to-worst vector A W = ( a 1 W , a 2 W , , a n W ) T can be obtained, where a i W represents the preference of criterion C i over the best criterion C B .
Step 5: Construct the following constrained objective optimization model as shown in Equations (1) and (2) [31]. Equation (1) represents the objective function, and Equation (2) represents the constraint conditions. Then, the solutions of this constructed constrained objective optimization model are the optimal weight vector of evaluation criteria system:
min max j { | w B w j a B j | , | w j w W a j W | }
s . t . { j w j = 1 w j 0 , f o r a l l j
where w B is the weight of the best criterion C B ; w j is the weight of criterion C j ; a B j represents the preference of the best criterion C B over criterion C j ; w W is the weight of the worst criterion C W ; and a j W represents the preference of criterion C j over the worst criterion C W .
In the practical operation, Equation (1) can be transferred to the following objective function and constraint conditions, namely [31]:
min ξ s . t . { | w B w j a B j | ξ , f o r a l l j | w j w W a j W | ξ , f o r a l l j
where ξ is the auxiliary variable.
Then, solving Equations (2) and (3), the optimal weights of all criteria and the optimal auxiliary variable ξ * can be obtained.
For n criteria, the BWM needs 2n − 3 pairwise comparisons while AHP needs n(n − 1)/2 pairwise comparisons [31]. It can be inferred that the BWM can greatly simplify the comparison process, reduce the inconsistency risk, and ensure the judgment accuracy by establishing the best and worst criteria [31,36].
To test the consistency related to reference comparisons of decision-makers, the consistency ratio (CR) should be calculated, which equals to ξ * divided by the consistency index (CI). The CI can be determined based on the value of a B W , which is listed in Table 1. The larger the CR, the less reliable the reference comparisons become. Thus, the CR should be as small as possible in practical issues.

2.2. TOPSIS Method for Operational Performance Ranking of a Power Grid Enterprise

The TOPSIS method is a multi-criteria decision-making method that ranks the alternatives according to the closeness degrees of alternatives from idea solution. The idea solution can be considered as a hypothetical optimal alternative. TOPSIS is a ranking method that ranks the alternatives by using a positive ideal solution and a negative ideal solution. The best alternative has the longest geometric distance from the negative ideal solution, and the shortest geometric distance from the positive ideal solution, while the worst alternative has the shortest geometric distance from the negative ideal solution, and the longest geometric distance from the positive ideal solution [15,42,43]. The TOPSIS method is easy to understand and operate, and has been used in many issues.
Suppose there are m alternatives A = { A 1 , A 2 , , A m } and n criteria C = { c 1 , c 2 , , c n } . The specific steps of TOPSIS are as follows:
Step 1: Build the initial decision matrix A.
According to some methods, such as field research and spot investigation, the criteria of alternatives can be valued. Then, the initial decision matrix A can be obtained as shown in Equation (4) [42,43]:
A   =   ( a i j ) m × n = ( a 11 a 1 n a m 1 a m n )
where a i j is the jth criterion value of the ith alternative; i = 1 , 2 , , m , and j = 1 , 2 , , n .
Step 2: Normalize the initial decision matrix A, and obtain the normalized decision matrix B.
Usually, different criteria hold different characteristics, such as different units and quantities. Thus, to avoid dimensional differences and ensure mathematical compatibility, the initial decision matrix needs to be normalized, which can be performed according to Equation (5) [42,43]:
b i j = a i j min ( a i j ) max ( a i j ) min ( a i j )
where a i j is the jth criterion value of the ith alternative; b i j is the normalization value of the jth criterion of the ith alternative; min ( ) represents the minimum operation; and max ( ) represents the maximum operation.
Thus, the normalized decision matrix B can be obtained as [42,43]:
B   =   ( b i j ) m × n = ( b 11 b 1 n b m 1 b m n )
Step 3: Construct the weighted normalized decision matrix C.
The weighted normalized decision matrix C can be obtained by the normalized decision matrix B multiplied by the criteria weights w j ( j = 1 , 2 , , n ) , as follows [42,43]:
C   =   ( c i j ) m × n = ( w 1 × b 11 w n × b 1 n w 1 × b m 1 w n × b m n )
where c i j is the weighted normalized value of the jth criterion of the ith alternative.
The weights of all criteria can be obtained using the BWM in this paper.
Step 4: Determine the positive ideal solution C + and the negative ideal solution C .
Different criteria hold different attributes. Some criteria belong to the benefit-type criteria, which means the larger the better, while some criteria are cost-type, namely the smaller the better. Let J 1 and J 2 respectively represent the benefit-type criteria set and cost-type criteria set. Let C + and C respectively represent the positive ideal solution and the negative ideal solution, which can be calculated as [42,43]:
{ C + = ( c j + ) = { ( max i   c i j | j J 1 ) , ( min i   c i j | j J 2 ) } C = ( c j ) = { ( min i   c i j | j J 1 ) , ( max i   c i j | j J 2 ) }
where c j + represents the positive ideal solution of the jth criterion; c j represents the negative ideal solution of the jth criterion; max i   c i j = [ max i ( w j × b i j ) ] ; min i   c i j = [ min i ( w k × b i j ) ] ; i = 1 , 2 , , m ; and j = 1 , 2 , , n .
Step 5: Calculate the distances of each alternative from the positive and negative ideal solutions.
The Euclidean distance is used to calculate the distances of each alternative from positive and negative ideal solutions in this paper. Therefore, the distance d i + of alternative i from the positive ideal solution can be calculated as shown in Equation (9) [42,43]:
d i + = j = 1 n ( c i j c j + ) 2
The distance d i of alternative i from the negative ideal solution can be calculated as shown in Equation (10) [42,43]:
d i = j = 1 n ( c i j c j ) 2
Step 6: Calculate the closeness coefficient of each alternative.
The closeness coefficient represents the distance close to the positive ideal solution C + and away from the negative ideal solution C simultaneously, which can be calculated according to Equation (11) [42,43]:
C C i = d i d i + + d i
where C C i represents the closeness coefficient of alternative i, and 0 C C i 1 .
Step 7: Rank all the alternatives.
The alternatives can be ranked according to their C C i . The alternative with the maximum C C i value should be selected as the optimal alternative.

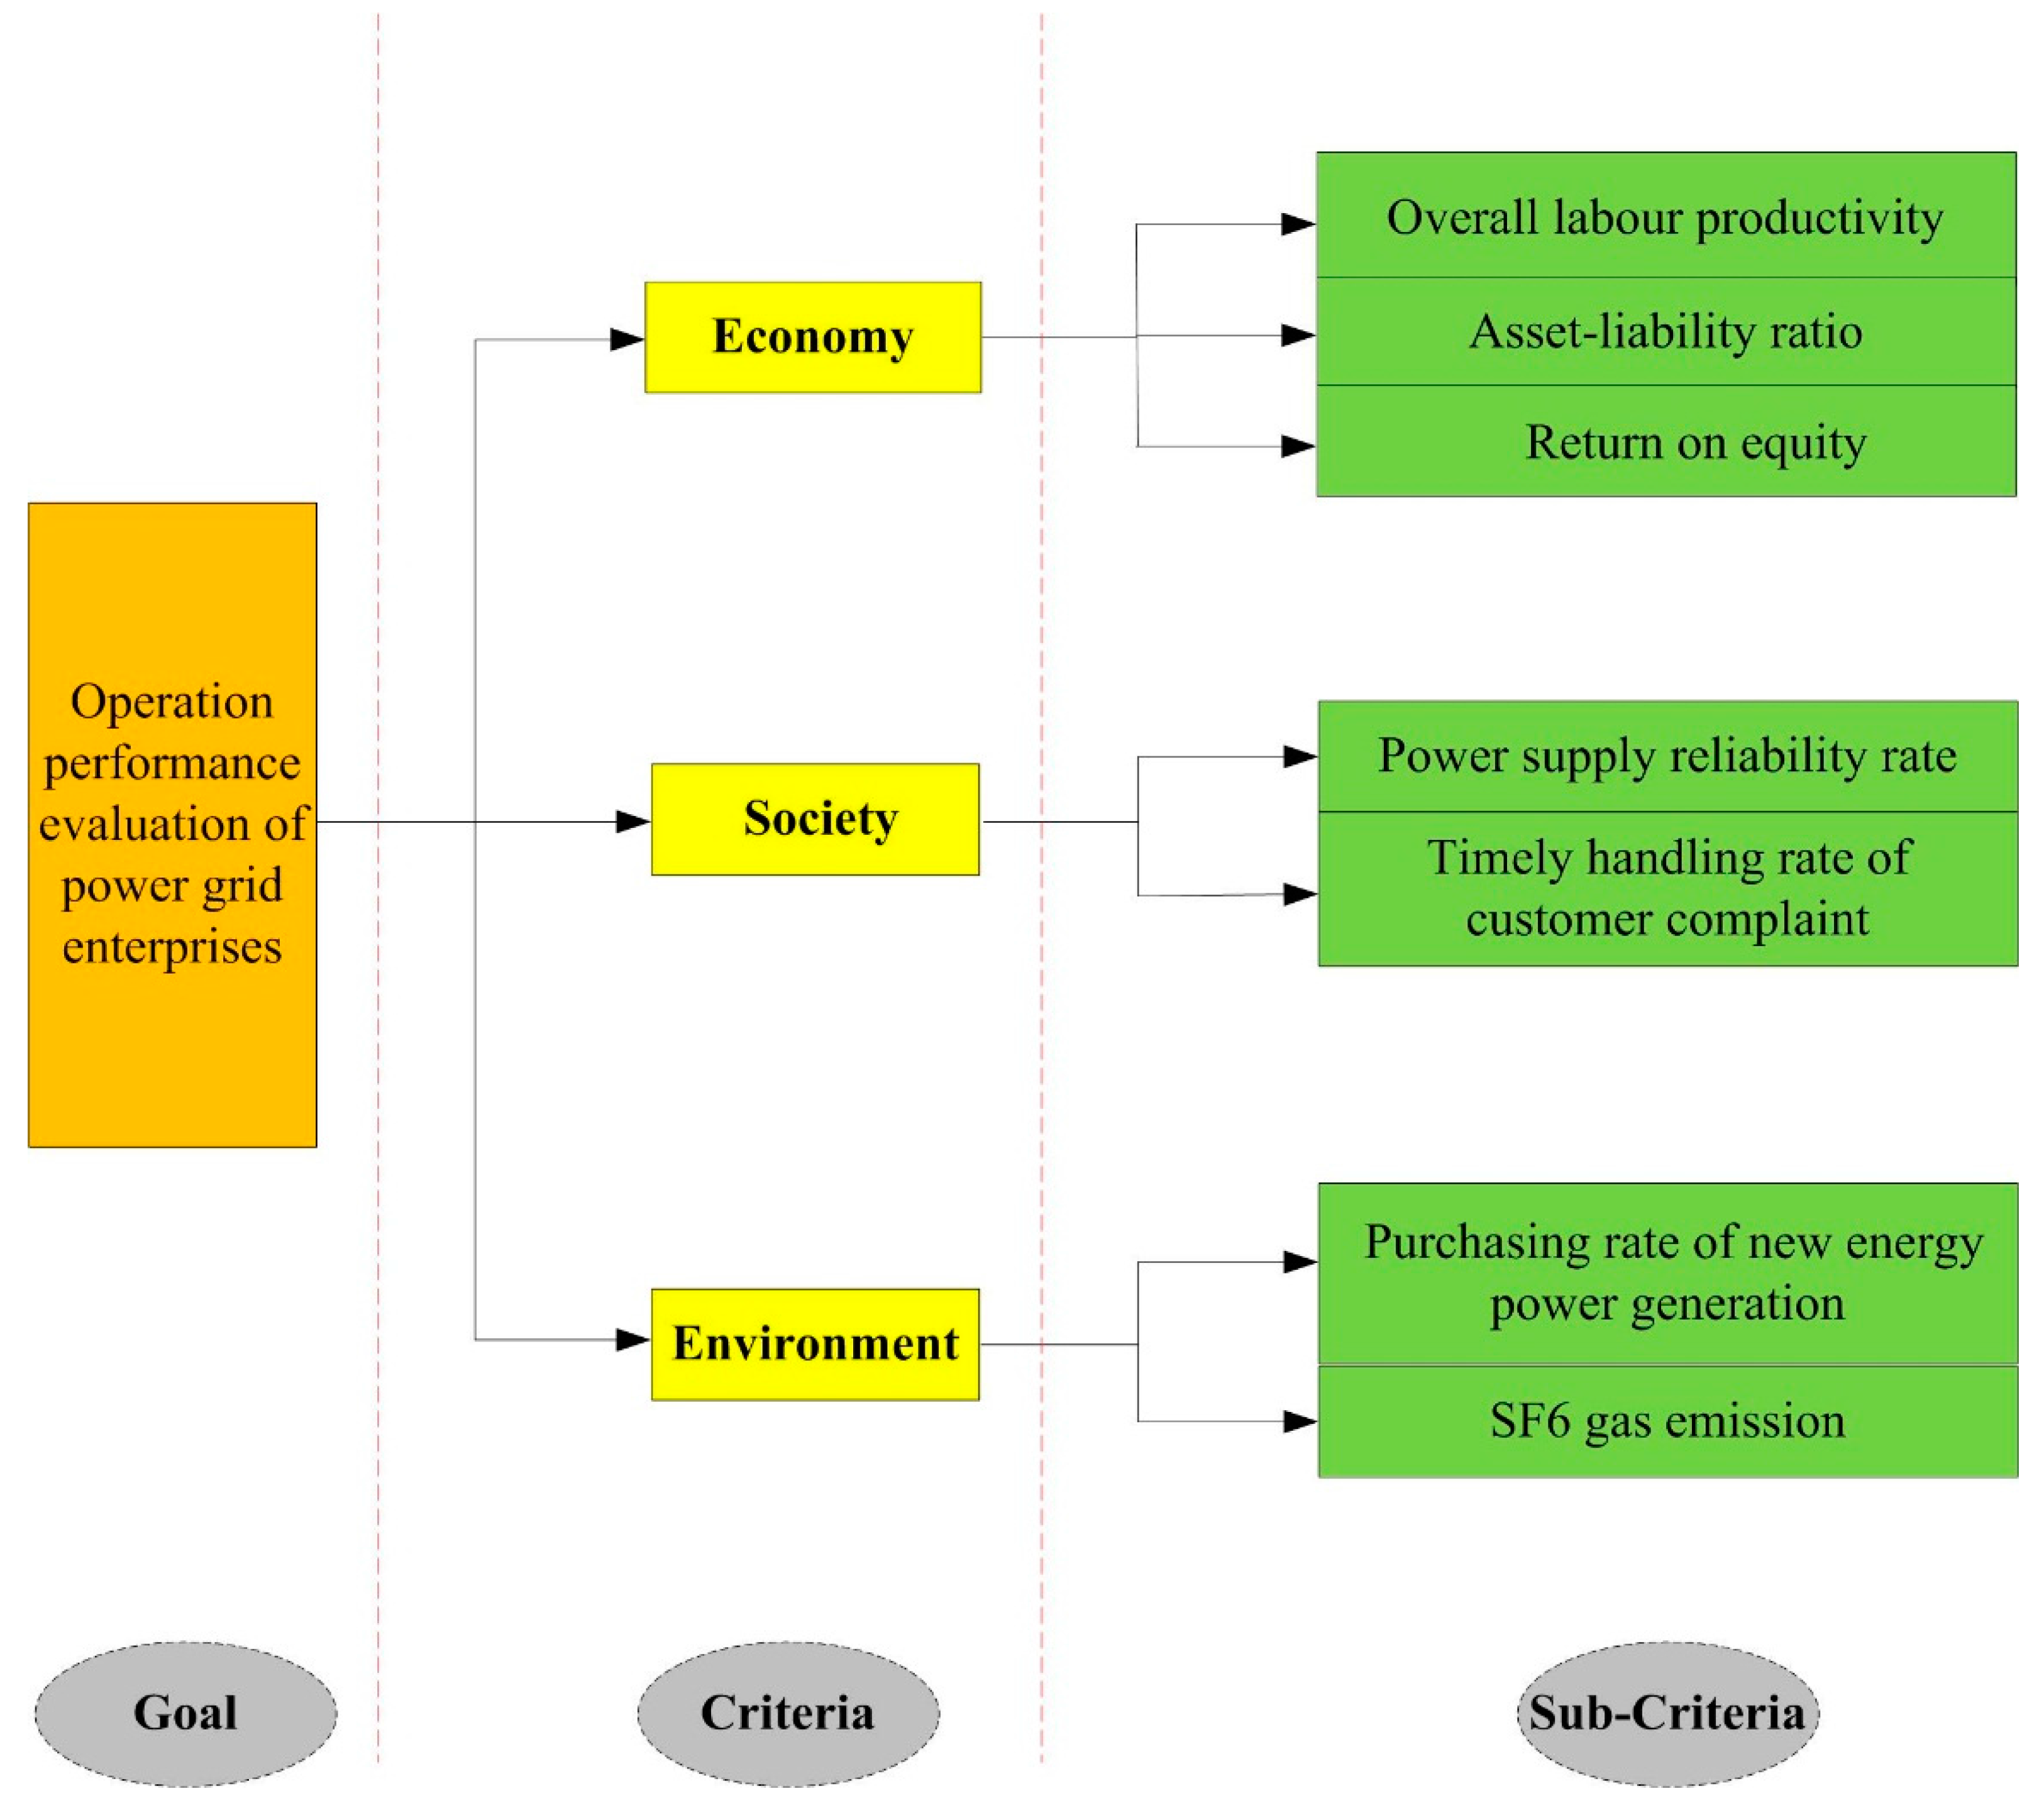
3. Evaluation Index System for Operation Performance of Power Grid Enterprises

An evaluation index system is quite important for the operation performance evaluation of a power grid enterprise. The significant criteria should be integrated into the evaluation index system, which reflect the main characteristics and connotations of operation performance of a power grid enterprise. In this paper, the evaluation index system for operation performance of a power grid enterprise is built based on the concept of sustainability. Therefore, the evaluation index system includes three criteria, namely economic criteria, social criteria, and environmental criteria. Moreover, these three criteria contain several sub-criteria, respectively. The selection processes of sub-criteria are as follows: Firstly, the initial sub-criteria are determined based on the related academic literature and enterprise reports. Secondly, the experts in the fields of enterprise management, economic and social development, and environmental protection, including academic professors and enterprise practitioners, review the initial sub-criteria, and then select the much more important sub-criteria among all the sub-criteria based on their professional knowledge and practical experience. Finally, the less important sub-criteria are deleted based on the comments from the invited experts, and then the final sub-criteria for operation performance evaluation of a power grid enterprise are determined. The evaluation index system for operation performance of a power grid enterprise is shown in Figure 1, which includes three criteria and seven sub-criteria. The detailed explanations of the sub-criteria are shown below.

3.1. Economic Criterion

The economic criterion includes three sub-criteria, which are “overall labor productivity”, “asset-liability ratio” and “return on equity”.
(1)
Overall labor productivity (C1) measures the electrical energy production per capita in a certain period of time, which is an important indicator for evaluating the economic activity of a power grid enterprise. High overall labor productivity indicates the high production technology and business management level of the power grid enterprise. Meanwhile, this sub-criterion can also represent the enthusiasm and economic contribution of labor.
(2)
Asset-liability ratio (C2) can be calculated by the total liabilities divided by the total assets, which is an indicator for evaluating the liabilities level of a power grid enterprise and evaluating the degree of protecting creditor’s interests. A low asset-liability ratio indicates the high economic management capacity of creditors and the corresponding high interest guarantee degree. Meanwhile, this sub-criterion can also reflect the financial risk of a power grid enterprise, which will indirectly impact the economic benefit of the power grid enterprise.
(3)
Return on equity (C3) is the ratio of retained profits to average owner’s equity, which represents the profit level of stockholders’ equity and reflects the efficiency of owned capital operated by the power grid enterprise. A high return on equity indicates high gains on investment and high net earning capacity of owned capital of the power grid enterprise.

3.2. Social Criterion

Two sub-criteria affiliated with the social criterion for operation performance evaluation of power grid enterprise are summarized below.
(1)
Power supply reliability rate (C4) is an important indicator to evaluate power supply quality, which can be calculated by: (1 − average interruption hours of the customer/8760) × 100%. With a high penetration of renewable energy power with the characteristics of volatility and intermittency, the power grid will suffer influences and then induce an unstable power supply. A low power supply reliability rate will damage production equipment of the enterprise and household appliances, which will impact the enterprise’s normal production, and residents’ living and social stability.
(2)
Timely handling rate of customer complaint (C5) is the handled customer complaints divided by the total customer complaints in a certain period of time, which reflects the service quality of the power grid enterprise. A high timely handling rate of customer complaints indicates that a majority of customer complaints can be handled in a timely manner and be effectively solved. This will reduce the financial loss of customers and improve the degree of customer loyalty. With the increasing emersions of electricity-selling enterprises, the improvement of the degree of customer loyalty is quite important, which will keep, and even increase, the electricity-selling market share of the power grid enterprise.

3.3. Environmental Criterion

Two sub-criteria affiliated with the environmental criterion are finally selected for operation performance evaluation of a power grid enterprise.
(1)
Purchasing rate of new energy power generation (C6) is the ratio of total purchased new energy power generation to the total purchased power generation (mainly including thermal power generation, hydroelectric generation, and new energy power generation). The new energy power includes several power types, such as wind power, solar photovoltaic power, and biomass power, which hold the characteristic of less emission pollution (such as CO2 and SO2). Purchasing new energy power generation will substitute for fossil fuels-based power generation, which will reduce emission pollution and protect the environment.
(2)
SF6 gas emission (C7): SF6 gas is a kind of greenhouse gas that is mainly consumed by electrical equipment, such as circuit breakers, high-voltage transformers, instrument transformers, and high-voltage transmission lines. SF6 gas is a kind of extremely stable gas, and its lifetime in the atmosphere is about 3200 years. SF6 gas has a strong capacity of absorbing infrared radiation, which indicates it is a kind of greenhouse gas. Currently, the SF6 gas emitted into the atmosphere is growing in China, which should be paid more attention. In this paper, the SF6 gas emission can be obtained according to the statistical accounting of the power grid enterprise in units of kilogram.

4. Empirical Analysis

Four power grid enterprises ( A i , i = 1 , 2 , 3 , 4 ) are selected for empirical analysis in this paper, which are located in the rapid development regions of the deregulated electric power market. In these regions, there are independent transmission and distribution tariffs, and some electricity-selling enterprises have been founded.
By performing a spot investigation and on-site consultation, actual values of seven sub-criteria ( C j , j = 1 , 2 , , 7 ) related to four selected power grid enterprises were obtained, which are listed in Table 2.

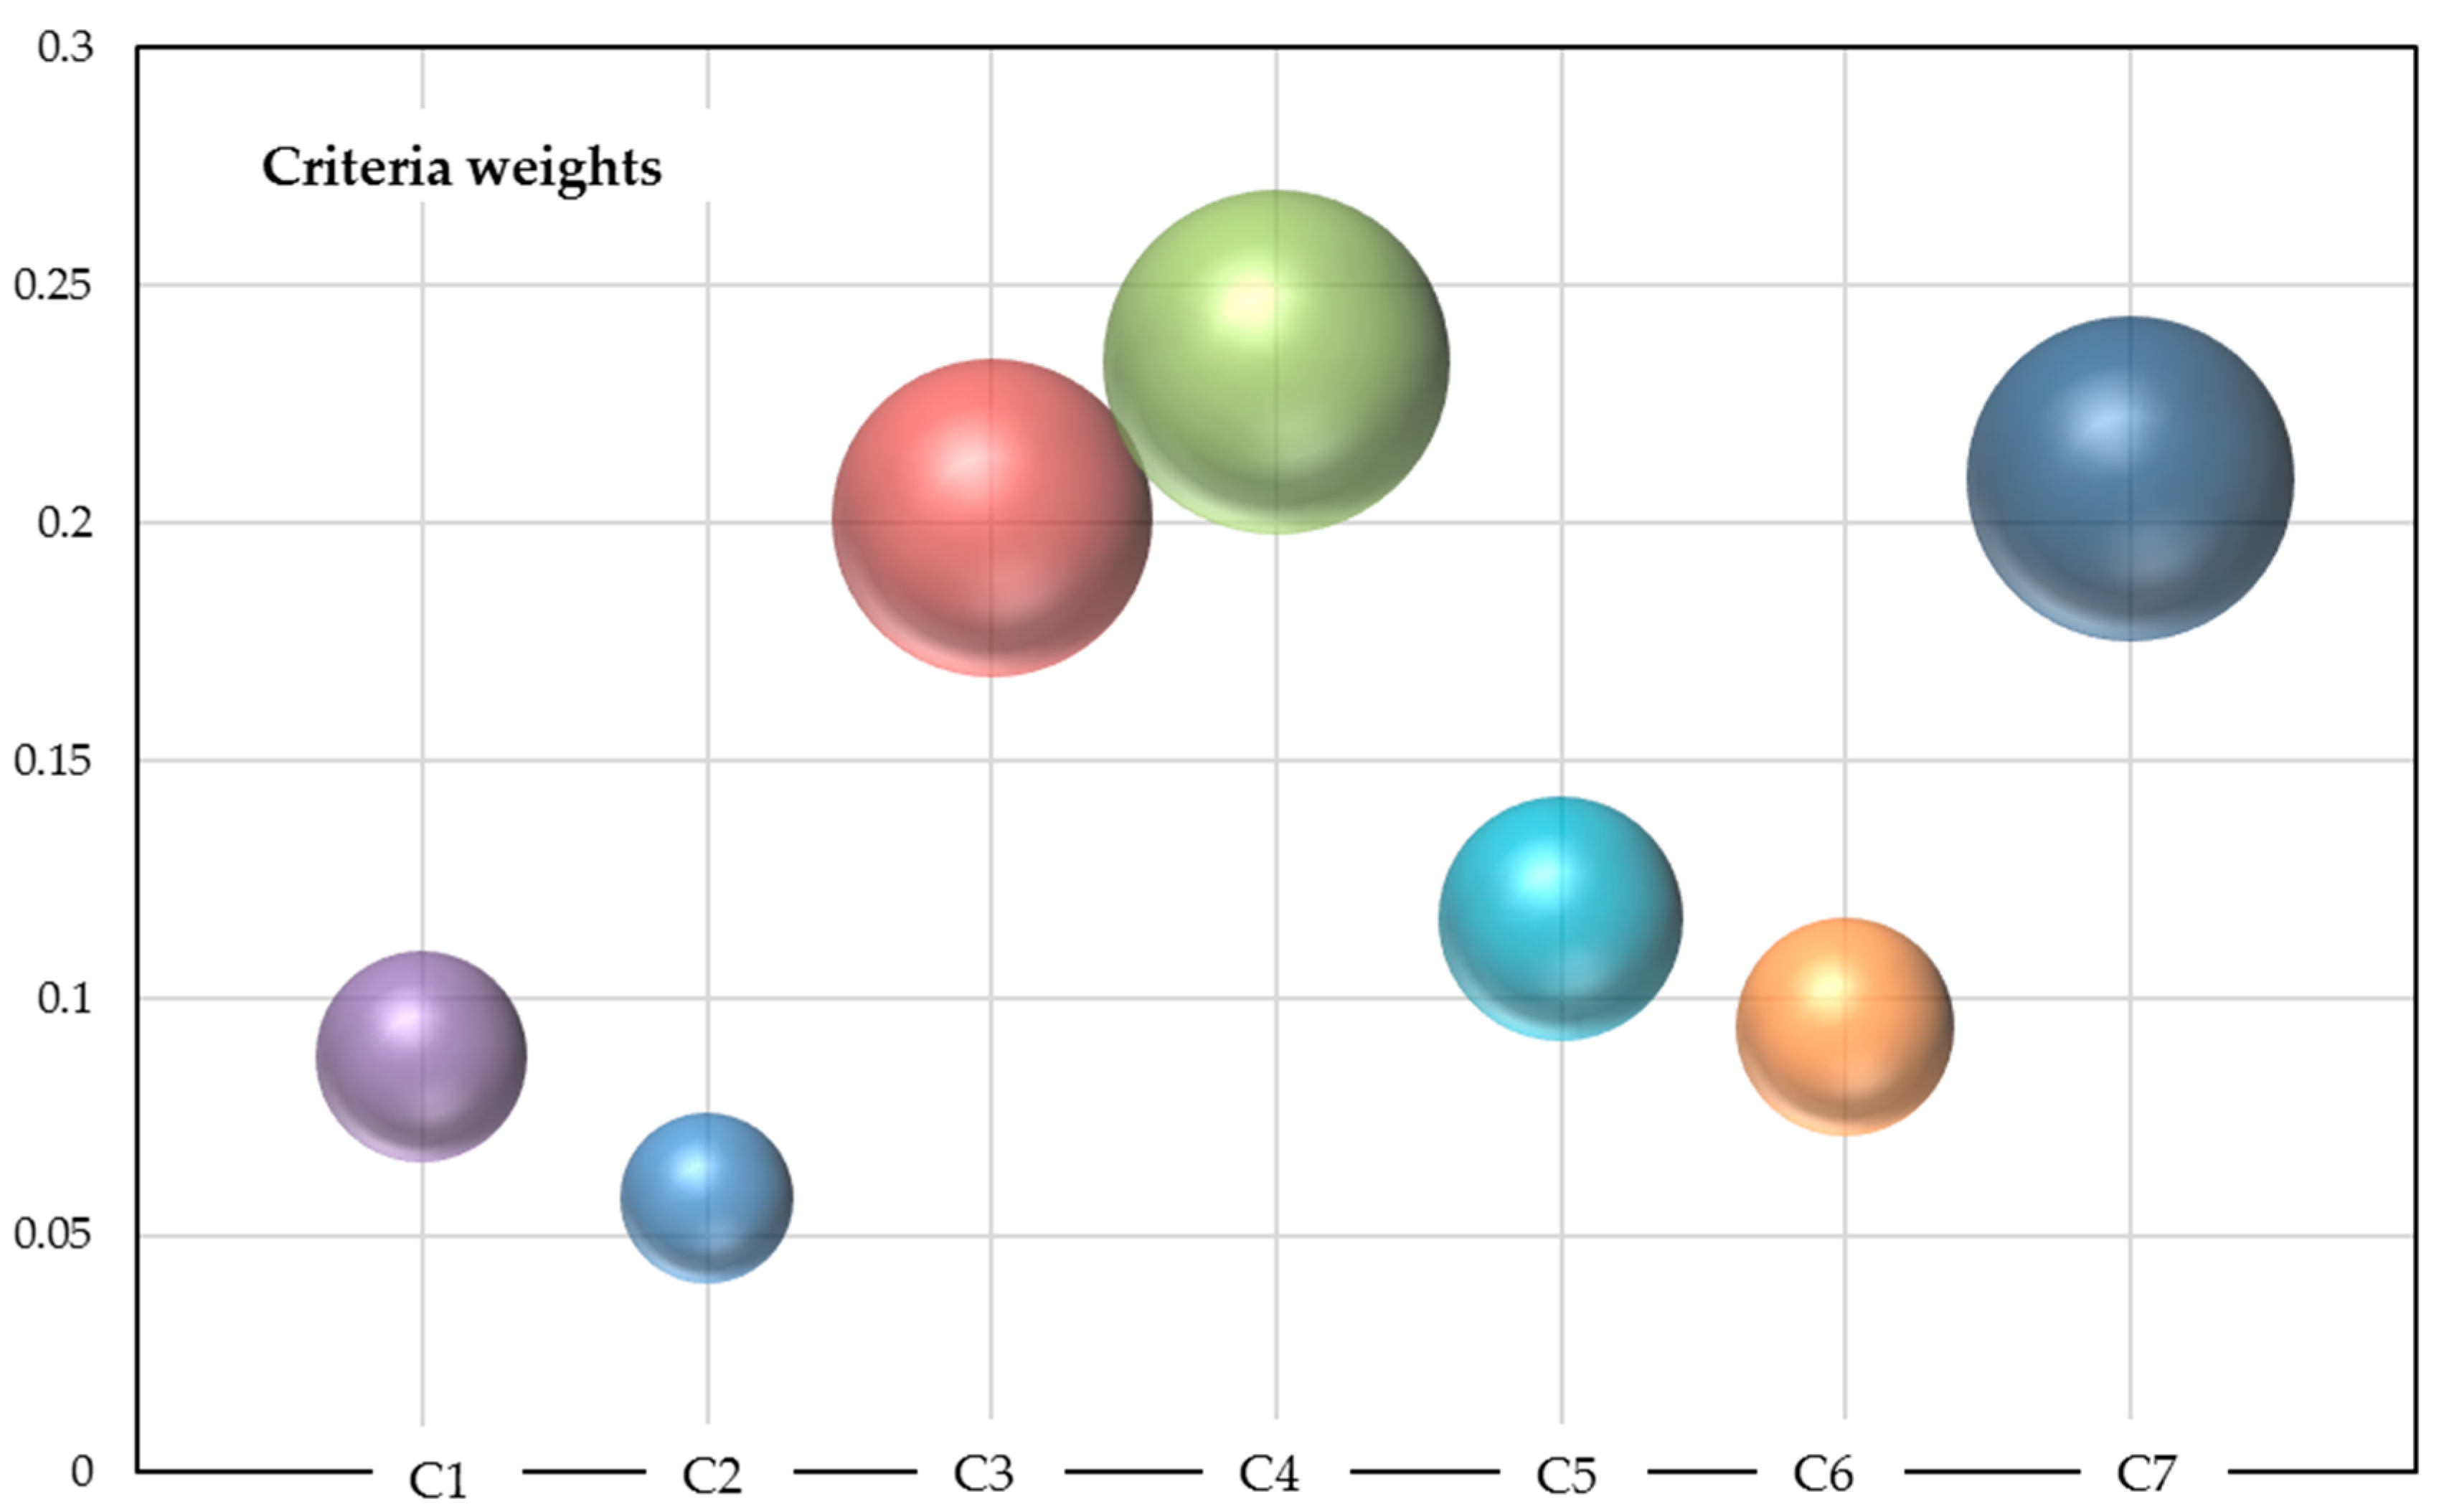
4.1. Determine the Weights of Criteria Using BWM

Three expert groups (labelled as DM1, DM2, DM3) in the fields of enterprise management, economic and social development, and environmental protection were formed to perform reference comparisons on sub-criteria. The best criterion and the worst criterion are selected by three expert groups DM1, DM2, DM3, and the results are listed in Table 3 and Table 4, respectively. Meanwhile, the preferences of the best criterion over all criteria and the preferences of all criteria over the worst criterion by using a 1–9 scale are also listed in Table 3 and Table 4, respectively.
Then, according to Equations (1)–(3), the optimal weight vectors of the evaluation index system for the three expert groups can be respectively obtained, which are:
W D M 1 = ( 0.1356 , 0.0718 , 0.3205 , 0.2371 , 0.0966 , 0.0417 , 0.0966 ) , W D M 2 = ( 0.0912 , 0.0335 , 0.1957 , 0.2967 , 0.1386 , 0.0717 , 0.1726 ) , W D M 3 = ( 0.0364 , 0.0682 , 0.0867 , 0.1677 , 0.1143 , 0.1677 , 0.3589 ) .
Meanwhile, the optimal ξ * can also be obtained for three expert groups, which are ξ D M 1 * = 0.6834 , ξ D M 2 * = 0.8599 , and ξ D M 3 * = 0.8599 . Thus, the consistency ratios (CRs) for three expert groups can be calculated, which equal to 0.1832, 0.1924, and 0.1644, respectively. It can be seen that the reference comparisons of these three expert groups show good consistency, which can be used for criteria weight determination.
We suppose these three expert groups are of equal importance, so the final optimal weight vector of evaluation criteria system can be calculated using arithmetic average method, which is:
W = ( 0.0877 , 0.0578 , 0.2001 , 0.2338 , 0.1165 , 0.0937 , 0.2094 )

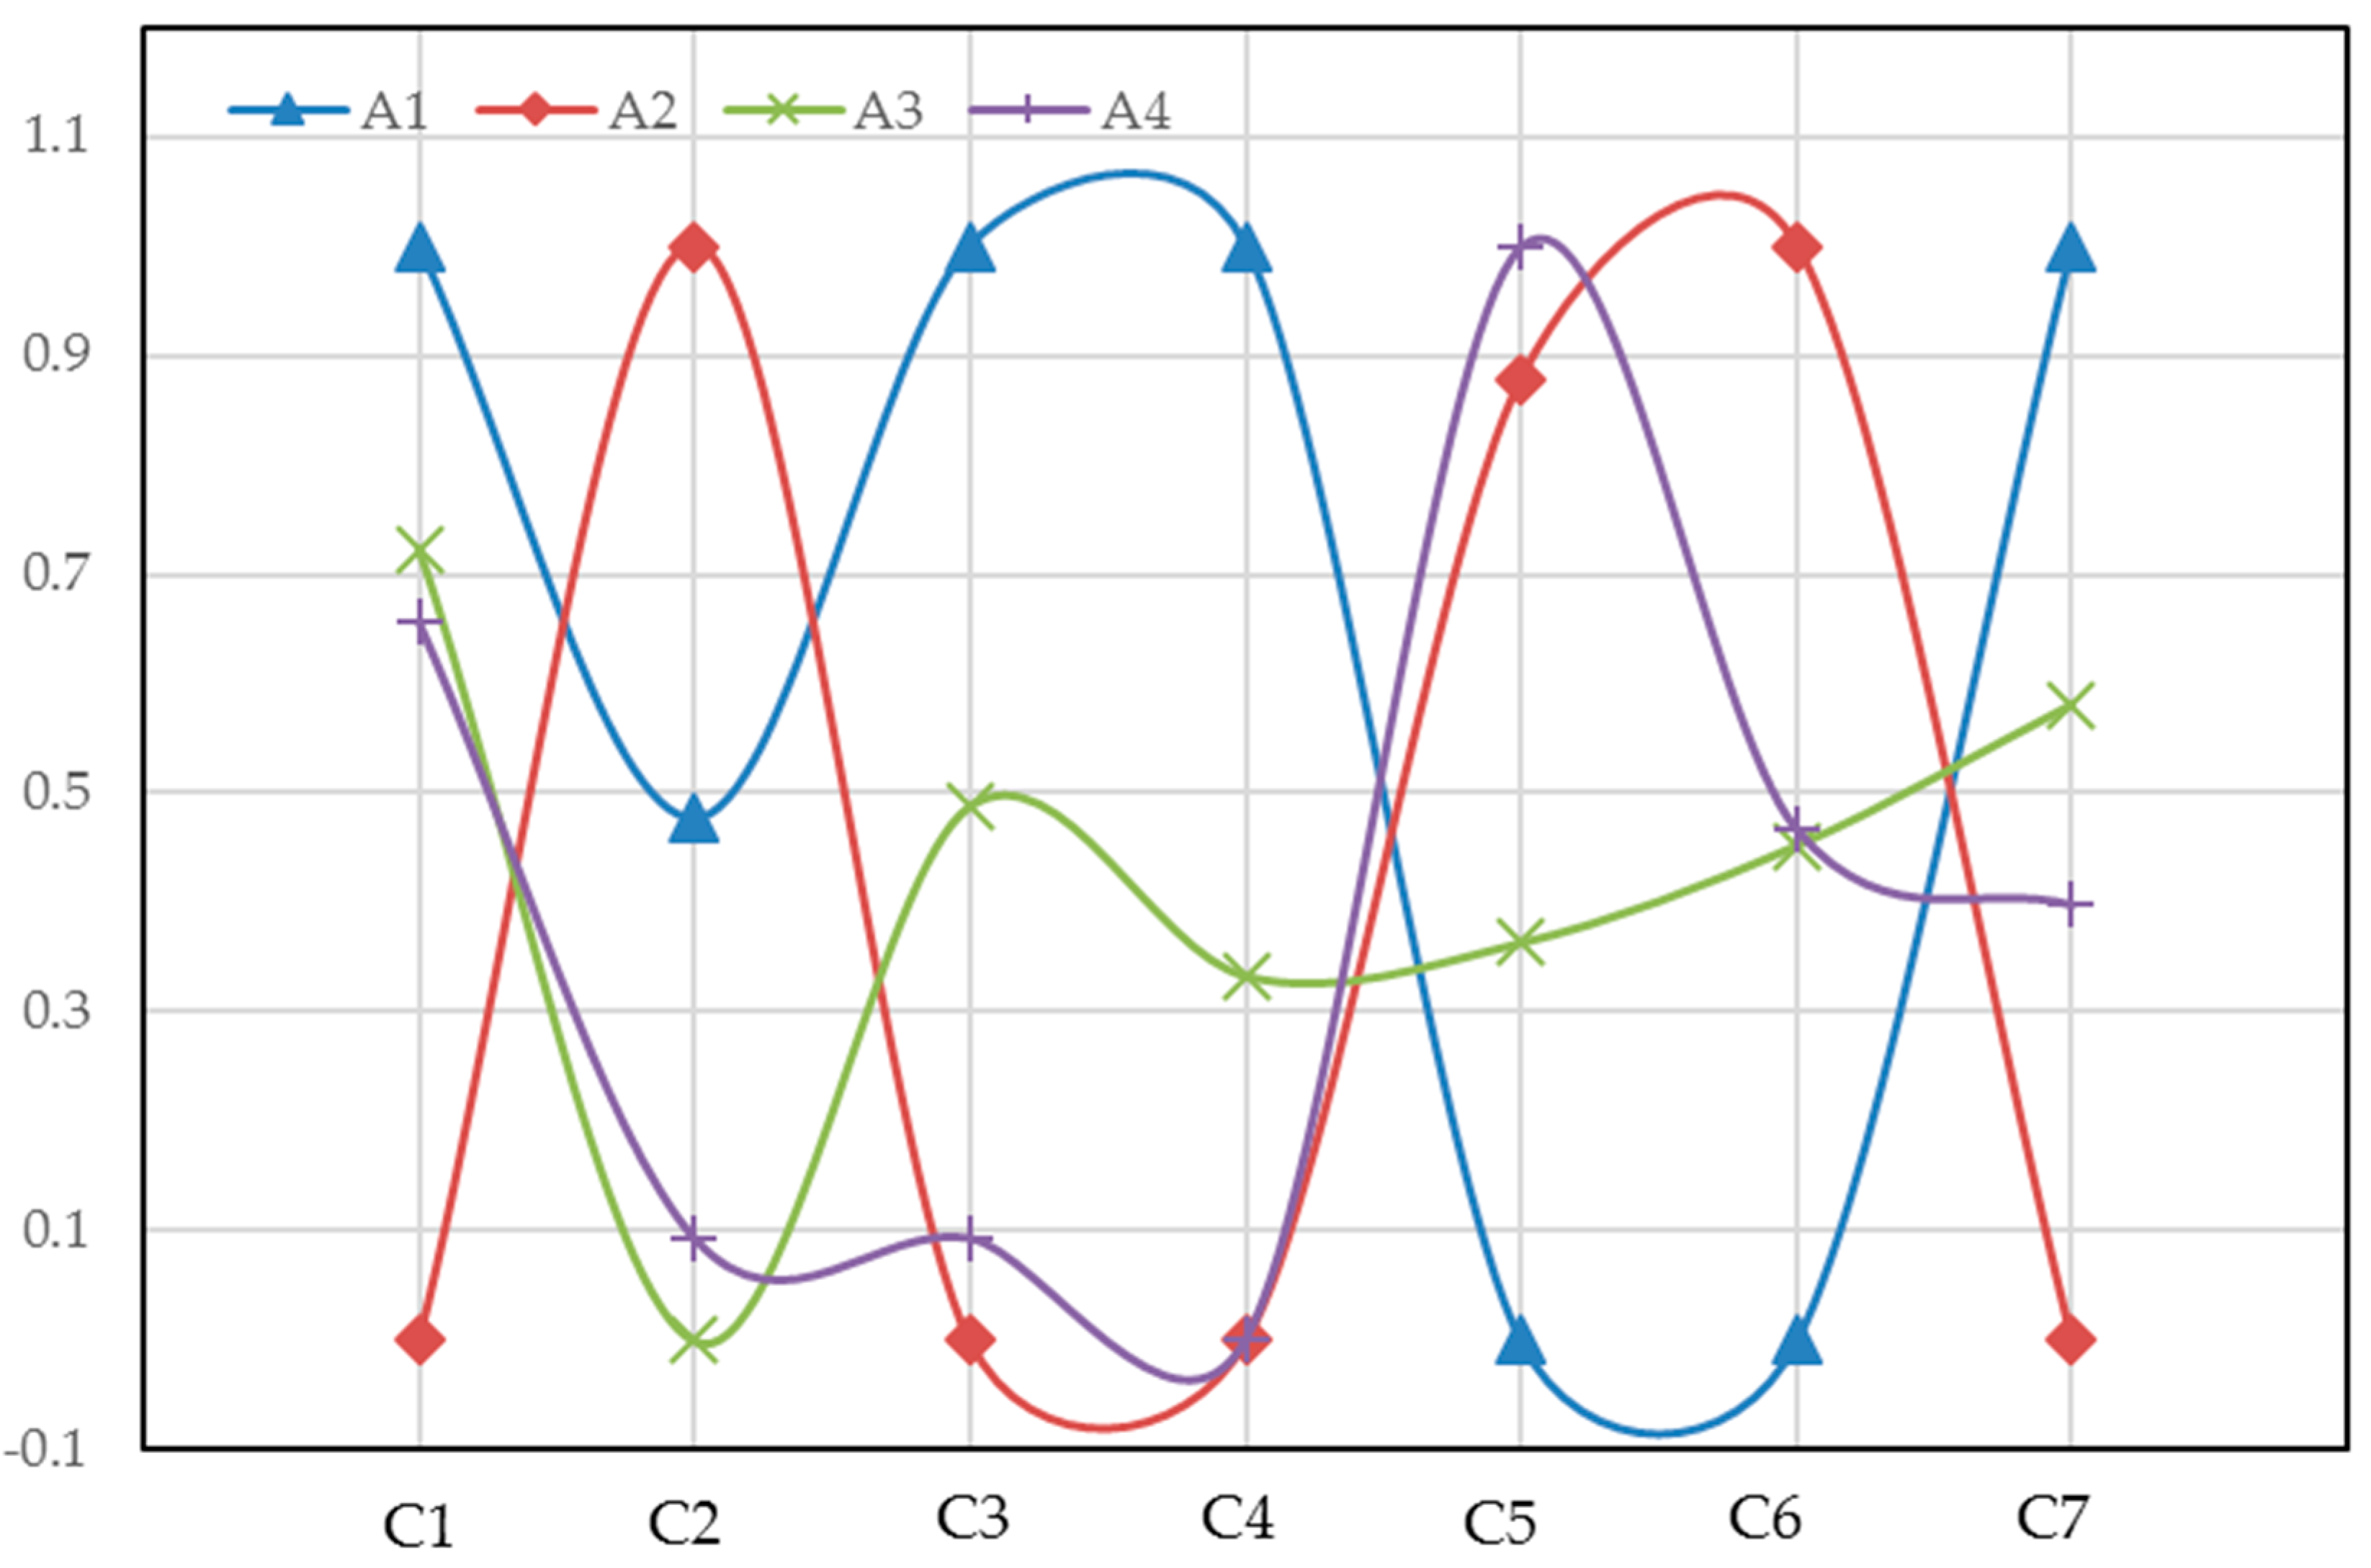
4.2. Build the Initial Decision Matrix

The initial decision matrix A can be built according to actual values of seven sub-criteria related to four power grid enterprises, which is:
A   =   ( a i j ) 4 × 7 = ( 5989 62.28 18.01 99.98 98.23 5.04 3150 5703 63.91 17.58 99.95 98.52 9.13 1255 5910 60.79 17.79 99.96 98.35 6.89 2357 5891 61.08 17.62 99.95 98.56 6.95 2009 )

4.3. Calculate the Normalized Decision Matrix

According to Equation (5), the initial decision matrix can be normalized, and the normalized decision matrix B can be obtained, which is:
B   =   ( b i j ) 4 × 7 = ( 1 0.4776 1 1 0 0 1 0 1 0 0 0.8788 1 0 0.7238 0 0.4884 0.3333 0.3636 0.4523 0.5815 0.6573 0.0929 0.0930 0 1 0.4670 0.3979 )

4.4. Construct the Weighted Normalized Decision Matrix

The weighted normalized decision matrix C equals the normalized decision matrix B multiplied by criteria weight vector W . The criteria weight vector W has been calculated using BWM. Thus, according to Equation (7), the weighted normalized decision matrix C can be computed as:
C   =   ( c i j ) 4 × 7 = ( 0.0877 0.0276 0.2010 0.2338 0 0 0.2094 0 0.0578 0 0 0.1024 0.0937 0 0.0635 0 0.0982 0.0779 0.0424 0.0424 0.1218 0.0577 0.0054 0.0187 0 0.1165 0.0438 0.0833 )

4.5. Determine the Positive Ideal Solution and the Negative Ideal Solution

For seven sub-criteria, C1, C3, C4, C5, and C6 are benefit-type criteria, while C2 and C7 are cost-type criteria. Thus, J 1 = ( C 1 , C 3 , C 4 , C 5 , C 6 ) , and J 2 = ( C 2 , C 7 ) . According to Equation (8), the positive ideal solution C + and the negative ideal solution C can be calculated, which are:
{ C + = ( 0.0877 , 0 , 0.2010 , 0.2338 , 0.1165 , 0.0937 , 0 ) C = ( 0 , 0.0578 , 0 , 0 , 0 , 0 , 0.2094 )

4.6. Calculate the Distances of Four Power Grid Enterprises from the Positive and Negative Ideal Solution

According to Equations (9) and (10), the distances of four power grid enterprises from the positive ideal solution and the distances of four power grid enterprises from the negative ideal solution can be calculated, which are:
d 1 + = 0.2588 , d 2 + = 0.3261 , d 3 + = 0.2417 , d 4 + = 0.3135 ; d 1 = 0.3220 , d 2 = 0.2512 , d 3 = 0.1854 , d 4 = 0.1945 .

4.7. Calculate the Closeness Coefficients of Four Power Grid Enterprises and Rank

According to Equation (11), the closeness coefficients of four power grid enterprises can be computed, which are:
C C 1 = 0.5544 , C C 2 = 0.4352 , C C 3 = 0.4340 , C C 4 = 0.3828 .
The closeness coefficients of four power grid enterprises are ranked in decreasing order as:
C C 1 C C 2 C C 3 C C 4
Therefore, it can be seen that power grid enterprise A1 obtains the maximum closeness coefficient, which indicates it has the best operation performance, followed by A2, A3, and A4 in sequence.
To further test the empirical ranking result, the sub-criteria performances of these four power grid enterprises and the sub-criteria weights will be analyzed in detail. Figure 2 depicts the sub-criteria performances of four power grid enterprises, which are drawn based on the normalized sub-criteria values. For Figure 2, the larger the values of sub-criteria C1, C3, C4, C5, and C6, the better the operation performance of the power grid enterprise; while the smaller the values of sub-criteria C2 and C7, the better the operation performance of the power grid enterprise. The weights of the sub-criteria are shown in Figure 3.
It can be seen that for power grid enterprise A1, sub-criteria C1, C3, and C4 (exhibited in Figure 2) show the best performances compared to those of the other three power grid enterprises A2, A3, and A4. Meanwhile, sub-criterion C4 has the maximum weight (i.e., 0.2338), and the weight of sub-criterion C3 is quite large (i.e., 0.2010), only smaller than C4 and C7 (as shown in Figure 3). Although sub-criteria C5, C6, and C7 of power grid enterprise A1 have the worst performances compared with that of the other three power grid enterprises, the weights of sub-criteria C5 and C6 are not large, which are, respectively, 0.1165 and 0.0937. Therefore, considering the criteria performances and weights, the overall operation performance of power grid enterprise A1 is the best. Overall, for power grid enterprise A1, the economic and social criteria obtained better performances, but the environmental criteria have worse performances. It should be noted that power grid enterprise A1 needs to improve the performances of environmental criteria in the near future. For example, it should perform a technological transformation on electrical equipment or purchase low-emission electrical equipment in order to reduce the SF6 gas emission. Meanwhile, it can also purchase more new energy power generation from other regions if the power transmission channel is allowed.

5. Conclusions

Currently, electricity market reform is in progress in China, and many electricity-selling enterprises have been founded in some regions, such as Beijing city, Shanxi province, and Chongqing city. Moreover, transmission and distribution tariff reform is also underway. The new electricity market environment requires power grid enterprises to adjust their operating strategies and enhance operation performance. In this paper, a hybrid framework for operation performance evaluation of a power grid enterprise is proposed from the perspective of sustainability, which employs the latest BWM to determine the weights of criteria and the TOPSIS method to rank operation performance of a power grid enterprise. The empirical analysis indicates that power grid enterprise A1 has the best operation performance, followed by A2, A3, and A4. Moreover, sub-criteria ‘power supply reliability rate’ obtains the maximum weight, and the weights of sub-criteria ‘SF6 gas emission’ and ‘return on equity’ are also quite large. These sub-criteria have strong impacts on operation performance evaluation of a power grid enterprise.
This proposed hybrid BWM-TOPSIS-based framework for operation performance evaluation of a power grid enterprise is reasonable and practical. In future research, other MCDM methods, such as AHP and VIKOR, can be employed to evaluate the operation performance of a power grid enterprise, and the ranking results can also be compared with that of the BWM-TOPSIS-based ranking result. Lastly, what needs illustration is that the evaluation index system for operation performance of a power grid enterprise should be updated with the deepening of the electricity market reform and the change of the social environment.

Acknowledgments

This study is supported by the Science and Technology Project of the State Grid Corporation of China (SGERI07KJ201737), the Fundamental Research Funds for the Central Universities (2017MS060), the Beijing Social Science Foundation Project (17GLC042), and the Beijing Excellent Talents Training Program (2017000020124G189).

Author Contributions

Peipei You and Sen Guo designed and proposed the concept of this research. Sen Guo and Haoran Zhao completed the paper. Huiru Zhao gave some constructive suggestions.

Conflicts of Interest

The authors declare no conflict of interest.

References

  1. Sun, W.; Xu, Y. Financial security evaluation of the electric power industry in China based on a back propagation neural network optimized by genetic algorithm. Energy 2016, 101, 366–379. [Google Scholar] [CrossRef]
  2. Zhao, H.; Guo, S.; Zhang, Q.; Li, C. Social Welfare Evaluation of Electric Universal Service in China: From the Perspective of Sustainability. Sustainability 2014, 6, 4949–4965. [Google Scholar] [CrossRef]
  3. Tang, Y.; Cao, J.; Guo, C.; Cao, Y.; Han, Z. Research and Implementation of Power Grid Enterprise Application Integration Based on Services-oriented Architecture. Autom. Electr. Power Syst. 2008, 32, 50–54. [Google Scholar]
  4. Meng, Y.-T.; Wu, J.-F.; Wang, F. Study on Reform of Cost Management and Control for Power Grid Enterprise. Electr. Power Technol. Econ. 2006, 2, 62–65. [Google Scholar]
  5. Guo, S.; Zhao, H.; Zhao, H. The Most Economical Mode of Power Supply for Remote and Less Developed Areas in China: Power Grid Extension or Micro-Grid? Sustainability 2017, 9, 910. [Google Scholar] [CrossRef]
  6. Bo, Z.; Shaojie, O.; Jianhua, Z.; Hui, S.; Geng, W.; Ming, Z. An analysis of previous blackouts in the world: Lessons for China’ s power industry. Renew. Sustain. Energy Rev. 2015, 42, 1151–1163. [Google Scholar] [CrossRef]
  7. Zheng, Y.; Hu, Z.; Wang, J.; Wen, Q. IRSP (integrated resource strategic planning) with interconnected smart grids in integrating renewable energy and implementing DSM (demand side management) in China. Energy 2014, 76, 863–874. [Google Scholar] [CrossRef]
  8. Shen, J.; Luo, C. Overall review of renewable energy subsidy policies in China—Contradictions of intentions and effects. Renew. Sustain. Energy Rev. 2015, 41, 1478–1488. [Google Scholar] [CrossRef]
  9. Zhao, H.-R.; Guo, S.; Fu, L.-W. Review on the costs and benefits of renewable energy power subsidy in China. Renew. Sustain. Energy Rev. 2014, 37, 538–549. [Google Scholar] [CrossRef]
  10. Zhou, K.; Yang, S. Demand side management in China: The context of China’s power industry reform. Renew. Sustain. Energy Rev. 2015, 47, 954–965. [Google Scholar] [CrossRef]
  11. Zeng, M.; Yang, Y.; Wang, L.; Sun, J. The power industry reform in China 2015: Policies, evaluations and solutions. Renew. Sustain. Energy Rev. 2016, 57, 94–110. [Google Scholar] [CrossRef]
  12. Zhang, S.; Jiao, Y.; Chen, W. Demand-side management (DSM) in the context of China’s on-going power sector reform. Energy Policy 2017, 100, 1–8. [Google Scholar] [CrossRef]
  13. Yu, D.; Qiu, H.; Yuan, X.; Li, Y.; Shao, C.; Lin, Y.; Ding, Y. Roadmap of Retail Electricity Market Reform in China: Assisting in Mitigating Wind Energy Curtailment; IOP Conference Series: Earth and Environmental Science; IOP Publishing: Bristol, UK, 2017; p. 012031. [Google Scholar]
  14. Dong, J.; Huo, H.; Guo, S. Demand Side Management Performance Evaluation for Commercial Enterprises. Sustainability 2016, 8, 1041. [Google Scholar] [CrossRef]
  15. Guo, S.; Zhao, H. Optimal site selection of electric vehicle charging station by using fuzzy TOPSIS based on sustainability perspective. Appl. Energy 2015, 158, 390–402. [Google Scholar] [CrossRef]
  16. Yoon, K.P.; Hwang, C.-L. Multiple Attribute Decision Making: An Introduction; Sage Publications: Thousand Oaks, CA, USA, 1995; Volume 104. [Google Scholar]
  17. Brans, J.-P.; Vincke, P. Note—A Preference Ranking Organisation Method (The PROMETHEE Method for Multiple Criteria Decision-Making). Manag. Sci. 1985, 31, 647–656. [Google Scholar] [CrossRef]
  18. Opricovic, S. Multicriteria Optimization of Civil Engineering Systems. Ph.D. Thesis, Faculty of Civil Engineering, University of Belgrade, Belgrade, Serbia, 1998. [Google Scholar]
  19. Maystre, L.Y.; Pictet, J.; Simos, J. Méthodes Multicritères ELECTRE: Description, Conseils Pratiques et Cas D’application à la Gestion Environnementale; PPUR Presses Polytechniques: Lausanne, Switzerland, 1994; Volume 8. [Google Scholar]
  20. Saaty, T.L. What is the analytic hierarchy process? In Mathematical Models for Decision Support; Springer: Berlin/Heidelberg, Germany, 1988; pp. 109–121. [Google Scholar]
  21. Dai, S.; Niu, D. Comprehensive Evaluation of the Sustainable Development of Power Grid Enterprises Based on the Model of Fuzzy Group Ideal Point Method and Combination Weighting Method with Improved Group Order Relation Method and Entropy Weight Method. Sustainability 2017, 9, 1900. [Google Scholar]
  22. Wang, Q.; Dai, H.-N.; Wang, H. A Smart MCDM Framework to Evaluate the Impact of Air Pollution on City Sustainability: A Case Study from China. Sustainability 2017, 9, 911. [Google Scholar] [CrossRef]
  23. Zhao, H.; Guo, S. Selecting green supplier of thermal power equipment by using a hybrid MCDM method for sustainability. Sustainability 2014, 6, 217–235. [Google Scholar] [CrossRef]
  24. Zavadskas, E.K.; Cavallaro, F.; Podvezko, V.; Ubarte, I.; Kaklauskas, A. MCDM Assessment of a Healthy and Safe Built Environment According to Sustainable Development Principles: A Practical Neighborhood Approach in Vilnius. Sustainability 2017, 9, 702. [Google Scholar] [CrossRef]
  25. Chung, E.-S.; Abdulai, P.J.; Park, H.; Kim, Y.; Ahn, S.R.; Kim, S.J. Multi-criteria assessment of spatial robust water resource vulnerability using the TOPSIS method coupled with objective and subjective weights in the Han River basin. Sustainability 2016, 9, 29. [Google Scholar] [CrossRef]
  26. Lu, C.; Xue, B.; Lu, C.; Wang, T.; Jiang, L.; Zhang, Z.; Ren, W. Sustainability Investigation of Resource-Based Cities in Northeastern China. Sustainability 2016, 8, 1058. [Google Scholar] [CrossRef]
  27. Seçme, N.Y.; Bayrakdaroğlu, A.; Kahraman, C. Fuzzy performance evaluation in Turkish banking sector using analytic hierarchy process and TOPSIS. Expert Syst. Appl. 2009, 36, 11699–11709. [Google Scholar] [CrossRef]
  28. Xu, J.; Jiang, X.; Wu, Z. A Sustainable Performance Assessment Framework for Plastic Film Supply Chain Management from a Chinese Perspective. Sustainability 2016, 8, 1042. [Google Scholar] [CrossRef]
  29. Chang, Y.H.; Shao, P.C.; Chen, H.J. Performance evaluation of airport safety management systems in Taiwan. Saf. Sci. 2015, 75, 72–86. [Google Scholar] [CrossRef]
  30. Zhao, H.; Li, N. Performance evaluation for sustainability of strong smart grid by using stochastic AHP and fuzzy TOPSIS methods. Sustainability 2016, 8, 129. [Google Scholar] [CrossRef]
  31. Rezaei, J. Best-worst multi-criteria decision-making method. Omega 2015, 53, 49–57. [Google Scholar] [CrossRef]
  32. Rezaei, J. Best-worst multi-criteria decision-making method: Some properties and a linear model. Omega 2016, 64, 126–130. [Google Scholar] [CrossRef]
  33. Rezaei, J.; Nispeling, T.; Sarkis, J.; Tavasszy, L. A supplier selection life cycle approach integrating traditional and environmental criteria using the best worst method. J. Clean. Prod. 2016, 135, 577–588. [Google Scholar] [CrossRef]
  34. Hafezalkotob, A.; Hafezalkotob, A. A novel approach for combination of individual and group decisions based on fuzzy best-worst method. Appl. Soft Comput. 2017, 59, 316–325. [Google Scholar] [CrossRef]
  35. Ren, J.; Liang, H.; Chan, F.T. Urban sewage sludge, sustainability, and transition for Eco-City: Multi-criteria sustainability assessment of technologies based on best-worst method. Technol. Forecast. Soc. Chang. 2017, 116, 29–39. [Google Scholar] [CrossRef]
  36. Guo, S.; Zhao, H. Fuzzy best-worst multi-criteria decision-making method and its applications. Knowl. Based Syst. 2017, 121, 23–31. [Google Scholar] [CrossRef]
  37. Ahmadi, H.B.; Kusi-Sarpong, S.; Rezaei, J. Assessing the social sustainability of supply chains using Best Worst Method. Resour. Conserv. Recycl. 2017, 126, 99–106. [Google Scholar] [CrossRef]
  38. Chitsaz, N.; Azarnivand, A. Water scarcity management in arid regions based on an extended multiple criteria technique. Water Resour. Manag. 2017, 31, 233–250. [Google Scholar] [CrossRef]
  39. Gupta, H. Evaluating service quality of airline industry using hybrid best worst method and VIKOR. J. Air Transp. Manag. 2017, in press. [Google Scholar] [CrossRef]
  40. Salimi, N.; Rezaei, J. Measuring efficiency of university-industry Ph.D. projects using best worst method. Scientometrics 2016, 109, 1911–1938. [Google Scholar] [CrossRef] [PubMed]
  41. Salimi, N.; Rezaei, J. Evaluating firms’ R&D performance using best worst method. Eval. Program Plan. 2018, 66, 147–155. [Google Scholar]
  42. Wang, E. Benchmarking whole-building energy performance with multi-criteria technique for order preference by similarity to ideal solution using a selective objective-weighting approach. Appl. Energy 2015, 146, 92–103. [Google Scholar] [CrossRef]
  43. Hwang, C.-L.; Lai, Y.-J.; Liu, T.-Y. A new approach for multiple objective decision making. Comput. Oper. Res. 1993, 20, 889–899. [Google Scholar] [CrossRef]
Figure 1. Evaluation index system for operation performance of a power grid enterprise from the perspective of sustainability.
Sustainability 09 02329 g001
Figure 2. The sub-criteria performances of four power grid enterprises.
Sustainability 09 02329 g002
Figure 3. The weights of seven sub-criteria.
Sustainability 09 02329 g003
Table 1. CI table.
Table 1. CI table.
a B W 123456789
CI0.000.441.001.632.303.003.734.475.23
Table 2. Actual values of seven sub-criteria for different power grid enterprises.
CriteriaSub-CriteriaA1A2A3A4
EconomyOverall labor productivity (C1)5989570359105891
Asset-liability ratio (C2)62.2863.9160.7961.08
Return on equity (C3)18.0117.5817.7917.62
SocietyPower supply reliability rate (C4)99.9899.9599.9699.95
Timely handling rate of customer complaint (C5)98.2398.5298.3598.56
EnvironmentPurchasing rate of new energy power generation (C6)5.049.136.896.95
SF6 gas emission (C7)3150125523572009
Table 3. The preferences of the best criterion over all criteria by three expert groups.
DM1C1C2C3C4C5C6C7
Best criterion: C33512473
DM2C1C2C3C4C5C6C7
Best criterion: C44821352
DM3C1C2C3C4C5C6C7
Best criterion: C79653431
Table 4. The preferences of all criteria over the worst criterion by three expert groups.
DM1Worst Criterion: C6DM2Worst Criterion: C2DM3Worst Criterion: C1
C13C13C11
C22C21C22
C37C35C33
C45C48C45
C53C55C54
C61C63C65
C73C76C79

