Household Energy Consumption Behaviour for Different Demographic Regions in Thailand from 2000 to 2010

Abstract
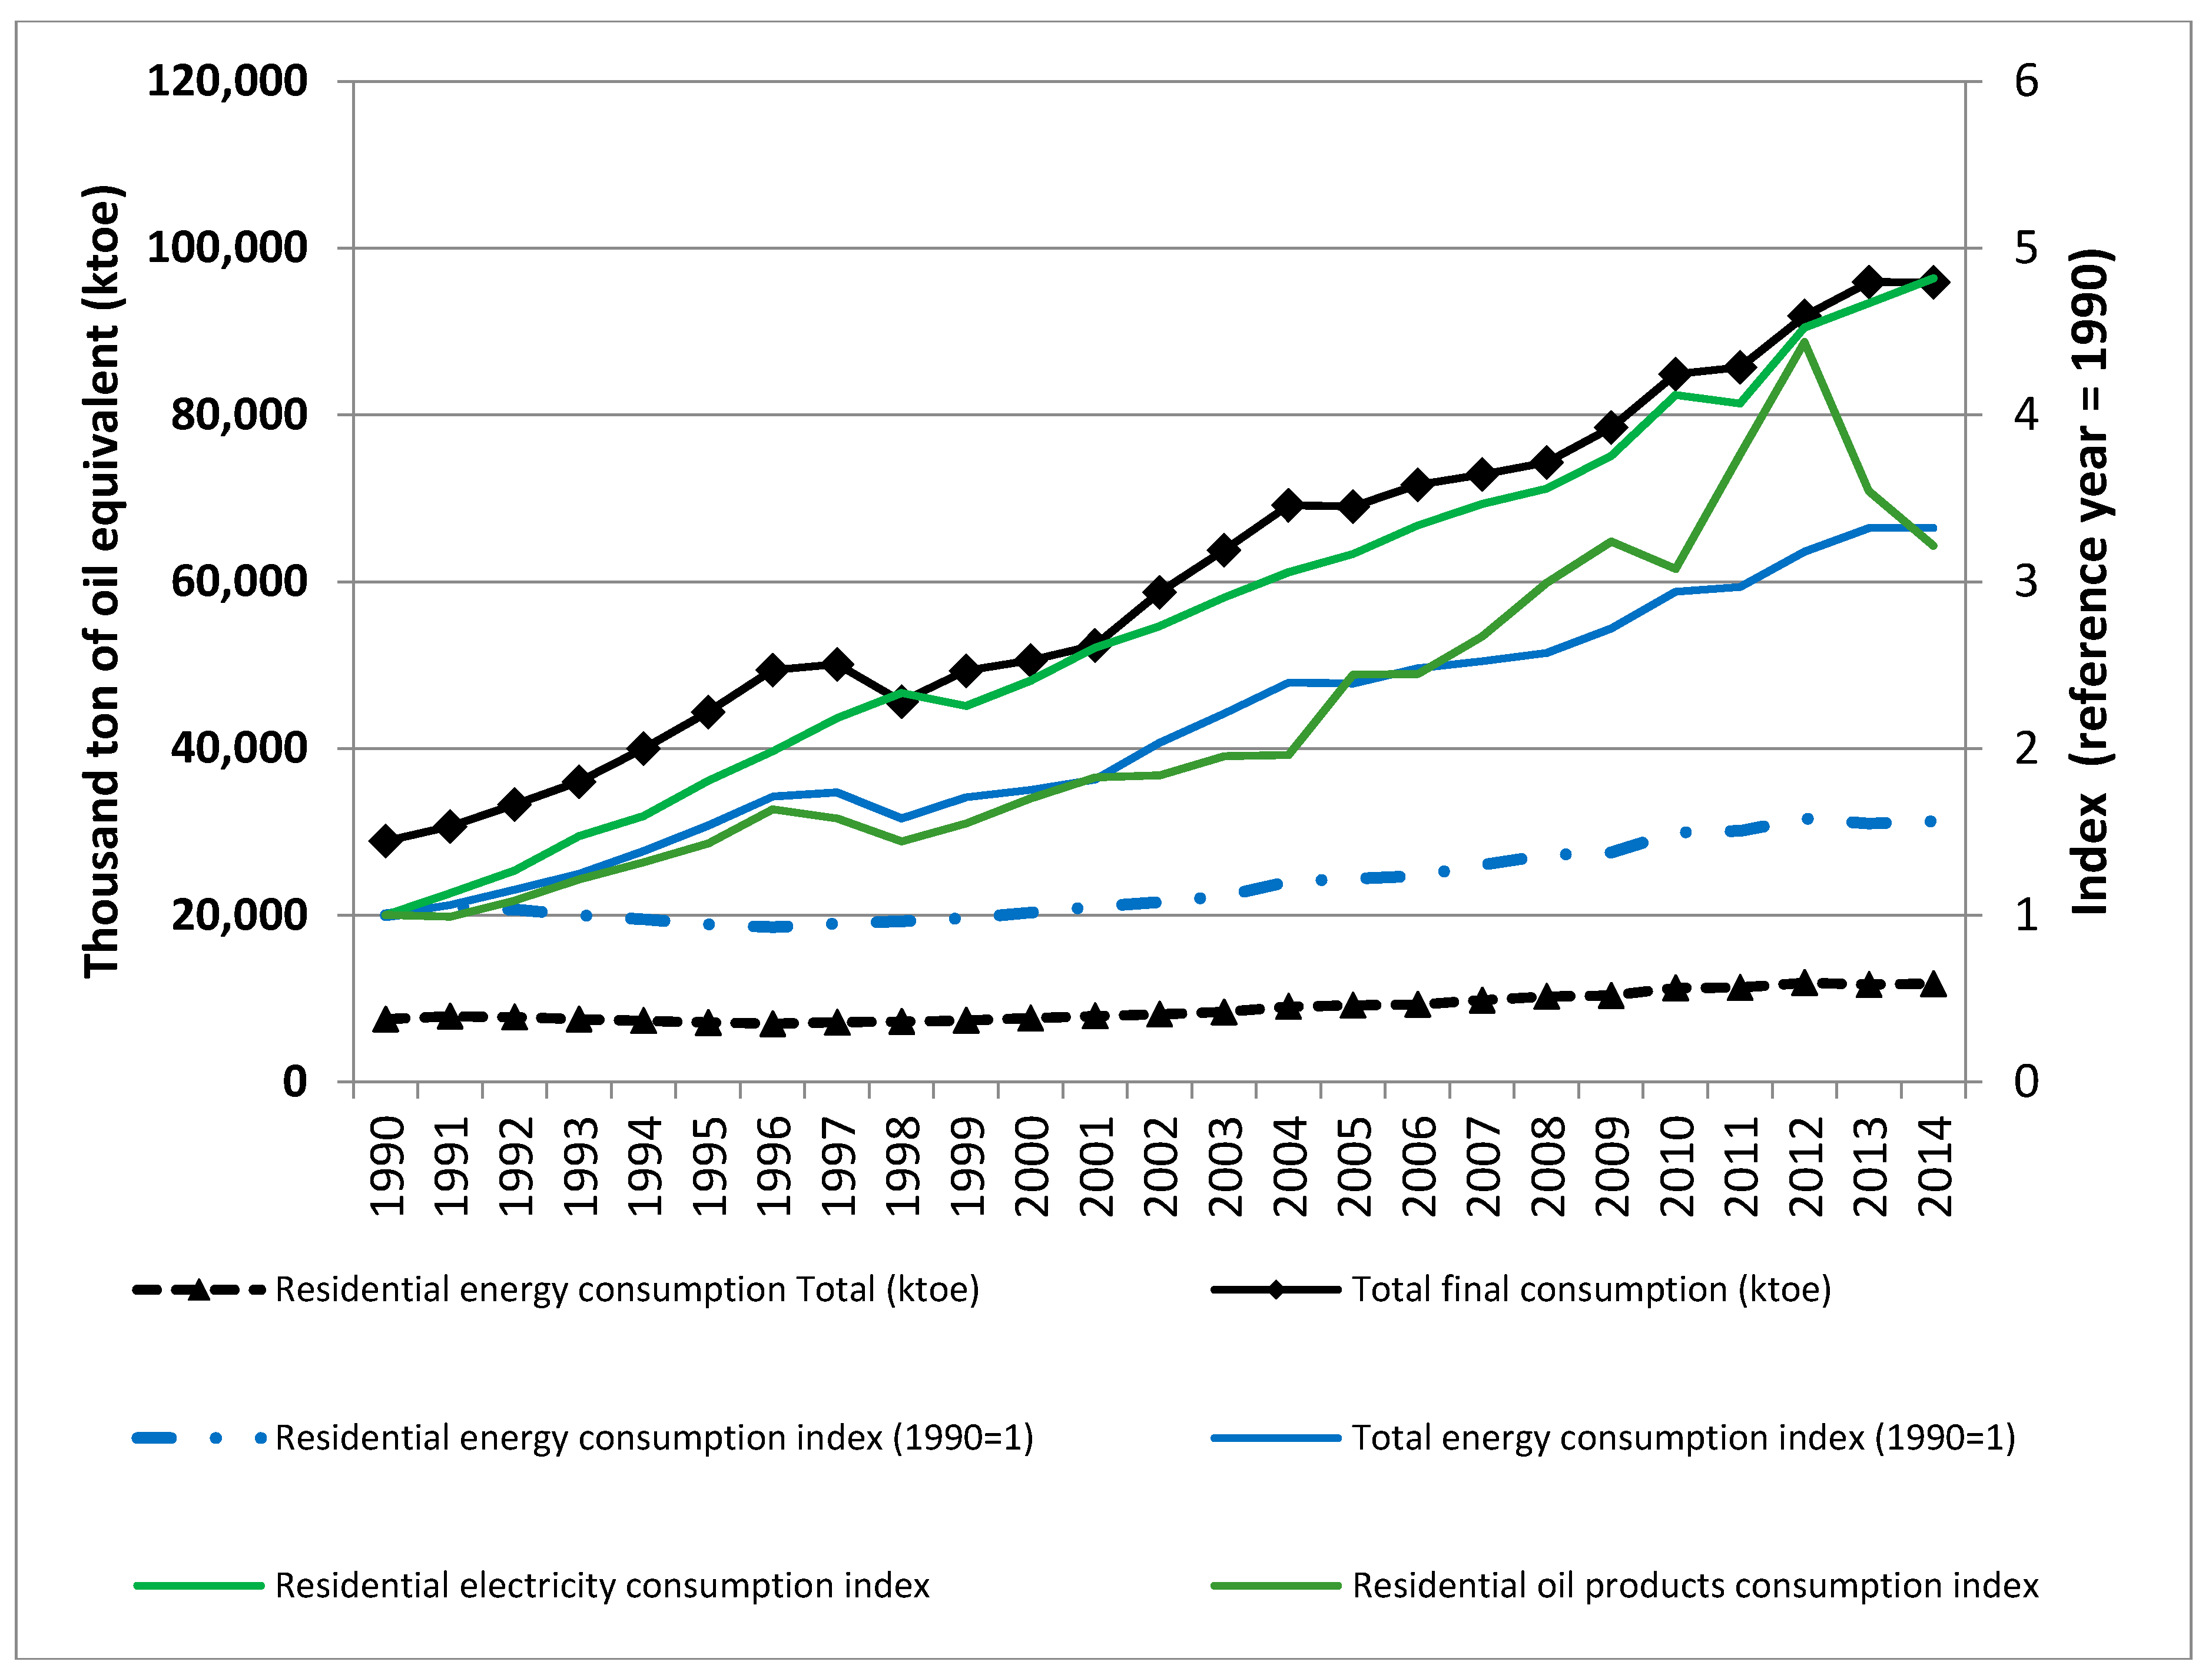
:1. Introduction
2. Literature Reviews
2.1. Factors Influencing Changes in REC
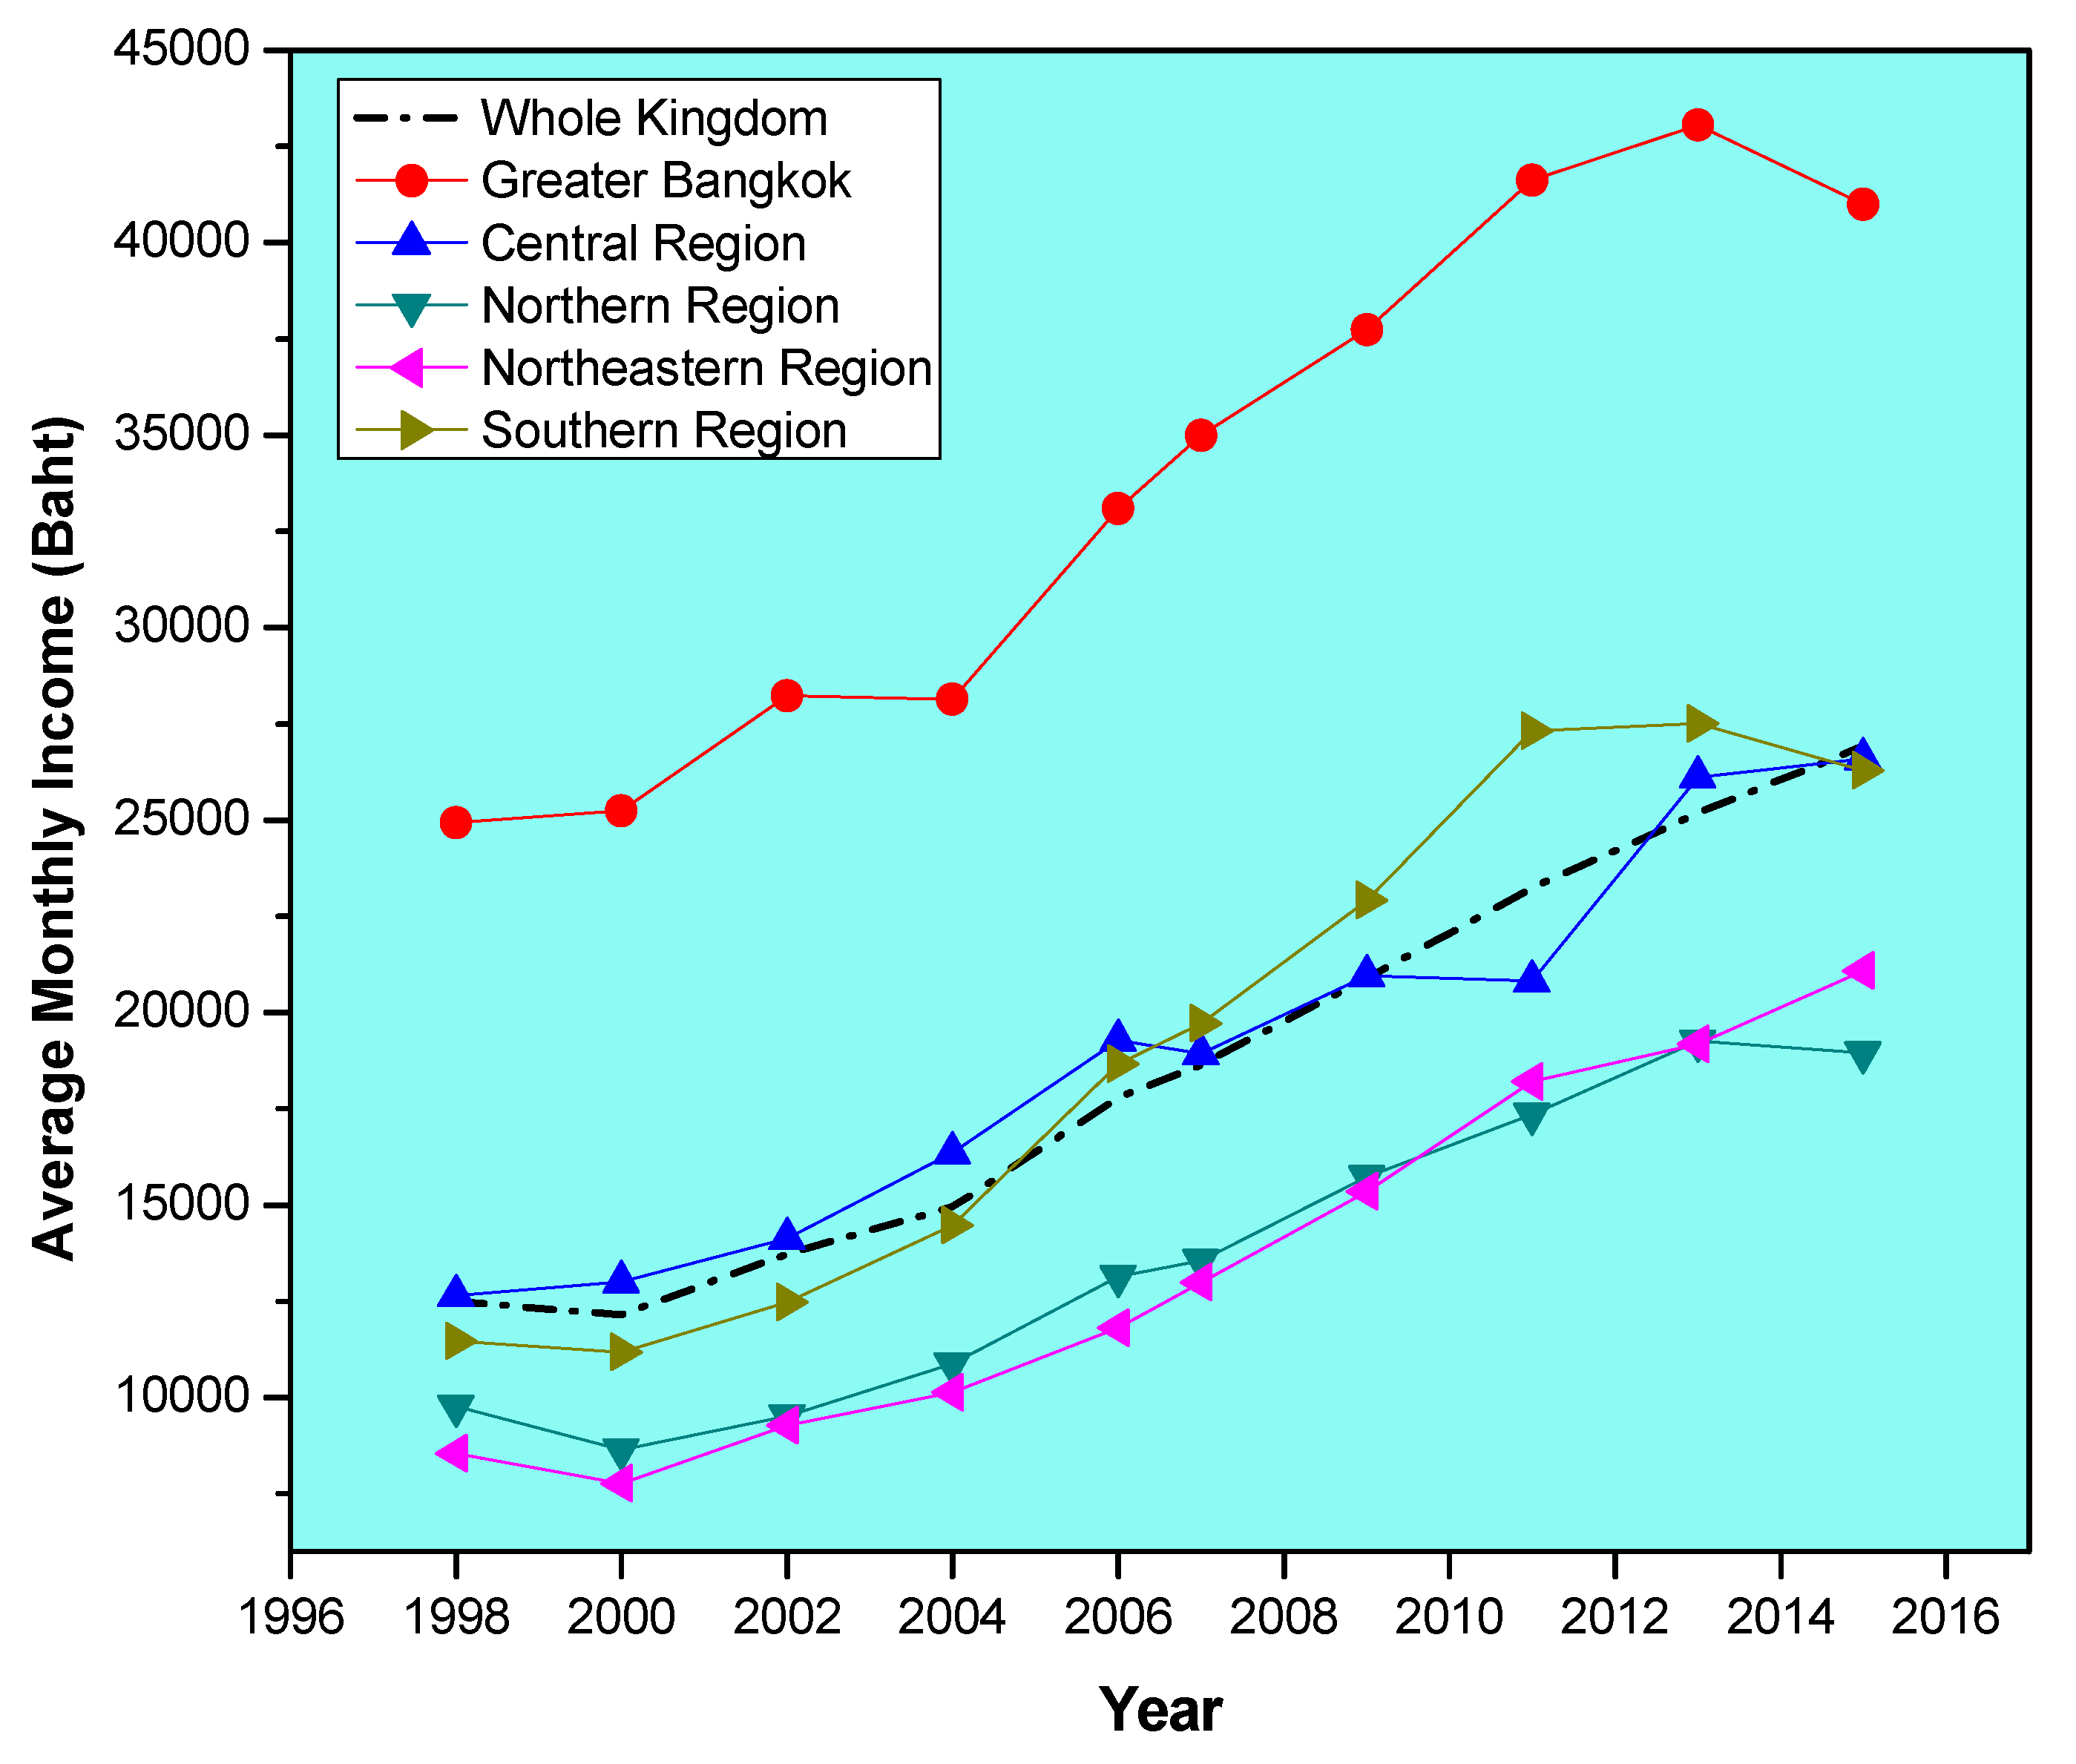
2.1.1. Economic Factors
2.1.2. Socioeconomic–Demographic Factors
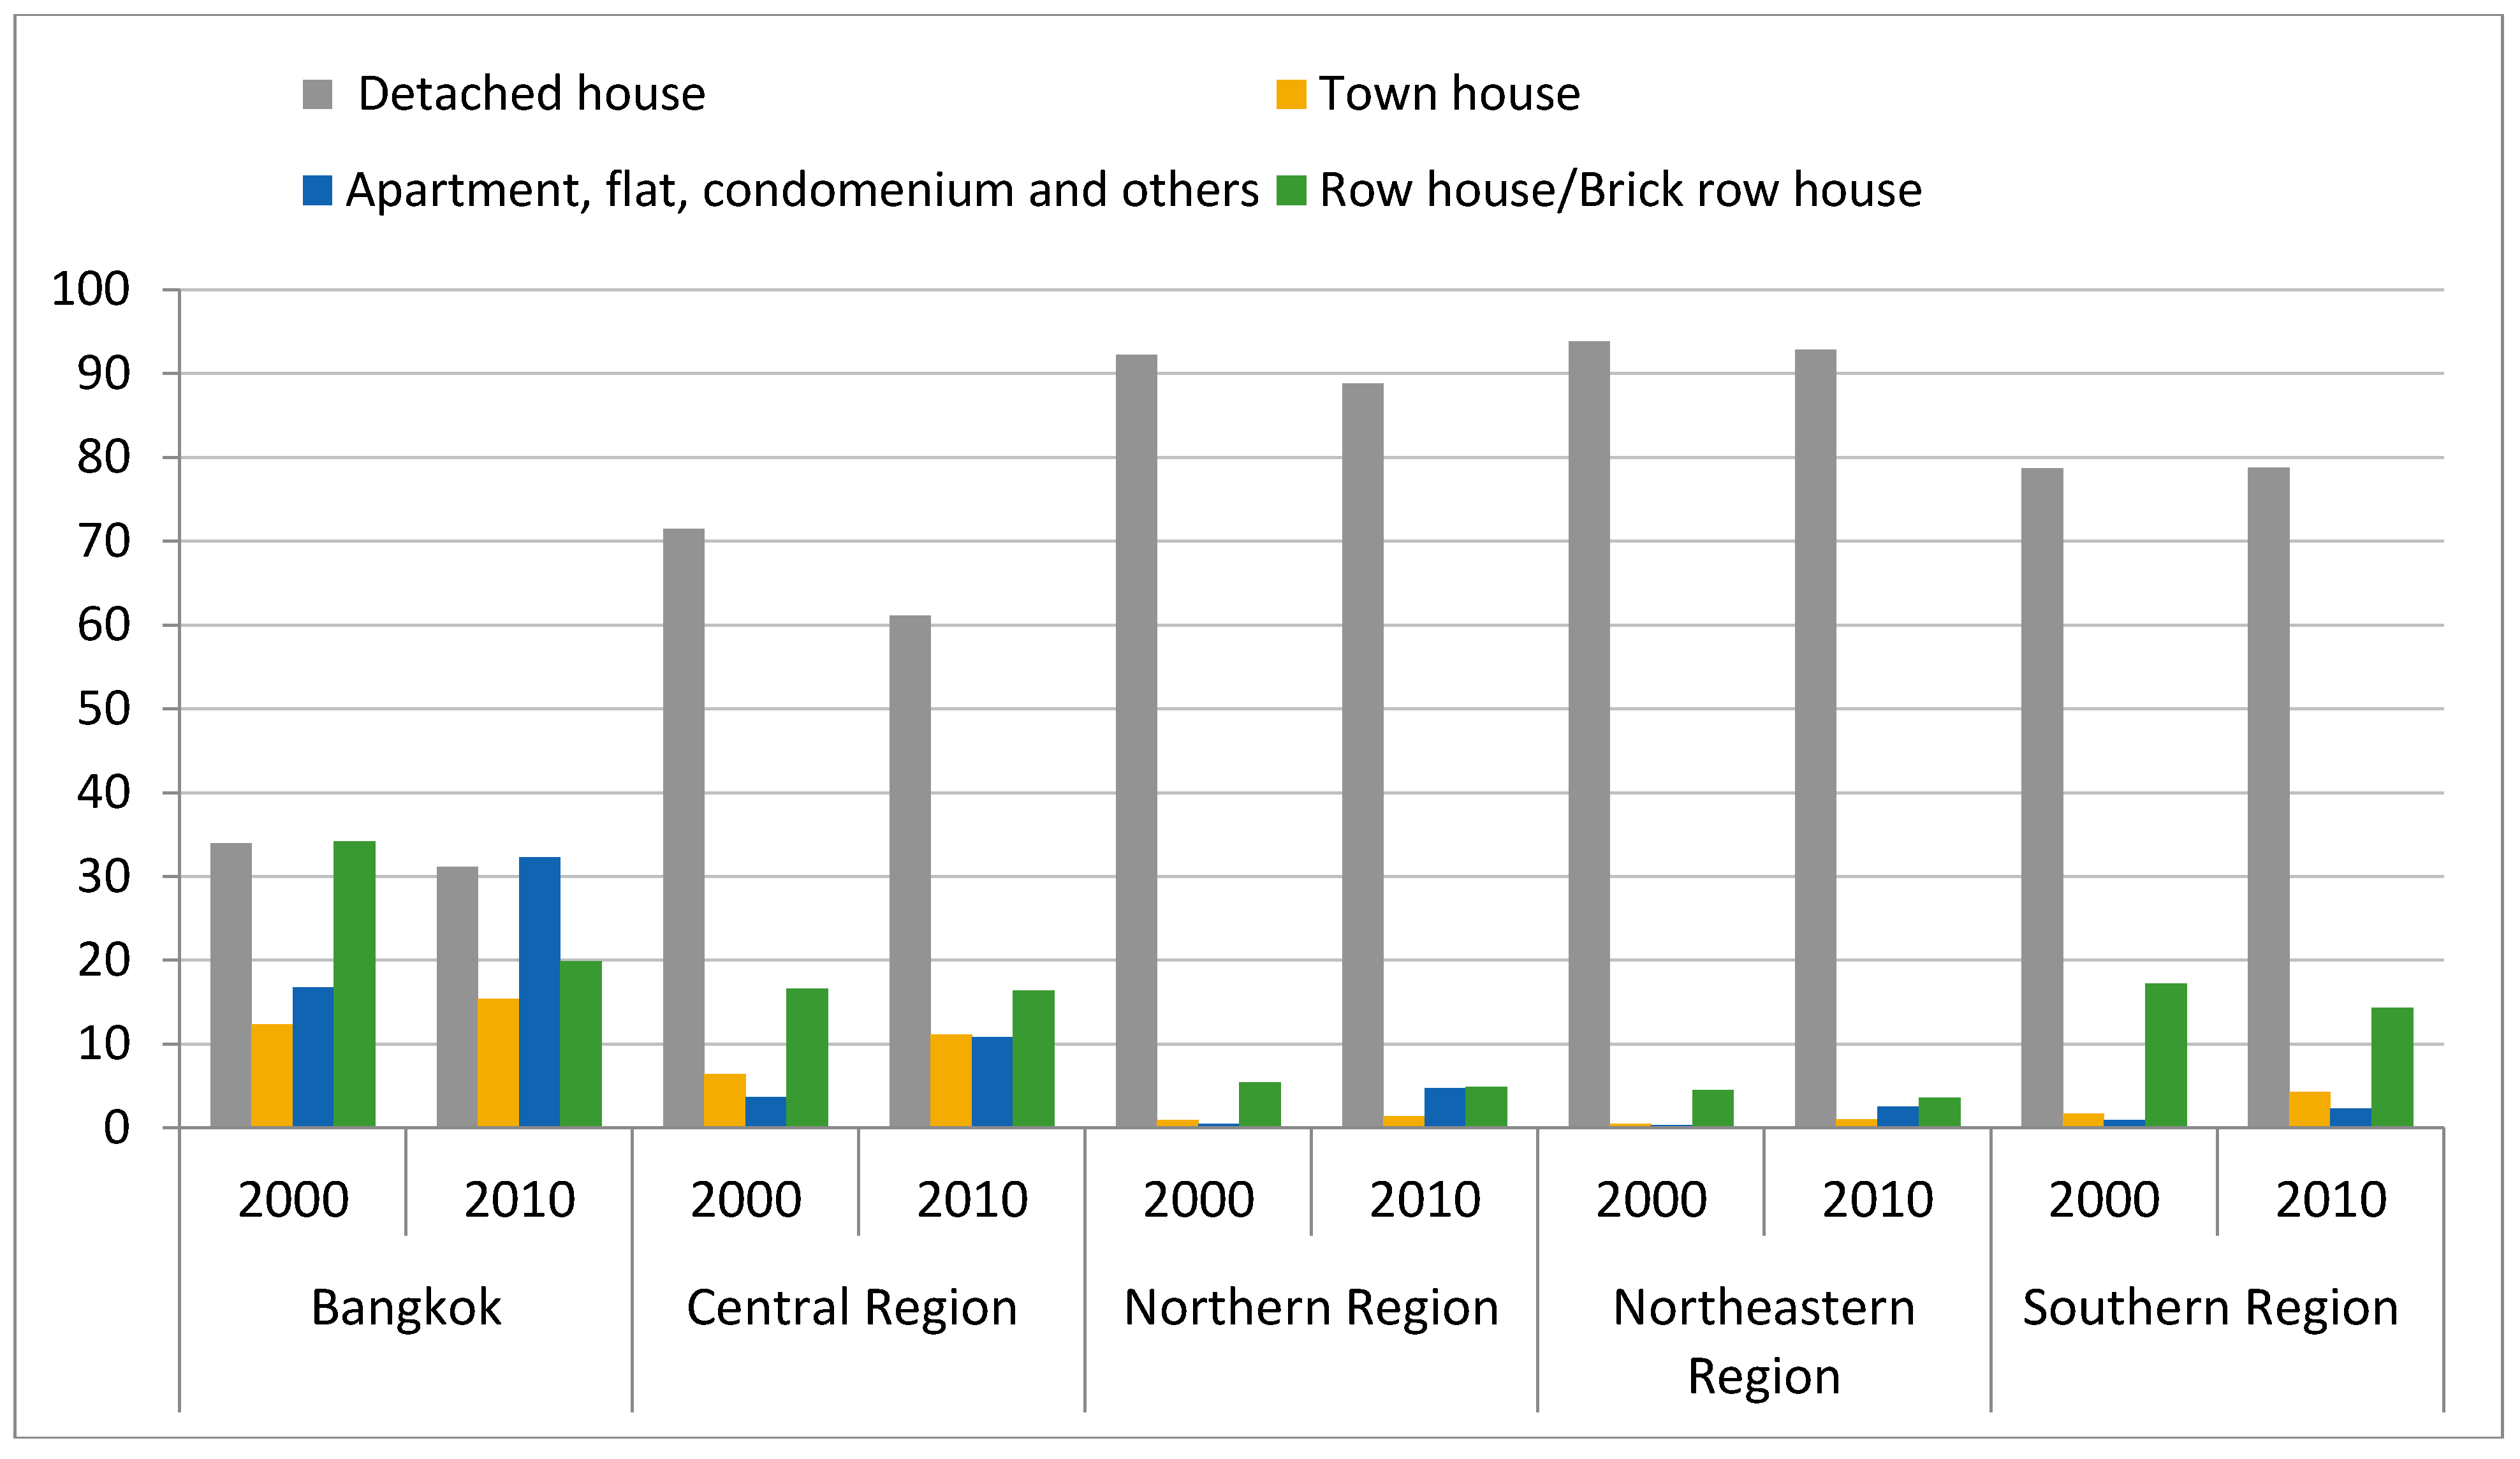
2.1.3. Geographic Factors
2.2. Input–Output Analysis and Structural Decomposition Analysis of Changes in Energy Consumption
3. Methodology
3.1. Energy Input–Output Analysis
3.2. SDA of Change in Energy Consumption
= (1/2) (ηLd,t2 + ηLd,t1) (Δfhh) + (1/2) (ΔηLd) (fhh,t2 + fhh,t1),
(1/4) Δη (Ld,t2 + Ld,t1) (fhh,t2 + fhh,t1) +
(1/4) (ηt2 + ηt1) ΔLd (fhh,,t2 + fhh,t1).
= [(1/2) (Δβ) (μӨswt2 + μӨswt1)] +
[(1/4) (βt2 + βt1) (Δμ) (Өswt2 + Өswt1)] +
[(1/8) (βt2 + βt1) (μt2 + μt1) (ΔӨ) (swt2 + swt1)] +
[(1/16) (βt2 + βt1) (μt2 + μt1) (Өt2 + Өt1) (Δs) (wt2 + wt1)] +
[(1/16) (βt2 + βt1) (μt2 + μt1) (Өt2 + Өt1) (st2 + st1) (Δw)]
(1/4) (ηt2 + ηt1) ΔLd(fhh,,t2 + fhh,t1) +
(1/4) [(ηLd,t2 + ηLd,t1) (Δβ) (μӨswt2 + μӨswt1)] +
(1/8) [(ηLd,t2 + ηLd,t1) (βt2 + βt1) (Δμ) (Өswt2 + Өswt1)] +
(1/16) [(ηLd,t2 + ηLd,t1) (βt2 + βt1) (μt2 + μt1) (ΔӨ) (swt2 + swt1)] +
(1/32) [(ηLd,t2 + ηLd,t1) (βt2 + βt1) (μt2 + μt1) (Өt2 + Өt1) (Δs) (wt2 + wt1)] +
(1/32) [(ηLd,t2 + ηLd,t1) (βt2 + βt1) (μt2 + μt1) (Өt2 + Өt1) (st2 + st1) (Δw)]
4. Data
5. Result and Discussions
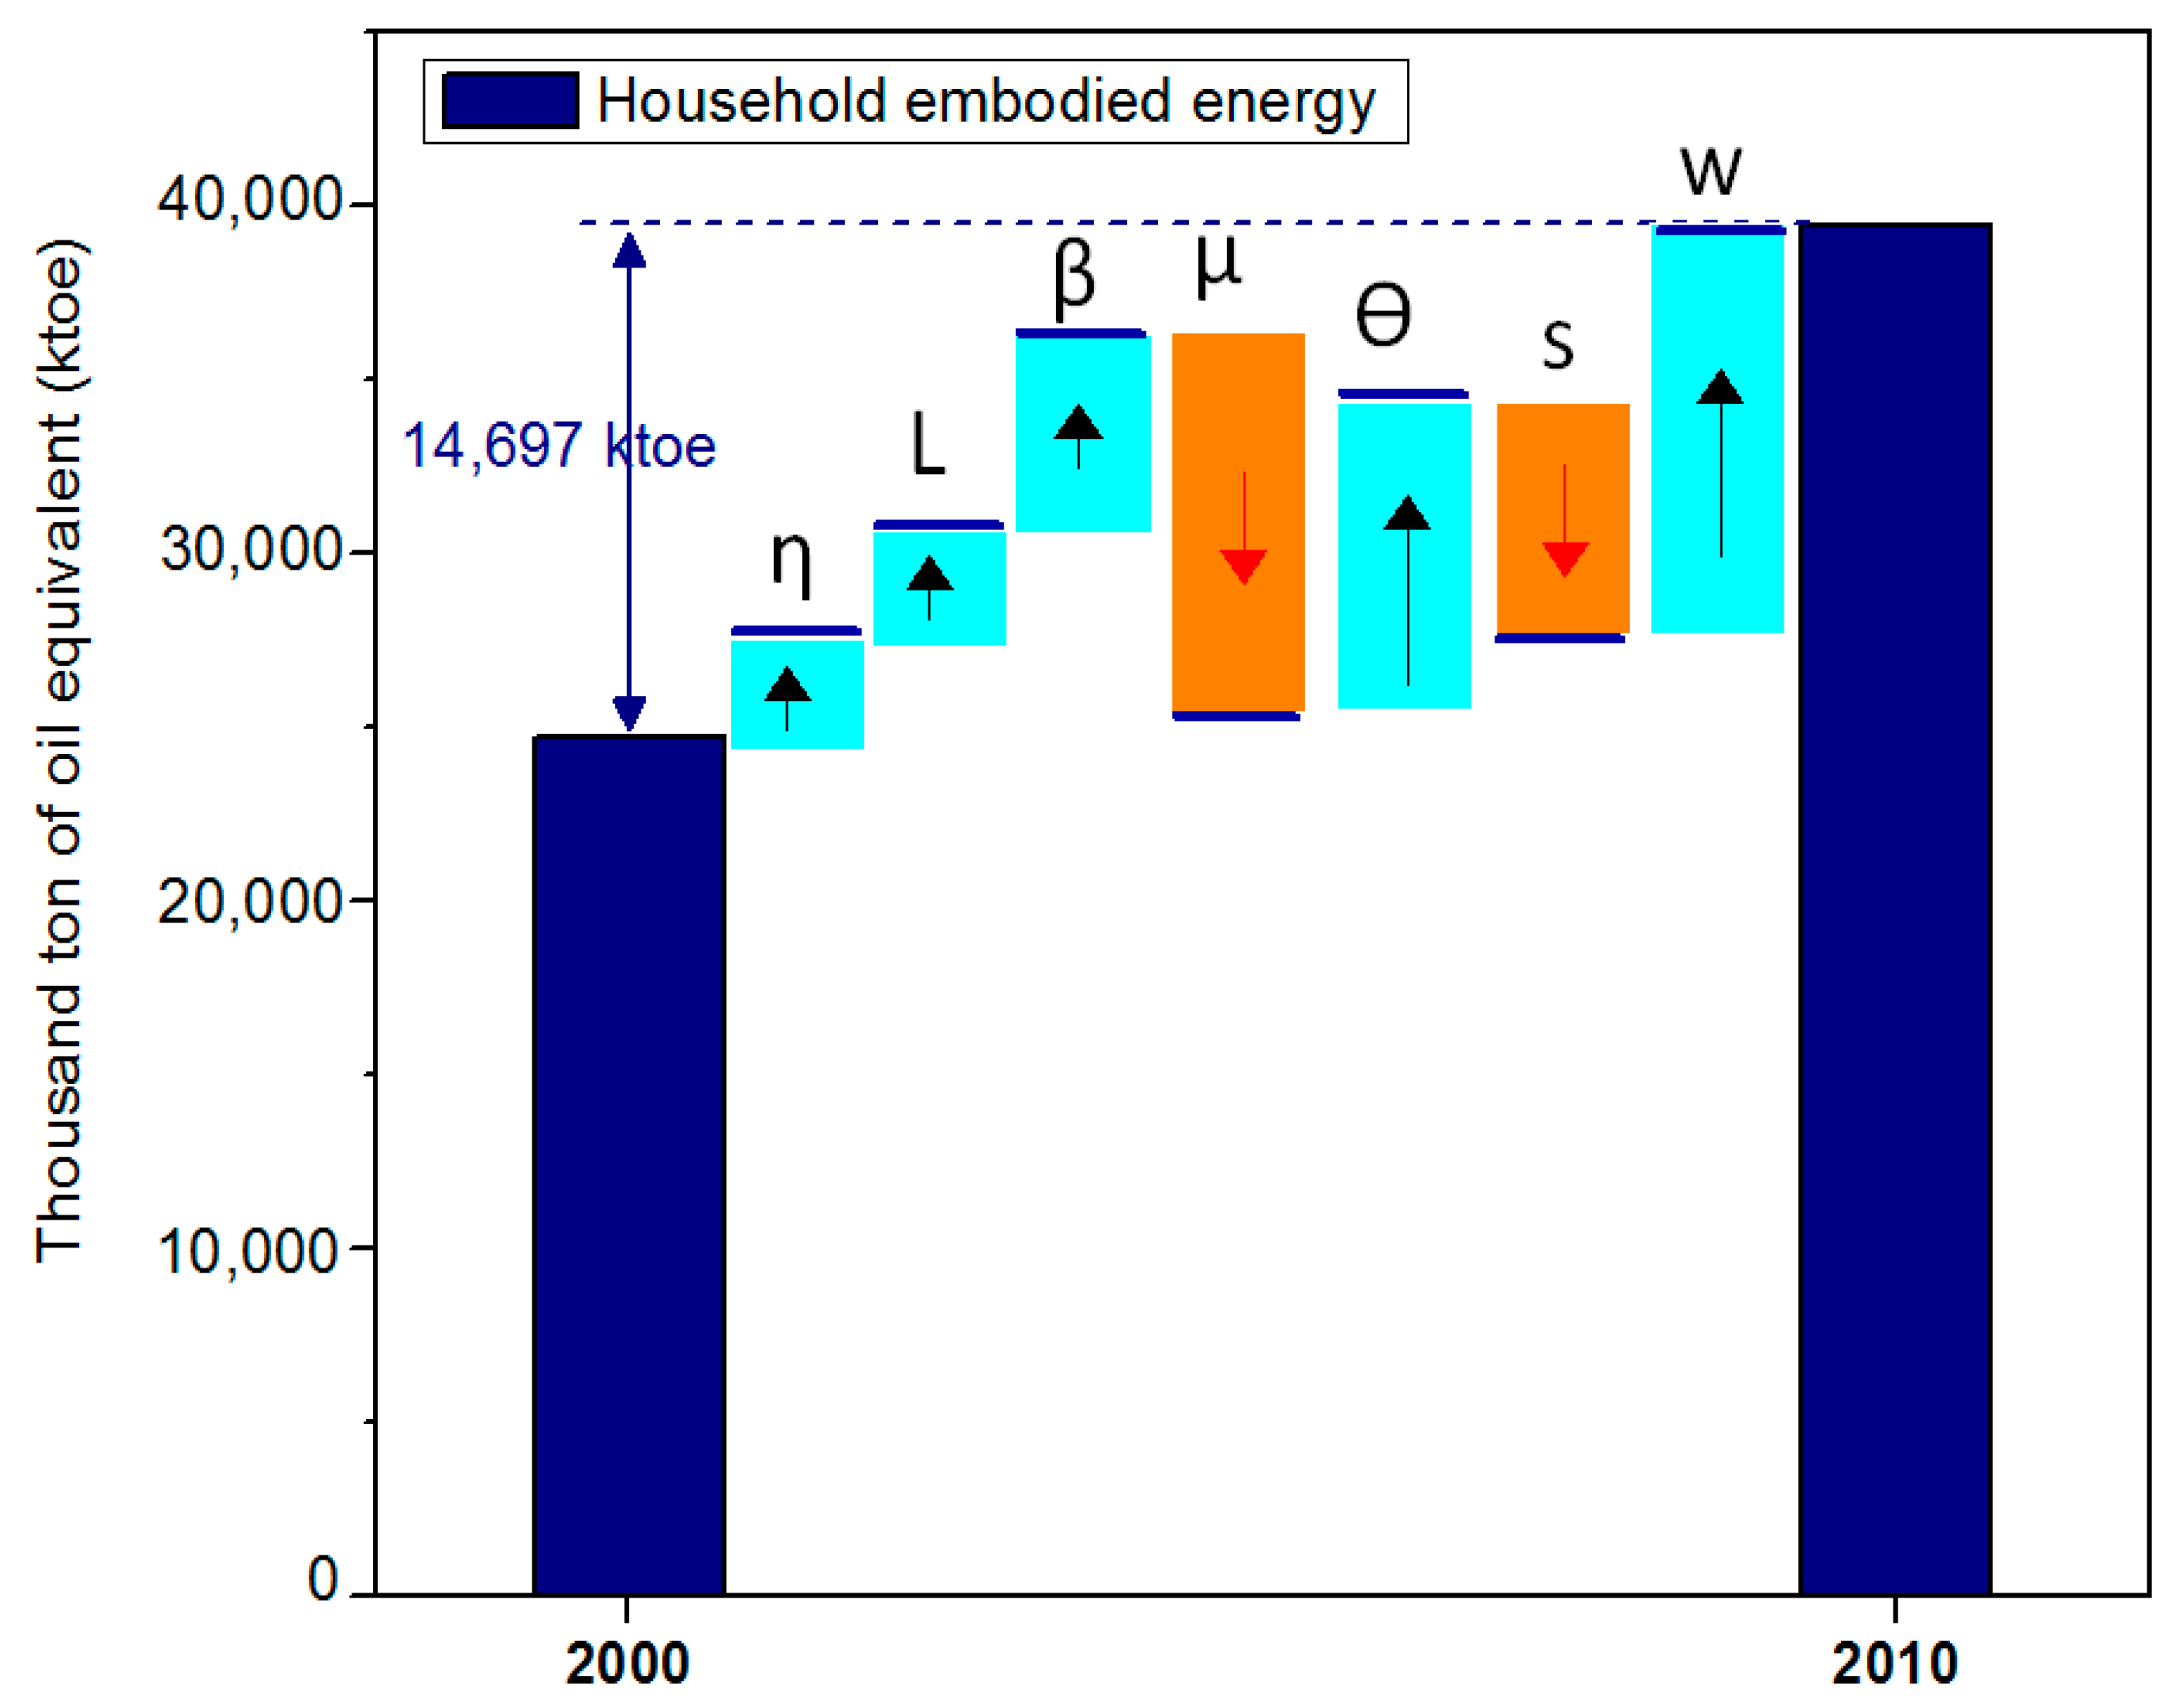
5.1. Total Household Energy Consumption and Decomposition
5.2. Drivers of Changes in Energy Consumption
5.2.1. Greater Bangkok Region
5.2.2. Central Region
5.2.3. Northern Region
5.2.4. Northeastern Region
5.2.5. Southern Region
6. Conclusions and Policy Implications
Acknowledgments
Author Contributions
Conflicts of Interest
Abbreviations
| CPA | Classification of Products by Activity |
| DEDE | Department of Alternative Energy Development and Efficiency |
| EIA | Energy Information Administration |
| EPPO | Energy Policy and Planning Office |
| IDA | Index Decomposition Analysis |
| IEA | International Energy Agency |
| NESDB | National Economic and Social Development Board |
| NSO | National Statistics Office |
| REC | Residential Energy Consumption |
| SDA | Structural Decomposition Analysis |
Appendix A


| Entire Kingdom | Greater Bangkok | Central Region | Northern Region | Northeastern Region | Southern Region | |
|---|---|---|---|---|---|---|
| Equation | Y = a + b*X | |||||
| a | 9026.7 | 21,572 | 10,075 | 6655.1 | 4960 | 7594.2 |
| b | 1741.3 | 2224.5 | 1601.7 | 1278.3 | 1541.6 | 2110.7 |
| R2 | 0.978 | 0.947 | 0.951 | 0.946 | 0.955 | 0.940 |
| Average 2010 income | 22,086.45 | 38,255.75 | 22,087.75 | 16,242.45 | 16,522 | 23,424.45 |
Appendix B
| Year | Greater Bangkok | Central Region | Northern Region | Northeastern Region | Southern Region | Data Source | |
|---|---|---|---|---|---|---|---|
| Population (thousand) | 2000 | 8813.9 | 11, 607.8 | 11,367.8 | 20,759.9 | 8057.5 | [56] |
| 2010 | 12,795.1 | 13,693.4 | 11,656.0 | 18,966.1 | 8871.0 | [56] | |
| Number of households (thousand) | 2000 | 2393.0 | 3109.8 | 3158.4 | 5019.7 | 1979.8 | [56] |
| 2010 | 4520.9 | 4348.9 | 3771.5 | 5372.7 | 2509.5 | [56] | |
| Average household size | 2000 | 3.7 | 3.7 | 3.6 | 4.1 | 4.1 | (1) |
| 2010 | 2.8 | 3.1 | 3.1 | 3.5 | 3.5 | (1) | |
| Population Density (per sq. km.) | 2000 | 1867 | 117 | 67 | 123 | 114 | (2) |
| 2010 | 2710 | 138 | 69 | 112 | 125 | (2) |
Appendix C

Appendix D
| Type | Capacity (BTU) | Cost (Baht) | EER (BTU/Hr/W) | Data Source |
|---|---|---|---|---|
| Year 2010 | ||||
| Regular air-conditioning split type Label#5 | 18,000 | 20,000 | 11.2 | [61] |
| Inverter system | 18,000 | 25,000 | 12.0 | [61] |
| Evaporative condensing system | 18,000 | 29,000 | 15.5 | [61] |
| Year 2017 | ||||
| Regular air-conditioning split type Label#5 | ||||
| MITSUBISHI MS-GN18VF | 18,000 | 28,800 | 13.1 | (1) |
| DAIKIN ATM18MV2S | 18,000 | 24,900 | 13.4 | (1) |
| ELECTROLUX ESM18CRN-A1 | 18,000 | 27,000 | 12.2 | (1) |
| Inverter system | ||||
| MITSUBISHI MSY-GN18VF | 18,000 | 33,000 | 21.1 | (1) |
| DAIKIN FTKM18NV2S | 18,000 | 38,700 | 15.1 | (1) |
| ELECTROLUX ESV18CRN-A1 | 18,000 | 33,900 | 18.1 | (1) |
References
- Department of Alternative Energy Development and Efficiency (DEDE). Table of Thailand Energy Balance 2015. Available online: http://www.dede.go.th/ewt_w3c/ewt_news.php?nid=42079 (accessed on 16 May 2017).
- Energy Policy and Planning Office (EPPO). Thailand 20-Year Energy Efficiency Development Plan (2011–2030). Available online: http://www.eppo.go.th/index.php/en/policy-and-plan/en-tieb/tieb-eep (accessed on 20 May 2017).
- Energy Policy and Planning Office (EPPO). Alternative Energy Development Plan 2015. Available online: http://www.eppo.go.th/images/POLICY/ENG/AEDP2015ENG.pdf (accessed on 20 May 2017).
- Lin, B.; Liu, H. A study on the energy rebound effect of China’s residential building energy efficiency. Energy Build. 2015, 86, 608–618. [Google Scholar] [CrossRef]
- Yu, B.; Zhang, J.; Fujiwara, A. Evaluating the direct and indirect rebound effects in household energy consumption behavior: A case study of Beijing. Energy Policy 2013, 57, 441–453. [Google Scholar] [CrossRef]
- Ghosh, N.K.; Blackhurst, M.F. Energy savings and the rebound effect with multiple energy services and efficiency correlation. Ecol. Econ. 2014, 105, 55–66. [Google Scholar] [CrossRef]
- Novianto, D.; Gao, W.; Kuroki, S. Review on people’s lifestyle and energy consumption of Asian communities: Case study of Indonesia, Thailand, and China. Energy Power Eng. 2015, 7, 465–476. [Google Scholar] [CrossRef]
- Ding, Y.; Qu, W.; Niu, S.; Liang, M.; Qiang, W.; Hong, Z. Factors influencing the spatial difference in household energy consumption in China. Sustainability 2016, 8, 1285. [Google Scholar] [CrossRef]
- Zhao, C.S.; Shu-wen, N.I.U.; Zhang, X. Effects of household energy consumption on environment and its influence factors in rural and urban areas. Energy Procedia 2012, 14, 805–811. [Google Scholar]
- Zhao, X.; Li, N.; Ma, C. Residential energy consumption in urban China: A decomposition analysis. Energy Policy 2012, 41, 644–653. [Google Scholar] [CrossRef]
- Cellura, M.; Longo, S.; Mistretta, M. Application of the structural decomposition analysis to assess the indirect energy consumption and air emission changes related to Italian households consumption. Renew. Sustain. Energy Rev. 2012, 16, 1135–1145. [Google Scholar] [CrossRef]
- Brounen, D.; Kok, N.; Quigley, J.M. Residential energy use and conservation: Economics and demographics. Eur. Econ. Rev. 2012, 56, 931–945. [Google Scholar] [CrossRef]
- Wei, Y.; Liu, L.; Fan, Y.; Wu, G. The impact of lifestyle on energy use and CO2 emission: An empirical analysis of China’s residents. Energy Policy 2007, 35, 247–257. [Google Scholar] [CrossRef]
- Ekholm, T.; Krey, V.; Pachauri, S.; Riahi, K. Determinants of household energy consumption in India. Energy Policy 2010, 38, 5696–5707. [Google Scholar] [CrossRef]
- Verma, A.; Jaiswal, Y.K.; Wani, K.A. Energy consumption behaviour of an urban residential sector in the northern province of Madhya Pradesh (India). Indoor Built Environ. 2012, 21, 703–709. [Google Scholar] [CrossRef]
- Rosas-Flores, J.A.; Gálvezb, M.D. What goes up: Recent trends in Mexican residential energy use. Energy 2010, 35, 2596–2602. [Google Scholar] [CrossRef]
- Lenzen, M.; Wier, M.; Cohen, C.; Hayami, H.; Pachauri, S.; Schaeffer, R. A comparative multivariate analysis of household energy requirements in Australia, Brazil, Denmark, India and Japan. Energy 2006, 31, 181–207. [Google Scholar] [CrossRef]
- International Energy Agency (IEA). Thailand Energy Balance. Available online: https://www.iea.org/statistics/statisticssearch/report/?country=THAILAND&product=balances&year=2014 (accessed on 22 May 2017).
- Lin, W.; Chen, B.; Luo, S.; Liang, L. Factor analysis of residential energy consumption at the provincial level in China. Sustainability 2014, 6, 7710–7724. [Google Scholar] [CrossRef]
- Pachauri, S.; Spreng, D. Direct and indirect energy requirements of households in India. Energy Policy 2002, 30, 511–523. [Google Scholar] [CrossRef]
- Reinders, A.H.M.E.; Vringer, K.; Blok, K. The direct and indirect energy requirement of households in the European Union. Energy Policy 2003, 31, 139–153. [Google Scholar] [CrossRef]
- Li, K.; Lin, B. Impacts of urbanization and industrialization on energy consumption/CO2 emissions: Does the level of development matter? Renew. Sustain. Energy Rev. 2015, 52, 1107–1122. [Google Scholar] [CrossRef]
- Zheng, X.; Wei, C.; Qin, P.; Guo, J.; Yu, Y.; Song, F.; Chen, Z. Characteristics of residential energy consumption in China: Findings from a household survey. Energy Policy 2014, 75, 126–135. [Google Scholar] [CrossRef]
- Chen, J.; Wang, X.; Steemers, K. A statistical analysis of a residential energy consumption survey study in Hangzhou, China. Energy Build. 2013, 66, 193–202. [Google Scholar] [CrossRef]
- Nomura, N.; Ohya, H. Interrelationship of Household Electricity Consumption and Family Member Ages. J. Jpn. Inst. Energy 2001, 80, 727–735. [Google Scholar] [CrossRef]
- Linden, A.L.; Kanyama, A.C.; Eriksson, B. Efficient and inefficient aspects of residential energy behaviour: What are the policy instruments for change? Energy Policy 2006, 34, 1918–1927. [Google Scholar] [CrossRef]
- Sukwan, O. Factors influence electricity consumption in residential sector. J. Ind. Educ. 2013, 7, 93–106. [Google Scholar]
- Tso, G.K.F.; Guan, J. A multilevel regression approach to understand effects of environment indicators and household features on residential energy consumption. Energy 2014, 66, 722–731. [Google Scholar] [CrossRef]
- Zhang, Q. Residential energy consumption in China and its comparison with Japan, Canada, and USA. Energy Build. 2004, 36, 1217–1225. [Google Scholar] [CrossRef]
- U.S. Energy Information Administration (EIA). Drivers of U.S. Household Energy Consumption, 1980–2009; U.S. Energy Information Administration: Washington, DC, USA, 2015.
- Leontief, W. Quantitative input and output relations in the economic system of the United States. Rev. Econ. Stat. 1936, 18, 105–125. [Google Scholar] [CrossRef]
- Miller, R.E.; Blair, P.D. Input–Output Analysis: Foundations and Extensions; Cambridge University Press: Cambridge, UK, 2009. [Google Scholar]
- Bullard, W.; Herendeen, A. The energy cost of goods and services. Energy Policy 1975, 3, 268–278. [Google Scholar] [CrossRef]
- Choi, J.; Bakshi, B.R.; Hubacek, K.; Nader, J. A sequential input–output framework to analyze the economic and environmental implications of energy policies: Gas taxes and fuel subsidies. Appl. Energy 2016, 184, 830–839. [Google Scholar] [CrossRef]
- Hong, J.; Shen, Q.; Xue, F. A multi-regional structural path analysis of the energy supply chain in China’s construction industry. Energy Policy 2016, 92, 56–68. [Google Scholar] [CrossRef]
- Lindner, S.; Guan, D. A hybrid-unit energy input–output model to evaluate embodied energy and life cycle emissions for China’s economy. J. Ind. Ecol. 2014, 18, 201–211. [Google Scholar] [CrossRef]
- Park, H.C.; Heo, E. The direct and indirect household energy requirements in the Republic of Korea from 1980 to 2000—An input–output analysis. Energy Policy 2007, 35, 2839–2851. [Google Scholar] [CrossRef]
- Su, B.; Ang, B.W. Structural decomposition analysis applied to energy and emissions: Some methodological developments. Energy Econ. 2012, 34, 177–188. [Google Scholar] [CrossRef]
- Su, B.; Ang, B.W. Input–output analysis of CO2 emissions embodied in trade: A multi region model for China. Appl. Energy 2014, 114, 377–384. [Google Scholar] [CrossRef]
- Poortinga, W.; Steg, L.; Velek, C.H.; Wiersma, G. Household preferences for energy-saving measures: A conjoint analysis. J. Energy Psychol. 2003, 24, 49–64. [Google Scholar] [CrossRef]
- Su, B.; Ang, B.W.; Li, Y. Input–output and structural decomposition analysis of Singapore’s carbon emissions. Energy Policy 2017, 105, 484–492. [Google Scholar] [CrossRef]
- Peters, G.P.; Weber, C.L.; Guan, D.; Hubacek, K. China’s growing CO2 emissions a race between increasing consumption and efficiency gains. Environ. Sci. Technol. 2007, 41, 5939–5944. [Google Scholar] [CrossRef] [PubMed]
- Wang, C.; Wang, F. Structural decomposition analysis of carbon emissions and policy recommendations for energy sustainability in Xinjiang. Sustainability 2015, 7, 7548–7567. [Google Scholar] [CrossRef]
- Lin, S.M.; Chang, Y.T.; Lin, J.X. Energy and carbon embodied in exports of Taiwan: An input—Output structural decomposition analysis. Taiwan Econ. Rev. 2017. forthcoming. [Google Scholar]
- Supasa, T.; Hsiau, S.S.; Lin, S.M.; Wongsapai, W.; Wu, J.C. Has energy conservation been an effective policy for Thailand? An input–output structural decomposition analysis from 1995 to 2010. Energy Policy 2016, 98, 210–220. [Google Scholar] [CrossRef]
- Zhu, Q.; Peng, X.; Wu, K. Calculation and decomposition of indirect carbon emissions from residential consumption in China based on the input–output model. Energy Policy 2012, 48, 618–626. [Google Scholar] [CrossRef]
- Su, B.; Ang, B.W. Multiplicative decomposition of aggregate carbon intensity change using input—Output analysis. Appl. Energy 2015, 154, 13–20. [Google Scholar] [CrossRef]
- Kok, R.; Benders, R.M.J.; Moll, H.C. Measuring the environmental load of household consumption using some methods based on input–output energy analysis: A comparison of methods and a discussion of results. Energy Policy 2006, 34, 2744–2761. [Google Scholar] [CrossRef]
- Office of the National Economic and Social Development Board (NESDB). Input–Output Table of Thailand. 2016. Available online: http://www.nesdb.go.th (accessed on 5 May 2016).
- Department of Alternative Energy Development and Efficiency (DEDE). Thailand Energy Situation Annual Report 2010 and 2000. Available online: http://www.dede.go.th/ewt_news.php?nid=42079 (accessed on 10 October 2017).
- Bureau of Trade and Economic Indices. Producer Price Index by Product Group Classification of Products by Activity (CPA). Available online: http://www.price.moc.go.th/price/ppi/index_new_e.asp (accessed on 20 June 2015).
- National Statistics Office (NSO). Major Finding of the 2010 Household Socio-Economic Survey. Available online: http://service.nso.go.th/nso/web/survey/surpop2-7-3.html (accessed on 10 May 2017).
- National Statistics Office (NSO). Average Monthly Expenditure per Household by Region and Area: 2000. Available online: http://service.nso.go.th/nso/nso_center/project/search/result_by_department-th.jsp (accessed on 15 May 2017).
- National Statistics Office (NSO). Major Finding of the 2010 Household Energy Consumption. Available online: http://www.nso.go.th/sites/2014en/Pages/Statistical%20Themes/Population-Society/Population-Housing/Household-Energy-Consumption.aspx (accessed on 20 May 2017).
- National Statistics Office (NSO). Average Monthly Fuel Consumption Expenditure per Household by Type and Fuel, Region and Area: 2000. Available online: http://www.nso.go.th/sites/2014en/Pages/Statistical%20Themes/Population-Society/Population-Housing/TABLE-3-AVERAGE-MONTHLY-FUEL-CONSUMPTION-EXPENDITURES.aspx (accessed on 10 November 2017).
- National Statistics Office (NSO). The 2000 and 2010 Population and Housing Census. Available online: http://web.nso.go.th/en/census/poph/data/090913_StatisticalTables_10.pdf (accessed on 5 May 2017).
- National Statistics Office (NSO). Average Monthly Income per Household: 1998–2015. Available online: http://service.nso.go.th/nso/web/statseries/statseries11.html (accessed on 10 May 2017).
- Ehrhardt-Martinez, K. Changing habits, lifestyles and choices: The behaviours that drive feedback-induced energy savings. In Proceedings of the 2011 ECEEE Summer Study on Energy Efficiency in Buildings, Toulon, France, 6–11 June 2011. [Google Scholar]
- Aldabas, M.; Gstrein, M.; Teufel, S. Changing energy consumption behaviour: Individuals’ responsibility and government role. J. Electron. Sci. Technol. 2015, 13, 343–348. [Google Scholar]
- Simanaviciene, Z.; Volochovic, A.; Vilke, R.; Palekiene, O. Research review of energy savings changing people’s behavior: A case of foreign country. Procedia Soc. Behav. Sci. 2015, 191, 1996–2001. [Google Scholar] [CrossRef]
- Sriamonkul, W.; Intarajinda, R.; Tongsuk, N.; Saengsuwan, S.; Bhasaputra, P.; Pattaraprakorn, W. Life cycle cost analysis of air conditioning system for residential sector in Thailand. GMSARN Int. J. 2011, 5, 131–139. [Google Scholar]


| Sector | Hybrid-Unit I/O Sector Classification | I/O Sector | Household Expenditure Survey |
|---|---|---|---|
| 1 | Agriculture | 1–29 | Charcoal and firewood |
| Food prepared at home | |||
| 2 | Mining | 32–41 | n/a |
| 3 | Food & beverages | 42–66 | Non-alcoholic beverage (at home) |
| Alcoholic beverages-drunk at home | |||
| Alcoholic beverages-drunk away from home | |||
| Tobacco products | |||
| Prepared food:-Food taken home | |||
| 4 | Textiles | 67–74 | Cloth and clothing |
| Footwear | |||
| 5 | Wood and furniture | 78–80 | Furniture equipment, household textiles and small appliances |
| 6 | Paper and paper products | 81–83 | Personal supplies * |
| 7 | Chemical products | 84–92 | Cleaning supplies |
| Medicine and supplies | |||
| 8 | Non-metallic | 95–104 | Personal supplies * |
| 9 | Metallic | 105–107 | n/a |
| 10 | Fabricated metal | 108–111 | Personal supplies * |
| 11 | Manufacturing others | 75–77, 112–134 | Vehicles purchase |
| Vehicle repairing & maintenance | |||
| Recreation equipment and sports | |||
| 12 | Construction | 137–144 | Repair/maintenance dwelling |
| Estimated rental value of dwelling (Include owned dwelling) | |||
| 13 | Commercial | 145–148, 158–178 | Service workers in household |
| Rent of dwelling | |||
| Personal services | |||
| Medical services (outpatients) | |||
| Medical services (inpatients) | |||
| Communication | |||
| Education | |||
| Toys, pets, shrubs and recreation | |||
| Admission, sports fee | |||
| Reading/religious activities | |||
| Special ceremony expenses | |||
| Water supply, underground water | |||
| Prepared food—Food eaten away from home | |||
| 14 | Rail transport | 149 | Household expenditure on other transportation ** |
| 15 | Road transport | 150–152, 157 | Household expenditure on other transportation ** |
| 16 | Water way transport | 153–155 | Household expenditure on other transportation ** |
| 17 | Air transport | 156 | Special occasion travelling and tour |
| 18 | Unclassified | 180 | Personal supplies * |
| 19 | Coal and lignite | 30 | n/a |
| 20 | Crude oil | 31 | n/a |
| 21 | Natural gas | 31, 136 | NGV, LPG |
| 22 | Petroleum products | 93–94 | Gas used in households (cooking and others) |
| Gasoline | |||
| Diesel | |||
| Gasohol | |||
| NGV, LPG | |||
| Biodiesel and other alternative energy | |||
| 23 | Electricity | 135 | Electricity |
| No | Region | Energy Consumption Change (ΔQ) | Energy Efficiency Effect (η) | Production Structural Change Effect (L) | Consumption Structure Effect (β) | Expenditure Shares on Income Effect (μ) | Incomes per Capita Effect (Ө) | Size of Household Effect (s) | Number of Households Effect (w) |
|---|---|---|---|---|---|---|---|---|---|
| 1 | Greater Bangkok | 6631 | 747 | 512 | 1471 | (2629) | 2126 | (3262) | 7666 |
| % | 100 | 11 | 8 | 22 | (40) | 32 | (49) | 116 | |
| 2 | Central | 2659 | 551 | 639 | 1303 | (2327) | 1360 | (1184) | 2317 |
| % | 100 | 21 | 24 | 49 | (88) | 51 | (45) | 87 | |
| 3 | Northern | 1519 | 400 | 554 | 1025 | (1803) | 1232 | (675) | 785 |
| % | 100 | 26 | 36 | 67 | (119) | 81 | (44) | 52 | |
| 4 | Northeastern | 2303 | 615 | 923 | 1223 | (2477) | 2596 | (1011) | 435 |
| % | 100 | 27 | 40 | 53 | (108) | 113 | (44) | 19 | |
| 5 | Southern | 1582 | 328 | 446 | 486 | (1471) | 1426 | (540) | 906 |
| % | 100 | 21 | 28 | 31 | (93) | 90 | (34) | 57 |
© 2017 by the authors. Licensee MDPI, Basel, Switzerland. This article is an open access article distributed under the terms and conditions of the Creative Commons Attribution (CC BY) license (http://creativecommons.org/licenses/by/4.0/).
Share and Cite
Supasa, T.; Hsiau, S.-S.; Lin, S.-M.; Wongsapai, W.; Wu, J.-C. Household Energy Consumption Behaviour for Different Demographic Regions in Thailand from 2000 to 2010. Sustainability 2017, 9, 2328. https://doi.org/10.3390/su9122328
Supasa T, Hsiau S-S, Lin S-M, Wongsapai W, Wu J-C. Household Energy Consumption Behaviour for Different Demographic Regions in Thailand from 2000 to 2010. Sustainability. 2017; 9(12):2328. https://doi.org/10.3390/su9122328
Chicago/Turabian StyleSupasa, Tharinya, Shu-San Hsiau, Shih-Mo Lin, Wongkot Wongsapai, and Jiunn-Chi Wu. 2017. "Household Energy Consumption Behaviour for Different Demographic Regions in Thailand from 2000 to 2010" Sustainability 9, no. 12: 2328. https://doi.org/10.3390/su9122328
APA StyleSupasa, T., Hsiau, S.-S., Lin, S.-M., Wongsapai, W., & Wu, J.-C. (2017). Household Energy Consumption Behaviour for Different Demographic Regions in Thailand from 2000 to 2010. Sustainability, 9(12), 2328. https://doi.org/10.3390/su9122328