Article

Centrifugation of Digestate: The Effect of Chitosan on Separation Efficiency

1
Chair of Production Systems, Organization and Management, Department of Industrial Engineering and Engineering Management, Faculty of Technical Sciences, University of Novi Sad, Trg Dositeja Obradovica 6, 21000 Novi Sad, Serbia
2
Department of Agricultural, Forest and Food Sciences, University of Torino, Largo Paolo Braccini 2, 10095 Grugliasco (TO), Italy
*
Author to whom correspondence should be addressed.
Sustainability 2017, 9(12), 2302; https://doi.org/10.3390/su9122302
Submission received: 24 October 2017 / Revised: 1 December 2017 / Accepted: 8 December 2017 / Published: 12 December 2017
(This article belongs to the Section Sustainable Agriculture)

Abstract

:
Mechanical separation of co-digestate removes dry matter (DM) and phosphorous (P) from digestate effectively but is less capable at removing nitrogen (N) and potash (K). Adding flocculants can enhance separator efficiency. However, information on the use of chitosan as flocculant for co-digestate and its effects on amended slurry application to soil is scarce. This study undertook a series of trial and error tests to identify the optimal chitosan dose to be applied to co-digestate. Four chitosan doses were evaluated: 120 (Dose 1), 240 (Dose 2), 360 (Dose 3), and 480 (Dose 4) mL L−1 of co-digestate. After optimal dose application, centrifugation was employed to separate the co-digestate (centrifugation tests). We used simple separation indices to evaluate the effectiveness of chitosan addition prior to centrifuge usage. Dose optimization tests results indicated that incremental doses of chitosan had no effect (p > 0.05) on total N and it decreased (p < 0.05) total P removal to solids. Dose 3 showed a superior effect based on the physical characteristics evaluated and on the DM content of the fractions produced. Centrifugation tests results showed chitosan increased (p < 0.05) centrifugation efficiency for K, copper (Cu), and zinc (Zn) (75, 36, and 51%, respectively) and had no effect on total N or P. The major findings show that the use of natural and relatively cheap polymer chitosan improves the efficacy of co-digestate centrifugation with respect to K, Cu, and Zn, lowering their load to arable land once a solid fraction is applied.

1. Introduction

The energy potential of anaerobic digestion (AD) is of particular importance to those European countries that derive it from the treatment of agricultural by-products, such as food and food processing waste [1], cattle and pig manures, and other biomasses [2]. The residual product of AD (digestate/co-digestate) is either applied directly as fertilizer or treated further by drying, membrane filtration (ultrafiltration and reverse osmosis), or evaporation [3]. For all of these treatments, solid–liquid separation of digestate is a precondition.
The use of flocculants is often considered by the farmers who frequently flush pits in pig houses, due to the liquid nature of the pig manure and the dilution by flush water. Flocculants added to manure is known to enhance mechanical separation [4] by binding small nutrient-rich manure particles [5,6] into larger ones (flocs) to make them easily retainable in the solid fraction during mechanical separation. However, little has been published on flocculant choice for digested manure. High efficiency in manure separation has been shown for naturally occurring polyacrylamide flocculants. These natural source-derived by-products (e.g., starches, cellulose, and chitosan) are typically biodegradable, non-toxic, and relatively low-cost. Chitosan is one of the most promising natural flocculants due to the presence of primary amino groups that provide sites for various side groups to attach [7]. The capacity of chitosan to form complexes with metallic ions has been demonstrated [8,9].
Despite the obvious effectiveness of the flocculants, farmers’ decisions about whether to introduce the flocculation step are often driven by its economy (the cost of the polymer and additional equipment costs, i.e., mixing devices, metering pumps, etc.). Centrifugation is one of the most effective but certainly most expensive mechanical separation methods for raw and digested manures. Thus, the use of chitosan, which can be produced economically on a large scale and with low energy input [10], should not markedly increase separation costs. As little scientific information exists on the efficiency of chitosan to separate digestate, we wanted to test if chitosan can flocculate co-digestate and to assess the optimal chitosan dose with respect to physical and chemical characteristics of produced separates. The main hypothesis of this study was that chitosan will improve centrifugation of co-digestated pig manure based on measures of dry matter (DM), total nitrogen (N), phosphorous (P), potash (K), copper (Cu), and zinc (Zn) in a chemical-mechanical co-digestate separation system.

2. Materials and Methods

2.1. Anaerobic Co-Digestion and Sample Collection

Co-digestate samples were collected from an AD plant installed at a pig-breeding farm in Bra (CN)—Southwestern Piemonte (Italy). The continuously stirred tank anaerobic reactor (CSTR) was run at mesophilic conditions (40 °C), with a retention time of about 40 days and an average organic loading rate of 2.20 kg volatile solids (VS) m−3 d−1.
A total of approximately 300 L of co-digestate was directed from the digester outlet into five 60 L capacity barrels and transported to the laboratory. Co-digestate consisted mostly of pig slurry (67%), while the remaining 33% was energy crops (24%), dairy cattle slurry (7%), and farm yard manure (2%). In the laboratory, all barrels were emptied into a lidded tank and stored at 5 °C for the entire experimental period. All co-digestate separation tests were performed within one week from collection. Prior to separation, a representative sample was taken from the tank for chemical characterization after co-digestate homogenization. During each separation treatment, about 20 L of co-digestate was processed. The produced fractions were sub-sampled in triplicate into 1 L or 1 kg plastic containers and subsequently stored at −18 °C for further analysis.

2.2. Experimental Set-Up

Two major test types comprised the experiments in this study:
(i)
dose optimization tests, in which the proper dose of chitosan was determined for the co-digestate, and
(ii)
centrifugation tests, in which centrifugation was performed on co-digestate alone (CENT) and after chitosan addition (C+CENT).

2.2.1. Dose Optimization Tests

The natural flocculant chitosan (0.45% chitosan—Sigma-Aldrich Inc., St. Louis, MO, USA) was dissolved in 2% acetic acid [11]. The optimal dose (to achieve efficient separation regarding volume and nutrients distribution) of chitosan for the co-digestate was determined by trial and error tests of 120 mL L−1 increments between 120 mL L−1 (i.e., 0.54 mg L−1) and 480 mL L−1 (i.e., 2.16 mg L−1). The choice of the increments of 120 mL L−1 was made based on previous work [11,12]. The polymer was added slowly to the manure, mixed for five minutes, and then left to rest for 20 min. After flocculation occurred, samples were drained by gravity (for 20 min) through a 1 mm mesh screen. The obtained fractions were then analyzed for dry matter content, total N, P, K, Cu, and Zn, and mass separation values were calculated.

2.2.2. Centrifugation Tests

Centrifugation (CENT) treatment was performed in three main steps: co-digestate (about 200 mL) transfer to centrifuge tube, centrifugation for 30 s at maximum speed (3500 g), plus three minutes for acceleration and eight minutes for deceleration (Beckman J2-MC Centrifuge, rotor JA-10, Beckman Coulter, Brea, CA, USA), and then careful suction for collection of the supernatant. Decanting centrifuges typically operate at similar retention times, so we considered this simplified model to suffice as a decanter centrifuge [3,5].

2.3. Chemical Analyses and Calculations

Dry matter (DM) content was determined by drying the fresh samples to a constant weight (24 h at 105 °C) and is presented as a percentage of wet weight. Volatile solid content (VS) for the dried samples was ascertained from the loss on ignition at 550 °C for five hours (VDI 4630, 2006) [13] and is presented as a percentage of dry matter. Dry matter and volatile solids were measured using a four-digit balance (Kern, model ABS 220-4, Kern & Sohn GmbH, Balingen, Germany).
The pH was directly measured in the co-digestate and liquid samples, and diluted with de-ionized water when measured in solids. Solid samples were shaken for 45 min and left to settle for 15 min prior to pH measurement. Total N and ammonium-N (NH4–N) were measured by the Kjeldah method. The following methods were used to determine other element measures: total P by the M.U. 2252:08 method, total K by the EPA 3015A 2007 and EPA 6010C 2007 procedures, and copper and zinc by EPA 3015A 2007 + EPA 6020C 2007 [14].
Calculation of mass recovery for each treatment relied on the measured mass of input co-digestate and the masses of produced solid and liquid fractions using a two-digit balance (Orma mod. BC). Mass balance was calculated as the mass ratio of solid fraction produced in the treatment to the combined solid fraction and liquid fractions produced in the same treatment. From these values, the simple (Et) separation indices were calculated to compare treatment efficiencies of separating DM, N, P, K, Cu, and Zn. Separation indices [5] were figured from the calculated mass separation for each separation treatment and the measured concentration of dry matter and elements N, P, K, Cu, and Zn (the mass ratio of solute transferred from raw slurry to solid separation fraction). The simple separation index (Et) allowed comparisons of dry matter, N, P, K, Cu, and Zn separations [15,16].

2.4. Statistical Analysis

Chemical characteristic differences in all solid and liquid fractions produced in the optimization tests were tested by one-way ANOVA and the post-hoc Dunnett C test, which was also used to assess Et value differences. Dry matter and elemental content differences in all separation test fractions were analyzed using the t-test. All statistical analyses were performed using an SPSS statistical programme.

3. Results and Discussion

3.1. Chemical Characteristics of Co-Digestate (Input Material)

The measures of DM, total N content, and co-digestate pH used in this study (Table 1) approximated those of the co-digestate produced from pig slurry in the study by Menardo et al. (2011) [17]. Alternatively, the values determined for P, K, and metals (Cu and Zn) of the co-digestate in this study (Table 1) were lower than those found for pig slurry AD digestate alone in the Marcato et al. (2009a) study [2]. The different results likely relate to feedstock composition differences (feedstock type and nutrient presence) and to AD process characteristics.

3.2. Floculation Tests

3.2.1. Dry Matter and Mass Balance of Separated Fractions

Increased chitosan doses reduced the mass of solid fractions produced, increased its dry matter content, and decreased the DM content of liquid fractions (Table 2).
For solids, these effects were observed (p < 0.05) at the Dose 3 level, but no further difference was observed at the incremental dose between 360 and 480 mL L−1, as de-flocculation occurred at this highest addition level. Addition of high levels (above 360 mL L−1) of chitosan—effectively overdosing—leads to de-flocculation, which was observed in this study as decreased liquid fraction turbidity and a decreased floc size (Table 2). A potential cause of the de-flocculation might be steric hindrance that led to tail and loop formation after chitosan bound to the particles [18].

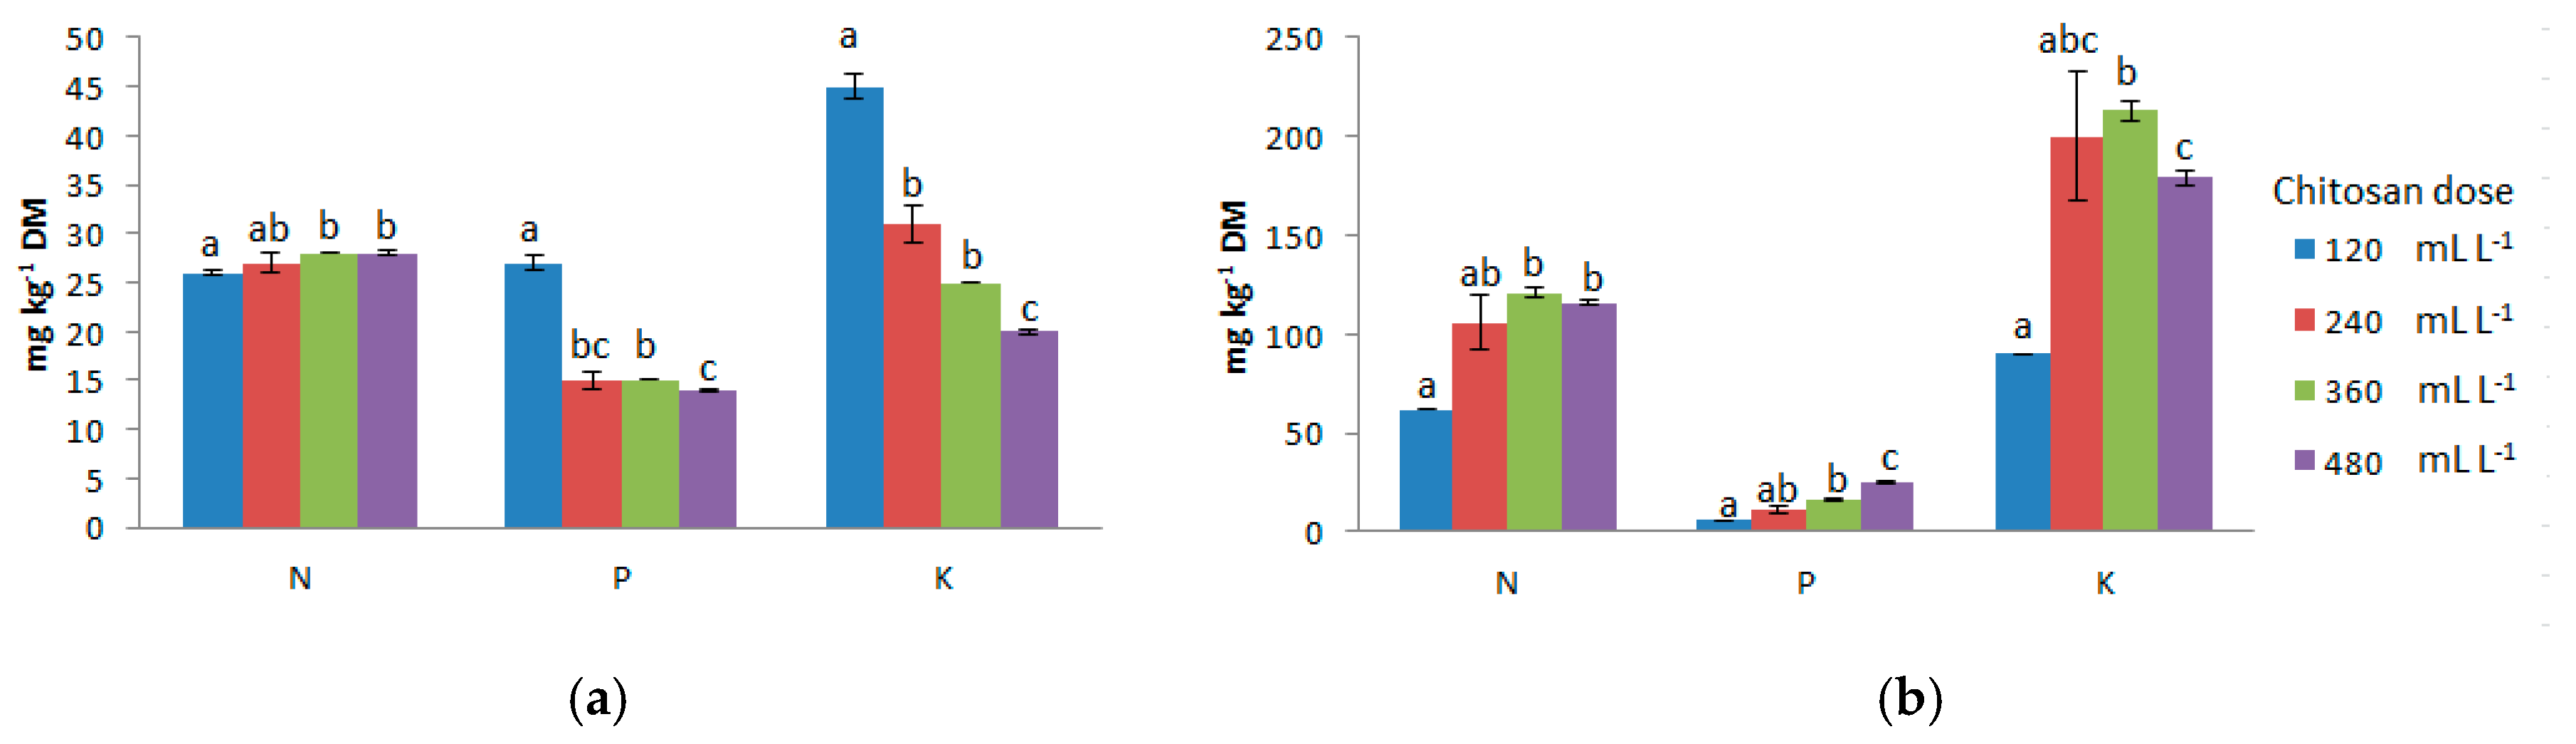
3.2.2. Nutrient (N, P, K) and Metal (Cu and Zn) Content of Produced Fractions

Total N content of solid fractions was increased (p < 0.05) only when the two highest doses were applied to the co-digestate (Figure 1). The highest P (27 mg kg−1 DM) and K content (45 mg kg−1 DM) were observed in a solid fraction when the lowest dose of chitosan was applied. In liquids, only the highest two dose levels increased (p < 0.05) total N, P and K contents as chitosan doses increased (Figure 1). Retention of K in solid fraction followed a similar pattern as that of total P after chitosan addition and gravity drainage (Figure 1). The simple separation indices (Et) averaged 35.9%, 40.2%, 75.4%, 95.6%, and 96.2% for N, P, K, Cu, and Zn, respectively.
The speciation of nutrients, as well as their distribution across particle size classes may explain why chitosan addition followed by gravity drainage through the 1 mm mesh sieve used in this study was not efficient in removing N, P, or K for solid separation. Previous studies [3,6] showed that a major portion (80%) of total N in co-digestate is mineralized to NH4–N, and approximately 70% of the total N was in particles less than 0.45 μm in diameter. Digestate contains only a trace amount of inorganic P in the solution, due to formation of Ca– or Mg–phosphate and struvite in the AD process [3]. The same study also showed that only 30% of P was linked to particles larger than 10 μm.
The content of Cu and Zn in the produced solids rose as chitosan doses increased. However, only at the highest chitosan dose did Cu content achieve significance (p < 0.05) (Figure 2). Alternatively, in the case of the liquid fractions, the content of these two metals was below (p < 0.05) the level in the co-digestate, and decreased as chitosan doses increased (Figure 2).
Copper and zinc partitioning between particulate and dissolved forms is not affected by anaerobic digestion [19], and along the neutral to alkaline range of pH values, both metals bind to solids. Rhazi et al. [8] showed that, at a pH above 5.8, the structure of the Cu–chitosan complex predominates {[Cu(-NH2)2]2+, 2OH}. Given the creation of flocs rich in Cu and Zn with the capacity for sieve retention, we expected strong Cu and Zn removal despite the low efficiency of gravity drainage to retain small metal-rich particles in solids.

3.2.3. Choosing an Optimal Dose

Visual observation of floc size, liquid fraction turbidity, and foam formation, along with quantifications of solid and liquid fraction DM, nutrient and metal content, and mass separation, were used to determine optimal chitosan doses. Despite the fact that turbidity of the liquid fraction and floc formation are qualitative parameters and therefore exposed to researcher subjectivity, they are reliable indicators of: (i) the sizes of particles, which form flocs and (ii) floc resistance to further mechanical separation. Foaming is of great importance for farmers, as the volume of the foam created will directly affect the size of co-digestate tank, as well as safety of the operator.
An increased chitosan dose in the range of 240–360 mL L−1 co-digestate showed very little effect on nutrient and metal content in produced separates, possibly because of their speciation and distribution between particle sizes. However, physical characteristics (e.g., mass balance, turbidity, floc formation, and foaming) and the dry matter content of fractions produced highlighted the superior effect of 360 mL L−1 versus 240 mL L−1. Thus, the resulting value for co-digestate was 360 mL chitosan L−1.

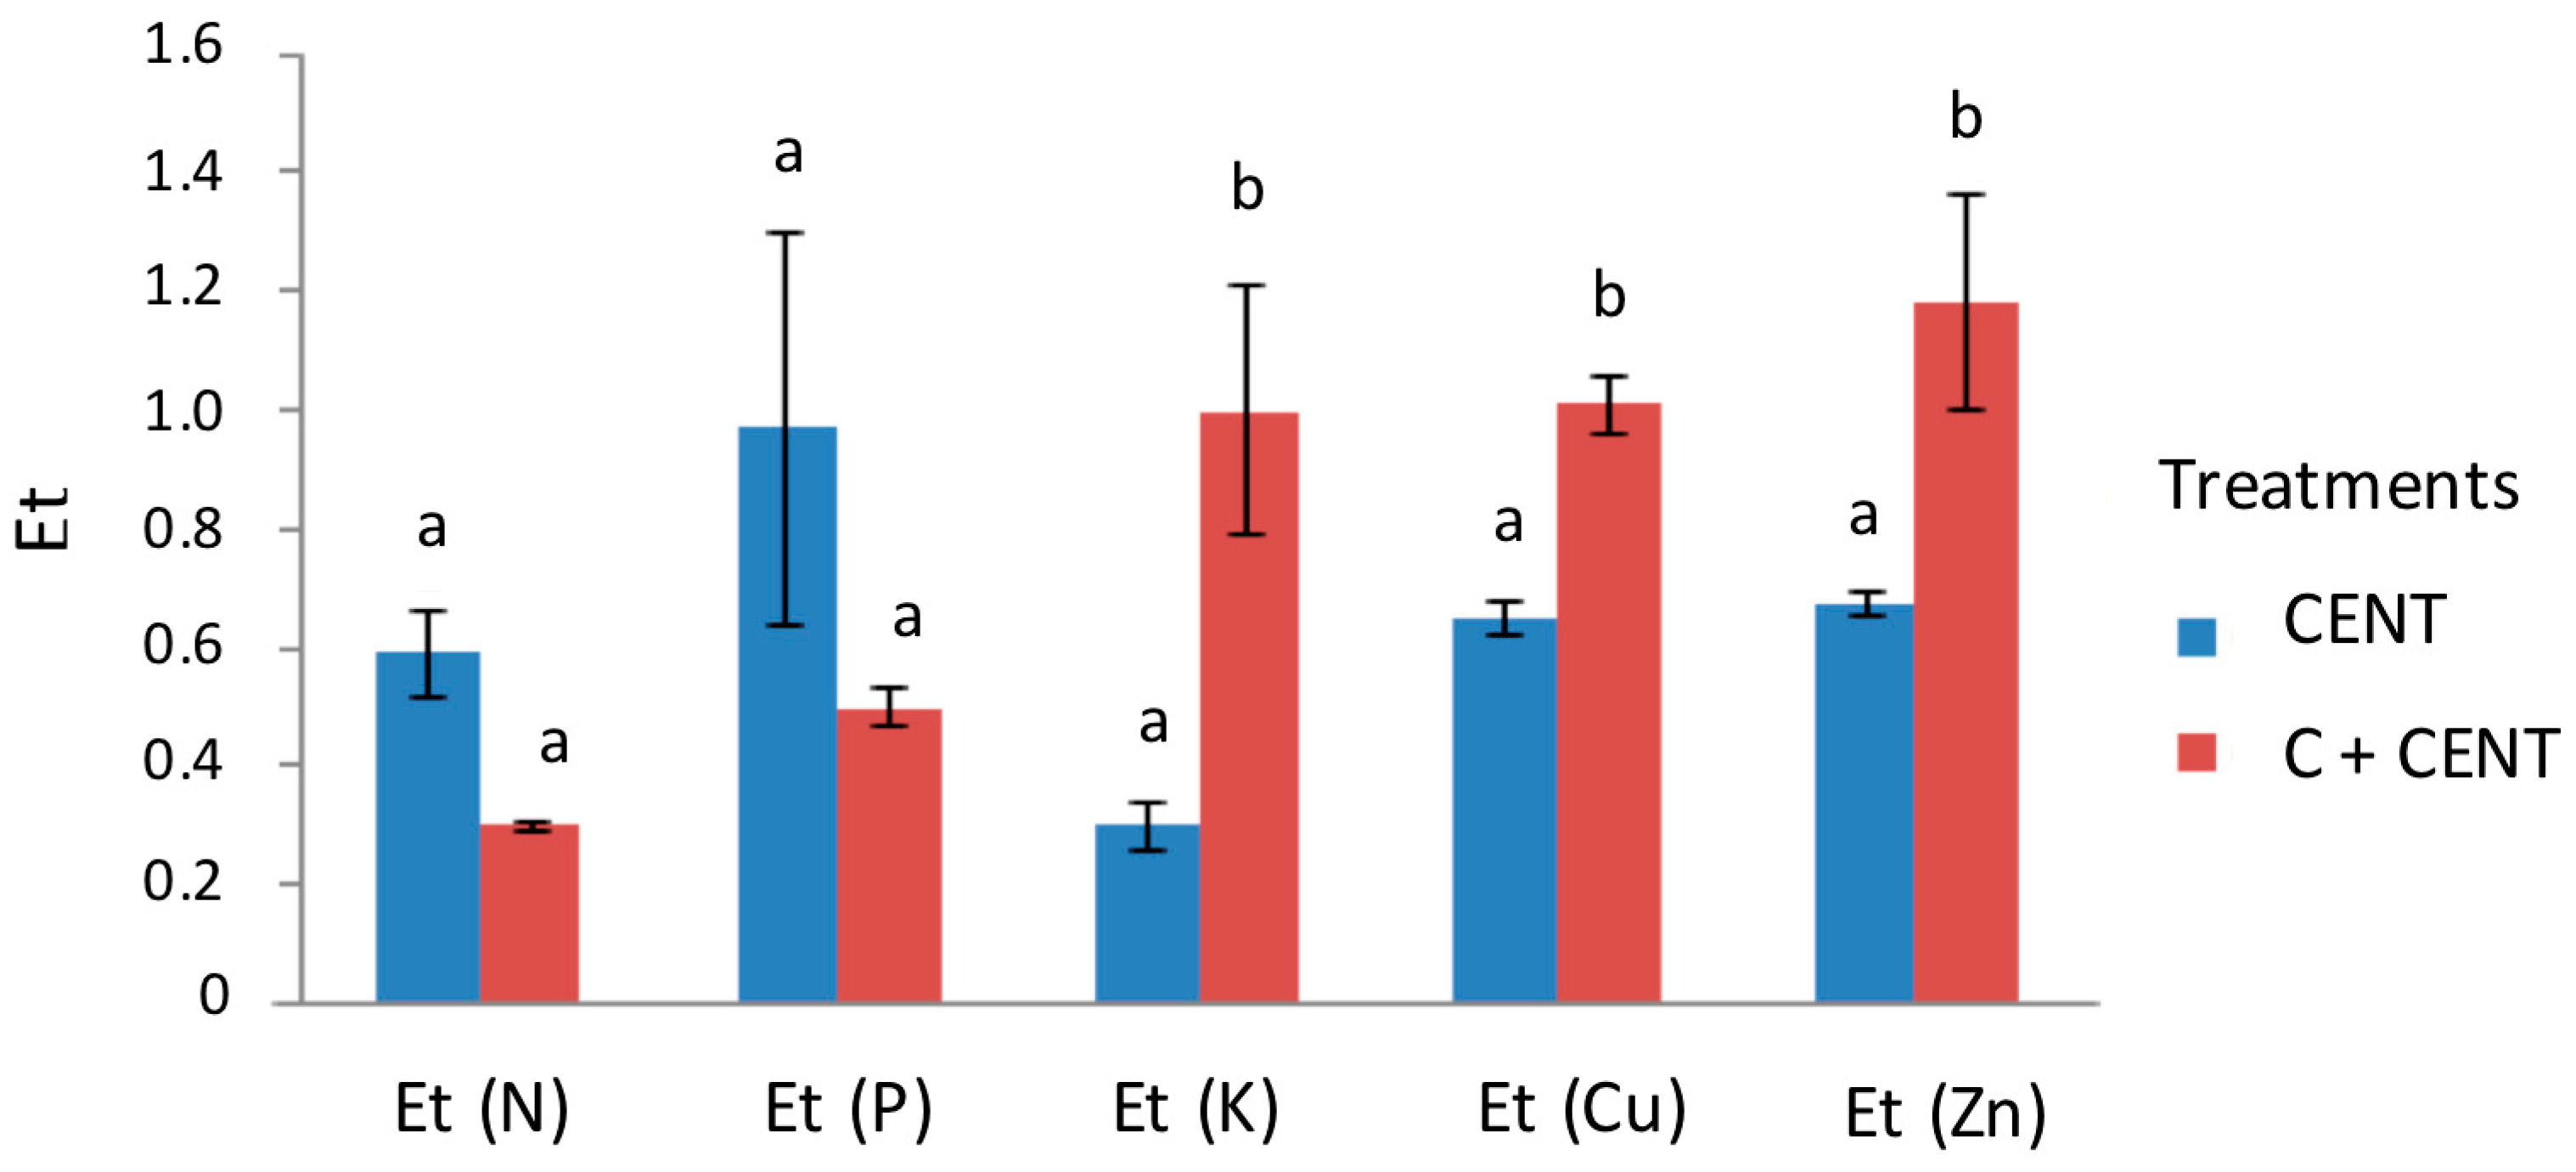
3.2.4. Separation Efficiency of Centrifugation after Chitosan Addition

Table 3 reports the main characteristics of separation fractions produced in the centrifugation tests (centrifugation of co-digestate alone: CENT; chitosan addition to co-digestate followed by centrifugation: C+CENT).
Based on the simple separation index calculated, centrifugation was very efficient at removing nutrients and metals tested in this study (Figure 3). Additionally, the Et evidenced that chitosan application increased (p < 0.05) centrifuge efficiency for K, Cu, and Zn (Figure 3). One unexpected observation in this study was the high efficiency for potassium (EtK = 0.85) that chitosan exhibited because it runs counter to the known lack of affinity of the flocculant for atomic structure (absence of d and f unsaturated orbitals) of alkaline metals (e.g., K). Separation indices for total N and P indicate reduced efficiency in C+CENT, when compared to CENT treatment (Figure 3). This probably resulted from the speciation of N and P in co-digestate, their distribution among particle sizes (see Section 3.2.2) rather than by the formation of loosened flocs when chitosan was added. Chitosan added before co-digestate centrifugation decreased the separation efficiency of N and P to 31.7 and 48.9%, respectively. By comparison, a literature review by Hjorth et al. (2010) [5] on the most commonly flocculation agents (e.g., polyacrylamides) used to improve slurry separation efficiency of centrifuge revealed an average Ets of 32.3% (range 16.0–54.0%) and 81.0% (range 72.0–91.0%) for N and P, respectively.
The main chitosan reactive groups for metal ions are amine sites, which may interact with metal ions through various mechanisms depending on the metal, pH, and matrix of the solution [9]. Due to free amine function, chitosan can chelate transition metal ions, such as those of Cu and Zn, making it quite suitable for water treatment and seawater metal recovery. Chitosan selectivity for transition metals depends on the cation considered, and great affinity has been demonstrated for divalent Cu, Mercury (Hg), Zn, Cadmium (Cd), Nickel (Ni), Calcium (Ca), and Cobalt (Co) [8].
These results suggest that use of chitosan prior to centrifugation can be justified from an economical point of view for manures and waste waters that are initially rich in Cu and Zn. The addition of chitosan can be a solution for reaching separation objectives of producing a value product to be transported [20] and further used as Cu and Zn fertilizer. A study by Rhazi et al. (2002) [8] indicated that the effectiveness of chitosan metallic ion fixation is more pronounced when the chitosan is applied as a film rather than as a powder. Nonetheless, Cu is the most complex among the metal ions, regardless of the chitosan structure [8]. This study also showed that about 80% of free copper and 50% of zinc were eliminated after contact with chitosan film, as opposed to 56 and 28%, respectively, when powder chitosan was applied.
Increased chitosan doses showed very little effect on nutrient and metal content in produced separates, possibly because of their speciation and distribution between particle sizes. Thus, the optimal dose (360 mL of chitosan per L of co-digestate) was determined based on DM content and physical characteristics of separates. Simple separation indices showed that an application of chitosan increased centrifugation efficiency with respect to K, Cu, and Zn.

4. Conclusions

Accounting for the effects caused by different doses on elemental solid–liquid fraction distribution and physical characteristics, the resulting value for optimal chitosan dose was determined to be 360 mL of chitosan L−1 co-digestate. Co-digestate centrifugation led to production of a solid fraction (10.4% dry matter content) representing 35% of processed co-digestate volume, while the addition of chitosan prior to centrifugation produced 27% solid fraction (8.8% dry matter). Chitosan improved centrifugation efficiency for K, Cu, and Zn and had no effect on total N or P. These results indicate chitosan addition can improve trace metal imbalance between separated fractions and that the liquid fraction is clean enough for farm technical water use. However, more research is needed, primarily due to the great variability in the co-digestate produced. At the same time, more focus should be placed on identifying co-digestate pre-treatments that further enhance the benefits of chitosan addition.

Acknowledgments

The research leading to these results received funding from the People Programme (Marie Curie Actions) of the European Union’s Seventh Framework Programme FP7/2007-2013/ under REA Grant Agreement No. (289887).

Author Contributions

Olga Popovic and Luca Rollè performed the experiments, Olga Popovic, Elio Dinuccio, and Fabrizio Gioelli processed the data and wrote the paper, and Paolo Balsari supervised all activities. All authors read and approved the final manuscript.

Conflicts of Interest

The authors declare no conflict of interest. The founding sponsors had no role in the design of the study, in the collection, analyses, or interpretation of data, in the writing of the manuscript, or in the decision to publish the results.

References

  1. Dinuccio, E.; Balsari, P.; Gioelli, F.; Menardo, S. Evaluation of the biogas productivity potential of some Italian agro-industrial biomasses. Bioresour. Technol. 2010, 101, 3780–3783. [Google Scholar] [CrossRef] [PubMed]
  2. Marcato, C.E.; Mohtar, R.; Revel, J.C.; Pouech, P.; Hafidi, M.; Guiresse, M. Impact of anaerobic digestion on organic matter quality in pig slurry. Int. Biodeterior. Biodegrad. 2009, 63, 260–266. [Google Scholar] [CrossRef] [Green Version]
  3. Moller, H.B.; Hansen, J.D.; Sorensen, C.A.G. Nutrient recovery by solid-liquid separation and methane productivity of solids. Trans. ASABE 2007, 50, 193–200. [Google Scholar] [CrossRef]
  4. Cocolo, G.; Curnis, S.; Hjorth, M.; Provolo, G. Effect of different technologies and animal manures on solid-liquid separation efficiencies. J. Agric. Eng. 2012, 43, 55–64. [Google Scholar] [CrossRef]
  5. Hjorth, M.; Christensen, K.V.; Christensen, M.L.; Sommer, S.G. Solid–liquid separation of animal slurry in theory and practice. A review. Agron. Sustain. Dev. 2010, 30, 153–180. [Google Scholar] [CrossRef]
  6. Masse, L.; Masse, D.I.; Beaudette, V.; Muir, M. Size distribution and composition of particles in raw and anaerobically digested swine manure. Trans. ASAE 2005, 4, 1943–1949. [Google Scholar] [CrossRef]
  7. Yang, Z.; Shang, Y.; Lu, Y.; Chen, Y.; Huang, X.; Chen, A.; Jiang, Y.; Gu, W.; Qian, X.; Yang, H.; et al. Flocculation properties of biodegradable amphoteric chitosan-based flocculants. Chem. Eng. J. 2011, 172, 287–295. [Google Scholar] [CrossRef]
  8. Rhazi, M.; Desbrieres, J.; Tolaimate, A.; Rinaudo, M.; Vottero, P.; Alagui, A.; El Meray, M. Influence of the nature of the metal ions on the complexation with chitosan. Application to the treatment of liquid waste. Eur. Polym. J. 2002, 38, 1523–1530. [Google Scholar] [CrossRef]
  9. Guibal, E. Interactions of metal ions with chitosan-based sorbents: A review. Sep. Purif. Technol. 2004, 38, 43–74. [Google Scholar] [CrossRef]
  10. Salehizadeh, H.; Shojaosadati, S.A. Extracellular biopolymeric flocculants: Recent trends and biotechnological importance. Biotechnol. Adv. 2001, 19, 371–385. [Google Scholar] [CrossRef]
  11. Garcia, M.C.; Szogi, A.A.; Vanotti, M.B.; Chastain, J.P.; Millner, P.D. Enhanced solid–liquid separation of dairy manure with natural flocculants. Bioresour. Technol. 2009, 100, 5417–5423. [Google Scholar] [CrossRef] [PubMed]
  12. Popovic, O.; Gioelli, F.; Dinuccio, E.; Balsari, P. Improved pig slurry mechanical separation using chitosan and biochar. Biosyst. Eng. 2014, 127, 115–124. [Google Scholar] [CrossRef]
  13. VDI 4630-Fermentation of Organic Materials, Characterisation of the Substrates, Sampling, Collection of Material Data, Fermentation Tests. In VDI-Handbuch Energietechnik; Beuth Verlag GmbH: Berlin, Germany, 2006; p. 92. Available online: http://www.vdi.eu/uploads/tx_vdirili/pdf/2385990.pdf (accessed on 11 December 2017).
  14. USEPA. SW-846 Methods for the Analysis of Hazardous Waste; US Environmental Protection Agency: Washington, DC, USA, 2007. Available online: https://www.epa.gov/hw-sw846/sw-846-compendium (accessed on 11 December 2017).
  15. Peters, K.; Hjorth, M.; Jensen, L.S.; Magid, J. Carbon, nitrogen and phosphorus distribution in particle size-fractionated separated pig and cattle slurry. J. Environ. Qual. 2011, 40, 224–232. [Google Scholar] [CrossRef] [PubMed]
  16. Popovic, O.; Hjorth, M.; Jensen, S.L. Phosphorus, copper and zinc in solid and liquid fractions from separated pig slurry. Environ. Technol. 2012, 33, 2119–2131. [Google Scholar] [CrossRef] [PubMed]
  17. Menardo, S.; Gioelli, F.; Balsari, P. The methane yield of digestate: Effect of organic loading rate, hydraulic retention time, and plant feeding. Bioresour. Technol. 2011, 102, 2348–2351. [Google Scholar] [CrossRef] [PubMed]
  18. Hjorth, M.; Christensen, M.L. Evaluation of methods to determine flocculation procedure for manure separation. Trans. ASABE 2008, 51, 2093–2103. [Google Scholar] [CrossRef]
  19. Marcato, C.E.; Pinelli, E.; Cecchi, M.; Winterton, P.; Guiresse, M. Bioavailability of Cu and Zn in raw and anaerobically digested pig slurry. Ecotoxicol. Environ. Saf. 2009, 72, 1538–1544. [Google Scholar] [CrossRef] [PubMed] [Green Version]
  20. Dinuccio, E.; Gioelli, F.; Cuk, D.; Rollè, L.; Balsari, P. The use of co-digested solid fraction as feedstock for biogas plants. J. Agric. Eng. 2013, 44, 573–578. [Google Scholar] [CrossRef]
Figure 1. Nutrient content in (a) solid and (b) liquid fractions produced in optimization tests. Concentrations are calculated on dry matter basis. Means (n = 3) within each nutrient followed by different letters differ significantly from each other (p < 0.05).
Sustainability 09 02302 g001
Figure 2. Metal content in (a) solid and (b) liquid fractions produced in optimization tests. Concentrations are calculated on dry matter basis. Means (n = 3) within each trace metal followed by different letters differ significantly from each other (p < 0.05).
Sustainability 09 02302 g002
Figure 3. Simple separation indices (Et) calculated for nutrients and metals for two treatments denoted as CENT (centrifugation) and C+CENT (chitosan addition followed by centrifugation). Means (n = 3) within each nutrient and trace metal Simple separation index followed by different letters differ significantly from each other (p < 0.05).
Sustainability 09 02302 g003
Table 1. Main characteristics of co-digestate used in the tests. The concentrations of all parameters are calculated and presented on the basis of dry matter as means (n = 3) with standard deviations in parentheses.
DM (%)pHTot N
(mg g−1)
Tot P
(mg g−1)
Tot K
(mg g−1)
Tot Cu
(µg g−1)
Tot Zn
(µg g−1)
4.56
(0.16)
7.38
(0.03)
57
(5.28)
8.31
(2.1)
63.8
(6.23)
106
(14.9)
539
(92.9)
Table 2. Dose optimization tests. The values of all parameters are presented as means (n = 3) with standard deviations in parentheses.
Dose
(mL L−1)
Mass Balance (%)FlocFoamSolid DM (%)Liquid DM (%)Turbidity of LiquidsEtRecovery (%)
Dose 158a4 *1 **5.5a2.8a4 ***0.7a98
(120)(4.93) (0.25)(0.00) (0.03)
Dose244ab328.1ab1.1b20.8a97
(240)(5.86) (0.90)(0.27) (0.03)
Dose 338b139.2b0.9b10.8a99
(360)(1.15) (0.01)(0.04) (0.02)
Dose 435ab2.149b0.9b2.30.7a97
(480)(3.21) (0.17)(0.04) (0.07)
* Value 1 indicates the best floc visualization; Value 4 indicates no flocs observed. ** Value 1 indicates no foam observed; Value 4 indicates the largest amounts of foam. *** Value 1 indicates the clearest liquid fraction; Value 4 indicates a murky liquid fraction. Means (n = 3) within each parameter (vertical) followed by different letters differ significantly from one another (p < 0.05).
Table 3. Characterization of separated fractions produced by the two co-digested separation treatments denoted as CENT (centrifugation of co-digestate alone) and C+CENT (chitosan addition followed by centrifugation). The concentrations of all parameters are calculated and presented on the basis of dry matter as means (n = 3) with standard deviations in parentheses.
TreatmentDM (%)pHTot N
(mg g−1)
Tot P
(mg g−1)
Tot K
(mg g−1)
Tot Cu
(µg g−1)
Tot Zn
(µg g−1)
Solids
CENT10.4a * 8.31a 49a 20a 21a 111a 542a
(0.42)(0.02)(6.37)(7.18)(2.4)(8.82)(19)
C+CENT8.8b7.99a53a14a89b223b1218b
(0.44)(0.33)(2.4)(1.01)(13.8)(14)(161)
Liquids
CENT1.7a7.86a134a38a115a316a1267a
(0.01)(0.05)(0.82)(4.75)(57.0)(56)(110)
C+CENT0.9b6.64b101a21b236b4b24b
(0.01)(0.05)(72.4)(1.73)(23.6)(2.5)(9.7)
* Means (n = 3) within each parameter (vertical) followed by different letters differ significantly from each other (p < 0.05).

