Article

Measuring Water Transport Efficiency in the Yangtze River Economic Zone, China

1
Center for Modern Chinese City Studies, East China Normal University, Shanghai 200062, China
2
School of Urban and Regional Science, East China Normal University, Shanghai 200241, China
3
Division of Business, Hong Kong Community College, The Hong Kong Polytechnic University, Hong Kong, China
4
Transport Institute, University of Manitoba, Winnipeg, MB R3T 5V4, Canada
5
School of Education, Faculty of Social Sciences and Law, University of Bristol, Bristol BS8 1TH, UK
*
Author to whom correspondence should be addressed.
Sustainability 2017, 9(12), 2278; https://doi.org/10.3390/su9122278
Submission received: 31 October 2017 / Revised: 1 December 2017 / Accepted: 4 December 2017 / Published: 8 December 2017

Abstract

:
Water transport, a component of integrated transport systems, is a key strategic resource for achieving sustainable economic and social development, particularly in the Yangtze River Economic Zone (YREZ). Unfortunately, systematic studies on water transport efficiency are not forthcoming. Using Data Envelopment Analysis (DEA) and the Malmquist index as a model framework, this paper measures water transport efficiency in YREZ, conducts spatial analysis to identify the leading factors influencing efficiency, and provides scientific evidence for a macroscopic grasp of water transport development and the optimization of YREZ. The results indicate that water transport technical efficiency (TE) in YREZ is low and in fluctuating decline. Therefore, it has seriously restricted performance and improvements in the service function. Additionally, the spatial pattern of TE has gradually changed from complexity and dispersion to clarity and contiguity with a larger inter-provincial gap. Water transport efficiency has slightly improved through technological change (TECHch), whereas deteriorating pure technical efficiency change (PEch) is the main cause of a TE decrease. According to our findings, decision-makers should consider strengthening intra-port competition and promoting water transport efficiency.

1. Introduction

Transport systems which significantly support infrastructure for socio-economic activities and regional development are an important subject of regional research in the 21st century. The role of transport systems has changed, as they now play a central role in synergistic development to enhance regional competitiveness and create an ecological environment. Transport efficiency refers to the comparative relationship between the input of transport resources and the actual effective output as a synthesized measure of the operational status and development potential of the transport system [1], which represents transport development. The study of transport efficiency emerged in western society in the mid to late 1970s [2] and then rapidly increased in contemporary container shipping research (i.e., after 1999) [3]. Transport efficiency is now a key performance metric of the transportation industry. Recently, transport efficiency has attracted widespread attention from various academics and practitioners, since the main contradiction of transportation industry has transformed from a supply-demand shortage to technical efficiency (TE), particularly in developing countries. Additionally, the Data Envelopment Analysis (DEA) model using the non-parametric method is not limited by the specific production function form or random variable distribution [4,5,6], which is suitable for measuring transport efficiency with “multi-input and multi-output” production characteristics. Thus, the DEA model happens to be appropriate for evaluating the efficiency of the transport sector.
Currently, the relevant research is based on diverse connotations, and transport efficiency can be evaluated from three facets. The first facet is the degree of coordination between transport systems and national socio-economics, for instance, how resources are applied for greater efficiency. Ramanathan used the DEA model to estimate the relative energy efficiencies of transport modes in India [7]; Joanna et al. constructed a DEA model of the interaction between transport service efficiency and the socio-economy in selected European countries [8]. The second evaluation facet is using configuration coordination of transport resources among transport modes to assess efficiency. For example, Boame employed a bootstrap DEA method to estimate TE scores for Canadian urban transit systems from 1990 to 1998 [9]; Barnum et al. calculated the TE of different public transport types in metropolitan areas based on the improved DEA model [10]. The third evaluation facet is measuring the TE and its decomposition of the transport system. For instance, Cantos et al. analyzed the productivity evolution of European railways from 1970 to 1995 using the DEA model and Malmquist index [11]. Furthermore, the spatial characteristics of transport efficiency have attracted the attention of Chinese scholars. For example, the SBM-Undesirable model was introduced by Yang Liangjie to analyze the temporal-spatial evolution of China’s road transport efficiency from 1997 to 2009. The study concluded that China’s road transport efficiency is at a low level overall, while it is at a high level in the eastern region; the mid-western region is low in efficiency; and the other regions are improving [12].
Most scholars have measured transport efficiency from the third facet with rich results on urban public transport, ports, highways, railways, integrated transportation, and city-oriented factors [13]. While the literature on water transport efficiency has provided relatively few studies, several studies have been conducted on water quality and marine transport. For instance, Calles investigated the influencing factors of water quality, such as topography, type of loose deposits, and land use, to study fluvial transportation in the River Västerdalälven [14]; Gutiérrez et al. employed a bootstrap DEA approach to evaluate the efficiency of international container shipping lines [15]; and Blume provided a proposal for funding port dredging to improve the efficiency of the American marine transportation system [16]. Yet, in China, systematic studies on water transport efficiency are not forthcoming. Meanwhile, it is a basic task for the optimal allocation of transportation resources to study the spatial pattern of transportation efficiency. Yip et al. [17] adopted an S-curve to provide only a basic theoretical basis for shipping lines to determine the optimal carrying capacity. Altogether, a few scholars have conducted useful exploration in the field, but the attention is insufficient.
In the context of the transportation industry, water transport is described as the oldest transport mode in the world [18]. Water transport, a component of integrated transport systems, has unparalleled advantage in long-distance, high-volume cargo transportation. The characteristics of greater capacity, less land occupation, low variable cost, as well as less energy consumption and pollution make it a key strategic resource for achieving sustainable economic and social development. Today, water transport maintains the prime mode of transport for global logistics [18]. Nevertheless, the Yangtze River in China has not played its central role as “Golden Waterway” successfully. This may be the result of poor management, inadequate facilities, and disordered competition among shipping enterprises. Given this, the study targets the YREZ and introduces the DEA model as well as the Malmquist index to measure the efficiency of water transport from 2003 to 2011. The study also analyzes spatial evolution characteristics and changing trends from the TE perspective to identify the leading factors influencing efficiency and provide scientific evidence for a macroscopic grasp of water transport development and the optimization of YREZ.

Study Area

In this study, the YREZ is partitioned into Sichuan and Chongqing in western China; Hubei, Hunan, Jiangxi, and Anhui in central China; and Zhejiang, Jiangsu, and Shanghai in eastern China, with an area of 1.482 million km2 that accounts for 15.4% of the land area in China. At the end of 2012, the resident population in the economic zone was nearly 500 million, and GDP reached 23.98 trillion, accounting for 36.9% and 42.2% of national population and GDP, respectively, with per capita GDP and urban population density both 1.2 times that of the nation. The zone links urban agglomeration in the Yangtze River Delta and Wanjiang Megalopolis, urban agglomeration in the middle reaches of the Yangtze River (including Poyang Lake urban agglomeration, Wuhan metropolitan area, Chang-Zhu-Tan urban agglomeration), and Chengdu-Chongqing urban agglomeration from east to west. These areas are densely populated and form the primary development axis of a “T”-type land development structure and economic layout [19]. Furthermore, these areas are of great strategic significance for the optimization of the regional industrial layout and labor division, the promotion of integrated and coordinated development in regional economy as well as the support of China’s sustainable and rapid economic growth.
The YREZ, east of the East China Sea and the Yellow Sea, traverses the east and west by the golden waterway of the Yangtze River. The area has both deep sea transport and inland water transportation and is the most developed area for domestic water transport. In 2012, the mileage of the inland waterway in the Yangtze River was 82,400 km, accounting for 65.9% of the nation’s total; water transport cargo volume and cargo turnover accounted for 18.8% and 62% of the entire economic zone. The numbers of coastal and river berths are 1806 and 23,045, accounting for 32.1% and 87.8% of the nation’s coastal and river berths, respectively. Additionally, the Yangtze River port has formed a port system with Nanjing, Wuhan, and Chongqing as three regional hubs, other major ports as the skeleton, and regionally important ports as secondary hubs. In view of the mutual relationship between economic growth and transport development, waterways, as a transportation corridor with relatively low resource needs and environmental cost, will play an increasingly key role in facilitating future YREZ development.

2. Materials and Methods

In this study, the DEA model measures the relative production efficiency of water transport in each region without considering technological progress. The Malmquist index based on the DEA model is applied for a more detailed dynamic analysis; that is, the change characteristics and trends of water transport efficiency in the YREZ are comprehensively investigated based on the multi-dimensions of space, time, entirety, and partition.

2.1. The DEA Model

DEA is a significant method [20,21,22] for evaluating the relative effectiveness of multi-input and multi-output decision-making units (DMU) based on a non-parametric production frontier. After years of development, several models have been derived based on DEA. However, from current practical applications, the most widely used models with considerable effect remain the C2R and BC2 models [23,24,25].
( C 2 R ) { min [ θ ε ( e 1 T s + e 2 T s + ) ] , s . t . j = 1 k x j l λ j + s = θ x l n , j = 1 k y j m λ j s + = θ x l n , s 0 , s + 0 , λ j 0 , j = 1 , 2 , , k .
( B 2 C ) { min [ θ ε ( e 1 T s + e 2 T s + ) ] , s . t . j = 1 k x j l λ j + s = θ x l n , j = 1 k y j m λ j s + = θ x l n , j = 1 k λ j = 1 , s 0 , s + 0 , λ j 0 , j = 1 , 2 , , k .
where e1T is a m-dimensional vector with element value of 1.0, and e2T is a k-dimensional vector with element value of 1.0; xjl represents the inputs of the jth DMU on the lth resource; yjm indicates the mth outputs of the jth DMU; ε is non-Archimedes infinitesimal; λj is the weighting factor; s is relaxation variables, while s+ is a residual variable. Additionally, θ (0 < θ ≤ 1) represents TE, which is a comprehensive measure and evaluation of the resource disposition ability and utilization efficiency of a DMU [26]. In this paper, the higher the θ value, the higher the efficiency of its water transport.
j = 1 k λ j = 1
A convexity assumption in Equation (3) is added to the BC2 model based on the C2R model. Under the assumption of variable returns to scale (VRS), TE is decomposed into pure technical efficiency (PE) and scale efficiency (SE). PE is the efficiency of the system and management level, while SE refers to the degree of the existing scale compared to the optimal scale under the premise of the specific system and the management level. The greater the values of the two indexes, PE and SE, the higher the contribution to TE.

2.2. The Malmquist Index

The Malmquist index was originally proposed by Malmquist [27] followed by Caves et al., who applied this index to a study of total factor productivity changes. Charnes et al. attempted to combine the index with the DEA model [23,24,25]. Färe et al. proposed a non-parametric linear programming algorithm for this theory and established the Malmquist total factor productivity index (TFPch). The authors thus decomposed TFPch into the product of technological changes (TECHch) and technical efficiency changes (TEch) from the output angle (O) using the Shephard distance function [28,29,30], which became a widely used research method. The three classic equations are expressed as follows:
M o ( x t , y t , x t + 1 , y t + 1 ) = [ D o t + 1 ( x t + 1 , y t + 1 ) D o t + 1 ( x t , y t ) × D o t ( x t + 1 , y t + 1 ) D o t ( x t , y t ) ] 1 2 = TFPch
In Equation (4), xt and xt+1 refer to input vectors in period t and period t + 1, respectively; while yt, yt+1 represent output vectors in period t and period t + 1; Dot(xt, yt) and Dot+1(xt+1, yt+1) indicate the distance function [31] of production points in period t and period t + 1, taking period t as a technical reference. Dot+1(xt, yt) and Dot+1(xt+1, yt+1) represent the distance function of production points in period t and period t + 1 taking period t + 1 as a technical reference. If TFPch > 1, this implies that the water transport efficiency of the DMU is improved from period t and period t + 1. If TFPch < 1, this implies that the efficiency is on the decline. If TFPch = 1, this implies no change in efficiency [32,33].
M o ( x t , y t , x t + 1 , y t + 1 ) = D o t + 1 ( x t + 1 , y t + 1 ) D o t ( x t , y t ) × [ D o t ( x t + 1 , y t + 1 ) D o t + 1 ( x t + 1 , y t + 1 ) × D o t ( x t , y t ) D o t + 1 ( x t , y t ) ] 1 2 = TEch × TECHch
Equation (5) is the deformation of Formula (4), which indicates that the change in total factor productivity is the product of TEch and TECHch. TEch > 1 indicates that the production of DMU is closer to the production frontier, and TE has improved. TEch < 1 indicates that the production of DMU moves below the production frontier with reduced TE. TEch = 1 indicates that the TE of DMU is maintained. Moreover, TECHch represents the movement of the frontiers in both periods and, when TECHch > 1, this indicates that the production frontier moves outward or upwards; that is, technological progress. If TECHch < 1, technology is degrading [34].
M v , c t , t + 1 = D v t + 1 ( x t + 1 , y t + 1 ) D v t ( x t , y t ) × [ D v t ( x t , y t ) D c t ( x t , y t ) / D v t + 1 ( x t + 1 , y t + 1 ) D c t + 1 ( x t + 1 , y t + 1 ) ] × [ D c t ( x t , y t ) D c t + 1 ( x t , y t ) × D c t ( x t + 1 , y t + 1 ) D c t + 1 ( x t + 1 , y t + 1 ) ] 1 2 = PEch × SEc h × TECHch
Equation (6) is the further decomposition of TEch when the returns to scale are variable [35,36]. The first term represents pure technological change (PEch). If PEch > 1, the efficiency of the factor inputs is improving, while PEch < 1 indicates that efficiency is deteriorating. The second term indicates the scale efficiency change (SEch), and SEch also has the same change meaning as above.

2.3. Index Selection and Data Processing

China’s water transport statistics, regardless of the amount, scale, accuracy, and other aspects, are inferior to those of road or rail transport. Their comparability and poor availability create some difficulties for quantitative study. Therefore, considering the purpose of the study, the requirements of the model and the availability of the data, the following input-output indicators are selected and processed in the framework of the neoclassical economic growth theory [37]. In particular, the concept of water transport in this study includes inland water transport and deep sea water transport in the YREZ. Therefore, the relevant indicators contain the two parts.
The author selects employee statistics and investment in fixed assets in the water transport industry as input indicators to represent labor input and capital input separately based on China Labor Statistical Yearbook (2003–2012) and China Statistical Yearbook on Fixed Assets Investment (2004–2012). Currently, the main service object of water transport is bulk cargo; thus, freight volume and cargo turnover of water transport are chosen as the output index of the model [38]. The data are derived from China Statistical Yearbook (2004–2012). The data on the water transport industry in 2003 and 2008 were missing but were replaced with the mean of the nearest neighbor effective data at both ends because the numerical changes are relatively stable. The optimal indicator of capital investment is capital stock for which the calculating method is non-uniform, subjective, very complex, and with different calculated results. The author abandoned the efforts on the index and turned to Investment in Fixed Assets of Cities and Towns of the water transport industry as an alternative index for capital stock. Moreover, the comparability of dates in the time dimension increases to reflect the real investment situation of fixed assets [39] and perform smooth reduction using the year of 2003 as the base period in accordance with the fixed asset price index.

3. Results

3.1. Spatial Pattern Evolution of Water Transport Efficiency Based on the DEA Model

Using software DEAP 2.1, the author obtained the water transport efficiency coupled with decomposition results for the seven provinces and two municipalities within the YREZ in 2003, 2006, 2009, and 2011 (Table 1).

The Overall Spatial Pattern Evolution of Water Transport Efficiency

Areas within the YREZ are divided into two categories: the efficient and inefficient [40], according to whether the efficiency of water transport is 1.0. The inefficient areas are further divided into relatively efficient, relatively median efficient, and relatively inefficient demarcated by 0.9 and 0.6. To reflect the spatial differentiation of the TE of water transport in each region visually, the results are imported into ArcGIS (Figure 1) for the overall spatial analysis of TE.
Table 1 and Figure 1 imply that the TE level of YREZ is in fluctuating decline, and the spatial evolution characteristics of the various region types are from complex scattered to clear contiguous with significant differences among provinces. The results are as follows: (1) the average TE for 2003 to 2011 is 0.715, which is derived from 0.741, 0.803, 0.610, and 0.706 in 2003, 2006, 2009, and 2011, respectively, reaching only 60~80% of the optimal level. The changing trend decreases after the increase and then rises again with an overall decline of 3.5%. (2) The ratios of the four region types (in the order of efficient, relatively efficient, relatively median efficient, and relatively ineffective regions) for 2003, 2006, 2009, and 2011 are 3:1:2:3, 3:0:4:2, 3:0:1:5, and 5:0:0:4, which shows that the two end types increased, and the intermediate type reduced to zero. In 2003 and 2006, the spatial pattern complexity of TE was higher, and the distribution of various types of regions was more dispersed. In 2009, the complexity was reduced because of relatively inefficient areas grouped together, resulting in the spatial structure becoming increasingly clear. In 2011, “polarization” was obvious; that is, the efficient areas such as Shanghai, Zhejiang, Anhui, Jiangxi, and Hunan were concentrated in the eastern and central region, and ineffective areas such as Hubei, Chongqing, and Sichuan were concentrated in the central and western regions, while Jiangsu Province was divided by Anhui as an “island-like” distribution. (3) The index values of the worst cases are 0.198, 0.598, 0.222, and 0.274, which are obviously different from the highest value of 1.0 each year. In terms of performance, Shanghai ranks highest followed by Zhejiang, Anhui, and Hunan while Chongqing, Sichuan ranks the lowest.
From the TE decomposition results, spatial evolution of the mean PE is similar to TE, showing an inverted “U” pattern that first rises and then declines. The data show its value to be 0.851 in 2003 and 0.942 in 2006, yet it fell to 0.767 and 0.757 in 2009 and 2011 with a decrease of 9.4%. The PE of Jiangsu, Hubei, and Sichuan decreased significantly during the inspection period, while the values of Shanghai, Zhejiang, and Jiangxi were always 1.0 (the highest, for the time section). Furthermore, the spatial pattern of scale efficiency has changed little, with an overall upward trend, increasing from 0.869 in 2003 to 0.916 in 2011 by 4.7%.
For scale returns, the number of regions with constant returns increased from three in 2003, 2006, and 2009 to five in 2011, indicating that the regions with the best production scale were increasing. The regions with decreasing returns to scale were the largest in 2009, accounting for 55.6% of the YREZ and 33.3% in the remaining three years. That is, one-third of the area has input redundancy in water transport. The number of regions with increasing returns to scale was reduced from three in 2003 and 2006 to one in 2009 and 2011. This indicates that under performing areas are decreasing.

3.2. Regional Spatial Pattern Evolution of Water Transport Efficiency

To accurately measure the variation in efficiency of the entire regions and the eastern, central, and western regions, the coefficient of variation is used [41]. The equation is
V ( j ) = i = 1 n ( I i j I j ) 2 / N / I j
where Iij represents efficiency value j in area I, Ij indicates the mean j efficiency value of YREZ, and N is the number of areas. A larger V(j) value means a larger j variation in efficiency in the area. Table 1 and Figure 2 indicate that the TE shows an east > midland > west pattern in 2003 to 2009, but the midland “caught up” the eastern region in 2009 to 2011, and the variation among the three regions expanded after 2006. The PE shows three gradient patterns: highest in the east, followed by the midland, and lowest in the west. The sharing variation changes with the TE has been demonstrated clearly from 2003 to 2011. For scale efficiency, the overall difference among the three regions is not significant.

3.3. Changing Trends and Spatial Characteristics of Water Transport Efficiency Based on the Malmquist Index

3.3.1. Overall Change Trend Characteristics of Water Transport Efficiency

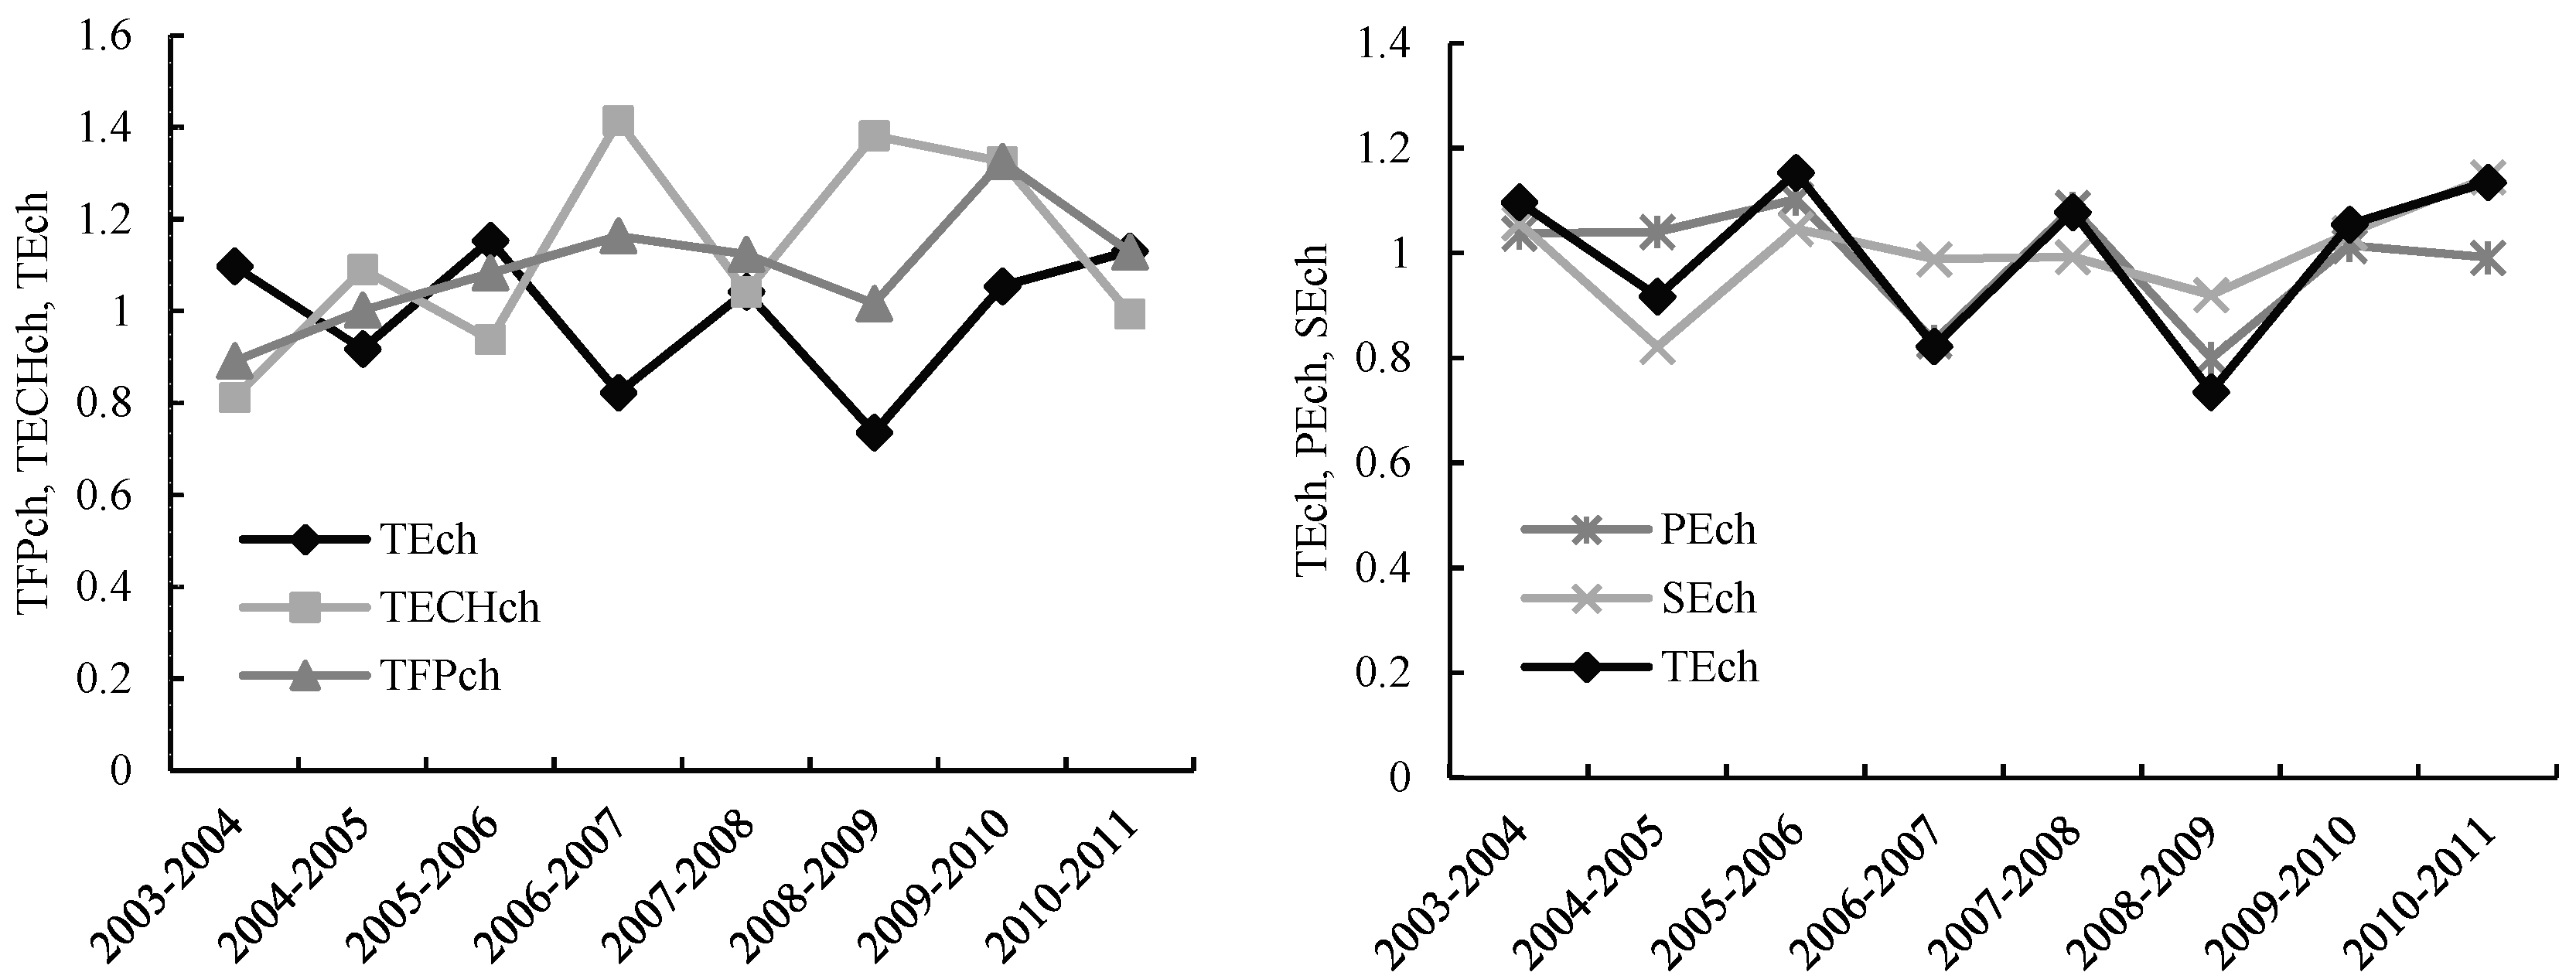
The Malmquist index analysis of the input-output panel data for YREZ in 2003 to 2011 was conducted to obtain the change situation of overall factor productivity [42,43] and its components for YREZ in the last decade (Figure 3).
Overall, the TFPch of water transport efficiency in the YREZ is 1.086 with an average annual growth rate of 8.6%, indicating that water transport efficiency has improved during this period. From the decomposition of TFPch, the TEch is 0.988 with an annual decrease of 1.2%, while the TECHch is 1.098 with average annual growth of 9.8%. Hence, TECHch is the source of water transport efficiency improvement [43], whereas TEch is a hindrance to it.
The annual average change in Figure 3 shows two peaks and one valley in TFPch during the period 2003 to 2011, a relatively low peak in 2006 to 2007 with an average annual increase of 16.4%, a valley period during 2008 to 2009 with a slight increase of 1.7%, and a high peak (1.326) during the period 2009 to 2010 with an average annual increase of 32.6%. TEch and TECHch fluctuates in the figure showing the general regularity of unconformity during the period 2003 to 2011. TEch in 2004 to 2005, 2006 to 2007, and 2008 to 2009 was less than 1.0, “dragging” the efficiency improvement of water transport. TECHch has declined in the three periods 2003 to 2004, 2005 to 2006, and 2010 to 2011. Overall, the push-pull effect of TECHch on water transport efficiency is greater than that of drag-drop. Thus, water transport efficiency maintained an average annual growth rate of 8.6%.
From the decomposition of TEch, the average annual negative growth rate of PEch is 1.7% indicating that the transport technology and management levels of water transport in YREZ are declining [44]. The mean change in SEch is 1.006, which is not significant. Because of the interaction between the two, the TEch declines at an average annual rate of 1.2%. Hence, it has a detrimental impact on the efficiency of water transport. Figure 3 shows that the change in PE is consistent with a fluctuating trend for TEch, while the change in SE is not obvious, indicating that the deterioration in PE is the main reason for the decrease in TE.

3.3.2. Spatial Characteristics of Water Transport Efficiency Trends

Based on the two scales of provinces and districts, the average change indicators for water transport efficiency for the period 2003 to 2011 (Table 2) are used to investigate the spatial characteristics of water transport efficiency trends in YREZ [45].
For TEch, the decreasing areas were Jiangsu, Hubei, and Sichuan, with an average annual drop of 8.1% during the period 2003 to 2011. The increasing areas were Jiangxi, Hunan, and Chongqing, with an average increase of 5.23%; Shanghai, Zhejiang, and Anhui remained constant. For TECHch, each province has improved in varying degrees, and Hunan showed the greatest progress, with technology enhanced at an annual speed of 20. There is a convergence in the spatial patterns of PE and TEch, while SE shows minimal change. Thus, the SEch of Jiangsu and Sichuan have shown negative growth, indicating a declining ability to allocate resources.
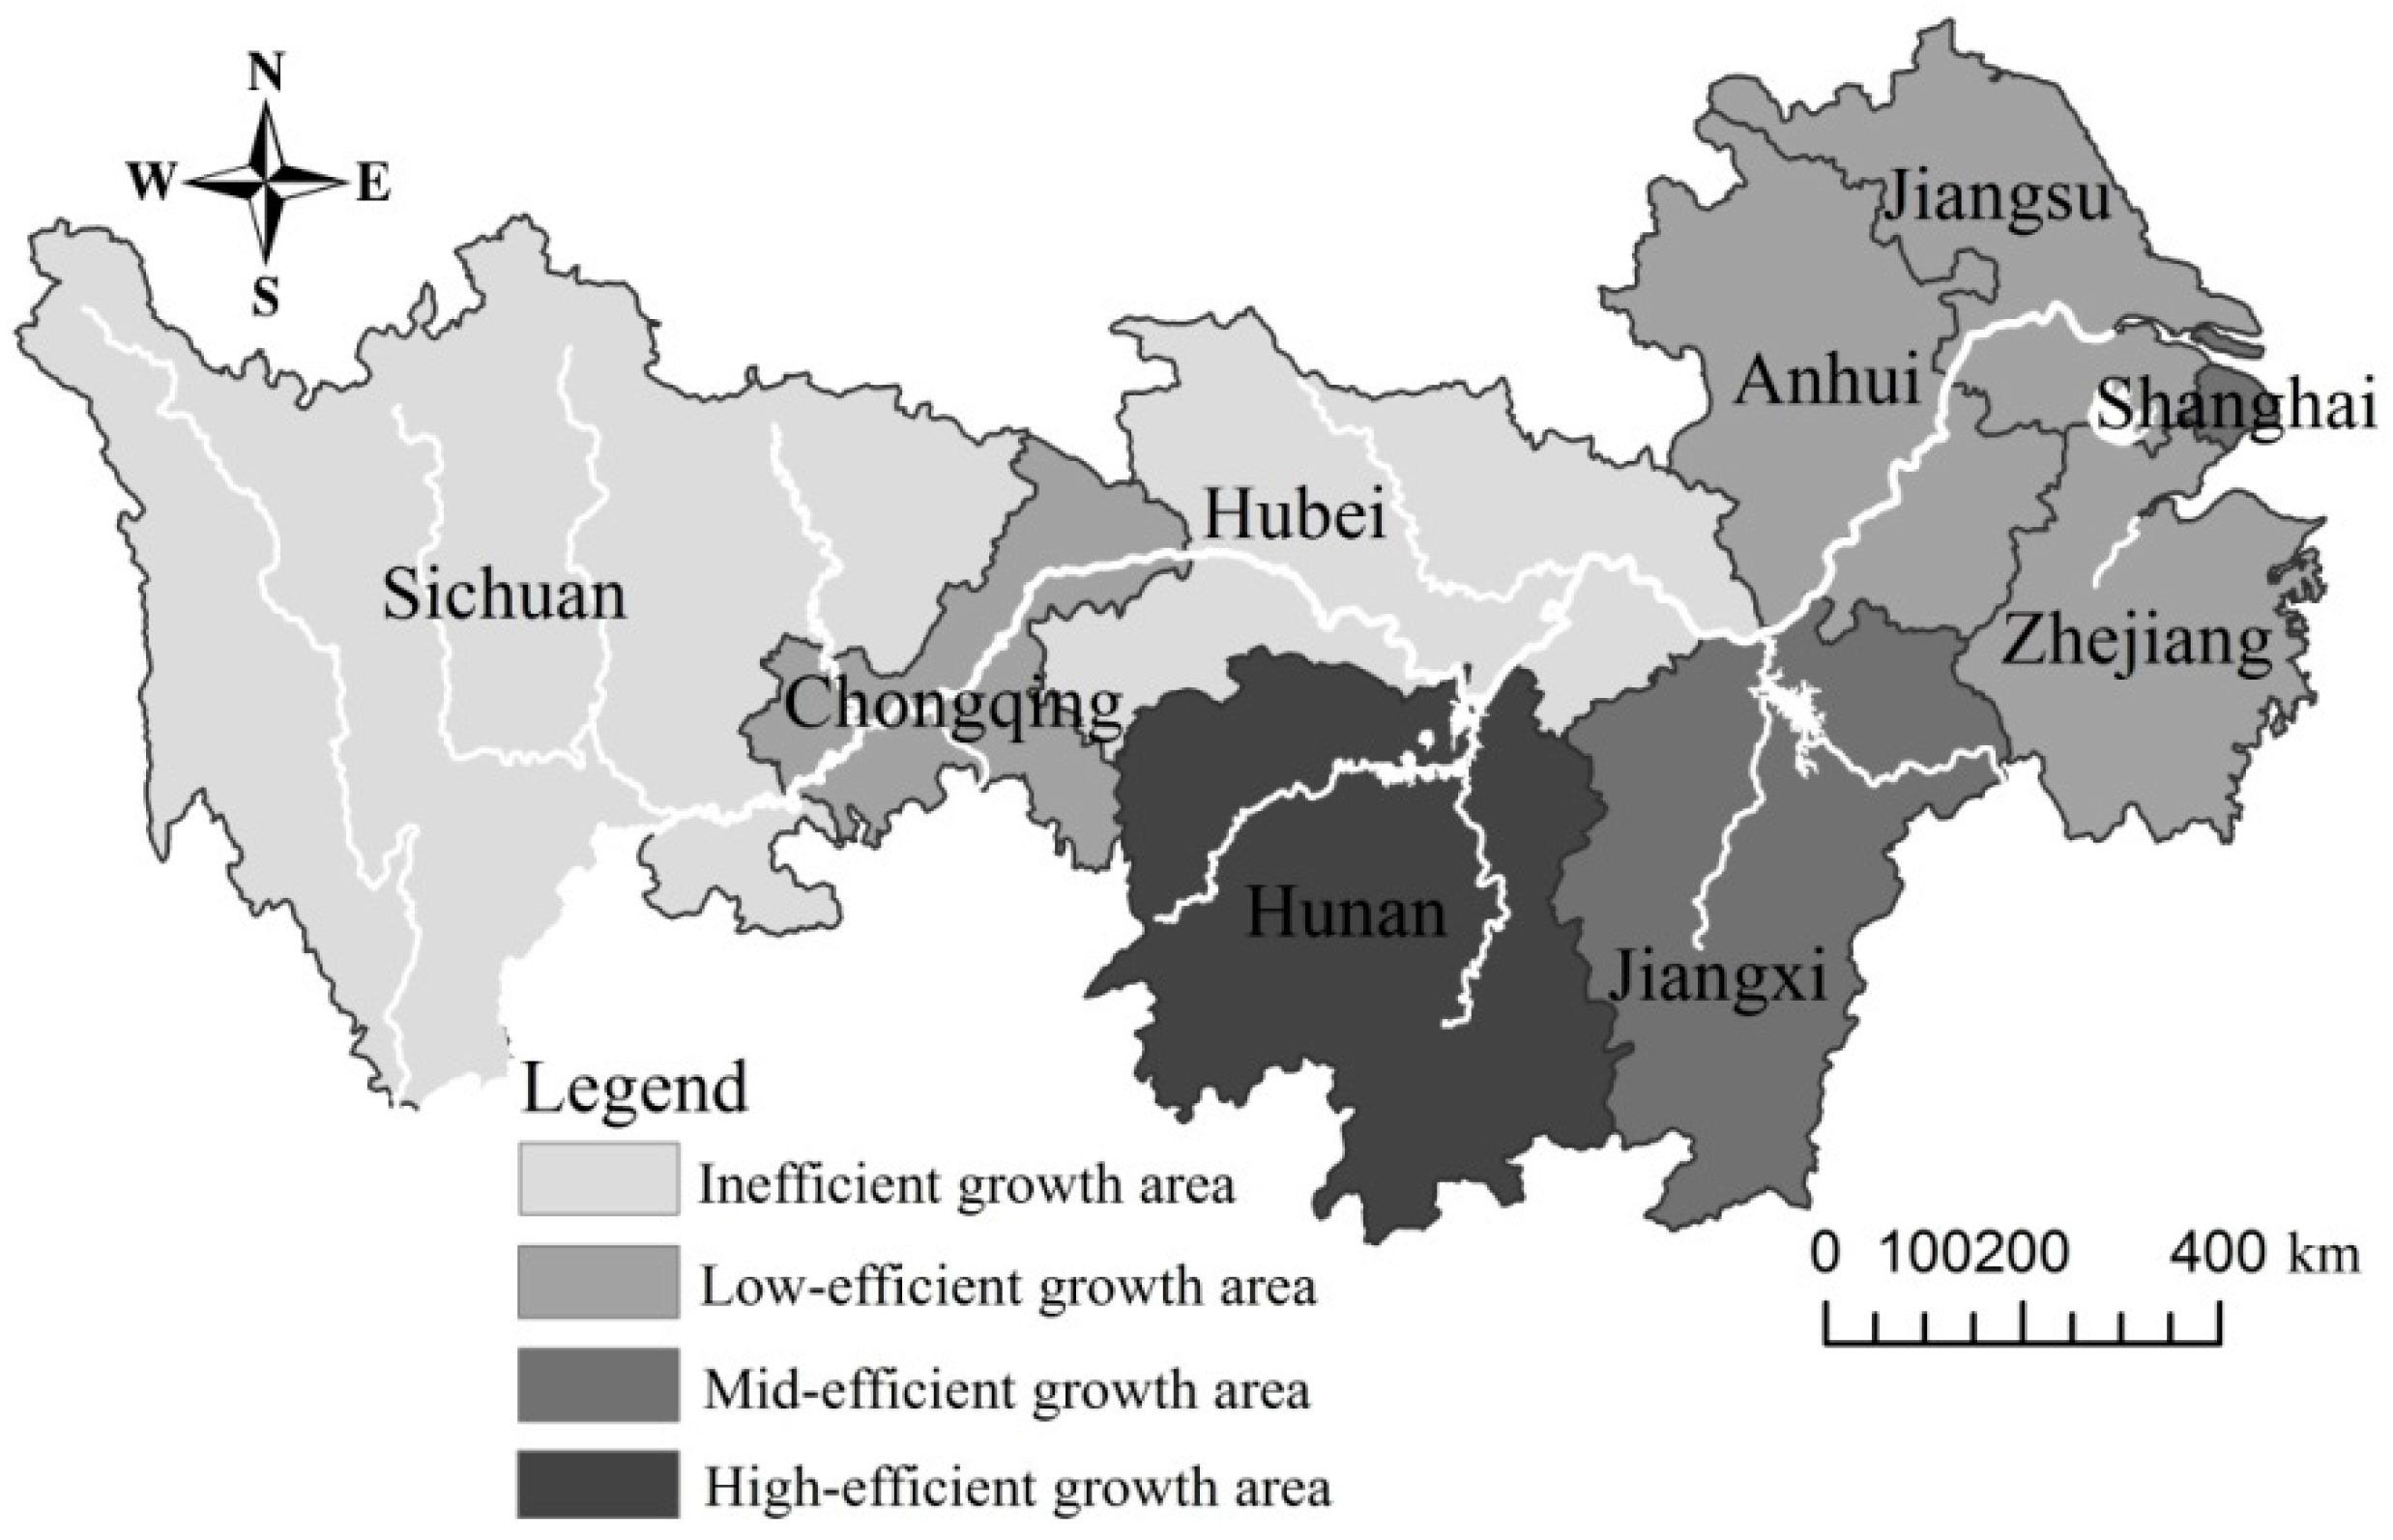
For TFPch, the region is divided into efficient and inefficient growth areas using 1.0 as the boundary according to the differences in the change trend for water transport efficiency in each province. The efficient growth area is further partitioned into three groups: high-efficient growth, mid-efficient growth, and low-efficient growth areas (Figure 4). Table 2 and Figure 4 show that the province with the most rapid growth in water transport efficiency from 2003 to 2011 is Hunan, with an average annual increase of nearly 30%. Areas with high efficiency include Shanghai and Jiangxi, with water transport efficiency improved by approximately 15%. The TECHch in these two regions are both greater than the TEch. That is, technological progress contributes more to the improvement of water transport efficiency [46]. The low-efficienct growth areas are Jiangsu, Zhejiang, Anhui, and Chongqing, where TFPch is between 1.0 and 1.1, with an average increase of 6%. Additionally, TECHch is greater than the TEch in the four regions. Low-efficienct growth areas are Hubei and Sichuan; both areas have decreasing TFPch.
Regarding to the changing trends in water transport efficiency in the YREZ, same tendencies exist among TE and SE (i.e., improvements in the central region but declines in the east and west). TECHch is greater than 1.0 in the three regions, with the increasing degree ranking as follows: midland > the west > the east, whereas PE always shows a downward trend. The western region declines the fastest, followed by the eastern parts and then the central parts; TFP in all three regions has improved. For the increasing rate, the order is midland > the east > the west. The range for technological progress shows the order east > midland > the west.

4. Discussion

The Yangtze Valley relies on water, one of its greatest assets, to bind upstream and downstream, left and right shore, as well as branch streams together for the construction of the economic and social macro system. Promoting the development of the YREZ is not only a major regional development strategy in China, but also a key link in the Silk Road Economic Belt and 21st-Century Maritime Silk Road. For a considerable time, there has been a lack of interactive contacts between the Belt and Road Initiative and the YREZ. In fact, the YREZ and the Belt and Road Initiative both run through eastern, central, and western China in one continuous line. It is a strategic plan conducive to China’s linkage development and opening up, internally and externally, as well as a coordinated development of coastal, inland, and border regions. It enhances transport connectivity, trade facilitation, policy coordination, and financial integration. A regional economic framework is expected to be well-established in the forthcoming years.
The regional layout of “Four corridors and one point” is embodied in the Belt and Road Initiative, for which water transport of the YREZ can play a significant role in maritime logistics. In recent years, the main contradiction of water transport has transformed from supply-demand shortage to technical efficiency. This study shows that water transport TE in YREZ is low and in fluctuating decline, and low transportation efficiency has seriously restricted performance and improvements in the service function. The overall situation of water transport efficiency based on the Malmquist index results has slightly improved because TECHch is the source of its improvement. Nevertheless, TEch is just the opposite. The decomposition result of TEch indicates that PEch shares a similar spatial pattern with TEch, while SEch is comparatively stable, indicating that worsening PEch is the main cause of the decrease in TE. Meanwhile, water transport enterprises in the economic zone have failed to absorb, transform, and innovate imported technology for their endogenous advantage. Finally, the partition characteristics of the zone show that water transport efficiency in the eastern region is higher and lower, respectively, in the central and western regions by comparison. Moreover, the gap has widened in recent years. Therefore, when implementing water transport development in the Yangtze River, it is vital to stimulate the leading role of shipping center construction in the Yangtze River Delta. This will achieve coordinated development of the upper, middle, and lower reaches of the Yangtze Valley represented by Shanghai International Shipping Center, Wuhan Shipping Center in the midstream of the Yangtze, and the Chongqing shipping center in the upstream of the Yangtze, and integrated transport channel construction along the Yangtze River.
In summary, we have a broadly reassuring picture of the level of efficiency in YREZ water transport. However, not all questions have been answered, and this study closes with some suggestions for further work. For instance, it is very important to discuss the connection between the sustainability of water transport and the quantitative availability of water across the Yangtze River network. Transport in general, including water transport, is absolutely the biggest energy consumer and the greatest contributor to pollution. Additionally, there is interplay between land-cover changes and the terrestrial water cycle disturbances under climate change at the global level, which may further influence water transport [47,48]. Thus, there is a need to extend the analysis to a discussion of an integrated approach that can elucidate the impacts of environmental degradation on stream flow and precipitation at the watershed scale.

Acknowledgments

The authors thank the editors and referees for their helpful comments and suggestions. This research was supported by the National Natural Science Foundation of China (Grant No. 41471138), the State Scholarship Fund of China Scholarship Council (Grant No. 201706145003), and the Key Project of Chief Research Base of Humanities and Social Sciences of MOE (Grant No. 11JJDZH007).

Author Contributions

The authors contributed equally to all sections of this paper. All the authors contributed to the research design. Dan He prepared the first draft. All the authors revised and approved the final manuscript.

Conflicts of Interest

The authors declare no conflict of interest.

References

  1. Wei, W.; Youhui, C.; Shuangbo, L. Review of transport efficiency and its research trends from the transport geography perspectives. Prog. Geogr. 2013, 32, 243–250. [Google Scholar]
  2. Woo, S.H.; Pettit, S.J.; Kwak, D.W.; Beresford, A.K.C. Seaport research: A structured literature review on methodological issues since the 1980s. Transp. Res. A Policy 2011, 45, 667–685. [Google Scholar] [CrossRef]
  3. Lau, Y.Y.; Ducruet, C.; Ng, A.K.Y.; Fu, X. Across the waves: A bibliometric analysis of container shipping research since the 1960s. Marit. Policy. Manag. 2017, 44, 667–684. [Google Scholar] [CrossRef]
  4. Cullinane, K.; Wang, T.F.; Song, D.W.; Ji, P. A comparative analysis of DEA and SFA approaches to estimating the technical efficiency of container ports. Transp. Res. A Policy 2005, 40, 354–374. [Google Scholar] [CrossRef]
  5. Itoh, H. Efficiency changes at major container ports in Japan: A window application of data envelopment analysis. Rev. Urban Reg. Dev. Stud. 2002, 14, 133–152. [Google Scholar] [CrossRef]
  6. Pevcin, P. Efficiency levels of sub-national governments: A comparison of SFA and DEA estimations. TQM J. 2014, 26, 275–283. [Google Scholar] [CrossRef]
  7. Ramanathan, R. A holistic approach to compare energy efficiencies of different transport modes. Energy Policy 2000, 28, 743–747. [Google Scholar] [CrossRef]
  8. Joanna, G.; Wysokińska, Z. Transport accessibility in light of the DEA method. Comp. Econ. Res. 2014, 17, 55–70. [Google Scholar]
  9. Boame, A.K. The technical efficiency of Canadian urban transit systems. Transp. Res. E Policy 2004, 40, 401–416. [Google Scholar] [CrossRef]
  10. Barnum, D.T.; Karlaftis, M.G.; Tandon, S. Improving the efficiency of metropolitan area transit by joint analysis of its multiple providers. Transp. Res. 2011, 47, 1160–1176. [Google Scholar] [CrossRef]
  11. Cantos, S.; Pastor, M.J.M.; Serrano, M.L. Productivity, efficiency and technical change in the European railways: A non-parametric approach. Transportation 1999, 26, 337–357. [Google Scholar] [CrossRef]
  12. Liangjie, Y.; Wei, W.; Su, Q.; Jiang, X.; Wei, Y. Evaluation of road transport efficiency in China during 1997–2010 based on SBM-undesirable model. Prog. Geogr. 2013, 32, 1602–1611. [Google Scholar]
  13. Wu, Y.C.J.; Goh, M. Container port efficiency in emerging and more advanced markets. Transp. Res. E Logist. Transp. Rev. 2010, 46, 1030–1042. [Google Scholar] [CrossRef]
  14. Calles, B. Fluvial Transportation in the River Västerdalälven. Geogr. Ann. Ser. A Phys. Geogr. 1980, 62, 63–74. [Google Scholar] [CrossRef]
  15. Gutiérrez, E.; Lozano, S.; Furió, S. Evaluating efficiency of international container shipping lines: A bootstrap DEA approach. Marit. Econ. Logist. 2014, 16, 55–71. [Google Scholar] [CrossRef]
  16. Blume, A.L. A Proposal for funding port dredging to improve the efficiency of the nation’s marine transportation system. J. Marit. Law Commer. 2002, 33, 37–89. [Google Scholar]
  17. Yip, T.L.; Lun, Y.H.V.; Lau, Y.Y. Scale diseconomies and efficiencies of liner shipping. Marit. Policy Manag. 2012, 39, 673–683. [Google Scholar] [CrossRef]
  18. Bowersox, D.J.; Closs, D.J.; Cooper, M.B.; Bowersox, J.C. Supply Chain Logistics Management, 4th ed.; McGraw-Hill: Singapore, 2013. [Google Scholar]
  19. Taofang, Y.; Feng, Z.; Hong, W. Regional structure of the Yangtze River Economic Belt: From the perspective of “core-periphery”. Urban Plan. Forum 2007, 3, 41–48. [Google Scholar]
  20. Odeck, J.; Bråthen, S. A meta-analysis of DEA and SFA studies of the technical efficiency of seaports: A comparison of fixed and random-effects regression models. Transp. Res. A Policy 2012, 46, 1574–1585. [Google Scholar] [CrossRef]
  21. Borger, B.D.; Kerstens, K. Cost efficiency of Belgian local governments: A comparative analysis of FDH, DEA, and econometric approaches. Reg. Sci. Urban Econ. 1996, 26, 145–170. [Google Scholar] [CrossRef]
  22. Simões, P.; Marques, R.C. Seaport performance analysis using robust non-parametric efficiency estimators. Transp. Plan. Technol. 2010, 33, 435–451. [Google Scholar] [CrossRef]
  23. Charnes, A.; Cooper, W.W.; Rhodes, E. Measuring the efficiency of decision making units. Eur. J. Oper. Res. 1978, 2, 429–444. [Google Scholar] [CrossRef]
  24. Charnes, A.; Cooper, W.W.; Lewin, A.Y.; Seiford, L. Data Envelopment Analysis: Theory, Methodology, and Application. J. Oper. Res. Soc. 1997, 48, 332–333. [Google Scholar] [CrossRef]
  25. Banker, R.D.; Charnes, A.; Cooper, W.W. Some models for estimating technical and scale inefficiencies in data envelopment analysis. Manag. Sci. 1984, 30, 1078–1092. [Google Scholar] [CrossRef]
  26. Emrouznejad, A.; Anouze, A.L.; Thanassoulis, E. A semi-oriented radial measure for measuring the efficiency of decision making units with negative data, using DEA. Eur. J. Oper. Res. 2010, 200, 297–304. [Google Scholar] [CrossRef]
  27. Malmquist, S. Index numbers and indifference Surfaces. Trabaios de Estadistica 1953, 4, 209–232. [Google Scholar] [CrossRef]
  28. Färe, R.; Grosskopf, S.; Norris, M.; Zhang, Z. Productivity growth, technical progress, and efficiency change in industrialized countries. Am. Econ. Rev. 1994, 84, 66–83. [Google Scholar]
  29. Färe, R.; Lovell, C.A.K. Biased technical change and the Malmquist productivity index. Scand. J. Econ. 1997, 99, 119–127. [Google Scholar] [CrossRef]
  30. Färe, R.; Grosskopf, S. Inter-temporal production frontiers: With dynamic DEA J. Oper. Res. Soc. 1997, 48, 656. [Google Scholar] [CrossRef]
  31. Chambers, R.G.; Chung, Y.; Färe, R. Profit, Directional Distance Functions, and Nerlovian Efficiency. J. Optim. Theory Appl. 1998, 98, 351–364. [Google Scholar] [CrossRef]
  32. Zhu, J. Robustness of the efficient DMUs in data envelopment analysis. Eur. J. Oper. Res. 1996, 90, 451–460. [Google Scholar] [CrossRef]
  33. Park, R.K.; De, P. An alternative approach to efficiency measurement of seaports. Marit. Econ. Logist. 2004, 6, 53–69. [Google Scholar] [CrossRef]
  34. Cullinane, K.; Wang, T.F.; Song, D.W.; Ji, P. The technical efficiency of container ports: Comparing data envelopment analysis and stochastic frontier analysis. Transp. Res. A Policy 2006, 40, 354–374. [Google Scholar] [CrossRef]
  35. Tongzon, J. Efficiency measurement of selected Australian and other international ports using data envelopment analysis. Transp. Res. A Policy 2001, 35, 107–122. [Google Scholar] [CrossRef]
  36. González, M.M.; Trujillo, L. Reforms and infrastructure efficiency in Spain’s container ports. Transp. Res. A Policy 2008, 42, 243–257. [Google Scholar] [CrossRef]
  37. Roll, Y.; Hayuth, Y. Port performance comparison applying date envelopment analysis (DEA). Marit. Policy Manag. 1993, 20, 153–161. [Google Scholar] [CrossRef]
  38. Cullinane, K.; Song, D.W.; Ji, P.; Wang, T.F. An application of DEA windows analysis to container port production efficiency. Rev. Netw. Econ. 2010, 3, 184–206. [Google Scholar] [CrossRef] [Green Version]
  39. Caves, D.W.; Christensen, L.R.; Diewert, W.E. The economic theory of index numbers and the measurement of input, output and productivity. Econometrica 1982, 5, 1393–1414. [Google Scholar] [CrossRef]
  40. Oliveira, G.F.; Cariou, P. A DEA study of the efficiency of 122 iron ore and coal ports and of 15/17 countries in 2005. Marit. Policy Manag. 2011, 38, 727–743. [Google Scholar] [CrossRef]
  41. Barros, C.P.; Athanassiou, M. Efficiency in European seaports with DEA: Evidence from Greece and Portugal. Marit. Econ. Logist. 2004, 6, 122–140. [Google Scholar] [CrossRef]
  42. Panayides, P.M.; Maxoulis, C.N.; Wang, T.F.; Ng, K.Y.A. A critical analysis of DEA applications to seaport economic efficiency measurement. Transp. Rev. 2009, 29, 183–206. [Google Scholar] [CrossRef]
  43. Portela, M.C.A.S.; Thanassoulis, E.; Horncastle, A.; Maugg, T. Productivity change in the water industry in England and Wales: Application of the meta-Malmquist index. J. Oper. Res. Soc. 2011, 62, 2173–2188. [Google Scholar] [CrossRef]
  44. Niavis, S.; Tsekeris, T. Ranking and causes of inefficiency of container seaports in South-Eastern Europe. Eur. Transp. Res. Rev. 2012, 4, 235–244. [Google Scholar] [CrossRef]
  45. Wang, T.; Cullinane, K. The Efficiency of European Container Terminals and Implications for Supply Chain Management. Palgrave Macmillan UK 2015, 8, 82–99. [Google Scholar]
  46. Wanke, P.F. Determinants of scale efficiency in the Brazilian third-party logistics industry from 2001 to 2009. BAR Braz. Adm. Rev. 2012, 9, 66–87. [Google Scholar] [CrossRef]
  47. Djebou, D.C.S.; Singh, V.P. Impact of climate change on precipitation patterns: A comparative approach. Int. J. Climatol. 2016, 36, 3588–3606. [Google Scholar] [CrossRef]
  48. Djebou, D.C.S. Integrated approach to assessing streamflow and precipitation alterations under environmental change: Application in the Niger River Basin. J. Hydrol. B. 2015, 4, 571–582. [Google Scholar]
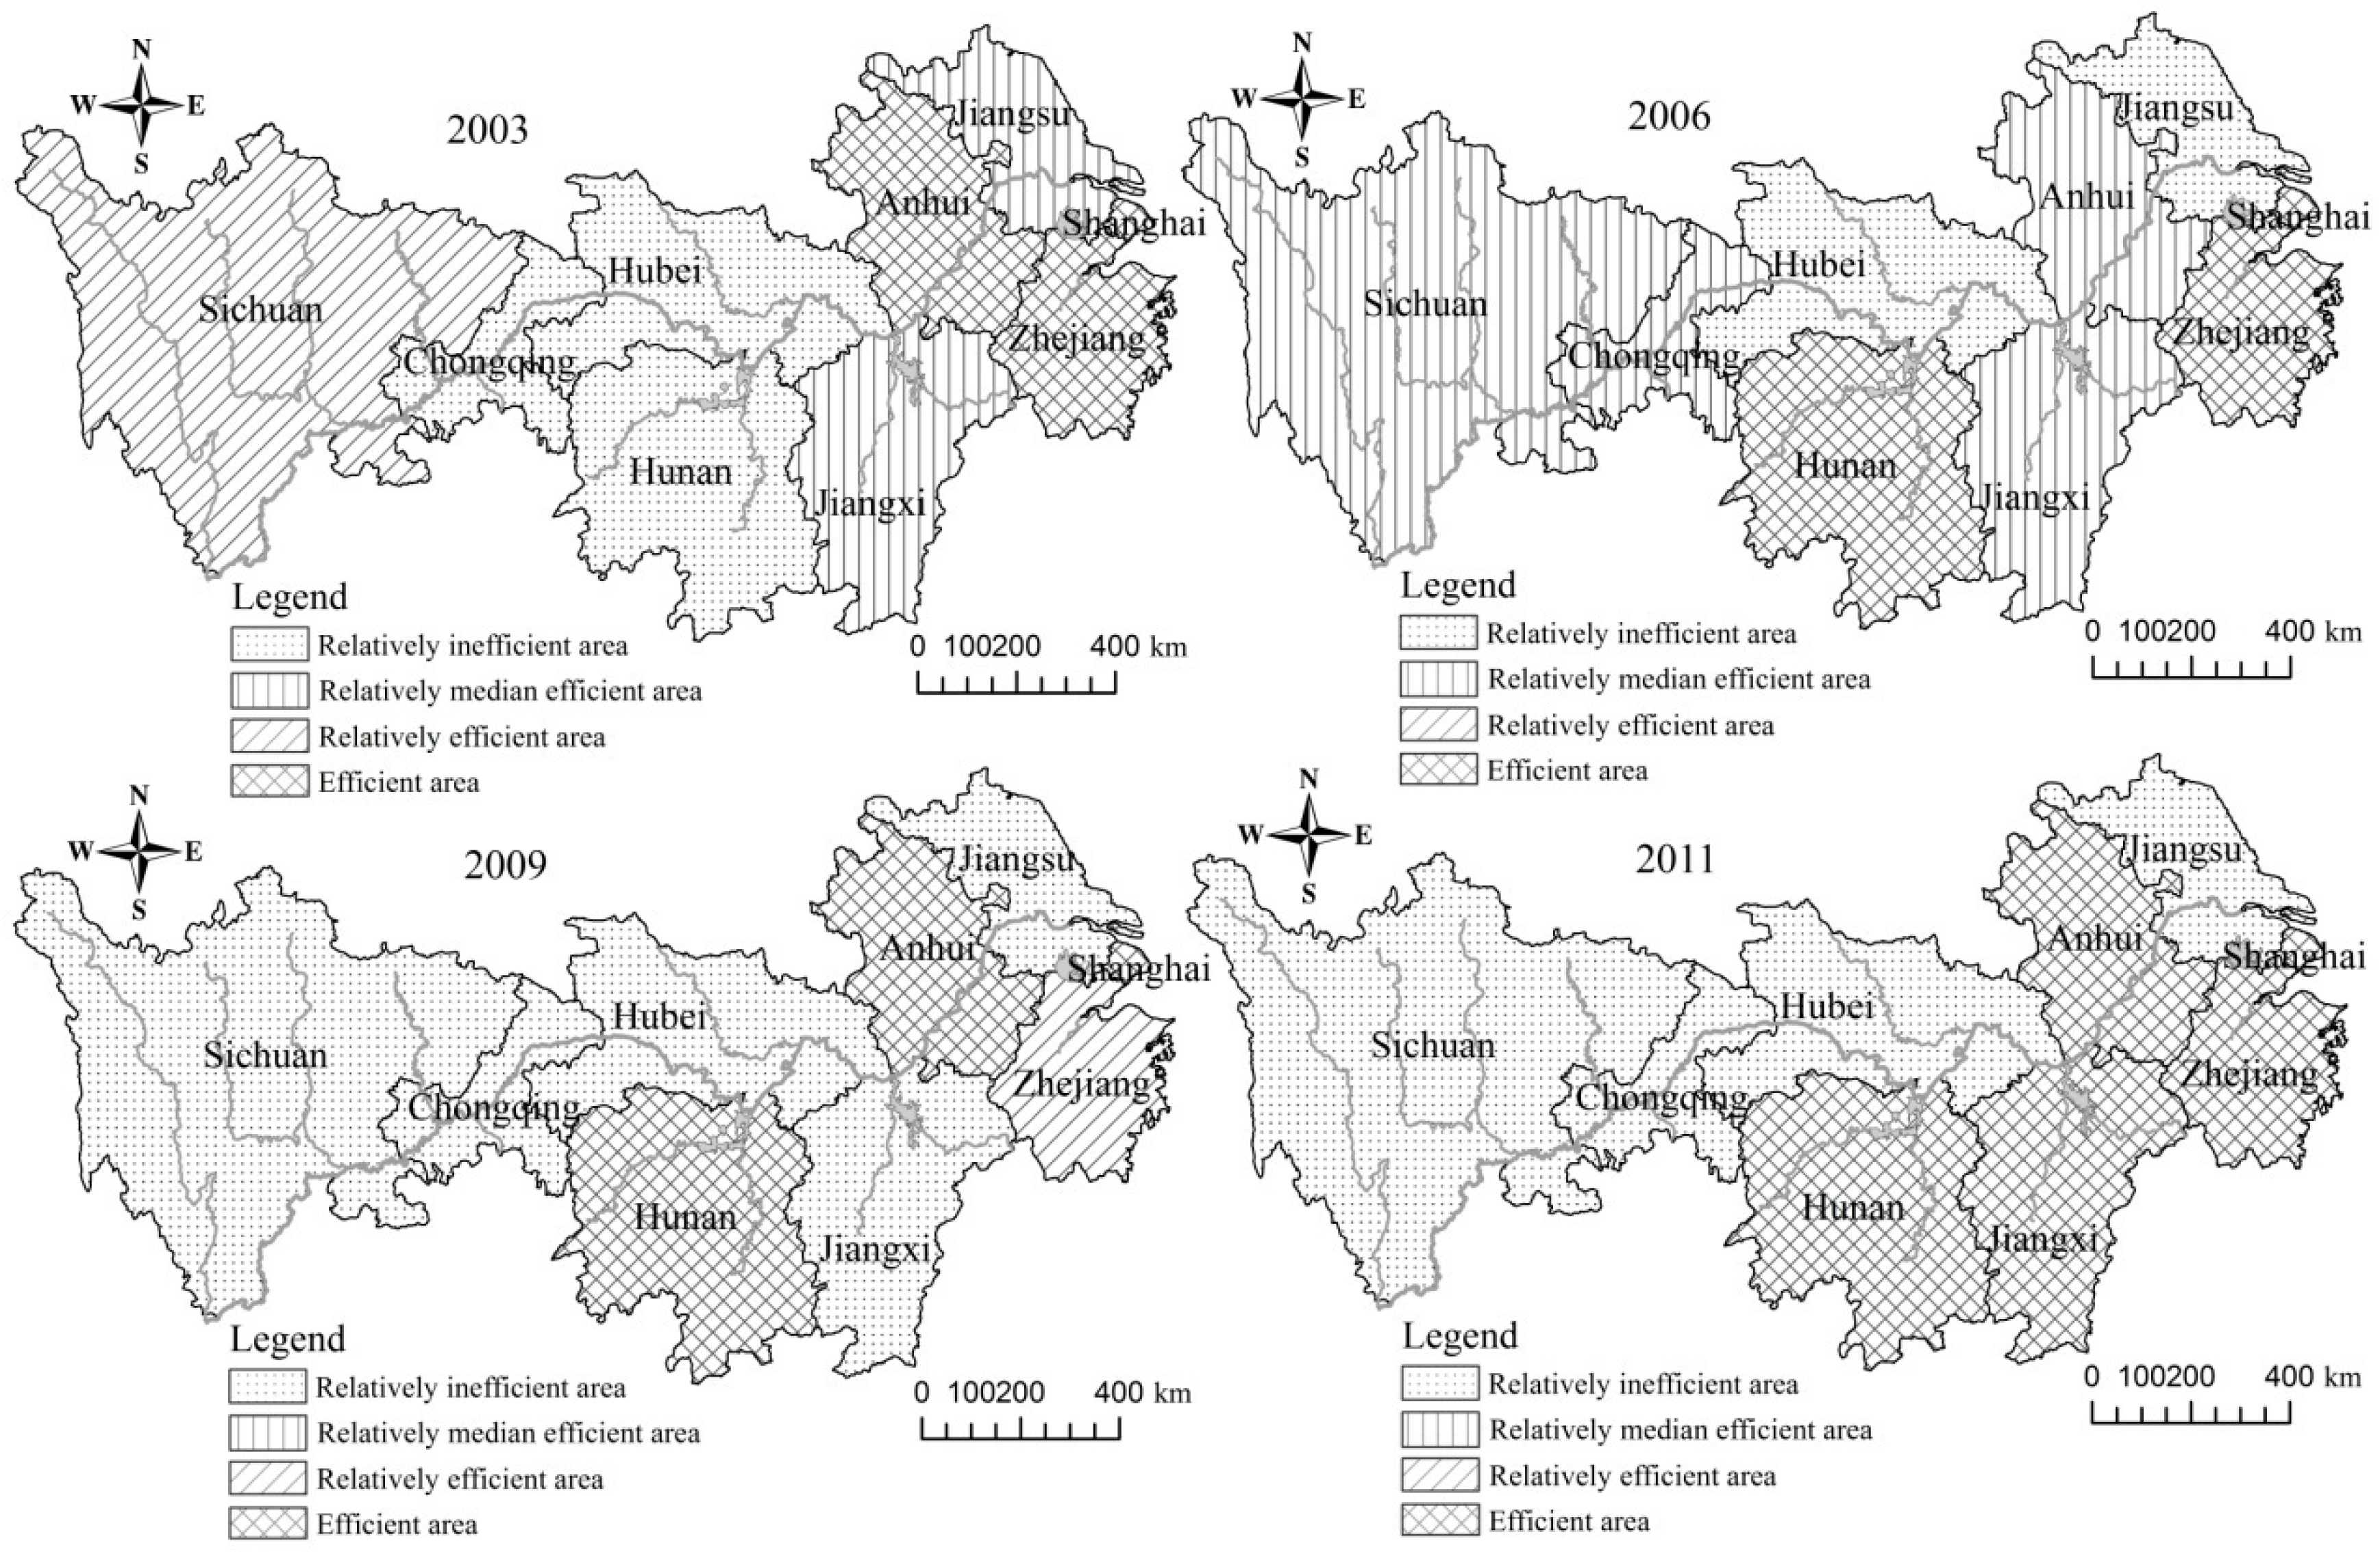
Figure 1. Spatial pattern evolution of the technical efficiency of water transport in Yangtze River Economic Zone from 2003 to 2011.
Sustainability 09 02278 g001
Figure 2. Variation coefficient of water transport efficiency and decomposition in three regions of the Yangtze River Economic Zone from 2003 to 2011. (a) Technical efficiency (TE); (b) Pure technical efficiency (PE); (c) Scale efficiency (SE).
Sustainability 09 02278 g002
Figure 3. Efficiency changes of water transport in Yangtze River Economic Zone from 2003 to 2011.
Sustainability 09 02278 g003
Figure 4. Water transport efficiency changes in the Yangtze River Economic Zone from 2003 to 2011.
Sustainability 09 02278 g004
Table 1. Water transport efficiency and decomposition in Yangtze River Economic Zone from 2003 to 2011.
RegionTechnical EfficiencyPure Technology Efficiency
20032006200920112003200620092011
Shanghai1.0001.0001.0001.0001.0001.0001.0001.000
Jiangsu0.6240.5140.3320.3891.0000.8610.9000.744
Zhejiang1.0001.0000.9201.0001.0001.0001.0001.000
Anhui1.0000.8441.0001.0001.0000.9741.0001.000
Jiangxi0.7160.7840.4391.0001.0001.0001.0001.000
Hubei0.5830.5980.3020.4070.8420.8780.4550.410
Hunan0.5691.0001.0001.0000.5751.0001.0001.000
Chongqing0.1980.7070.2220.2740.2420.7690.2550.375
Sichuan0.9770.7810.2740.2871.0001.0000.2950.287
The east0.8750.8380.7510.7961.0000.9540.9670.917
The central0.7170.8070.6850.8520.8540.9630.8640.853
The west0.5880.7440.2480.2810.6210.8850.2750.331
Mean0.7410.8030.6100.7060.8510.9420.7670.757
RegionScale EfficiencyScale Return
20032006200920112003200620092011
Shanghai1.0001.0001.0001.000
Jiangsu0.6240.5970.3690.523drsdrsdrsdrs
Zhejiang1.0001.0000.9201.000drs
Anhui1.0000.8661.0001.000drs
Jiangxi0.7160.7840.4391.000irsirsirs
Hubei0.6920.6810.6640.993drsdrsdrsirs
Hunan0.9901.0001.0001.000irs
Chongqing0.8220.9200.8690.733drsirsdrsdrs
Sichuan0.9770.7810.9270.998irsirsdrsdrs
The east0.8750.8660.7630.841
The central0.8500.8330.7760.998
The west0.9000.8510.8980.866
Mean0.8690.8480.7990.916
Notes: “irs” is increasing scale efficiency, “drs” is diminishing scale efficiency, and “—” indicates that scale benefits remain unchanged.
Table 2. Inter-provincial and district water transport efficiency changes of the Yangtze River Economic Zone from 2003 to 2011.
RegionTEchTECHchPEchSEchTFPch
Shanghai1.0001.1441.0001.0001.144
Jiangsu0.9431.1270.9640.9781.063
Zhejiang1.0001.0601.0001.0001.060
Anhui1.0001.0211.0001.0001.021
Jiangxi1.0431.1281.0001.0431.177
Hubei0.9561.0340.9141.0460.989
Hunan1.0731.2031.0721.0011.291
Chongqing1.0411.0501.0560.9861.094
Sichuan0.8581.1280.8561.0030.968
The east0.9811.1100.9880.9931.089
The central1.0181.0970.9971.0231.120
The west0.9501.0890.9560.9951.031
Mean0.9881.0980.9831.0061.086