Social Sustainability of Provinces in China: A Data Envelopment Analysis (DEA) Window Analysis under the Concepts of Natural and Managerial Disposability

Abstract
:1. Introduction
2. Literature Review
3. China’s Current Environmental Policies
4. Methodology
4.1. The Production Technologies and the Concepts of Disposability
4.2. Unified Efficiency and the Disposability Concepts
4.3. DEA Window Analysis
5. Empirical Results
5.1. The Data
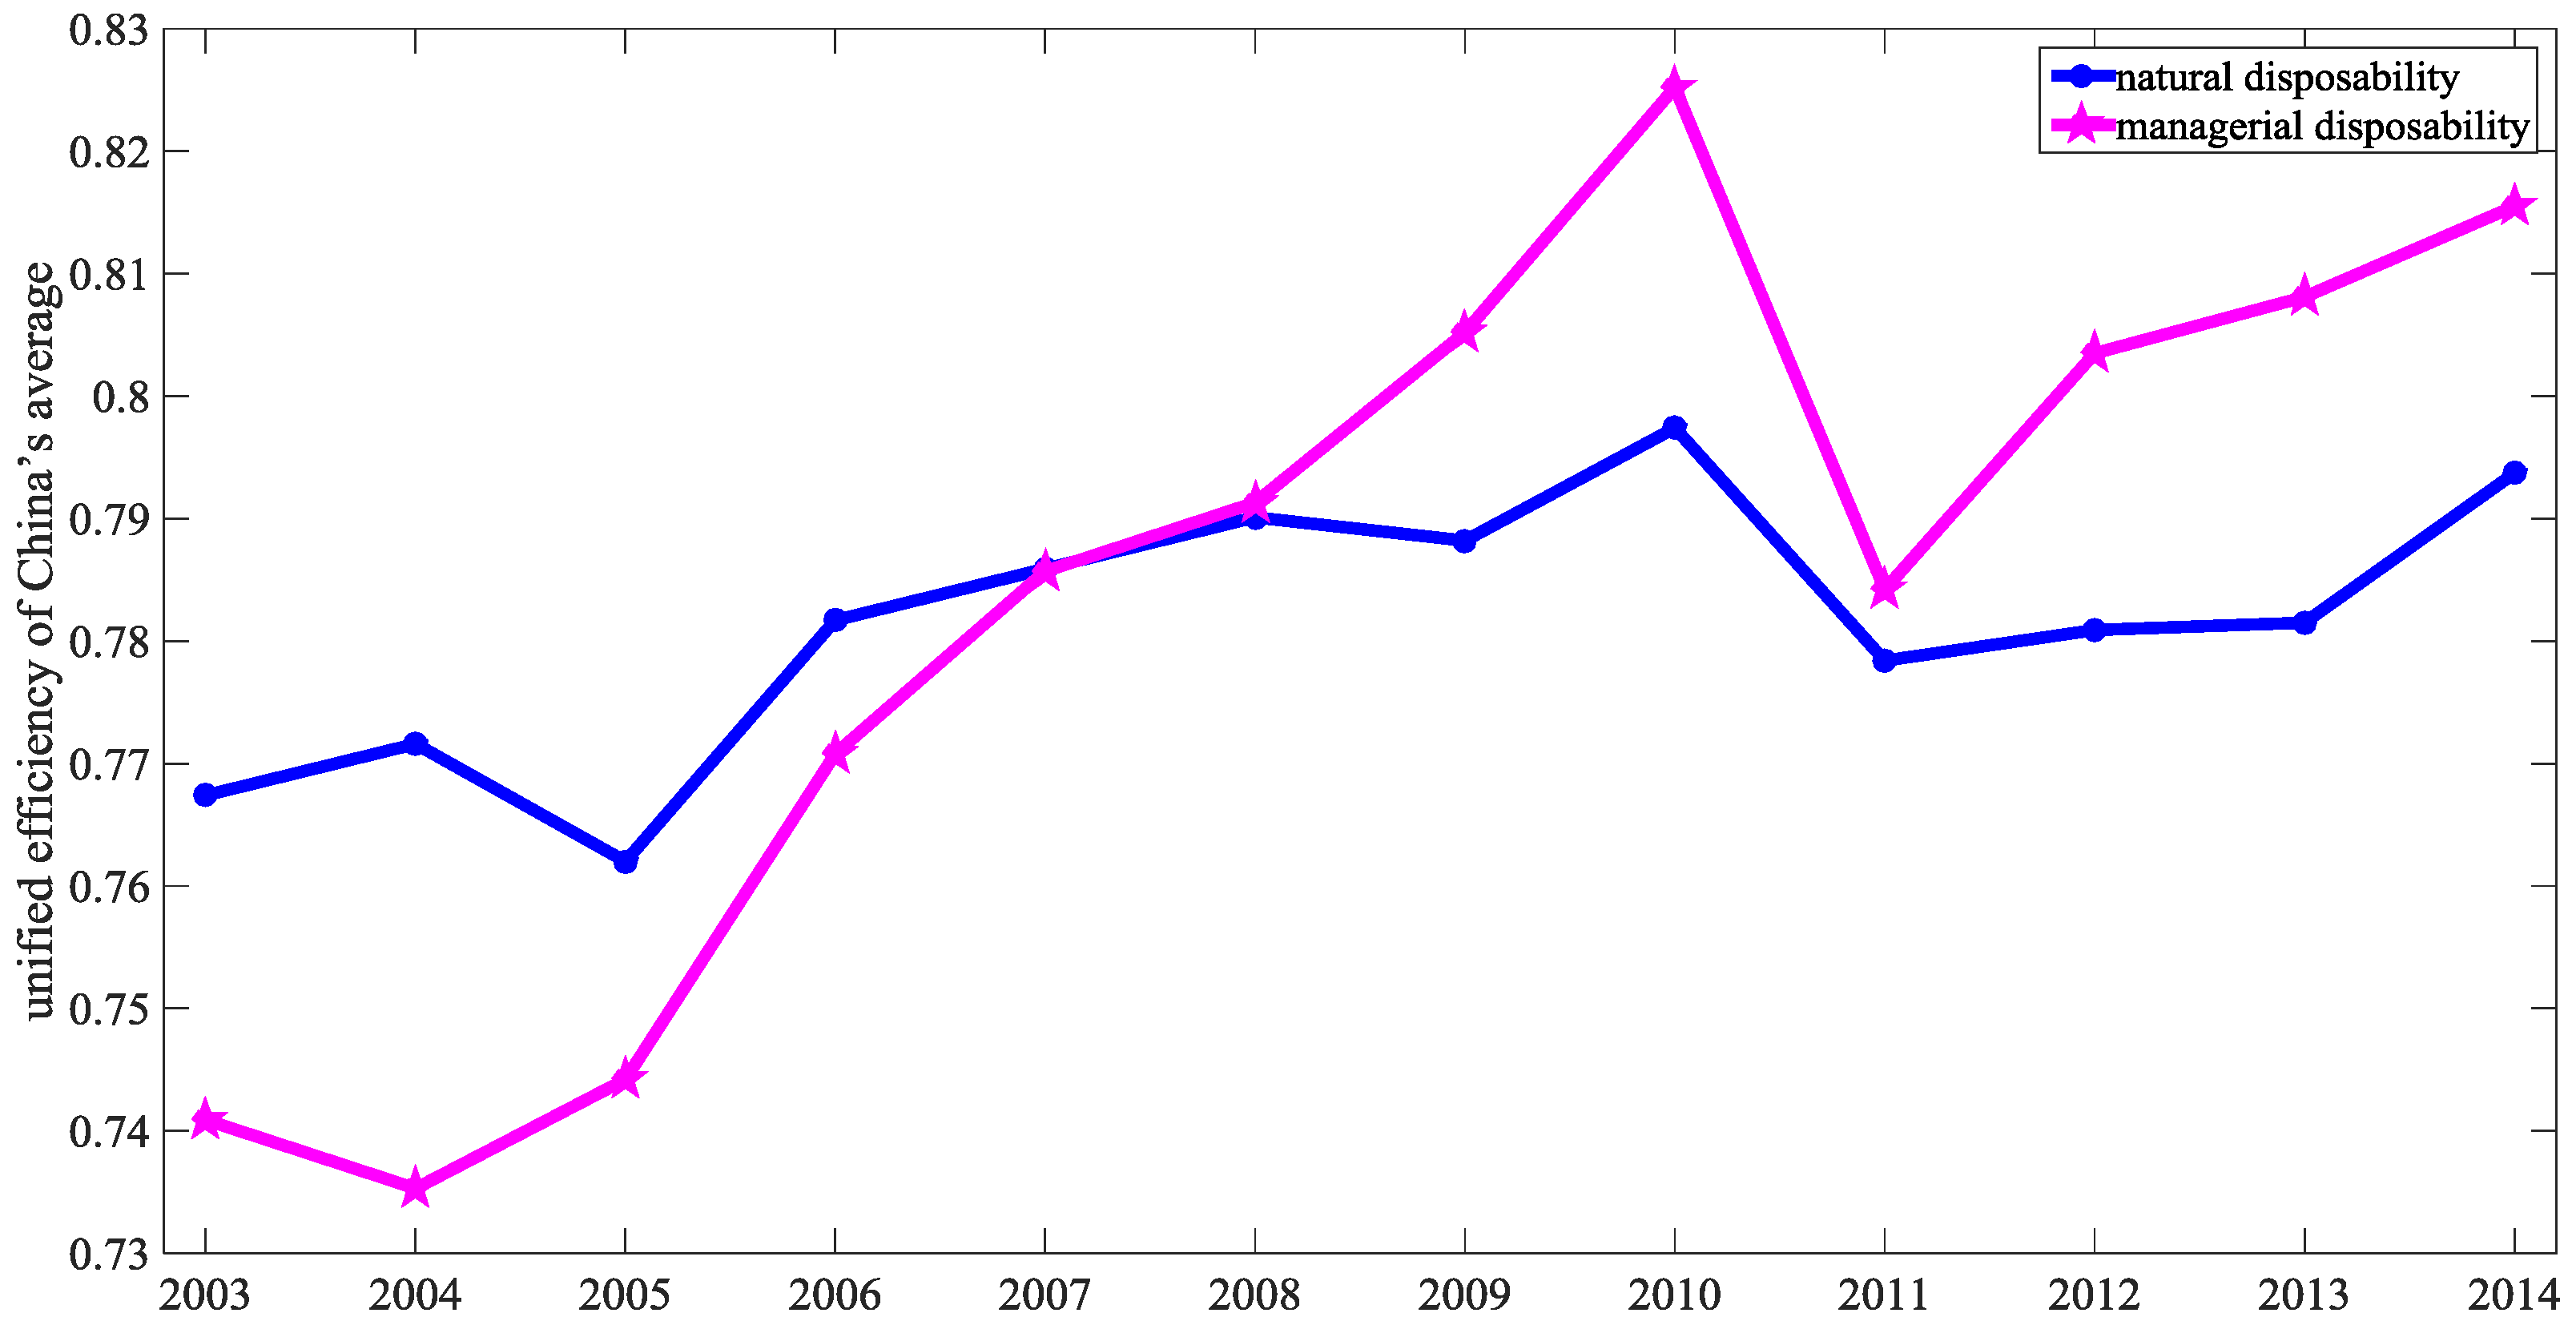
5.2. Unified Efficiency under Natural and Managerial Disposability
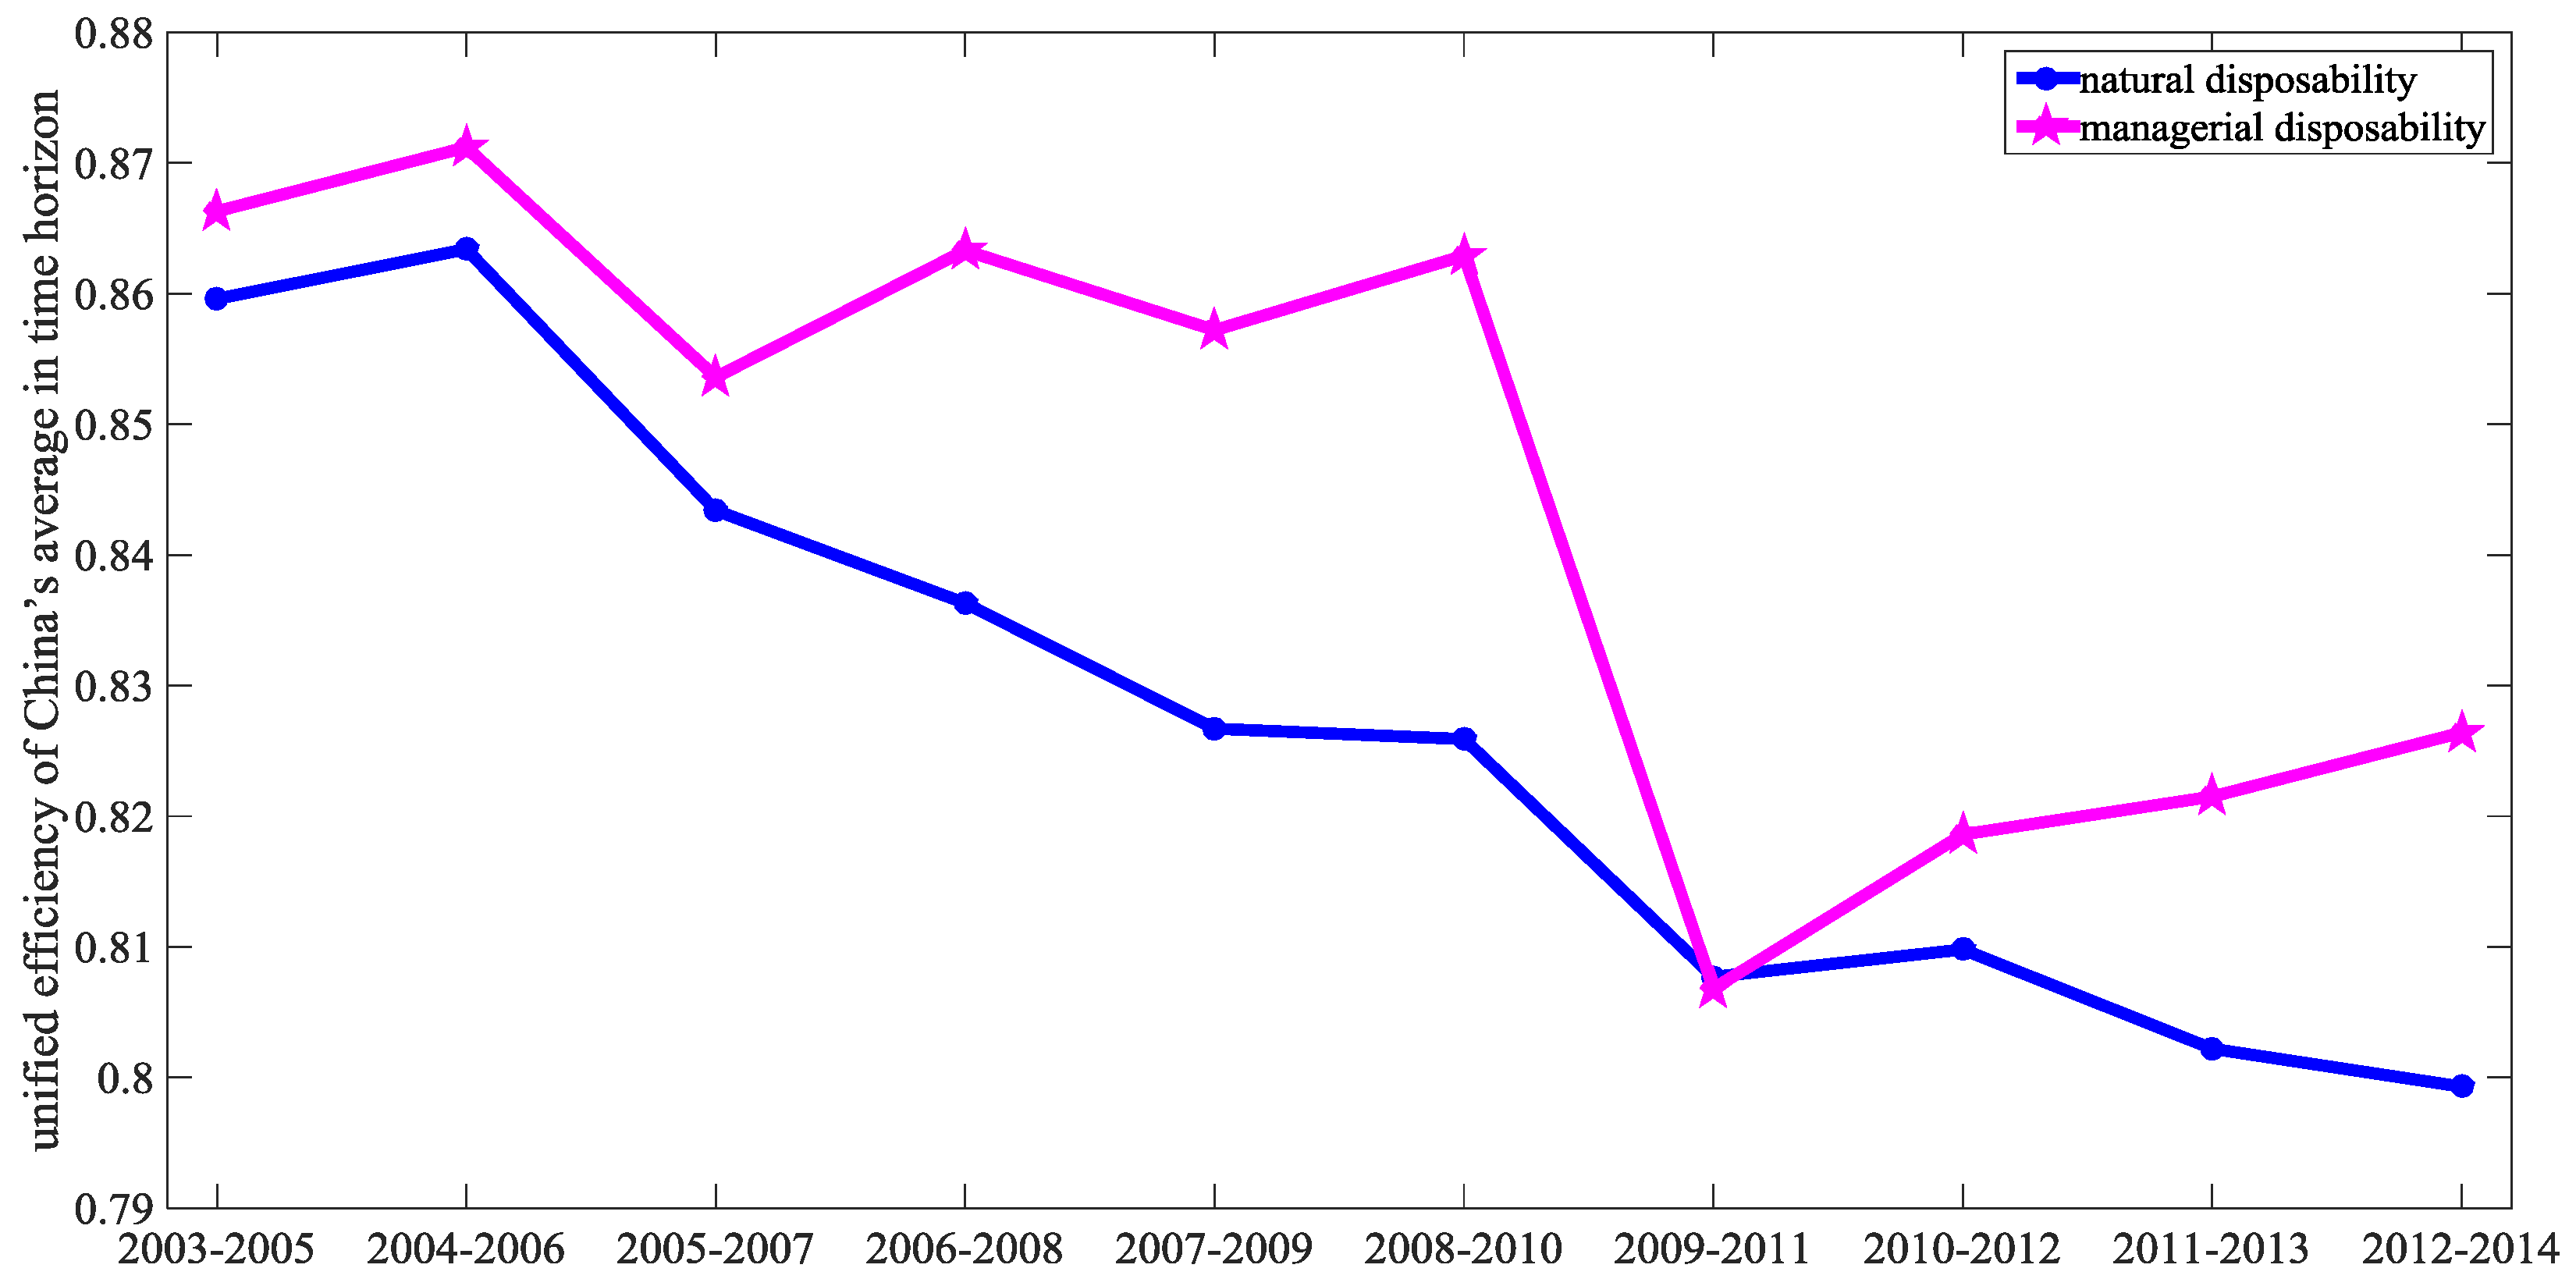
5.3. Window Analysis and Unified Efficiency
6. Conclusions
Acknowledgments
Author Contributions
Conflicts of Interest
References
- IEA. CO2 Emissions from Fuel Combustion Highlights 2016. Available online: http://bbs.pinggu.org/thread-5418823–1-1.html (accessed on 21 November 2016).
- China Statistics Press. China Statistical Yearbook on Environment; China Statistics Press: Beijing, China, 2005–2015. Available online: http://navi.cnki.net/KNavi/YearbookDetail?pcode=CYFD&pykm=YHJSD (accessed on 8 November 2016).
- Szopik-Depczyńska, K.; Cheba, K.; Bąk, I.; Kiba-Janiak, M.; Saniuk, S.; Dembińska, I.; Ioppolo, G. The application of relative taxonomy to the study of disproportions in the area of sustainable development of the European Union. Land Use Policy 2017, 68, 481–491. [Google Scholar] [CrossRef]
- Sueyoshi, T.; Goto, M. DEA radial measurement for environmental assessment: A comparative study between Japanese chemical and pharmaceutical firms. Appl. Energy 2014, 115, 502–513. [Google Scholar] [CrossRef]
- Sueyoshi, T.; Goto, M. Environmental assessment for corporate sustainability by resource utilization and technology innovation: DEA radial measurement on Japanese industrial sectors. Energy Econ. 2014, 46, 295–307. [Google Scholar] [CrossRef]
- Bowlin, W.F. Evaluating the Efficiency of US Air Force Real-Property Maintenance Activities. J. Oper. Res. Soc. 1987, 38, 127–135. [Google Scholar] [CrossRef]
- Taddeo, R.; Simboli, A.; Ioppolo, G.; Morgante, A. Industrial symbiosis, Networking and innovation: The potential role of innovation poles. Sustainability 2017, 9, 169. [Google Scholar] [CrossRef]
- Arbolino, R.; Carlucci, F.; Cirà, A.; Ioppolo, G.; Yigitcanlar, T. Efficiency of the EU regulation on greenhouse gas emissions in Italy: The hierarchical cluster analysis approach. Ecol. Indic. 2017, 81, 115–123. [Google Scholar] [CrossRef]
- Thore, S.; Kozmetsky, G.; Phillips, F. DEA of Financial Statements Data: The U.S. Computer Industry. J. Prod. Anal. 1994, 5, 229–248. [Google Scholar] [CrossRef]
- Goto, M.; Tsutsui, M. Comparison of Productive and Cost Efficiencies among Japanese and US Electric Utilities. Omega 1998, 26, 177–194. [Google Scholar] [CrossRef]
- Sueyoshi, T.; Aoki, S. A use of a nonparametric statistic for DEA frontier shift: The Kruskal and Wallis rank test. Omega 2001, 29, 1–18. [Google Scholar] [CrossRef]
- Sueyoshi, T.; Goto, M.; Sugiyama, M. DEA Window analysis for environmental assessment in a dynamic time shift: Performance assessment of U.S. coal-fired power plants. Energy Econ. 2013, 40, 845–857. [Google Scholar] [CrossRef]
- Yang, W.C.; Lee, Y.M.; Hu, J.L. Urban sustainability assessment of Taiwan based on data envelopment analysis. Renew. Sustain. Energy Rev. 2016, 61, 341–353. [Google Scholar] [CrossRef]
- Vlontzos, G.; Pardalos, P.M. Assess and prognosticate green house gas emissions from agricultural production of EU countries, by implementing, DEA Window analysis and artificial neural networks. Renew. Sustain. Energy Rev. 2017, 76, 155–162. [Google Scholar] [CrossRef]
- Sueyoshi, T.; Goto, M. DEA radial and non-radial models for unified efficiency under natural and managerial disposability: Theoretical extension by strong complementary slackness conditions. Energy Econ. 2012, 34, 700–713. [Google Scholar] [CrossRef]
- Sueyoshi, T.; Goto, M. Undesirable congestion under natural disposability and desirable congestion under managerial disposability in U.S. electric power industry measured by DEA environmental assessment. Energy Econ. 2016, 55, 173–188. [Google Scholar] [CrossRef]
- Sueyoshi, T.; Yuan, Y. Marginal Rate of Transformation and Rate of Substitution measured by DEA environmental assessment: Comparison among European and North American nations. Energy Econ. 2016, 56, 270–287. [Google Scholar] [CrossRef]
- Sueyoshi, T.; Yuan, Y.; Goto, M. A literature study for DEA applied to energy and environment. Energy Econ. 2017, 62, 104–124. [Google Scholar] [CrossRef]
- Färe, R.; Grosskopf, S.; Lovell, C.A.K.; Pasurka, C. Multilateral productivity comparisons when some outputs are undesirable: A nonparametric approach. Rev. Econ. Stat. 1989, 71, 90–98. [Google Scholar] [CrossRef]
- Yao, X.; Zhou, H.C.; Zhang, A.Z.; Li, A.J. Regional energy efficiency, carbon emission performance and technology gaps in China: A meta-frontier non-radial directional distance function analysis. Energy Policy 2015, 84, 142–154. [Google Scholar] [CrossRef]
- Li, A.J.; Zhang, A.Z.; Zhou, Y.X.; Yao, X. Decomposition analysis of factors affecting carbon dioxide emissions across provinces in China. J. Clean. Prod. 2017, 141, 1428–1444. [Google Scholar] [CrossRef]
- Sueyoshi, T.; Goto, M. A comparative study among fossil fuel power plants in PJM and California ISO by DEA environmental assessment. Energy Econ. 2013, 40, 130–145. [Google Scholar] [CrossRef]
- Sueyoshi, T.; Goto, M. Data envelopment analysis for environmental assessment: Comparison between public and private ownership in petroleum industry. Eur. J. Oper. Res. 2012, 216, 668–678. [Google Scholar] [CrossRef]
- Sueyoshi, T.; Goto, M. DEA environmental assessment in a time horizon: Malmquist index on fuel mix, electricity and CO2 of industrial nations. Energy Econ. 2013, 40, 370–382. [Google Scholar] [CrossRef]
- Sueyoshi, T.; Goto, M. DEA environmental assessment of coal fired power plants: Methodological comparison between radial and non-radial models. Energy Econ. 2012, 34, 1854–1863. [Google Scholar] [CrossRef]
- Sueyoshi, T.; Goto, M. Japanese fuel mix strategy after disaster of Fukushima Daiichi nuclear power plant: Lessons from international comparison among industrial nations measured by DEA environmental assessment in time horizon. Energy Econ. 2015, 52, 87–103. [Google Scholar] [CrossRef]
- Sueyoshi, T.; Yuan, Y. Returns to damage under undesirable congestion and damages to return under desirable congestion measured by DEA environmental assessment with multiplier restriction: Economic and energy planning for social sustainability in China. Energy Econ. 2016, 56, 288–309. [Google Scholar] [CrossRef]
- Sueyoshi, T.; Yuan, Y. Social sustainability measured by intermediate approach for DEA environmental assessment: Chinese regional planning for economic development and pollution prevention. Energy Econ. 2017, 66, 154–166. [Google Scholar] [CrossRef]
- Sueyoshi, T.; Yuan, Y.; Li, A.; Wang, D. Methodological comparison among Radial, Non-radial and Intermediate approaches for DEA environmental assessment. Energy Econ. 2017, 67, 439–453. [Google Scholar] [CrossRef]
- Sueyoshi, T.; Goto, M.; Wang, D. Malmquist index measurement for sustainability enhancement in Chinese municipalities and provinces. Energy Econ. 2017, 67, 554–571. [Google Scholar] [CrossRef]
- Sueyoshi, T.; Yuan, Y. China’s regional sustainability and diversified resource allocation: DEA environmental assessment on economic development and air pollution. Energy Econ. 2015, 49, 239–256. [Google Scholar] [CrossRef]
- Zhou, P.; Ang, B.W.; Poh, K.L. A survey of data envelopment analysis in energy and environmental studies. Eur. J. Oper. Res. 2008, 189, 1–18. [Google Scholar] [CrossRef]
- Zhang, N.; Choi, Y. A note on the evolution of directional distance function and its development in energy and environmental studies 1997–2013. Renew. Sustain. Energy Rev. 2014, 33, 50–59. [Google Scholar] [CrossRef]
- Wang, K.; Wei, Y.M.; Zhang, X. A comparative analysis of China’s regional energy and emission performance: Which is the better way to deal with undesirable outputs? Energy Policy 2012, 46, 574–584. [Google Scholar] [CrossRef]
- Wei, C.; Ni, J.L.; Du, L.M. Regional allocation of carbon dioxide abatement in China. China Econ. Rev. 2012, 23, 552–565. [Google Scholar] [CrossRef]
- Wu, F.; Fan, L.W.; Zhou, P.; Zhou, D.Q. Industrial energy efficiency with CO2 emissions in China: A nonparametric analysis. Energy Policy 2012, 49, 164–172. [Google Scholar] [CrossRef]
- Wang, Q.W.; Zhao, Z.Y.; Zhou, P.; Zhou, D.Q. Energy efficiency and production technology heterogeneity in China: A meta-frontier DEA approach. Econ. Modell. 2013, 35, 283–289. [Google Scholar] [CrossRef]
- Wang, Z.H.; Feng, C.; Zhang, B. An empirical analysis of China’s energy efficiency from both static and dynamic perspectives. Energy 2014, 74, 322–330. [Google Scholar] [CrossRef]
- Wang, K.; Wei, Y.M. China’s regional industrial energy efficiency and carbon emissions abatement costs. Appl. Energy 2014, 130, 617–631. [Google Scholar] [CrossRef]
- Wu, J.; An, Q.X.; Yao, X.; Wang, B. Environmental efficiency evaluation of industry in China based on a new fixed sum undesirable output data envelopment analysis. J. Clean. Prod. 2014, 74, 96–104. [Google Scholar] [CrossRef]
- Zhou, P.; Sun, Z.R.; Zhou, D.Q. Optimal path for controlling CO2 emissions in China: A perspective of efficiency analysis. Energy Econ. 2014, 45, 99–110. [Google Scholar] [CrossRef]
- Li, K.; Lin, B.Q. Metafroniter energy efficiency with CO2 emissions and its convergence analysis for China. Energy Econ. 2015, 48, 230–241. [Google Scholar] [CrossRef]
- Wu, J.; Yin, P.Z.; Sun, J.S.; Chu, J.F.; Liang, L. Evaluating the environmental efficiency of a two-stage system with undesired outputs by a DEA approach: An interest preference perspective. Eur. J. Oper. Res. 2016, 254, 1047–1062. [Google Scholar] [CrossRef]
- Zhang, Y.J.; Hao, J.F.; Song, J. The CO2 emission efficiency, reduction potential and spatial clustering in China’s industry: Evidence from the regional level. Appl. Energy 2016, 174, 213–223. [Google Scholar] [CrossRef]
- Du, H.B.; Matisoff, D.C.; Wang, Y.Y.; Liu, X. Understanding drivers of energy efficiency changes in China. Appl. Energy 2016, 184, 1196–1206. [Google Scholar] [CrossRef]
- Long, R.Y.; Wang, H.Z.; Chen, H. Regional differences and pattern classifications in the efficiency of coal consumption in China. J. Clean. Prod. 2016, 112, 3684–3691. [Google Scholar] [CrossRef]
- Chen, L.; Jia, G.Z. Environmental efficiency analysis of China’s regional industry: A data envelopment analysis (DEA) based approach. J. Clean. Prod. 2017, 142, 846–853. [Google Scholar] [CrossRef]
- Du, J.; Chen, Y.; Huang, Y. A Modified Malmquist-Luenberger Productivity Index: Assessing Environmental Productivity Performance in China. Eur. J. Oper. Res. 2017, in press. [Google Scholar] [CrossRef]
- Feng, C.; Zhang, H.; Huang, J.B. The approach to realizing the potential of emissions reduction in China: An implication from data envelopment analysis. Renew. Sustain. Energy Rev. 2017, 71, 859–872. [Google Scholar] [CrossRef]
- The State Council. 2017. Available online: http://www.scio.gov.cn (accessed on 11 March 2017).
- Ministry of Environmental Protection. 2017. Available online: http://www.zhb.gov.cn/ (accessed on 12 March 2017).
- Shan, H. Reestimating the capital stock in China: 1952–2006. J. Quant. Tech. Econ. 2008, 10, 17–31. (In Chinese) [Google Scholar]
- National Bureau of Statistics of China. China Statistical Yearbook 2005–2015; China Statistics Press: Beijing, China, 2005–2015. Available online: http://data.stats.gov.cn/easyquery.htm?cn=E0103 (accessed on 9 August 2016).
- China Economic and Social Development Statistics Database. 2017. Available online: http://tongji.cnki.net/kns55/index.aspx (accessed on 21 January 2017).
- National Bureau of Statistics of China. China Labour Statistical Yearbook 2005–2015; China Statistics Press: Beijing, China, 2005–2015. Available online: http://navi.cnki.net/KNavi/YearbookDetail?pcode=CYFD&pykm=YZLDT&bh=N2016030140 (accessed on 9 November 2016).
- National Bureau of Statistics of China. China Energy Statistical Yearbook 2005–2015; China Statistics Press: Beijing, China, 2005–2015. Available online: http://navi.cnki.net/KNavi/YearbookDetail?pcode=CYFD&pykm=YCXME (accessed on 9 August 2016).
- Du, L.M. Impact Factors of China’s Carbon Dioxide Emissions: Provincial Panel Data Analysis. S. China J. Econ. 2010, 11, 20–33. (In Chinese) [Google Scholar]
- National Coordination Committee on Climate Change, Energy Research Institute of National Development and Reform Commission. China’s Greenhouse Gas Inventories; China Environment Science Press: Beijing, China, 2007. (In Chinese)
- Intergovernmental Panel on Climate Change (IPCC). 2006 IPCC Guidelines for National Greenhouse Gas Inventories. Available online: www.ipcc.ch (accessed on 9 August 2016).

| Authors | Desirable Outputs | Undesirable Outputs | Inputs |
|---|---|---|---|
| [34] | GDP | CO2, SO2 | Labor, capital, coal, crude oil, natural gas |
| [35] | GDP | Labor, capital, energy | |
| [36] | Industrial added value | CO2 | Labor, capital, energy |
| [37] | GDP | Labor, capital, energy | |
| [38] | GDP | Waste water, waste gas and solid waste | Labor, capital, energy |
| [39] | Industrial added value | CO2, SO2 | Labor, capital, energy |
| [40] | Industrial added value | NO2 | Capital, electricity |
| [41] | GDP | CO2 | Labor, capital, energy |
| [42] | GDP | CO2, SO2 | Labor, capital, coal, electricity |
| [20] | GDP | CO2 | Labor, capital, energy |
| [43] | Industrial added value | Waste water, solid waste | Labor, capital, coal |
| [44] | Industrial added value | CO2 | Labor, capital, energy |
| [45] | GDP | CO2 | Labor, capital, energy |
| [46] | GDP | Solid waste | Labor, capital, coal |
| [47] | GDP | SO2, solid waste | Labor, capital, energy |
| [48] | GDP | CO2, SO2, solid waste, industrial dust | Labor, capital, energy |
| [49] | GDP | CO2 | Labor, capital, energy |
| [21] | GDP | CO2 | Labor, capital, energy |
| Inputs | Desirable Outputs | Undesirable Outputs | ||||||||
|---|---|---|---|---|---|---|---|---|---|---|
| Capital | Labor | Energy | GRP | CO2 | SO2 | Smoke and dust | Waste water | chemical oxygen demand | Ammonia Nitrogen | |
| 108 RMB | persons | 104 tce | 108 RMB | 104 tons | ||||||
| Ave. | 22,500 | 4,466,555 | 11,430 | 9706 | 23,438 | 75.25 | 53.70 | 196,290 | 56.33 | 5.70 |
| S.D. | 20,108 | 2,901,815 | 7633 | 8877 | 16,309 | 44.51 | 37.96 | 156,976 | 39.55 | 4.13 |
| Min. | 1168 | 425,212 | 684 | 390 | 1310 | 2.20 | 1.50 | 11,310 | 3.19 | 0.36 |
| Max. | 114,532 | 19,732,800 | 38,899 | 51426 | 77,172 | 200.20 | 181.70 | 905,082 | 198.25 | 23.09 |
| Province | 2003 | 2004 | 2005 | 2006 | 2007 | 2008 | 2009 | 2010 | 2011 | 2012 | 2013 | 2014 |
|---|---|---|---|---|---|---|---|---|---|---|---|---|
| BJ | 0.8059 | 0.8340 | 0.8807 | 0.9064 | 0.9571 | 0.9809 | 0.9857 | 1.0000 | 0.9842 | 0.9855 | 0.9947 | 1.0000 |
| TJ | 0.8889 | 0.9160 | 0.8947 | 0.9171 | 0.9452 | 0.9645 | 1.0000 | 1.0000 | 1.0000 | 0.9799 | 1.0000 | 1.0000 |
| HEB | 0.8437 | 0.8380 | 0.8516 | 0.8609 | 0.8620 | 0.8314 | 0.8253 | 0.8521 | 0.8447 | 0.8237 | 0.8278 | 0.8421 |
| SX | 0.7857 | 0.8163 | 0.8190 | 0.8285 | 0.8111 | 0.7824 | 0.7162 | 0.7062 | 0.7302 | 0.6974 | 0.6946 | 0.6680 |
| IM | 0.9628 | 0.9464 | 0.9181 | 0.9014 | 0.9031 | 0.8837 | 0.8822 | 0.8538 | 0.8656 | 0.8929 | 0.8741 | 0.9448 |
| LN | 0.8212 | 0.8356 | 0.7909 | 0.8038 | 0.7972 | 0.8028 | 0.7979 | 0.8525 | 0.8421 | 0.8540 | 0.8527 | 0.8387 |
| JL | 0.8347 | 0.8364 | 0.7962 | 0.7901 | 0.7233 | 0.6802 | 0.6836 | 0.6960 | 0.7214 | 0.7490 | 0.7529 | 0.7537 |
| HLJ | 0.8540 | 0.9028 | 0.9353 | 0.9676 | 0.9830 | 0.9867 | 0.9779 | 0.9644 | 0.9108 | 0.8773 | 0.8922 | 0.8948 |
| SH | 0.7763 | 0.8137 | 0.8289 | 0.8504 | 0.9023 | 0.9425 | 0.9683 | 1.0000 | 0.9995 | 0.9984 | 1.0000 | 1.0000 |
| JS | 0.7933 | 0.7744 | 0.7595 | 0.8013 | 0.8704 | 0.9320 | 0.9755 | 1.0000 | 0.9791 | 1.0000 | 0.8700 | 0.8888 |
| ZJ | 0.8025 | 0.8173 | 0.8073 | 0.8404 | 0.8652 | 0.9089 | 0.9383 | 0.9671 | 0.8534 | 0.8574 | 0.8613 | 0.9073 |
| AH | 0.7713 | 0.7876 | 0.7903 | 0.7994 | 0.8097 | 0.8348 | 0.8305 | 0.8419 | 0.7867 | 0.8057 | 0.7745 | 0.7993 |
| FJ | 0.9300 | 0.9150 | 0.8249 | 0.8275 | 0.8636 | 0.8628 | 0.8580 | 0.8846 | 0.7629 | 0.8023 | 0.8216 | 0.8616 |
| JX | 0.7647 | 0.7359 | 0.7371 | 0.7214 | 0.7060 | 0.7214 | 0.7174 | 0.7199 | 0.6885 | 0.6912 | 0.6941 | 0.7110 |
| SD | 0.8920 | 0.9006 | 0.8938 | 0.8853 | 0.8759 | 0.8638 | 0.8985 | 0.9283 | 0.8981 | 0.9060 | 0.8939 | 0.9280 |
| HEN | 0.8293 | 0.8352 | 0.8240 | 0.8184 | 0.7883 | 0.7573 | 0.6880 | 0.6629 | 0.6559 | 0.6477 | 0.6569 | 0.6671 |
| HUB | 0.6332 | 0.6557 | 0.6772 | 0.6992 | 0.7129 | 0.7250 | 0.7310 | 0.7439 | 0.7250 | 0.7250 | 0.7289 | 0.7405 |
| HUN | 0.8049 | 0.7913 | 0.7673 | 0.7663 | 0.7690 | 0.7842 | 0.7820 | 0.7808 | 0.7636 | 0.7443 | 0.7547 | 0.8002 |
| GD | 0.9981 | 1.0000 | 0.9932 | 1.0000 | 1.0000 | 1.0000 | 1.0000 | 1.0000 | 1.0000 | 1.0000 | 1.0000 | 0.9951 |
| GX | 0.7722 | 0.7382 | 0.7014 | 0.6643 | 0.6337 | 0.6330 | 0.5830 | 0.5475 | 0.5546 | 0.5835 | 0.6009 | 0.6620 |
| HAN | 0.6024 | 0.6525 | 0.7023 | 0.8030 | 0.8702 | 0.8133 | 0.8169 | 0.8097 | 0.7806 | 0.7664 | 0.8072 | 0.8102 |
| CQ | 0.6961 | 0.6508 | 0.6274 | 0.6180 | 0.6747 | 0.6934 | 0.7174 | 0.7877 | 0.8094 | 0.8348 | 0.8482 | 0.8705 |
| SC | 0.6603 | 0.6828 | 0.6937 | 0.7492 | 0.7597 | 0.7581 | 0.7826 | 0.8136 | 0.8172 | 0.8282 | 0.8106 | 0.7994 |
| GZ | 0.6069 | 0.6219 | 0.6383 | 0.6677 | 0.6888 | 0.6930 | 0.6893 | 0.7123 | 0.6702 | 0.6439 | 0.6519 | 0.6031 |
| YN | 0.7927 | 0.7762 | 0.7882 | 0.8060 | 0.8129 | 0.8365 | 0.8121 | 0.7770 | 0.6285 | 0.6286 | 0.6333 | 0.6354 |
| SAX | 0.7328 | 0.7418 | 0.7267 | 0.7272 | 0.6899 | 0.6921 | 0.6962 | 0.7056 | 0.7088 | 0.7093 | 0.7153 | 0.7086 |
| GS | 0.7509 | 0.7790 | 0.8005 | 0.8191 | 0.8222 | 0.8021 | 0.7835 | 0.7834 | 0.7615 | 0.7731 | 0.7803 | 0.7812 |
| QH | 0.5510 | 0.5066 | 0.4441 | 0.5359 | 0.5025 | 0.5425 | 0.5196 | 0.5411 | 0.5700 | 0.5776 | 0.6080 | 0.6254 |
| NX | 0.4429 | 0.4282 | 0.3284 | 0.4122 | 0.3355 | 0.3465 | 0.3363 | 0.3415 | 0.3634 | 0.3939 | 0.4202 | 0.4577 |
| XJ | 0.6210 | 0.6166 | 0.6178 | 0.6645 | 0.6423 | 0.6466 | 0.6518 | 0.6476 | 0.6760 | 0.6497 | 0.6243 | 0.6166 |
| Province | 2003 | 2004 | 2005 | 2006 | 2007 | 2008 | 2009 | 2010 | 2011 | 2012 | 2013 | 2014 |
|---|---|---|---|---|---|---|---|---|---|---|---|---|
| BJ | 1.0000 | 0.9910 | 0.9821 | 0.9719 | 1.0000 | 1.0000 | 0.9978 | 1.0000 | 1.0000 | 1.0000 | 1.0000 | 1.0000 |
| TJ | 0.8565 | 0.8544 | 0.7463 | 0.8150 | 0.8886 | 0.9269 | 1.0000 | 1.0000 | 1.0000 | 1.0000 | 1.0000 | 1.0000 |
| HEB | 0.6551 | 0.6279 | 0.7050 | 0.7482 | 0.8493 | 0.9094 | 0.9457 | 1.0000 | 0.7586 | 0.7694 | 0.7682 | 0.7842 |
| SX | 0.8507 | 0.8619 | 0.9162 | 0.9876 | 0.9617 | 0.9498 | 0.9590 | 0.9766 | 0.9481 | 0.9109 | 0.9366 | 0.9331 |
| IM | 0.9787 | 0.9778 | 0.9721 | 1.0000 | 1.0000 | 0.9699 | 1.0000 | 1.0000 | 0.9950 | 1.0000 | 1.0000 | 1.0000 |
| LN | 0.7299 | 0.7390 | 0.7378 | 0.7364 | 0.7329 | 0.7950 | 0.8271 | 0.8742 | 0.8217 | 0.8361 | 0.8311 | 0.8031 |
| JL | 0.9765 | 0.7253 | 0.5905 | 0.6629 | 0.6379 | 0.6446 | 0.6831 | 0.7196 | 0.6870 | 0.7225 | 0.7784 | 0.7852 |
| HLJ | 0.8689 | 0.8974 | 1.0000 | 0.9473 | 0.9821 | 0.9501 | 0.9659 | 0.9231 | 0.8186 | 0.8136 | 0.8372 | 0.8358 |
| SH | 0.7537 | 0.7276 | 0.7667 | 0.7907 | 0.8289 | 0.8717 | 0.8848 | 0.8987 | 0.9764 | 0.9959 | 1.0000 | 0.9694 |
| JS | 0.5836 | 0.5566 | 0.5655 | 0.5856 | 0.6436 | 0.6847 | 0.7305 | 0.7746 | 0.6725 | 0.7091 | 0.7511 | 0.7777 |
| ZJ | 0.6641 | 0.6166 | 0.6091 | 0.6391 | 0.6604 | 0.7060 | 0.7576 | 0.7931 | 0.6943 | 0.7288 | 0.7575 | 0.7935 |
| AH | 0.5184 | 0.5078 | 0.5749 | 0.5571 | 0.5656 | 0.5757 | 0.5737 | 0.6109 | 0.5701 | 0.5569 | 0.5677 | 0.5961 |
| FJ | 0.6228 | 0.5951 | 0.6316 | 0.6365 | 0.6303 | 0.6596 | 0.6489 | 0.7086 | 0.6037 | 0.6985 | 0.7291 | 0.7694 |
| JX | 0.5999 | 0.5304 | 0.5840 | 0.5577 | 0.5408 | 0.5755 | 0.5934 | 0.5882 | 0.5599 | 0.5831 | 0.5827 | 0.6099 |
| SD | 0.7267 | 0.7127 | 0.7632 | 0.7973 | 0.8460 | 0.8930 | 0.9517 | 1.0000 | 0.7847 | 0.8036 | 0.7907 | 0.7905 |
| HEN | 0.6171 | 0.6090 | 0.5967 | 0.6090 | 0.6066 | 0.6427 | 0.6551 | 0.7064 | 0.6495 | 0.6797 | 0.6729 | 0.6909 |
| HUB | 0.5802 | 0.6273 | 0.6257 | 0.6140 | 0.6211 | 0.6631 | 0.6830 | 0.7053 | 0.6867 | 0.7279 | 0.7113 | 0.7235 |
| HUN | 0.6060 | 0.6523 | 0.6556 | 0.6540 | 0.6624 | 0.7298 | 0.7391 | 0.7568 | 0.8060 | 0.8170 | 0.7302 | 0.7384 |
| GD | 0.6517 | 0.6778 | 0.6973 | 0.7097 | 0.7309 | 0.7608 | 0.7815 | 0.7965 | 0.7559 | 0.8039 | 0.7874 | 0.8049 |
| GX | 0.6270 | 0.6070 | 0.6204 | 0.5952 | 0.5800 | 0.6195 | 0.5975 | 0.5798 | 0.5759 | 0.5760 | 0.5963 | 0.6447 |
| HAN | 0.5794 | 0.4892 | 0.6193 | 0.8841 | 1.0000 | 0.7582 | 0.6858 | 0.7834 | 0.8411 | 0.8496 | 0.8624 | 0.8392 |
| CQ | 0.6392 | 0.6197 | 0.7527 | 0.7413 | 0.7508 | 0.6950 | 0.7055 | 0.7885 | 0.8511 | 0.8891 | 0.8194 | 0.8410 |
| SC | 0.7353 | 0.6894 | 0.7833 | 0.7804 | 0.7822 | 0.7822 | 0.8047 | 0.8160 | 0.8802 | 0.9624 | 0.8637 | 0.8585 |
| GZ | 0.8301 | 0.8642 | 0.8164 | 0.8864 | 0.8973 | 0.9155 | 0.9350 | 1.0000 | 0.8284 | 0.8071 | 0.7894 | 0.7294 |
| YN | 0.7844 | 0.9724 | 0.7478 | 0.7789 | 0.8031 | 0.8314 | 0.8812 | 0.8968 | 0.6353 | 0.6705 | 0.6749 | 0.7140 |
| SAX | 0.8994 | 0.8510 | 0.8157 | 0.8342 | 0.7414 | 0.7226 | 0.7153 | 0.7335 | 0.7454 | 0.7563 | 0.8551 | 0.8189 |
| GS | 0.8523 | 0.8979 | 0.9515 | 1.0000 | 0.9930 | 0.9488 | 0.9315 | 0.9122 | 0.8448 | 0.8560 | 0.9303 | 0.9237 |
| QH | 0.8890 | 0.9251 | 1.0000 | 0.9328 | 0.9567 | 0.9046 | 0.8822 | 0.9515 | 1.0000 | 1.0000 | 1.0000 | 1.0000 |
| NX | 0.6432 | 0.7712 | 0.6241 | 0.7098 | 0.8239 | 0.8413 | 0.8476 | 0.6817 | 0.6797 | 0.7433 | 0.7484 | 0.7850 |
| XJ | 0.9061 | 0.8851 | 0.8747 | 0.9601 | 0.8539 | 0.8110 | 0.7905 | 0.7810 | 0.8567 | 0.8379 | 0.8714 | 0.9063 |
| Province | Windows | Average | |||||||||
|---|---|---|---|---|---|---|---|---|---|---|---|
| 2003–2005 | 2004–2006 | 2005–2007 | 2006–2008 | 2007–2009 | 2008–2010 | 2009–2011 | 2010–2012 | 2011–2013 | 2012–2014 | ||
| BJ | 1.0000 | 1.0000 | 1.0000 | 1.0000 | 1.0000 | 1.0000 | 1.0000 | 1.0000 | 1.0000 | 1.0000 | 1.0000 |
| TJ | 1.0000 | 1.0000 | 1.0000 | 1.0000 | 1.0000 | 1.0000 | 1.0000 | 1.0000 | 1.0000 | 1.0000 | 1.0000 |
| HEB | 0.9334 | 0.9244 | 0.9151 | 0.8799 | 0.8616 | 0.8640 | 0.8532 | 0.8301 | 0.8467 | 0.8483 | 0.8757 |
| SX | 0.8816 | 0.8795 | 0.8421 | 0.8146 | 0.7557 | 0.7344 | 0.7375 | 0.7179 | 0.7007 | 0.6960 | 0.7760 |
| IM | 0.9958 | 1.0000 | 1.0000 | 0.9667 | 0.9370 | 0.8789 | 0.9421 | 0.9959 | 0.9557 | 0.9434 | 0.9616 |
| LN | 0.8672 | 0.8697 | 0.8500 | 0.8551 | 0.8614 | 0.8758 | 0.8618 | 0.8592 | 0.8663 | 0.8461 | 0.8613 |
| JL | 0.8679 | 0.8530 | 0.7810 | 0.7315 | 0.7260 | 0.7292 | 0.7470 | 0.8146 | 0.7582 | 0.7537 | 0.7762 |
| HLJ | 1.0000 | 1.0000 | 1.0000 | 1.0000 | 1.0000 | 1.0000 | 0.9483 | 0.9155 | 0.9119 | 0.9086 | 0.9684 |
| SH | 1.0000 | 1.0000 | 1.0000 | 1.0000 | 1.0000 | 1.0000 | 1.0000 | 1.0000 | 1.0000 | 1.0000 | 1.0000 |
| JS | 1.0000 | 0.9723 | 1.0000 | 1.0000 | 1.0000 | 1.0000 | 1.0000 | 1.0000 | 0.8997 | 0.8884 | 0.9760 |
| ZJ | 0.9789 | 0.9942 | 0.9698 | 0.9792 | 0.9814 | 0.9654 | 0.9087 | 0.9152 | 0.9202 | 0.9070 | 0.9520 |
| AH | 0.8622 | 0.8474 | 0.8466 | 0.8595 | 0.8584 | 0.8743 | 0.8153 | 0.8185 | 0.7935 | 0.7996 | 0.8375 |
| FJ | 0.8865 | 0.8791 | 0.9156 | 0.9199 | 0.9028 | 0.8860 | 0.8089 | 0.8473 | 0.8902 | 0.8614 | 0.8798 |
| JX | 0.8193 | 0.7859 | 0.7597 | 0.7646 | 0.7678 | 0.7682 | 0.7281 | 0.7229 | 0.7124 | 0.7115 | 0.7540 |
| SD | 1.0000 | 0.9794 | 0.9582 | 0.9480 | 0.9349 | 0.9304 | 0.9086 | 0.9116 | 0.9158 | 0.9287 | 0.9416 |
| HEN | 0.8913 | 0.8709 | 0.8333 | 0.7994 | 0.7475 | 0.7180 | 0.6882 | 0.6734 | 0.6682 | 0.6682 | 0.7558 |
| HUB | 0.7497 | 0.7508 | 0.7522 | 0.7501 | 0.7620 | 0.7803 | 0.7684 | 0.7621 | 0.7519 | 0.7466 | 0.7574 |
| HUN | 0.7782 | 0.7931 | 0.7941 | 0.7951 | 0.7967 | 0.8030 | 0.8004 | 0.7665 | 0.7760 | 0.8003 | 0.7903 |
| GD | 1.0000 | 1.0000 | 1.0000 | 1.0000 | 1.0000 | 1.0000 | 1.0000 | 1.0000 | 1.0000 | 0.9944 | 0.9994 |
| GX | 0.7176 | 0.6925 | 0.6627 | 0.6576 | 0.6329 | 0.6168 | 0.6290 | 0.6423 | 0.6506 | 0.6617 | 0.6564 |
| HAN | 1.0000 | 1.0000 | 0.9962 | 0.9717 | 0.9895 | 0.9446 | 0.8451 | 0.8280 | 0.8366 | 0.8101 | 0.9222 |
| CQ | 0.7374 | 0.7258 | 0.7527 | 0.7504 | 0.7579 | 0.8371 | 0.8609 | 0.8808 | 0.8728 | 0.8771 | 0.8053 |
| SC | 0.7740 | 0.8062 | 0.8034 | 0.7866 | 0.8145 | 0.8509 | 0.8586 | 0.8606 | 0.8319 | 0.7996 | 0.8186 |
| GZ | 0.7192 | 0.7437 | 0.7368 | 0.7404 | 0.7336 | 0.7436 | 0.7054 | 0.6804 | 0.6660 | 0.6228 | 0.7092 |
| YN | 0.8747 | 0.8756 | 0.8627 | 0.8760 | 0.8632 | 0.8164 | 0.6735 | 0.6602 | 0.6446 | 0.6458 | 0.7793 |
| SAX | 0.8136 | 0.8101 | 0.7506 | 0.7414 | 0.7255 | 0.7141 | 0.7122 | 0.7169 | 0.7147 | 0.7318 | 0.7431 |
| GS | 0.8648 | 0.8742 | 0.8538 | 0.8318 | 0.8217 | 0.8246 | 0.7991 | 0.8107 | 0.7972 | 0.8016 | 0.8279 |
| QH | 0.6212 | 0.6782 | 0.5842 | 0.5855 | 0.5405 | 0.5747 | 0.5744 | 0.5882 | 0.6231 | 0.6252 | 0.5995 |
| NX | 0.4142 | 0.5125 | 0.3840 | 0.3911 | 0.3441 | 0.3742 | 0.3670 | 0.4048 | 0.4320 | 0.4575 | 0.4081 |
| XJ | 0.7389 | 0.7825 | 0.6985 | 0.6925 | 0.6843 | 0.6729 | 0.6904 | 0.6710 | 0.6291 | 0.6438 | 0.6904 |
| Province | Windows | Average | |||||||||
|---|---|---|---|---|---|---|---|---|---|---|---|
| 2003–2005 | 2004–2006 | 2005–2007 | 2006–2008 | 2007–2009 | 2008–2010 | 2009–2011 | 2010–2012 | 2011–2013 | 2012–2014 | ||
| BJ | 1.0000 | 1.0000 | 1.0000 | 1.0000 | 1.0000 | 1.0000 | 1.0000 | 1.0000 | 1.0000 | 1.0000 | 1.0000 |
| TJ | 0.9685 | 1.0000 | 1.0000 | 1.0000 | 1.0000 | 1.0000 | 1.0000 | 1.0000 | 1.0000 | 1.0000 | 0.9968 |
| HEB | 1.0000 | 1.0000 | 1.0000 | 1.0000 | 0.9607 | 1.0000 | 0.8189 | 0.7971 | 0.7827 | 0.7844 | 0.9144 |
| SX | 1.0000 | 1.0000 | 1.0000 | 1.0000 | 0.9991 | 1.0000 | 0.9911 | 0.9646 | 1.0000 | 1.0000 | 0.9955 |
| IM | 1.0000 | 1.0000 | 1.0000 | 1.0000 | 1.0000 | 1.0000 | 1.0000 | 1.0000 | 1.0000 | 1.0000 | 1.0000 |
| LN | 0.8374 | 0.8506 | 0.8429 | 0.9076 | 0.9181 | 0.9428 | 0.8296 | 0.8460 | 0.8421 | 0.8029 | 0.8620 |
| JL | 0.7426 | 0.8152 | 0.7873 | 0.8028 | 0.7859 | 0.7735 | 0.6868 | 0.7651 | 0.7801 | 0.7853 | 0.7725 |
| HLJ | 1.0000 | 0.9897 | 1.0000 | 1.0000 | 1.0000 | 1.0000 | 0.8449 | 0.8298 | 0.8541 | 0.8354 | 0.9354 |
| SH | 1.0000 | 0.9661 | 0.9176 | 0.9214 | 0.9225 | 0.9267 | 1.0000 | 1.0000 | 1.0000 | 1.0000 | 0.9654 |
| JS | 0.6808 | 0.6785 | 0.6963 | 0.7274 | 0.7580 | 0.7737 | 0.7390 | 0.7518 | 0.7663 | 0.7774 | 0.7349 |
| ZJ | 0.7584 | 0.7992 | 0.7619 | 0.7698 | 0.7868 | 0.7961 | 0.7665 | 0.7718 | 0.7796 | 0.7932 | 0.7783 |
| AH | 0.6806 | 0.6634 | 0.6508 | 0.6738 | 0.6584 | 0.6851 | 0.6086 | 0.6014 | 0.5903 | 0.5959 | 0.6408 |
| FJ | 0.7746 | 0.7647 | 0.7259 | 0.7104 | 0.6977 | 0.7389 | 0.6516 | 0.7372 | 0.7513 | 0.7691 | 0.7322 |
| JX | 0.6717 | 0.6398 | 0.6107 | 0.6369 | 0.6527 | 0.6461 | 0.5967 | 0.5981 | 0.5969 | 0.6095 | 0.6259 |
| SD | 1.0000 | 1.0000 | 0.9931 | 1.0000 | 0.9612 | 1.0000 | 0.7916 | 0.8031 | 0.8031 | 0.7898 | 0.9142 |
| HEN | 0.7269 | 0.7250 | 0.7057 | 0.7235 | 0.7105 | 0.7414 | 0.6588 | 0.6785 | 0.6837 | 0.6905 | 0.7045 |
| HUB | 0.6848 | 0.6884 | 0.6975 | 0.7293 | 0.7437 | 0.7389 | 0.6899 | 0.7263 | 0.7128 | 0.7255 | 0.7137 |
| HUN | 0.6850 | 0.6835 | 0.6908 | 0.7758 | 0.7867 | 0.8084 | 0.8128 | 0.8143 | 0.7298 | 0.7429 | 0.7530 |
| GD | 0.8648 | 0.8625 | 0.8511 | 0.8377 | 0.8367 | 0.8366 | 0.7959 | 0.8003 | 0.8066 | 0.8054 | 0.8298 |
| GX | 0.6857 | 0.6581 | 0.5992 | 0.6404 | 0.6249 | 0.6188 | 0.5920 | 0.5847 | 0.6165 | 0.6444 | 0.6265 |
| HAN | 1.0000 | 1.0000 | 1.0000 | 1.0000 | 1.0000 | 0.8421 | 0.8796 | 0.8611 | 0.8623 | 0.8391 | 0.9284 |
| CQ | 0.8014 | 0.7922 | 0.8053 | 0.7285 | 0.7417 | 0.8426 | 0.8571 | 0.8881 | 0.8298 | 0.8447 | 0.8131 |
| SC | 0.8183 | 0.8230 | 0.8507 | 0.8583 | 0.8754 | 0.8760 | 0.8847 | 0.9591 | 0.8630 | 0.8683 | 0.8677 |
| GZ | 0.9528 | 1.0000 | 0.9378 | 0.9663 | 0.9449 | 1.0000 | 0.8405 | 0.8206 | 0.8172 | 0.7732 | 0.9053 |
| YN | 0.9735 | 0.9551 | 0.8837 | 0.9125 | 0.8862 | 0.9099 | 0.6444 | 0.6717 | 0.6805 | 0.7228 | 0.8240 |
| SAX | 0.8412 | 0.8450 | 0.7721 | 0.7793 | 0.7592 | 0.7779 | 0.7718 | 0.7679 | 0.8638 | 0.8477 | 0.8026 |
| GS | 1.0000 | 1.0000 | 1.0000 | 1.0000 | 0.9970 | 0.9783 | 0.8677 | 0.8784 | 0.9702 | 0.9980 | 0.9690 |
| QH | 1.0000 | 1.0000 | 1.0000 | 1.0000 | 0.9862 | 1.0000 | 1.0000 | 1.0000 | 1.0000 | 1.0000 | 0.9986 |
| NX | 0.8412 | 0.9396 | 0.9180 | 0.9099 | 0.8486 | 0.7485 | 0.6863 | 0.7664 | 0.7709 | 0.8088 | 0.8238 |
| XJ | 1.0000 | 0.9973 | 0.9082 | 0.8878 | 0.8739 | 0.8851 | 0.8982 | 0.8741 | 0.8917 | 0.9390 | 0.9155 |
© 2017 by the authors. Licensee MDPI, Basel, Switzerland. This article is an open access article distributed under the terms and conditions of the Creative Commons Attribution (CC BY) license (http://creativecommons.org/licenses/by/4.0/).
Share and Cite
Sueyoshi, T.; Yuan, Y.; Li, A.; Wang, D. Social Sustainability of Provinces in China: A Data Envelopment Analysis (DEA) Window Analysis under the Concepts of Natural and Managerial Disposability. Sustainability 2017, 9, 2078. https://doi.org/10.3390/su9112078
Sueyoshi T, Yuan Y, Li A, Wang D. Social Sustainability of Provinces in China: A Data Envelopment Analysis (DEA) Window Analysis under the Concepts of Natural and Managerial Disposability. Sustainability. 2017; 9(11):2078. https://doi.org/10.3390/su9112078
Chicago/Turabian StyleSueyoshi, Toshiyuki, Yan Yuan, Aijun Li, and Daoping Wang. 2017. "Social Sustainability of Provinces in China: A Data Envelopment Analysis (DEA) Window Analysis under the Concepts of Natural and Managerial Disposability" Sustainability 9, no. 11: 2078. https://doi.org/10.3390/su9112078
APA StyleSueyoshi, T., Yuan, Y., Li, A., & Wang, D. (2017). Social Sustainability of Provinces in China: A Data Envelopment Analysis (DEA) Window Analysis under the Concepts of Natural and Managerial Disposability. Sustainability, 9(11), 2078. https://doi.org/10.3390/su9112078