Environmental Inequality in China: A “Pyramid Model” and Nationwide Pilot Analysis of Prefectures with Sources of Industrial Pollution


Abstract
:1. Introduction
2. Logic of Modelling EJ in China
2.1 Non-Applicability of U.S. EJ Models to China
2.1.1. Race-Based EJ Model
2.1.2. EJ Model from an Income Perspective
2.2. Socioeconomic Perspectives of EJ in China
2.2.1. Household Registration System
2.2.2. Migrant Population in China
2.2.3. Urban and Rural Differences
2.2.4. Regional Disparities
3. “Pyramid Model” and Dataset
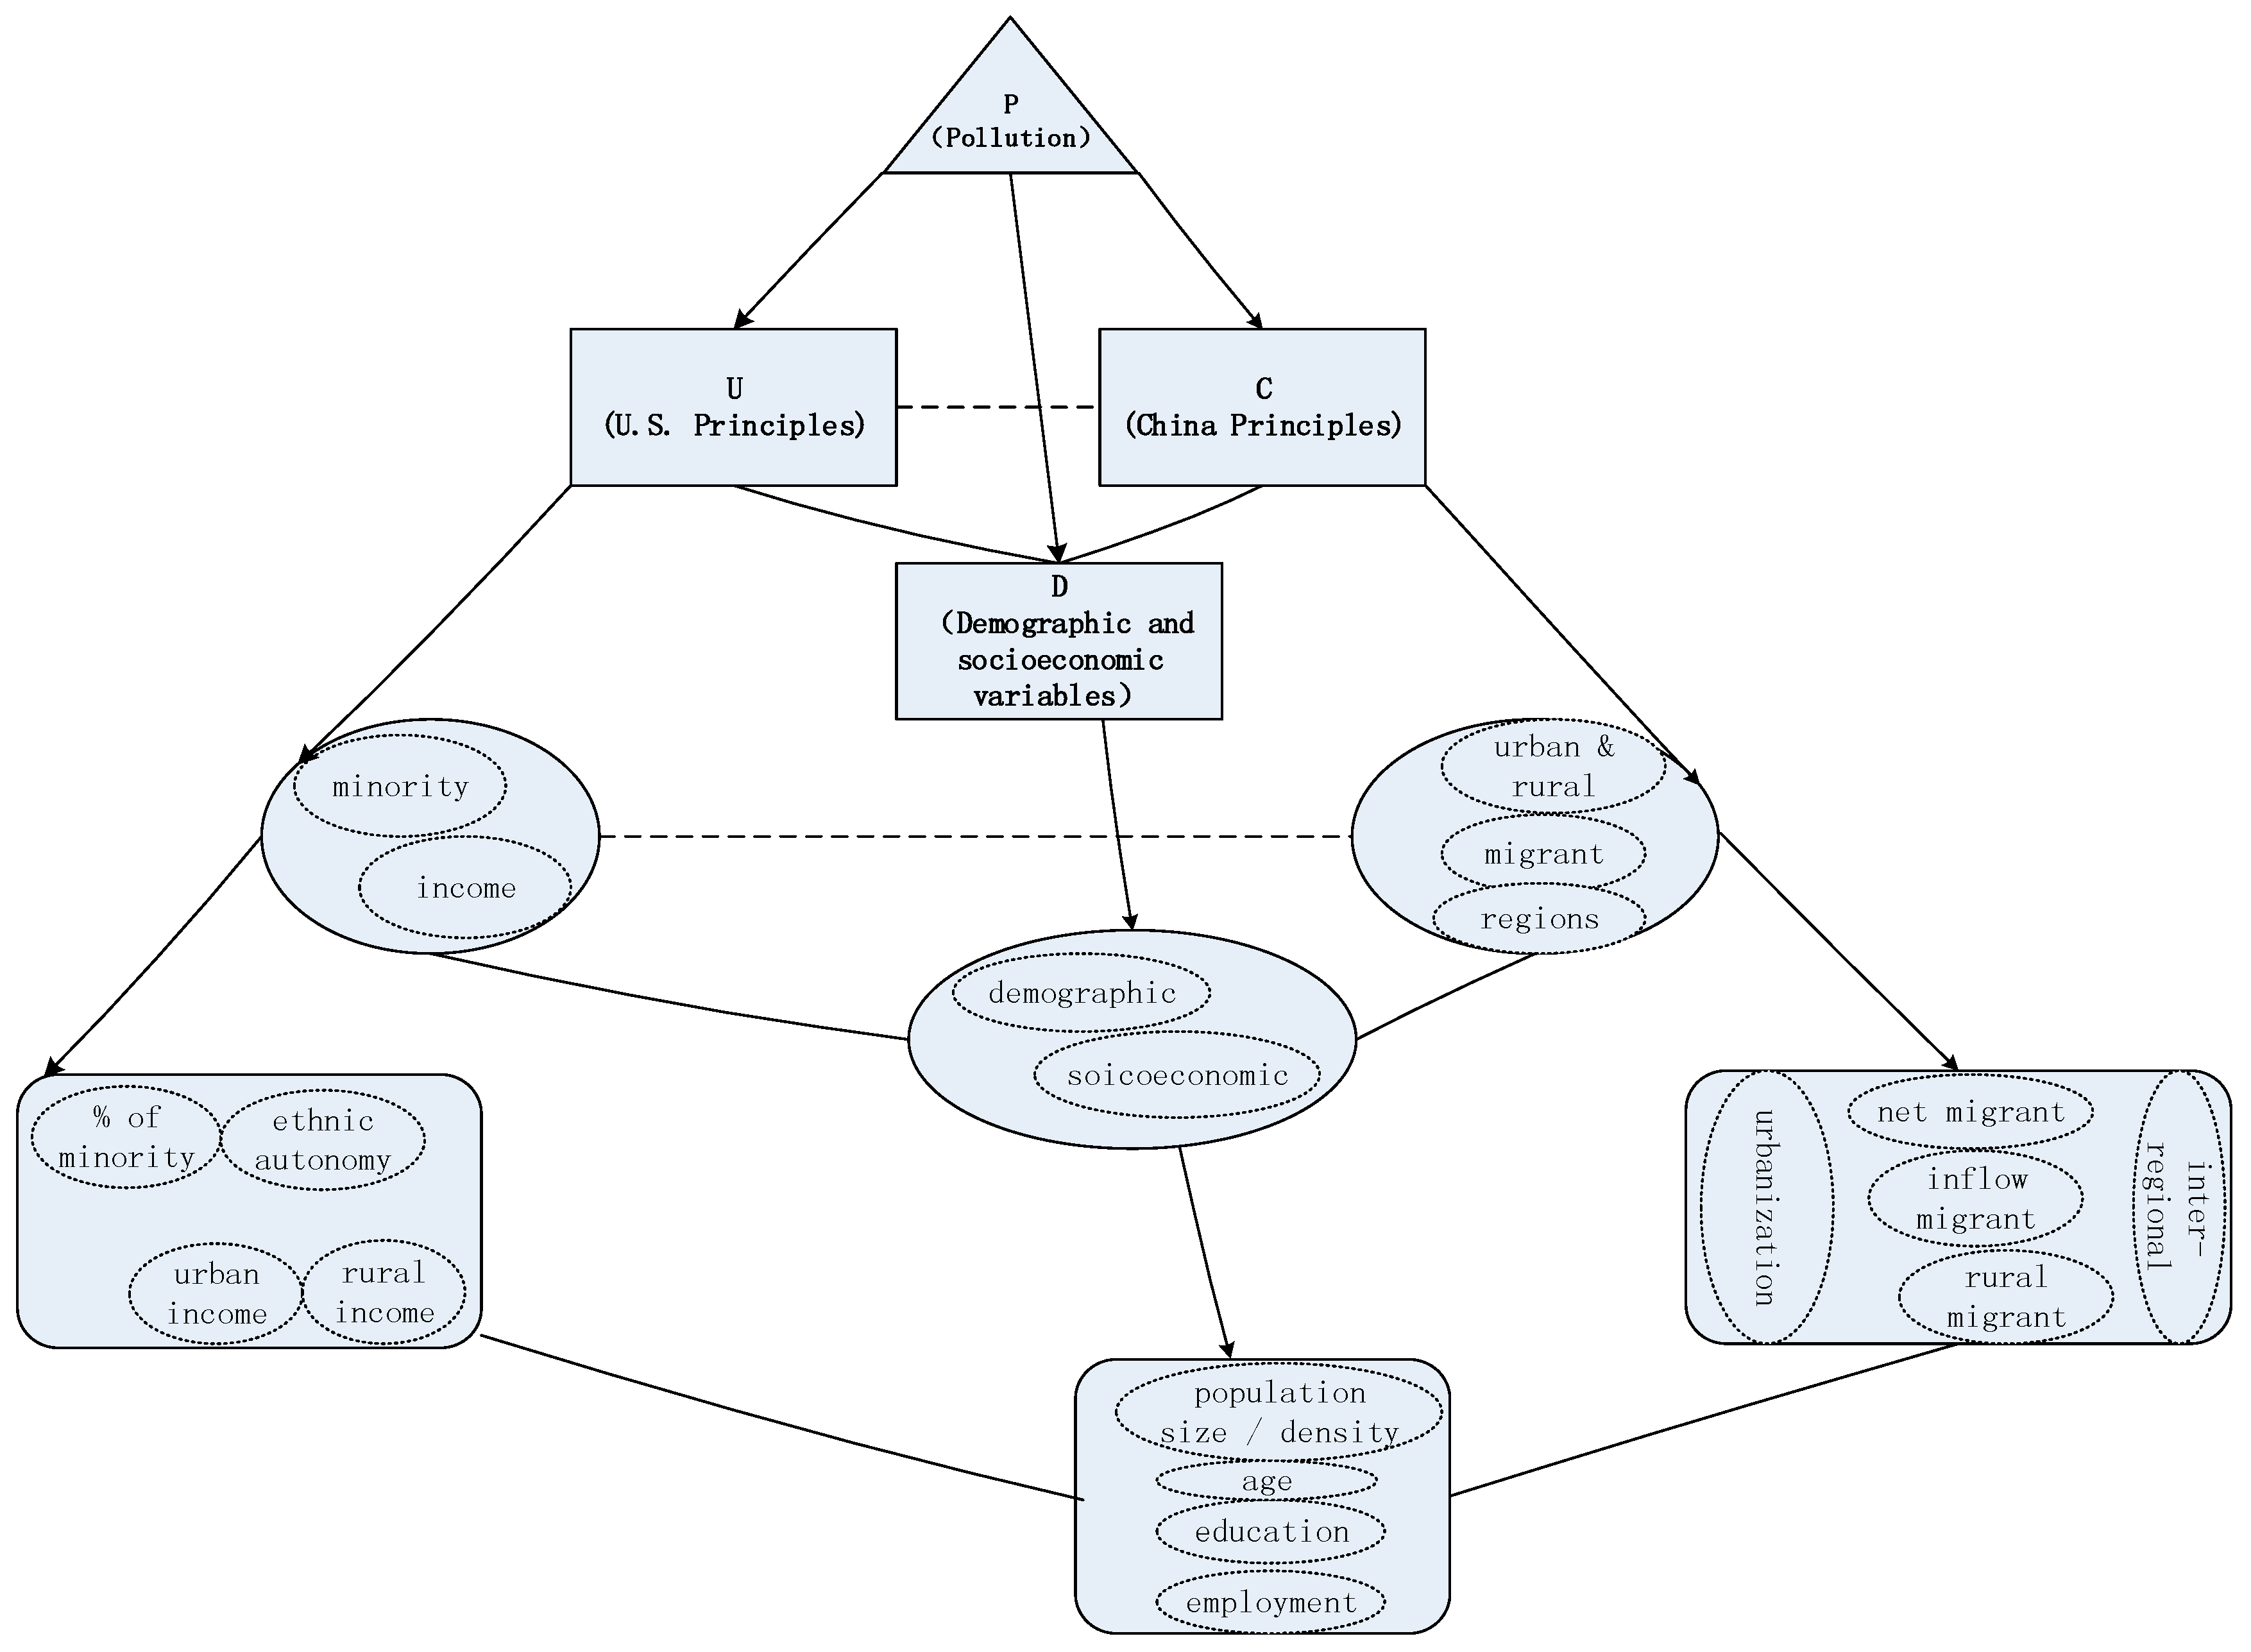
3.1. Baseline “Pyramid Model”
3.2. Expanded “Pyramid Model” Based on Three Factors
3.2.1. Functional Form
3.2.2. Basic Demographic and Socioeconomic Factors
3.2.3. Control Indicators Following U.S. EJ Principles
3.2.4. Indicators Based on the Characteristics of China
3.3. Dataset and Estimation Methods
4. Results and Discussion at the Prefecture Level
4.1. Baseline Results
4.2. Discussion Based on a Broader Perspective
4.3. Limitations
5. Conclusions
Acknowledgments
Author Contributions
Conflicts of Interest
References
- Bullard, R.D. Solid waste sites and the black Houston community. Sociol. Inq. 1983, 53, 273–288. [Google Scholar] [CrossRef] [PubMed]
- General Accounting Office (GAO). Siting of Hazardous Waste Landfills and Their Correlation with Racial and Economic Status of Surrounding Communities; U.S. General Accounting Office: Gaithersburg, MD, USA, 1983.
- Commission for Racial Justice (CRJ). Toxic Wastes and Race in the United States: A National Report on the Racial and Socio-Economic Characteristics of Communities with Hazardous Waste Sites; United Church of Christ Commission for Racial Justice: New York, NY, USA, 1987. [Google Scholar]
- Brown, P. Race, class, and environmental health: A review and systematization of the literature. Environ. Res. 1995, 69, 15–30. [Google Scholar] [CrossRef] [PubMed]
- Gao, O.H.; Klein, R.A. Environmental equity in participation of the clean air school bus program: The case of New York State. Transp. Res. Part D Transp. Environ. 2010, 15, 220–227. [Google Scholar] [CrossRef]
- Gao, O.H.; Klein, R.A. Environmental equity in funding decisions of the clean air school bus program: The case of New York State. Transp. Res. Part D Transp. Environ. 2011, 16, 10–14. [Google Scholar] [CrossRef]
- Szasz, A.; Meuser, M. Unintended, inexorable: The production of environmental inequalities in Santa Clara County, California. Am. Behav. Sci. 2000, 43, 602–632. [Google Scholar] [CrossRef]
- Pastor, M.; Sadd, J.; Hipp, J. Which came first? Toxic facilities, minority move-in, and environmental justice. J. Urban Aff. 2001, 23, 1–21. [Google Scholar] [CrossRef]
- Mohai, P.; Saha, R. Reassessing racial and socioeconomic disparities in environmental justice research. Demogr. 2006, 43, 383–399. [Google Scholar] [CrossRef]
- Mohai, P.; Saha, R. Racial inequity in the distribution of hazardous waste: A national-level reassessment. Soc. Probl. 2007, 54, 343–370. [Google Scholar] [CrossRef]
- Morello-Frosch, R.; Pastor, M.; Sadd, J. Environmental justice and southern California’s ‘riskscape’—The distribution of air toxics exposures and health risks among diverse communities. Urban Aff. Rev. 2001, 36, 551–578. [Google Scholar] [CrossRef]
- Ash, M.; Fetter, T.R. Who lives on the wrong side of the environmental tracks? Evidence from the EPA’s risk-screening environmental indicators model. Soc. Sci. Q. 2004, 85, 441–462. [Google Scholar] [CrossRef]
- Morello-Frosch, R.; Jesdale, B.M. Separate and unequal: Residential segregation and estimated cancer risks associated with ambient air toxics in the U.S. metropolitan areas. Environ. Health Perspect. 2006, 114, 386–393. [Google Scholar] [CrossRef] [PubMed]
- Dasgupta, S.; Wheeler, D. Citizen Complaints as Environmental Indicators: Evidence from China; Policy Research Working Paper Series 1704; The World Bank: Washington, DC, USA, 1997; Available online: http://documents.worldbank.org/curated/en/450781468746709957/pdf/multi-page.pdf (accessed on 1 September 2014).
- Knup, E. Environmental NGOs in China: An overview. China Environ. Serv. 1997, 1, 9–15. [Google Scholar]
- Brettell, B.A. Environmental disputes and public service law: Past and present. China Environ. Serv. 2002, 4, 66–69. [Google Scholar]
- Quan, R.X. Establishing China’s environmental justice study models. Georget. Int. Environ. Law Rev. 2001, 14, 461–487. [Google Scholar]
- Ma, C.B. Who bears the environmental burden in China—An analysis of the distribution of industrial pollution sources? Ecol. Econ. 2010, 69, 1869–1876. [Google Scholar] [CrossRef]
- Schoolman, E.D.; Ma, C.B. Migration, class and environmental inequality: Exposure to pollution in China’s Jiangsu Province. Ecol. Econ. 2012, 75, 140–151. Available online: https://www.highbeam.com/doc/1P3-121911732.html (accessed on 1 September 2014). [CrossRef]
- Kuehn, R.R. A taxonomy of environmental justice. Environ. Law Rep. 2000, 30, 10681–10700. Available online: https://ssrn.com/abstract=628088 (accessed on 5 September 2014).
- China Census (CC). The Sixth National Population Census, National Bureau of Statistics of China. 2010. Available online: http://www.stats.gov.cn/ztjc/zdtjgz/zgrkpc/dlcrkpc/dlcrkpczl/ (accessed on 7 September 2014).
- Zhang, H. The laws on ethnic minority autonomous regions in China: Legal norms and practice. Soc. Sci. Electron. Pub. 2012, 2, 249. Available online: https://ssrn.com/abstract=2029781 (accessed on 17 August 2017).
- Liu, Z. Institution and inequality: The Hukou system in China. J. Comp. Econ. 2005, 33, 133–157. [Google Scholar] [CrossRef]
- Cheng, T.; Selden, M. The origins and social consequences of China’s Hukou system. China Q. 1994, 139, 644–668. [Google Scholar] [CrossRef]
- Wu, X.; Treiman, D.J. The household registration system and social stratification in China: 1955–1996. Demography 2004, 41, 363–384. [Google Scholar] [CrossRef] [PubMed]
- Chan, K.W.; Zhang, L. The Hukou system and rural-urban migration in China: Processes and changes. China Q. 1999, 160, 818–855. Available online: http://www.jstor.org/stable/656045 (accessed on 7 July 2017). [CrossRef]
- National Bureau of Statistics (NBS) of China. National Report on Rural Migrants in 2013. Available online: http://www.stats.gov.cn/tjsj/zxfb/201405/t20140512_551585.html (accessed on 12 May 2014).
- Meng, X.; Zhang, J. The two-tier labor market in urban China: Occupational segregation and wage differentials between urban residents and rural migrants in Shanghai. J. Comp. Econ. 2001, 29, 485–504. [Google Scholar] [CrossRef]
- Meng, X. Profit Sharing and the Earnings Gap between Urban and Rural-Migrant Workers in Chinese Enterprises; Working Paper; Department of Economics, Research School of Pacific and Asian Studies, Australian National University: Canberra, Australia, 2006; Available online: http://people.anu.edu.au/xin.meng/MIGRANT4-version2.pdf (accessed on 1 May 2015).
- Wang, R. The Welfare of Rural Migrant Workers; Working Paper; Institute of Population and Labor Economics, Chinese Academy of Social Sciences: Beijing, China, 2009. [Google Scholar]
- Huang, Y. Gender, Hukou, and the occupational attainment of female migrants in China (1985–1990). Environ. Plan. A 2001, 33, 257–280. [Google Scholar] [CrossRef]
- Roberts, K.D.; Chen, A.; Liu, G.G.; Zhang, K.H. The determinants of job choice by rural labor migrants in Shanghai. China Econ. Rev. 2001, 12, 15–39. [Google Scholar] [CrossRef]
- Knight, J.; Song, L.; Jia, H. Chinese rural migrants in urban enterprises: Three perspectives. J. Dev. Stud. 1999, 35, 73–104. [Google Scholar] [CrossRef]
- Wei, Y. Rural-urban migrant workers in China: The vulnerable group in cities. In Proceedings of the 6th the Berlin Roundtables on Transnationality on ‘Population Politics and Migration’, Berlin, Germany, 14 February 2007. [Google Scholar]
- Lu, Y.L. Peasant China: Study of Post-Earthbound Society and New Rural Construction; China Renmin University Press: Beijing, China, 2010. [Google Scholar]
- Shih, V. Development, the second time around: The political logic of developing western China. J. East Asian Stud. 2004, 4, 427–451. [Google Scholar] [CrossRef]
- Zhu, T. Resource and comparative advantages and industrial choice for the central region’s rising in China. Prod. Res. 2007, 18, 109–110. (In Chinese) [Google Scholar]
- Xiang, W.; Qian, Q.L.; Sheng, K.R.; Fan, J. Comparison and thoughts of “great western development” and “revitalization of the old industrial base in northeast china” strategy: Discussion of the scientific meaning and contents of national region development strategy. Econ. Geogr. 2006, 6, 902–918. (In Chinese) [Google Scholar]
- Li, Z.S. Population Economics, 3rd ed.; Tsinghua University Press: Beijing, China, 2013. [Google Scholar]
- Krieg, E.J.; Faber, D.R. Not so black and white: Environmental justice and cumulative impact assessments. Environ. Impact Assess. Rev. 2004, 24, 667–694. [Google Scholar] [CrossRef]
- Bevc, C.A.; Marshall, B.K.; Picou, J.S. Environmental justice and toxic exposure: Toward a spatial model of physical health and psychological well-being. Soc. Sci. Res. 2007, 36, 48–67. [Google Scholar] [CrossRef]

| Category | Variable | Definition | Source |
|---|---|---|---|
| Dependent variable | Number of sources of industrial pollution in unit i as monitored by the MEP in 2010 | MEP | |
| Independent variables | |||
| D | Log of the residential population of geographical unit i | Population Census 2010 | |
| Per cent of middle-school-educated residents | |||
| U | Percent of ethnic minorities (Here, ethnic minorities refer to all fifty-five ethnicities other than the Han people in China) in the population of geographical unit i | Population Census 2010 | |
| (In China, an official discrepancy has occurred in the statistical definition of urban and rural income, whereby the former represents the per capita disposable income of urban residents and the latter refers to the per capita net income of rural households. Therefore, to measure the income level at the prefecture level, we extract the first principal component of these two indicators, which accounts for 91.51% of the information) | Principal component scores for urban and rural income in geographical unit i | Authors’ calculation based on the Population Census 2010 | |
| C | Per cent of the urban population in the total population | Population Census 2010 | |
| Ratio of permanent resident population to registered population (The registered population refers to citizens who have registered their permanent residence (“Hukou” in Chinese) with the administrative department responsible for household registration at their habitual residence, in accordance with “the household registration regulations of the People’s Republic of China”. According to the 2010 Population Census [21], the permanent resident population includes individuals living in townships, towns and street communities with household registration in the same townships, towns and street communities or those with household registrations to be determined; individuals living in townships, towns and street communities who left other registered townships, towns and street communities for more than half a year; individuals living in townships, towns and street communities who left the same townships, towns and street communities for less than half a year; and individuals working or studying abroad. The relation among the permanent, registered and migrant populations can be summarized in a single equation as follows: permanent population = registered population + net migrants (flow in).) | |||
| Per cent of migrants in geographical unit i | |||
| Per cent of rural migrants in geographical unit i | |||
| Dummy variable = 1 when unit i belongs to the central, western or northeastern economic area; 0 otherwise. | National Statistics Bureau | ||
| Extended models | Log of the area of geographical unit i | Statistical yearbooks 2011 at the provincial level | |
| Log of the population density of geographical unit i | Population Census 2010 | ||
| Per cent of employment in mining, manufacturing and electricity generation | Population Census 2010 | ||
| Log of the average volume of water resources per capita of geographical unit i over the past 3 years | Water resources bulletin 2008, 2009, 2010 at provincial level | ||
| Dummy variable = 1 when unit i is ethnically autonomous at the prefecture level or belongs to the autonomous region at the provincial level | National Statistics Bureau | ||
| Model | Baseline Models (As Discussed in Section 3.2.4, Three Different Indicators Associated with the Migrant Population are Respectively Introduced into the Baseline Models (1)–(3), Including the Ratio of the Permanent Resident Population to the Registered Population () and the Percentages of Migrants ( and Rural Migrants () Relative to the Permanent Resident Population.) | Extended Models (Due to Space Limitations, Only the Results of the Extended Models Based on Baseline Model (3), with the Percentage of Rural Migrants Relative to the Total Population (), Have been Provided in the Text, with the Remaining Results Available upon Request.) | ||||||
|---|---|---|---|---|---|---|---|---|
| Variables | (1) | (2) | (3) | (4) | (5) | (6) | (7) | (8) |
| Population size () | 14.67 *** | 15.34 *** | 14.41 *** | 14.50 *** | 14.43 *** | 14.49 *** | 14.48 *** | 14.13 *** |
| (2.566) | (2.662) | (2.562) | (2.613) | (2.562) | (2.596) | (2.941) | (2.532) | |
| Middle school education | 0.511 *** | 0.373 *** | 0.460 *** | 0.460 *** | 0.469 *** | 0.457 *** | 0.466 *** | 0.290 ** |
| (0.131) | (0.141) | (0.137) | (0.137) | (0.14) | (0.137) | (0.121) | (0.126) | |
| Minority ( minor | 0.197 *** | 0.208 *** | 0.183 *** | 0.184 *** | 0.180 *** | 0.188 *** | 0.182 *** | |
| (0.0521) | (0.0551) | (0.0523) | (0.0528) | (0.0524) | (0.0546) | (0.0543) | ||
| Income level | 11.85 *** | 11.80 *** | 12.39 *** | 12.41 *** | 12.42 *** | 12.08 *** | 12.44 *** | 11.81 *** |
| (2.803) | (2.658) | (2.764) | (2.758) | (2.755) | (2.8) | (2.864) | (2.697) | |
| Urbanization ) | −0.068 | 0.215 | −0.0195 | −0.0219 | −0.0162 | −0.0259 | −0.019 | −0.021 |
| (0.0525) | (0.131) | (0.0536) | (0.0534) | (0.0533) | (0.0583) | (0.0546) | (0.0601) | |
| Net migration () | −12.79 *** | |||||||
| (3.279) | ||||||||
| Migrants ) | −0.560 *** | |||||||
| (0.207) | ||||||||
| Rural migrants () | −0.524 *** | −0.526 *** | −0.541 *** | −0.561 *** | −0.531 *** | −0.516 *** | ||
| (0.194) | (0.193) | (0.191) | (0.196) | (0.199) | (0.18) | |||
| Central region ) | 3.132 | 3.514 | 2.857 | 2.82 | 2.78 | 3.208 | 2.854 | 1.905 |
| (3.43) | (3.395) | (3.382) | (3.37) | (3.393) | (3.515) | (3.38) | (3.475) | |
| Western region WESTi | 13.20 *** | 14.53 *** | 13.61 *** | 13.61 *** | 13.62 *** | 14.23 *** | 13.72 *** | 11.76 ** |
| (4.813) | (5.042) | (4.677) | (4.658) | (4.681) | (5.067) | (5.277) | (4.816) | |
| Northeastern region ) | −7.243 * | −9.700 ** | −9.319 ** | −9.310 ** | −9.548 ** | −8.723 ** | −9.397 ** | −7.991 ** |
| (3.923) | (3.97) | (4.107) | (4.117) | (4.144) | (4.432) | (3.892) | (4.06) | |
| Geographical area | 0.664 | |||||||
| (1.006) | ||||||||
| Population density () | −0.574 | |||||||
| (1.137) | ||||||||
| Employment in polluting industry | 0.0901 | |||||||
| (0.205) | ||||||||
| Water resources ) | 0.122 | |||||||
| (1.097) | ||||||||
| Ethnic autonomous ) | 7.615 *** | |||||||
| (2.549) | ||||||||
| Constant | −211.4 *** | −230.3 *** | −214.2 *** | −218.7 *** | −212.4 *** | −216.5 *** | −216.5 *** | −204.2 *** |
| (38.57) | (40.91) | (39) | (42.15) | (39.1) | (40.2) | (51.79) | (37.64) | |
| p-value of Sargan statistic | 0.2816 | 0.3448 | 0.3200 | 0.3104 | 0.3323 | 0.3013 | 0.3229 | 0.902 |
| p-value of Wu–Hausman F-statistic | 0.0071 | 0.0086 | 0.0081 | 0.0084 | 0.0075 | 0.0122 | 0.0084 | 0.0886 |
| Observations | 337 | 337 | 337 | 337 | 337 | 337 | 337 | 337 |
| R-squared | 0.392 | 0.394 | 0.387 | 0.388 | 0.388 | 0.39 | 0.387 | 0.384 |
| Mean VIF | 1.83 | 2.65 | 1.95 | 1.85 | 1.88 | 2.28 | 2.03 | 1.85 |
© 2017 by the authors. Licensee MDPI, Basel, Switzerland. This article is an open access article distributed under the terms and conditions of the Creative Commons Attribution (CC BY) license (http://creativecommons.org/licenses/by/4.0/).
Share and Cite
He, Q.; Fang, H.; Ji, H.; Fang, S. Environmental Inequality in China: A “Pyramid Model” and Nationwide Pilot Analysis of Prefectures with Sources of Industrial Pollution. Sustainability 2017, 9, 1871. https://doi.org/10.3390/su9101871
He Q, Fang H, Ji H, Fang S. Environmental Inequality in China: A “Pyramid Model” and Nationwide Pilot Analysis of Prefectures with Sources of Industrial Pollution. Sustainability. 2017; 9(10):1871. https://doi.org/10.3390/su9101871
Chicago/Turabian StyleHe, Qi, Hong Fang, Han Ji, and Siran Fang. 2017. "Environmental Inequality in China: A “Pyramid Model” and Nationwide Pilot Analysis of Prefectures with Sources of Industrial Pollution" Sustainability 9, no. 10: 1871. https://doi.org/10.3390/su9101871
APA StyleHe, Q., Fang, H., Ji, H., & Fang, S. (2017). Environmental Inequality in China: A “Pyramid Model” and Nationwide Pilot Analysis of Prefectures with Sources of Industrial Pollution. Sustainability, 9(10), 1871. https://doi.org/10.3390/su9101871