Life-Cycle Assessment: A Comparison between Two Optimal Post-Tensioned Concrete Box-Girder Road Bridges


Abstract
1. Introduction
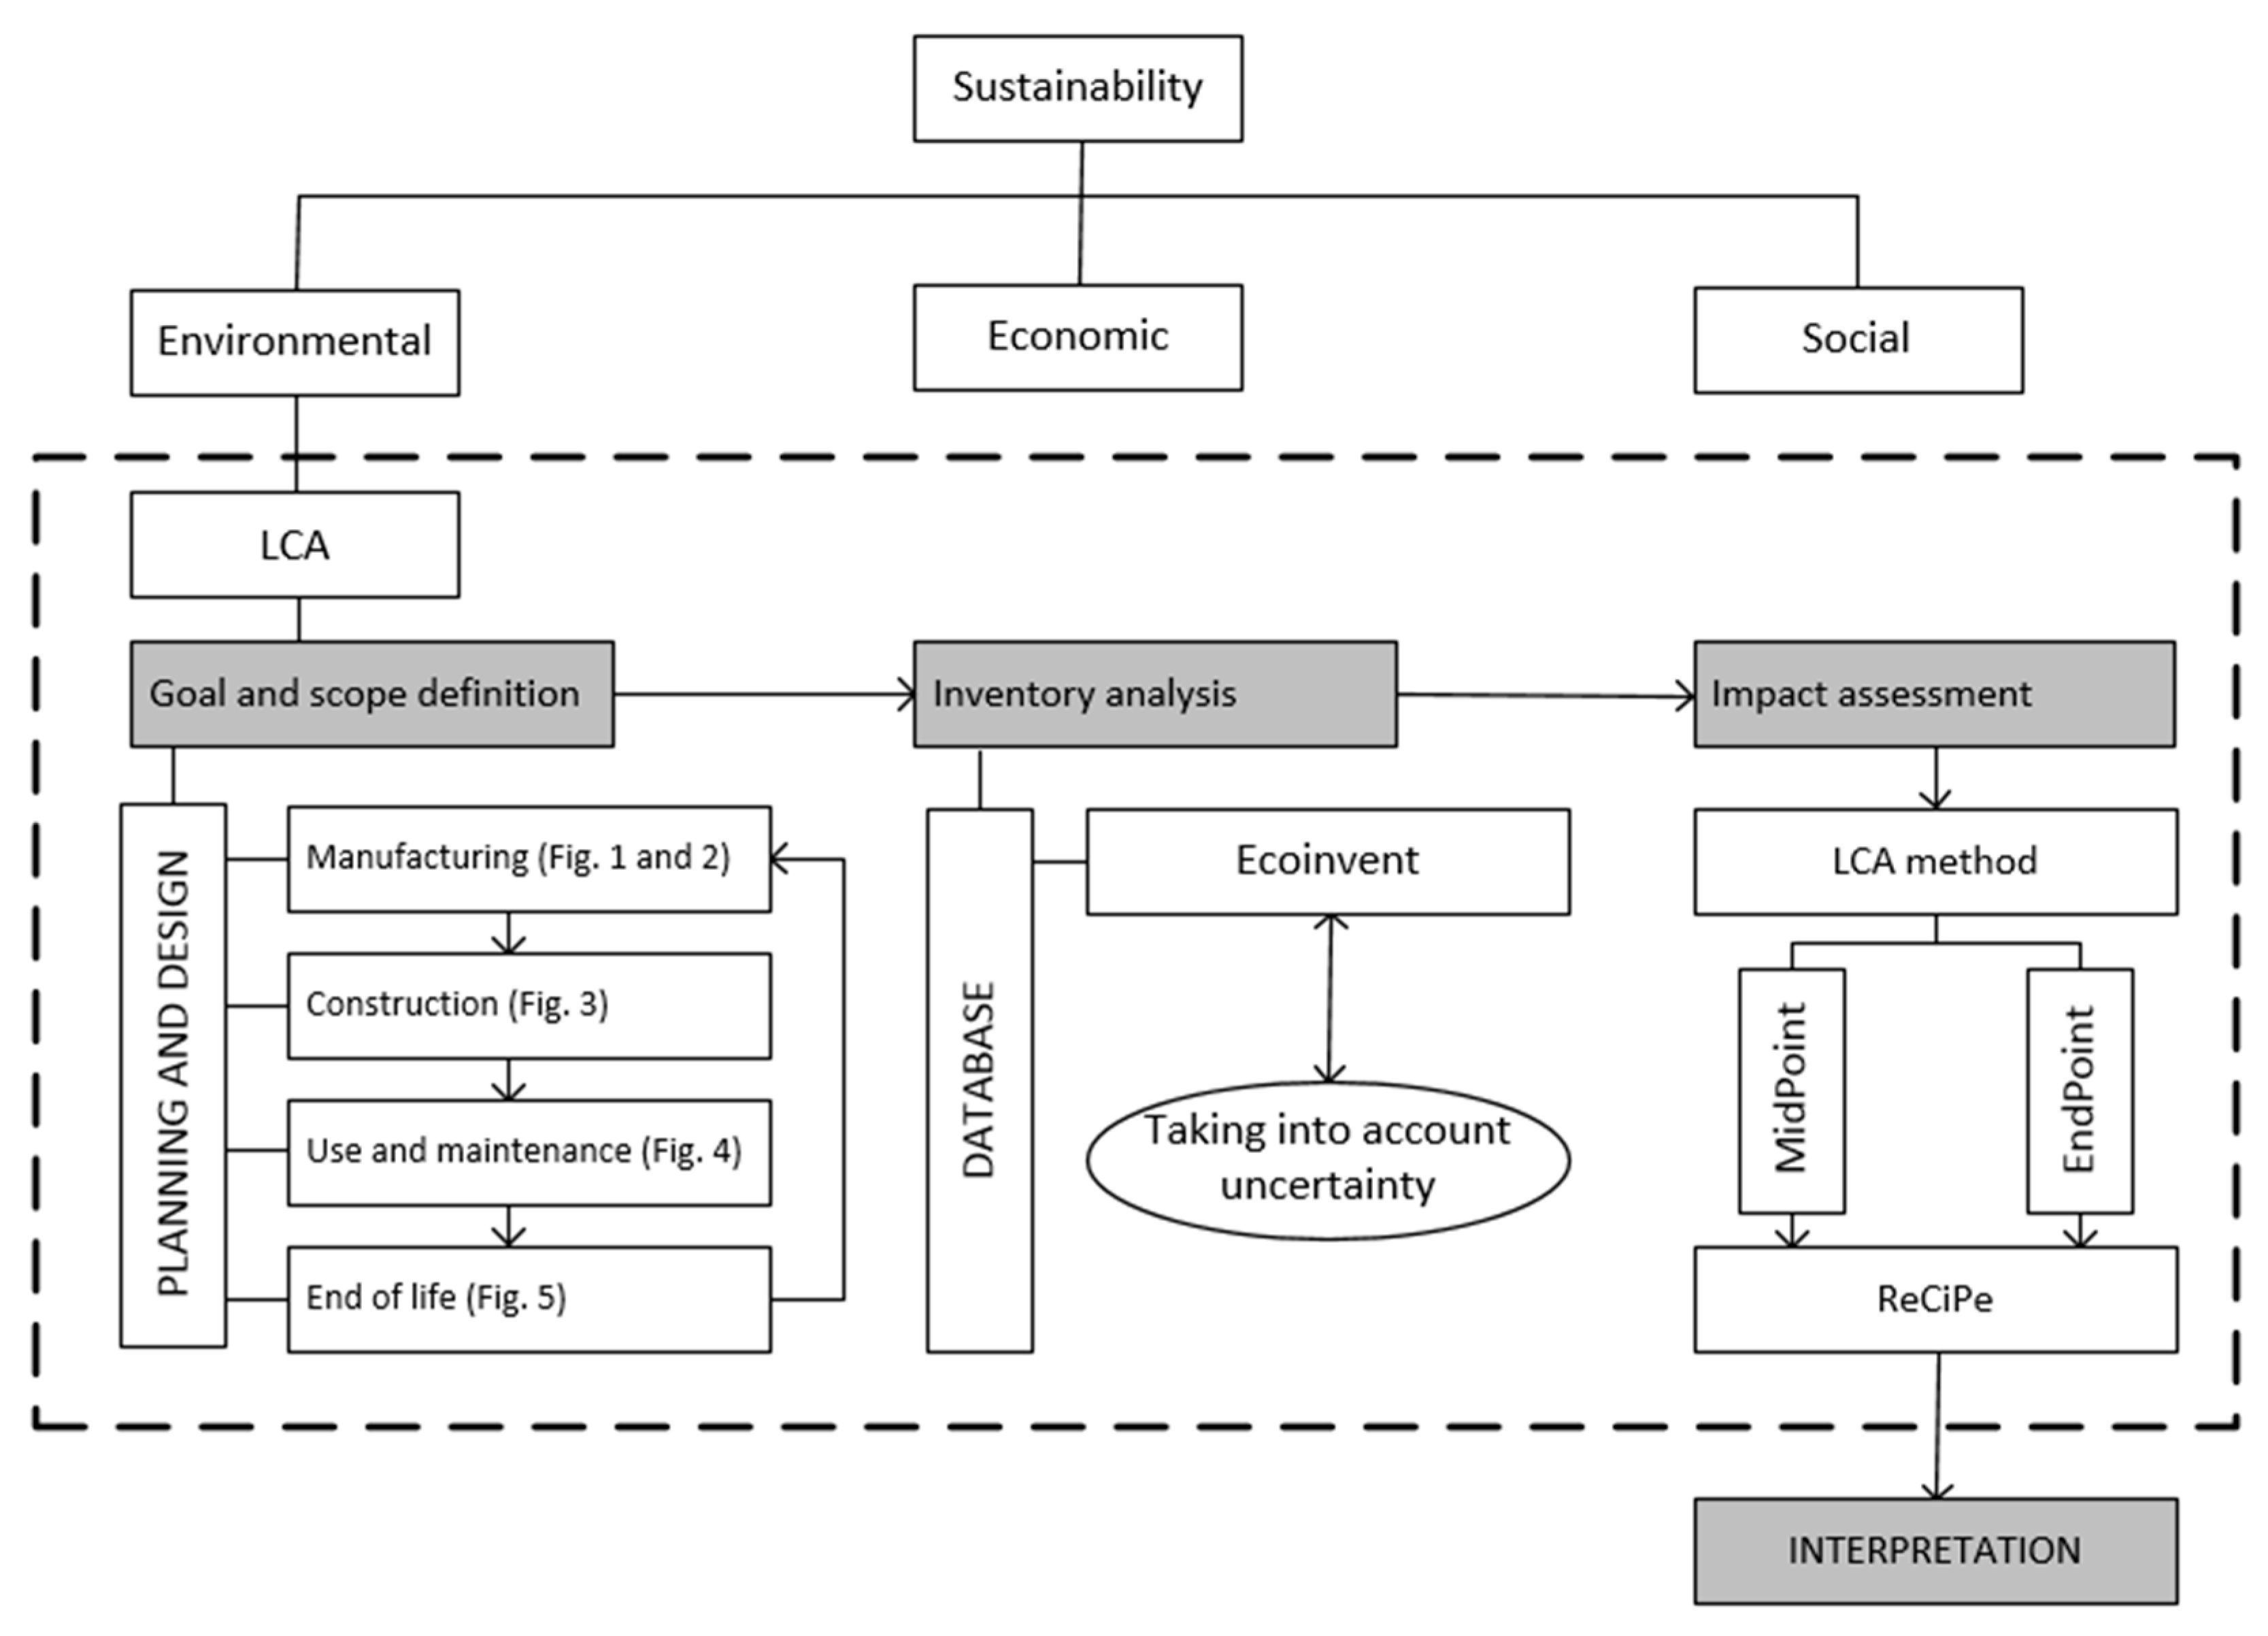
2. LCA Method
2.1. Goal and Scope Definition
2.1.1. Ecoinvent
2.1.2. Uncertainty
2.1.3. Stages
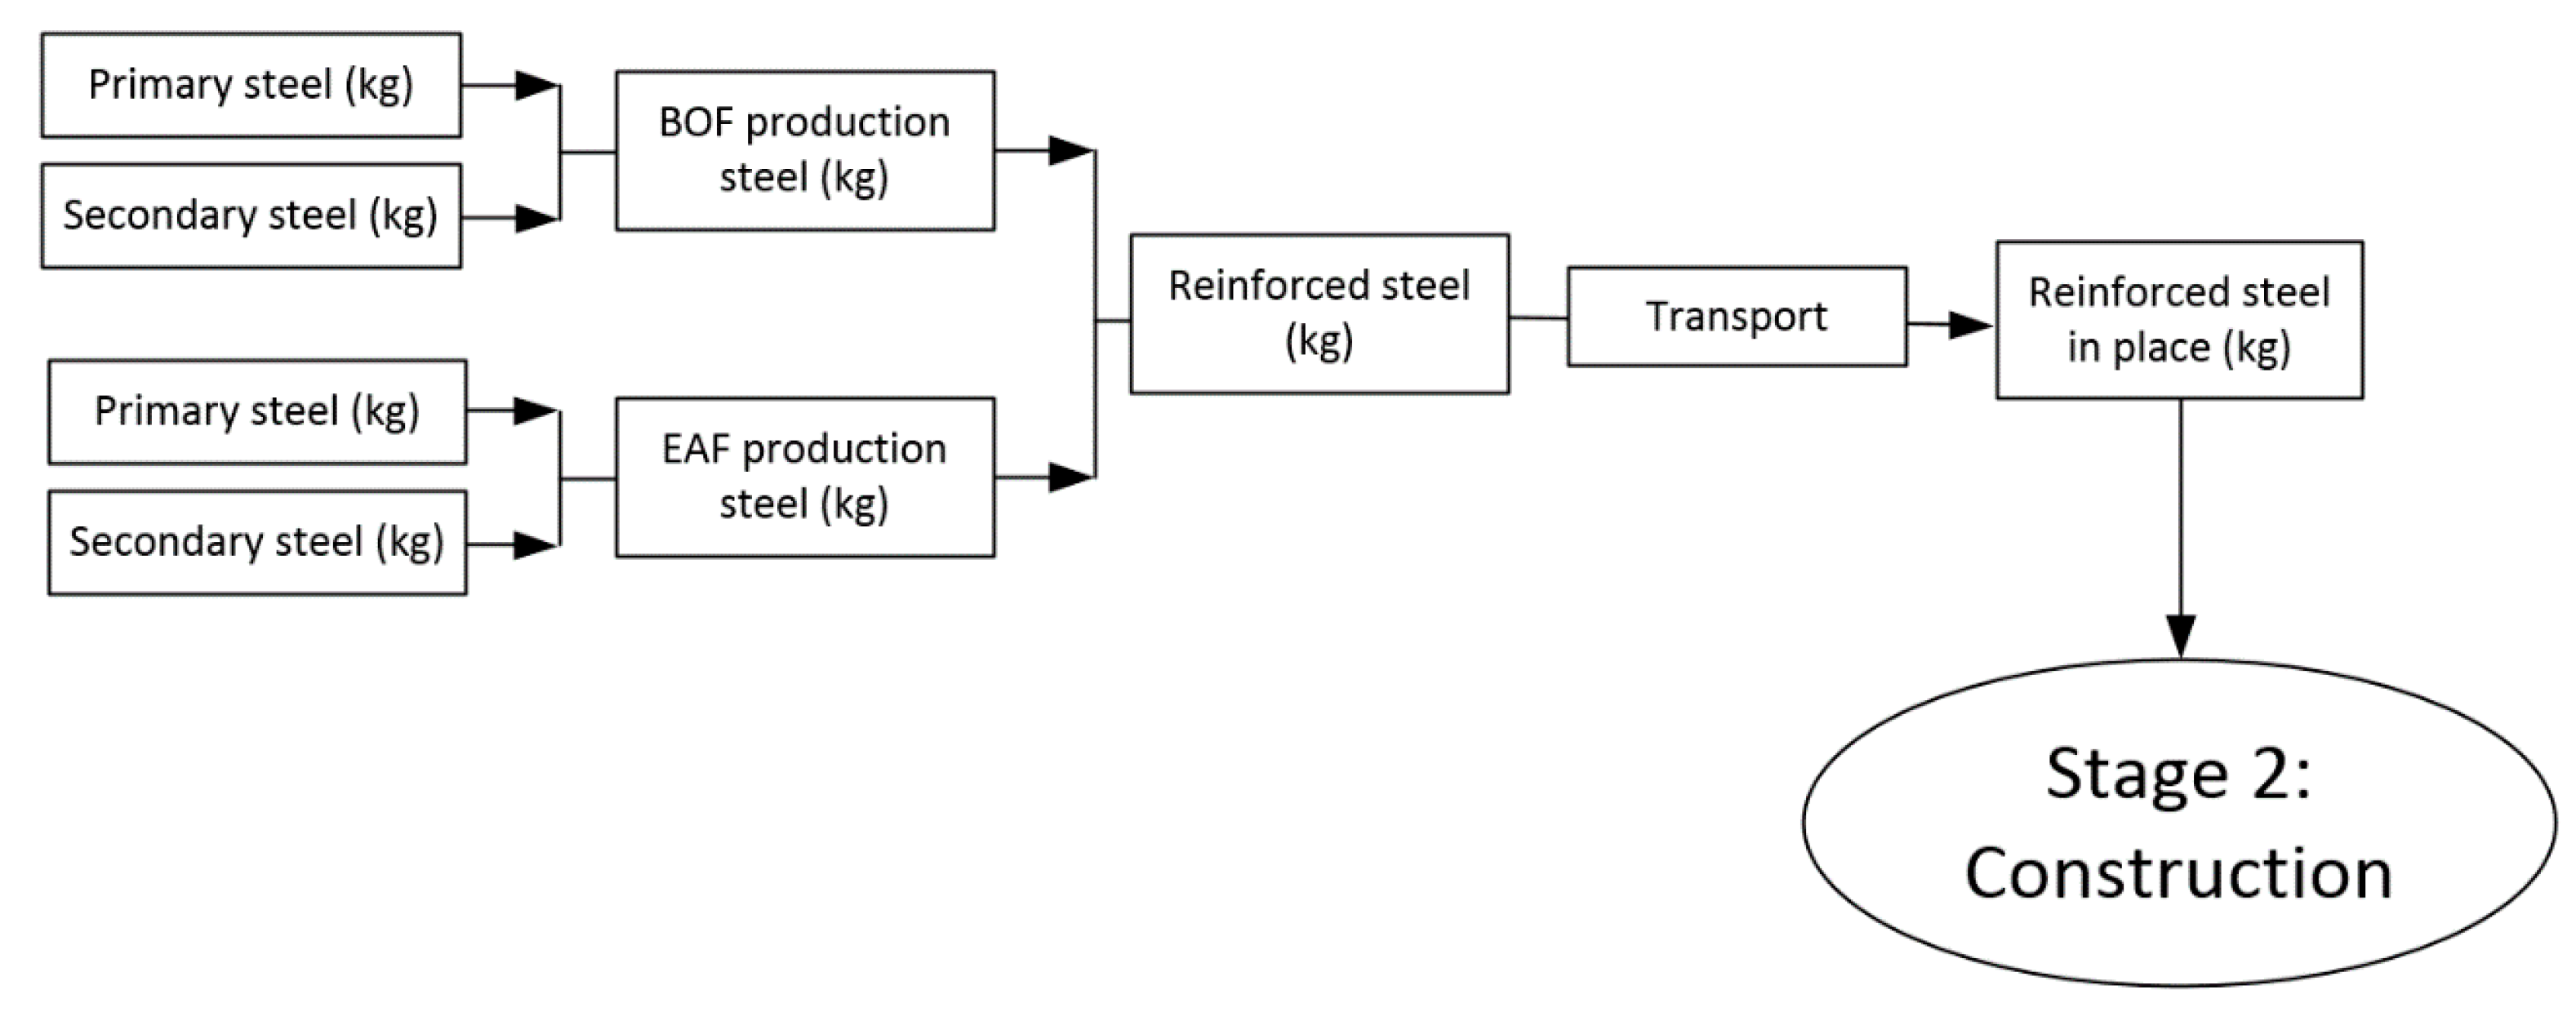
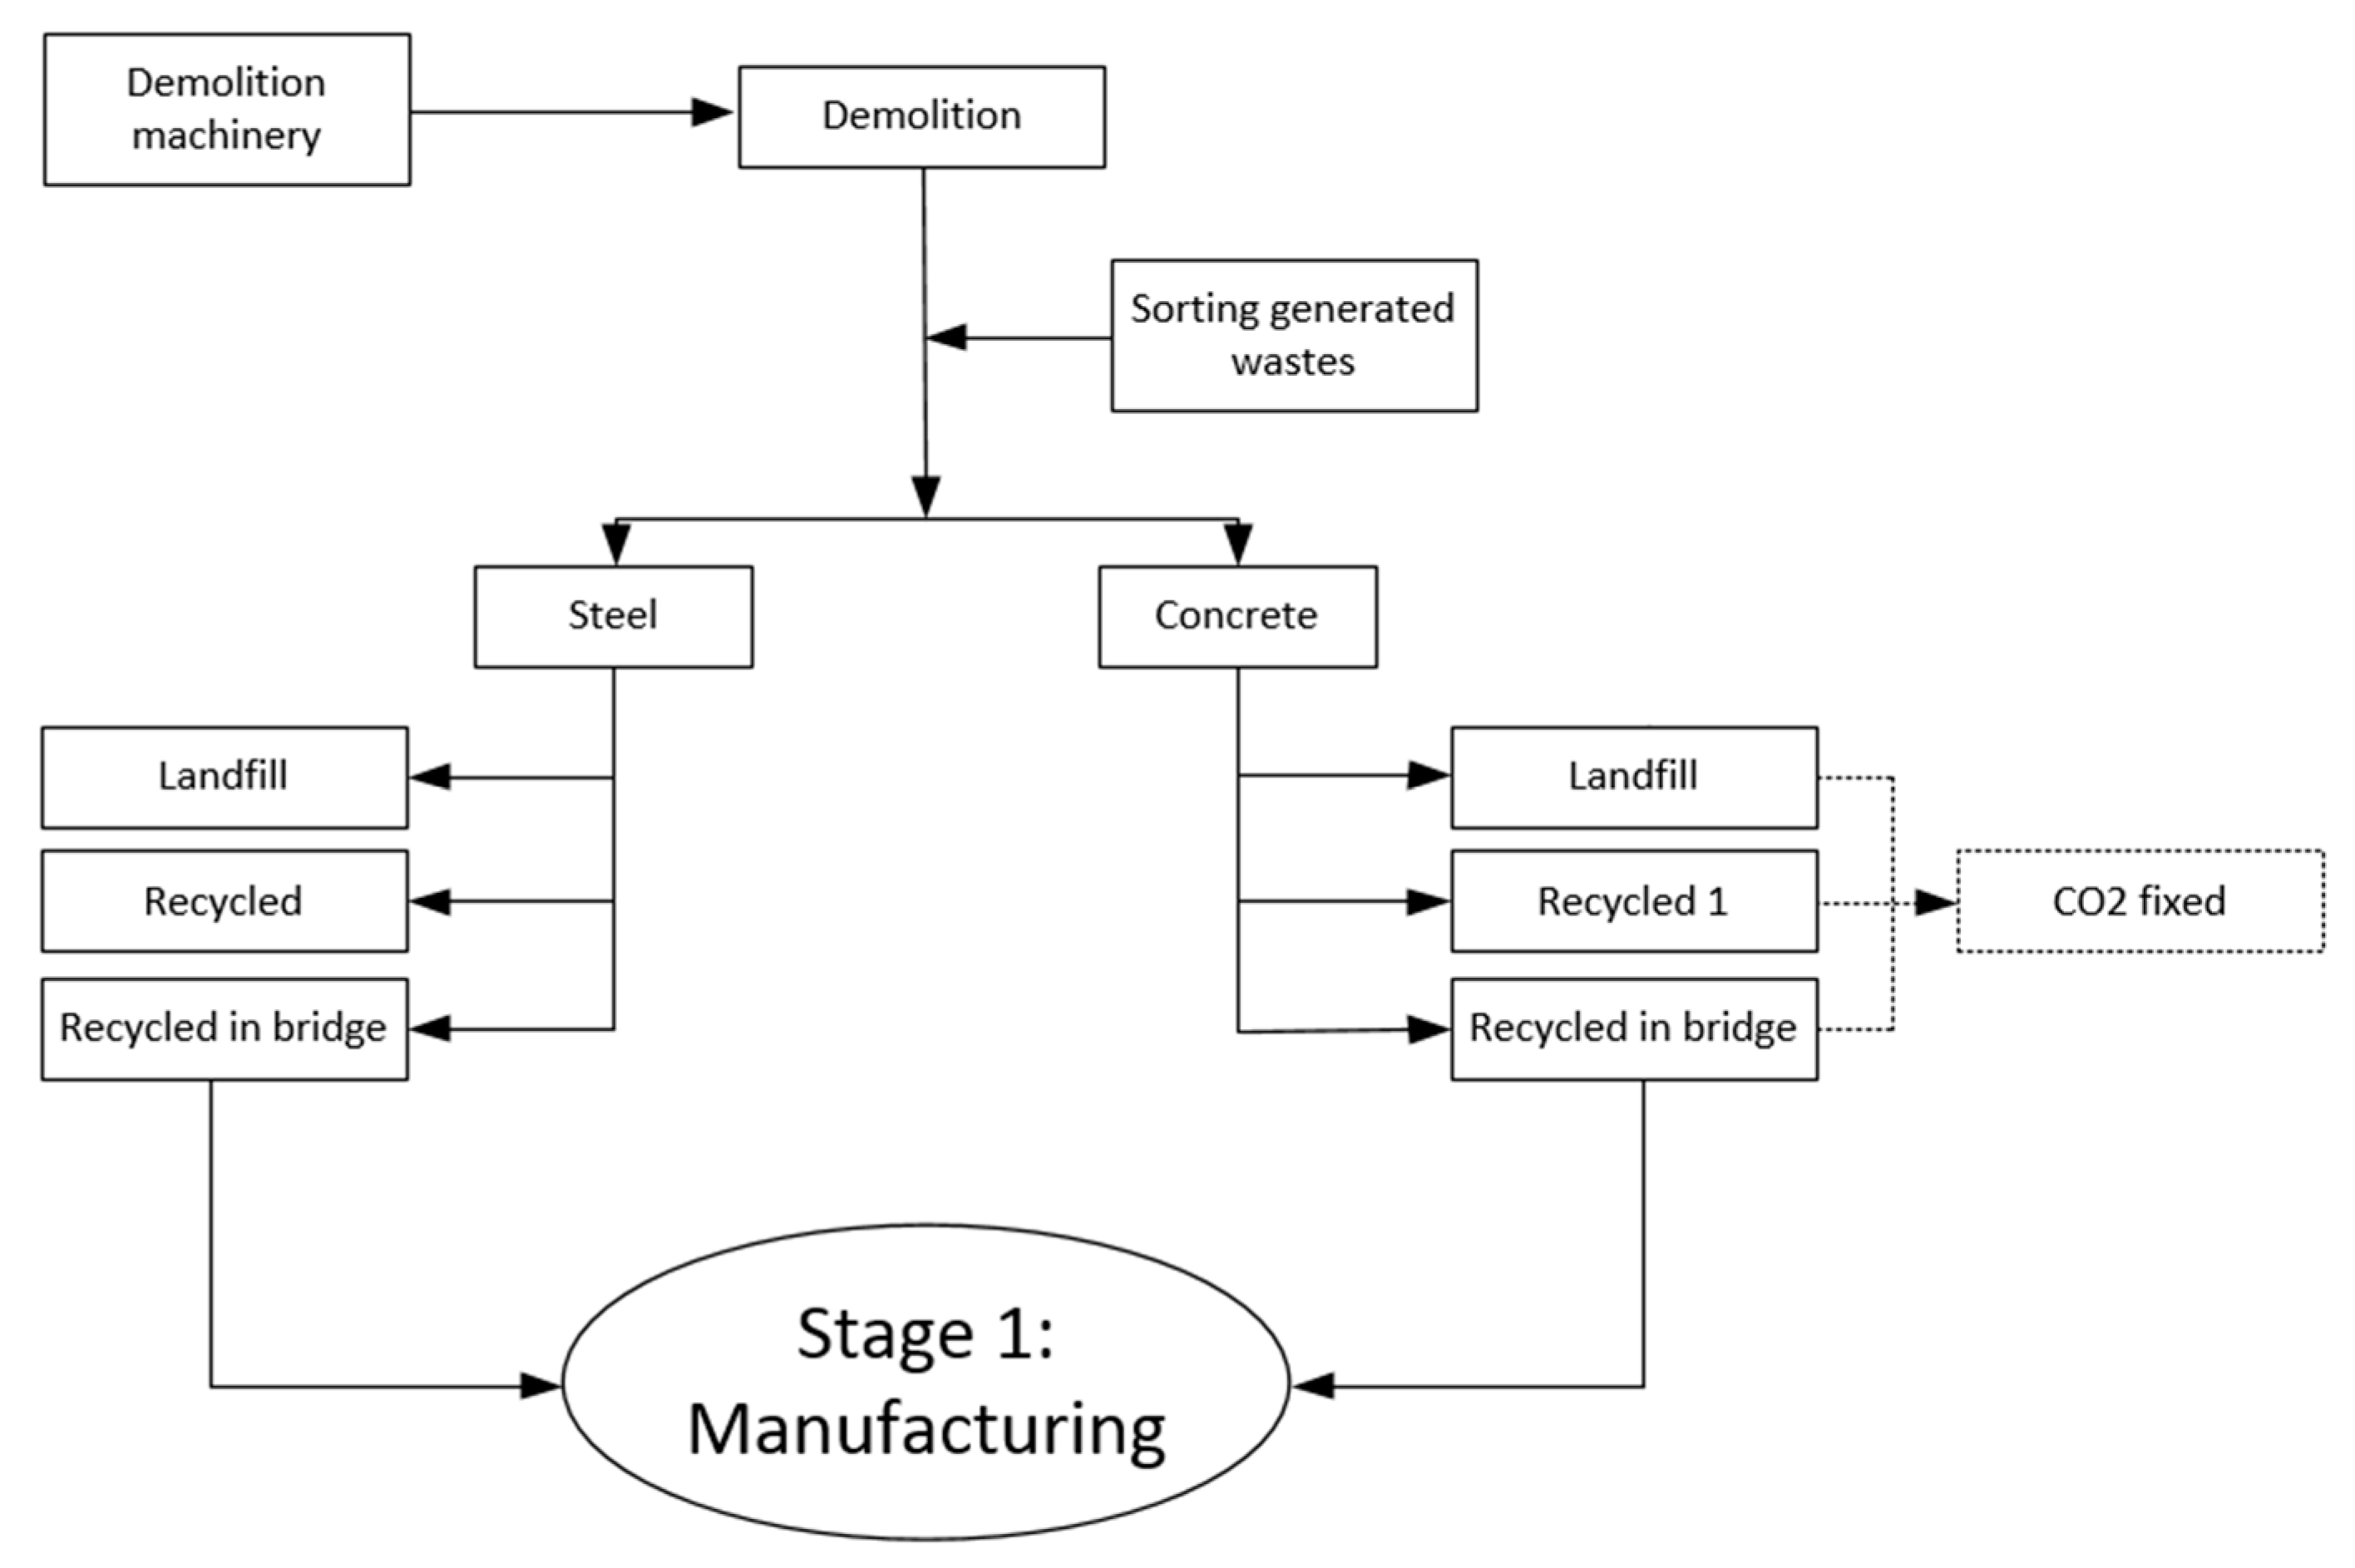
2.1.4 Manufacturing
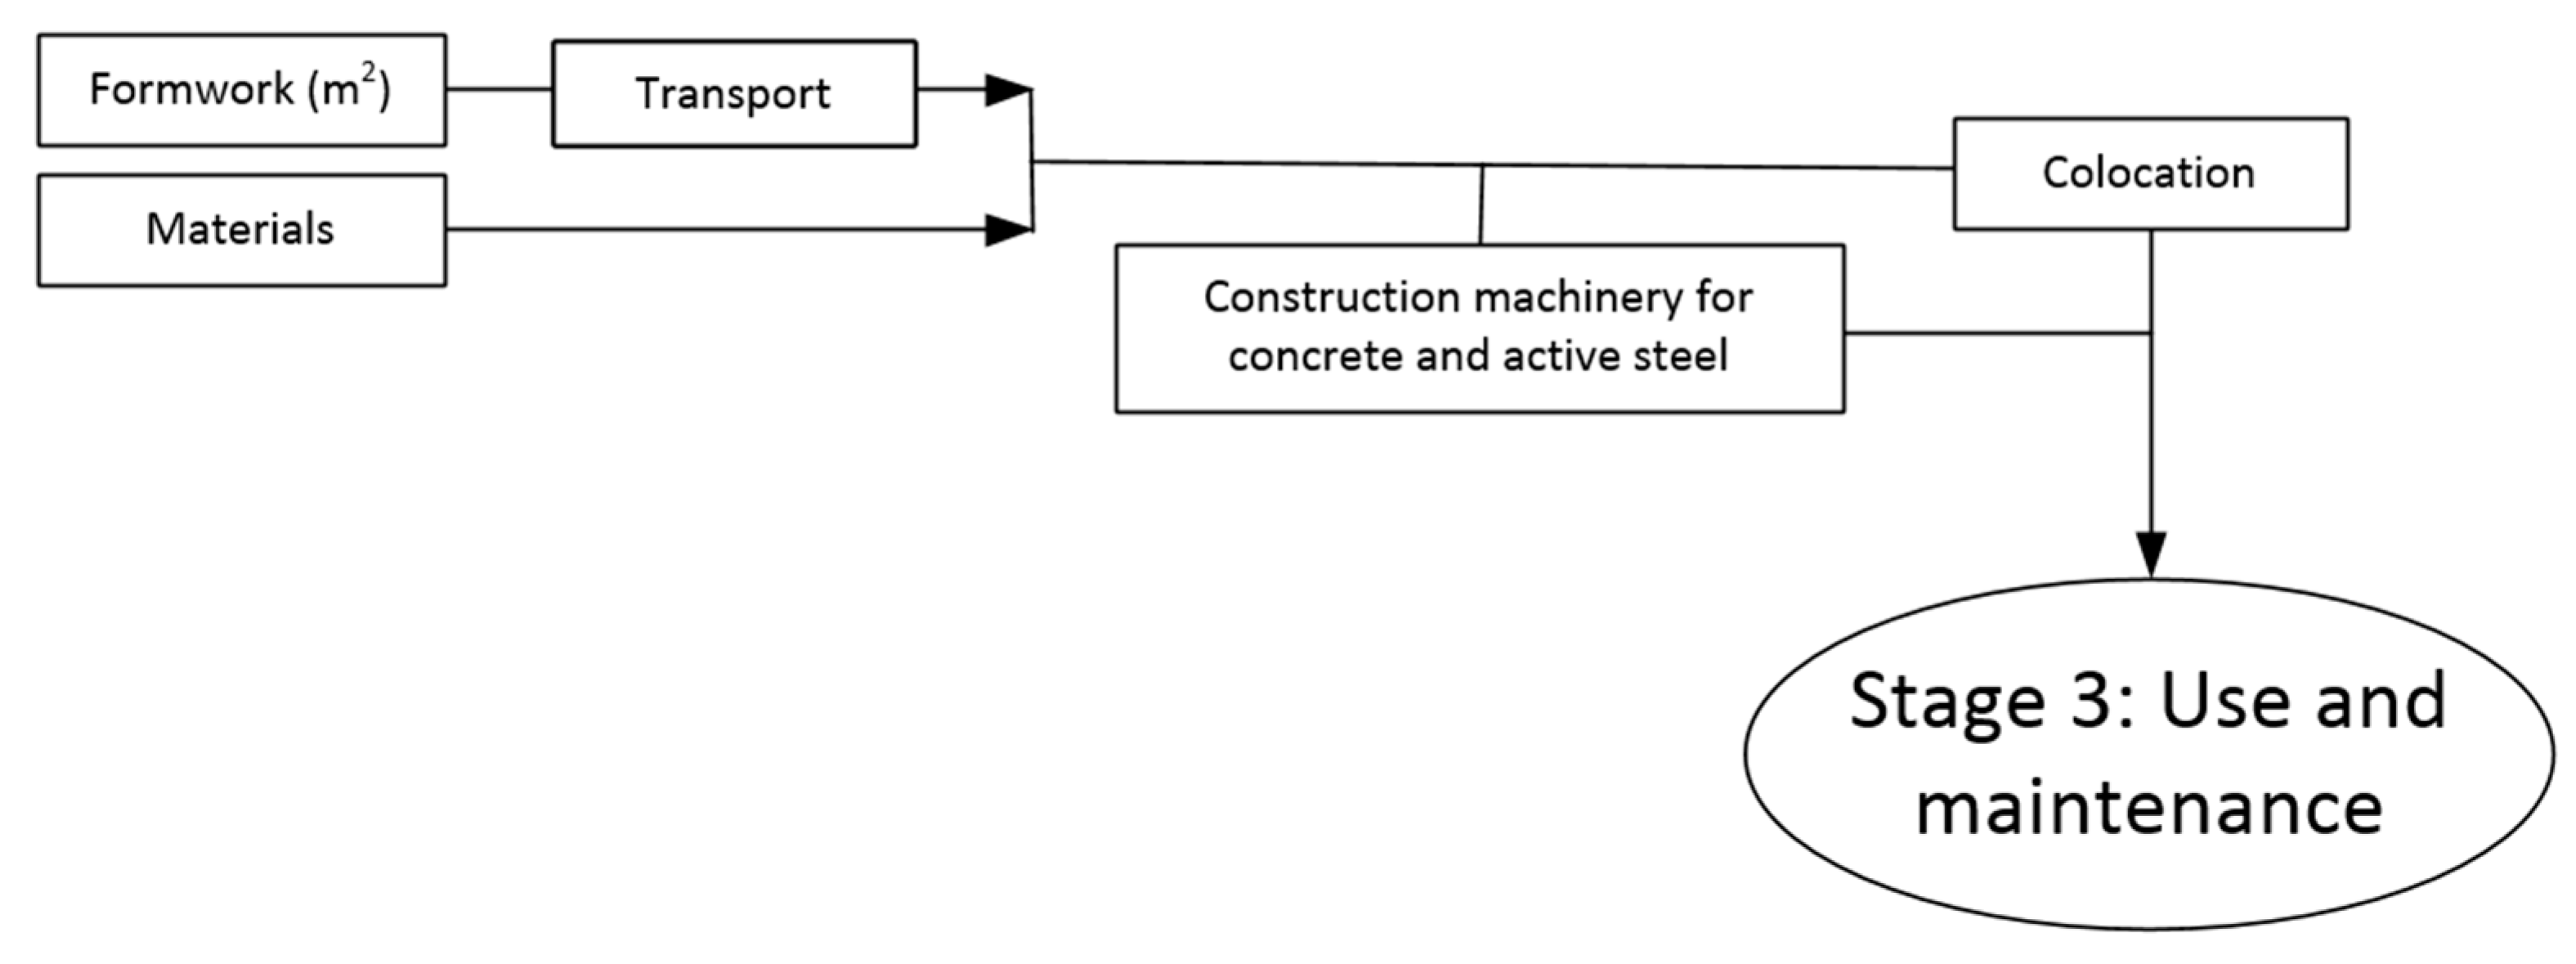
2.1.5. Construction
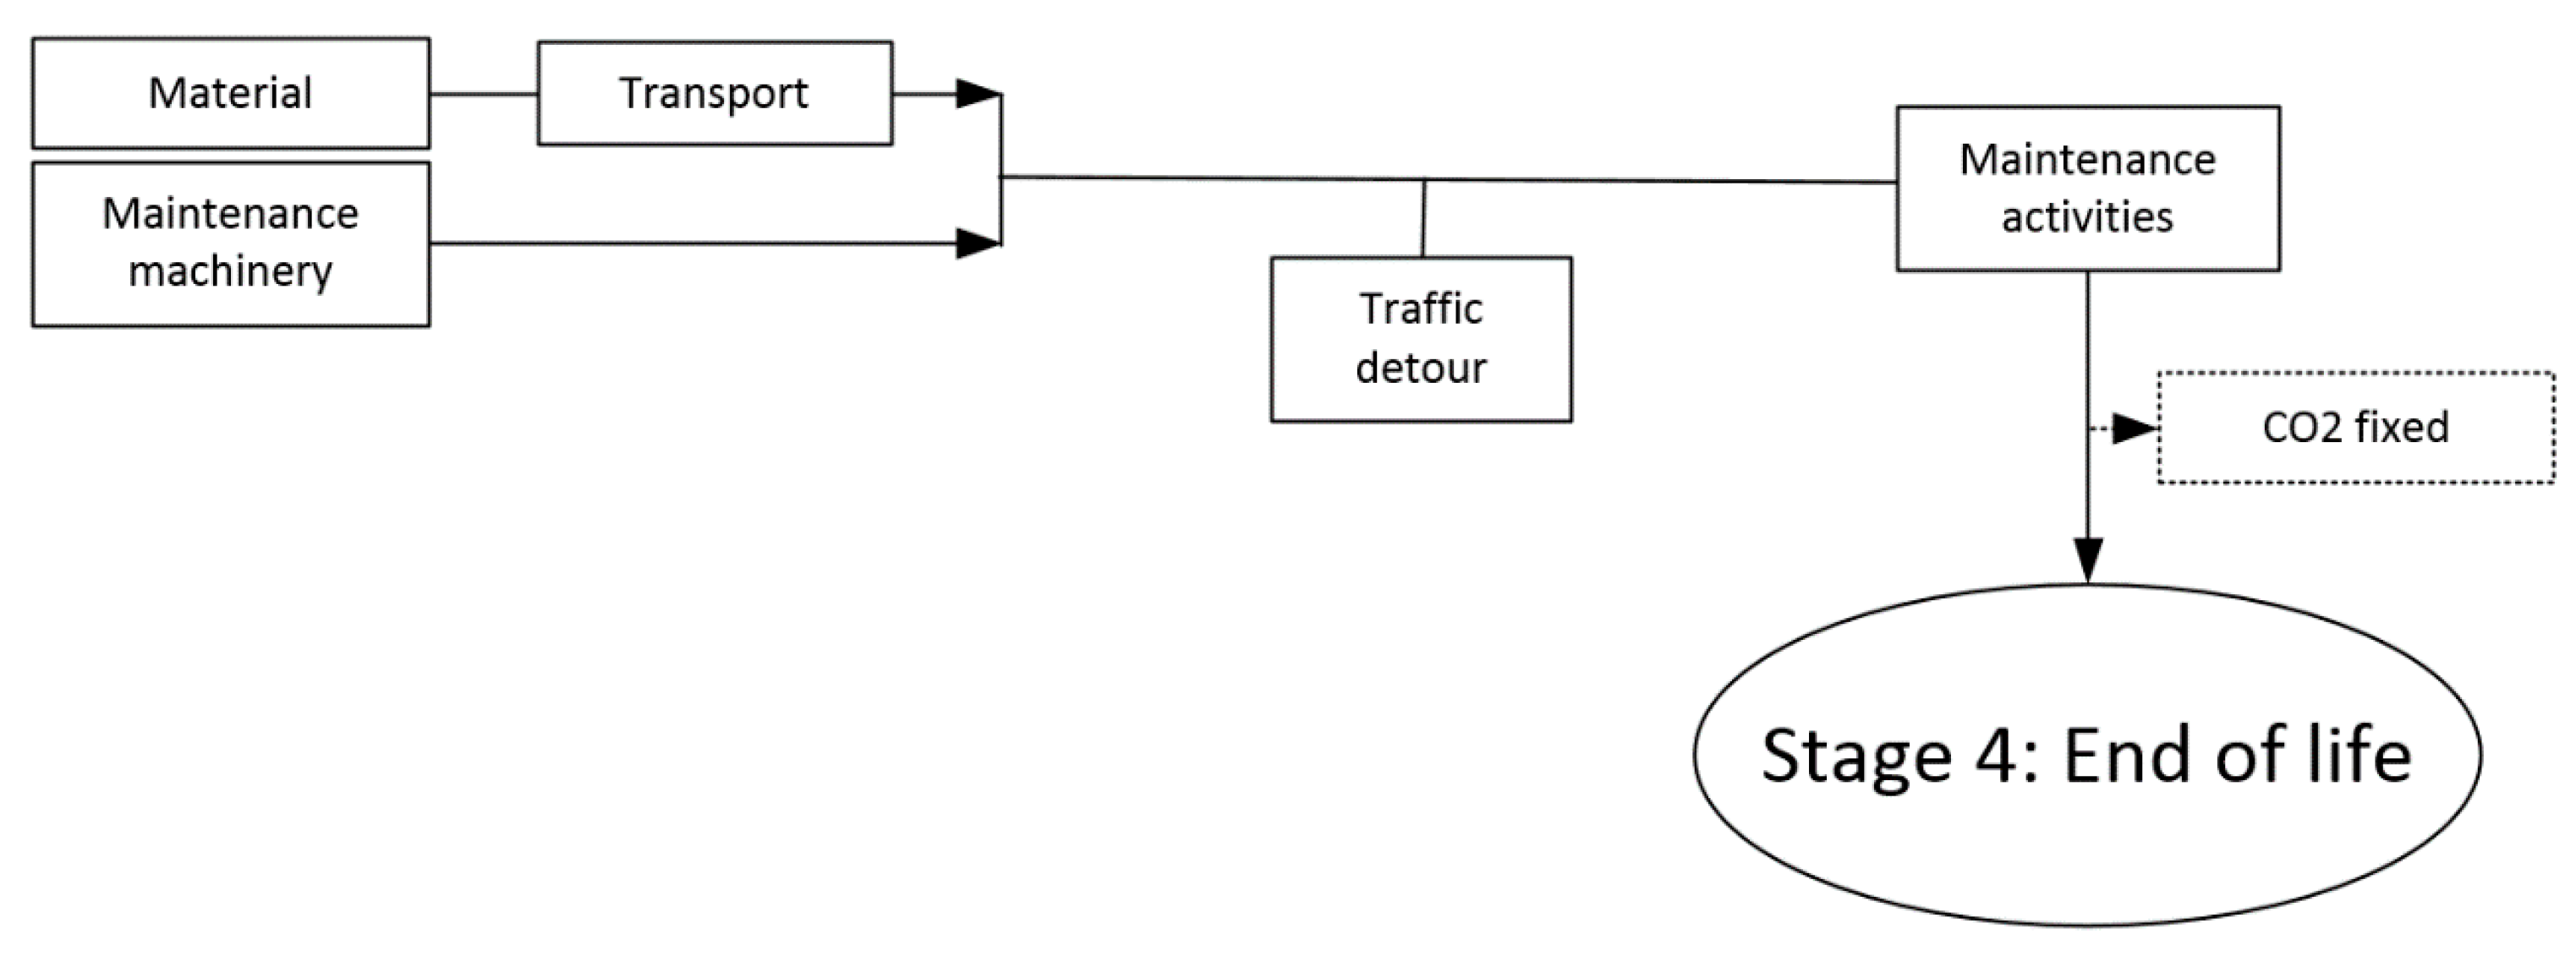
2.1.6. Maintenance and Use
2.1.7. End of Life
2.2. Inventory Analysis
2.3. Impact Assessment
2.4. Interpretation
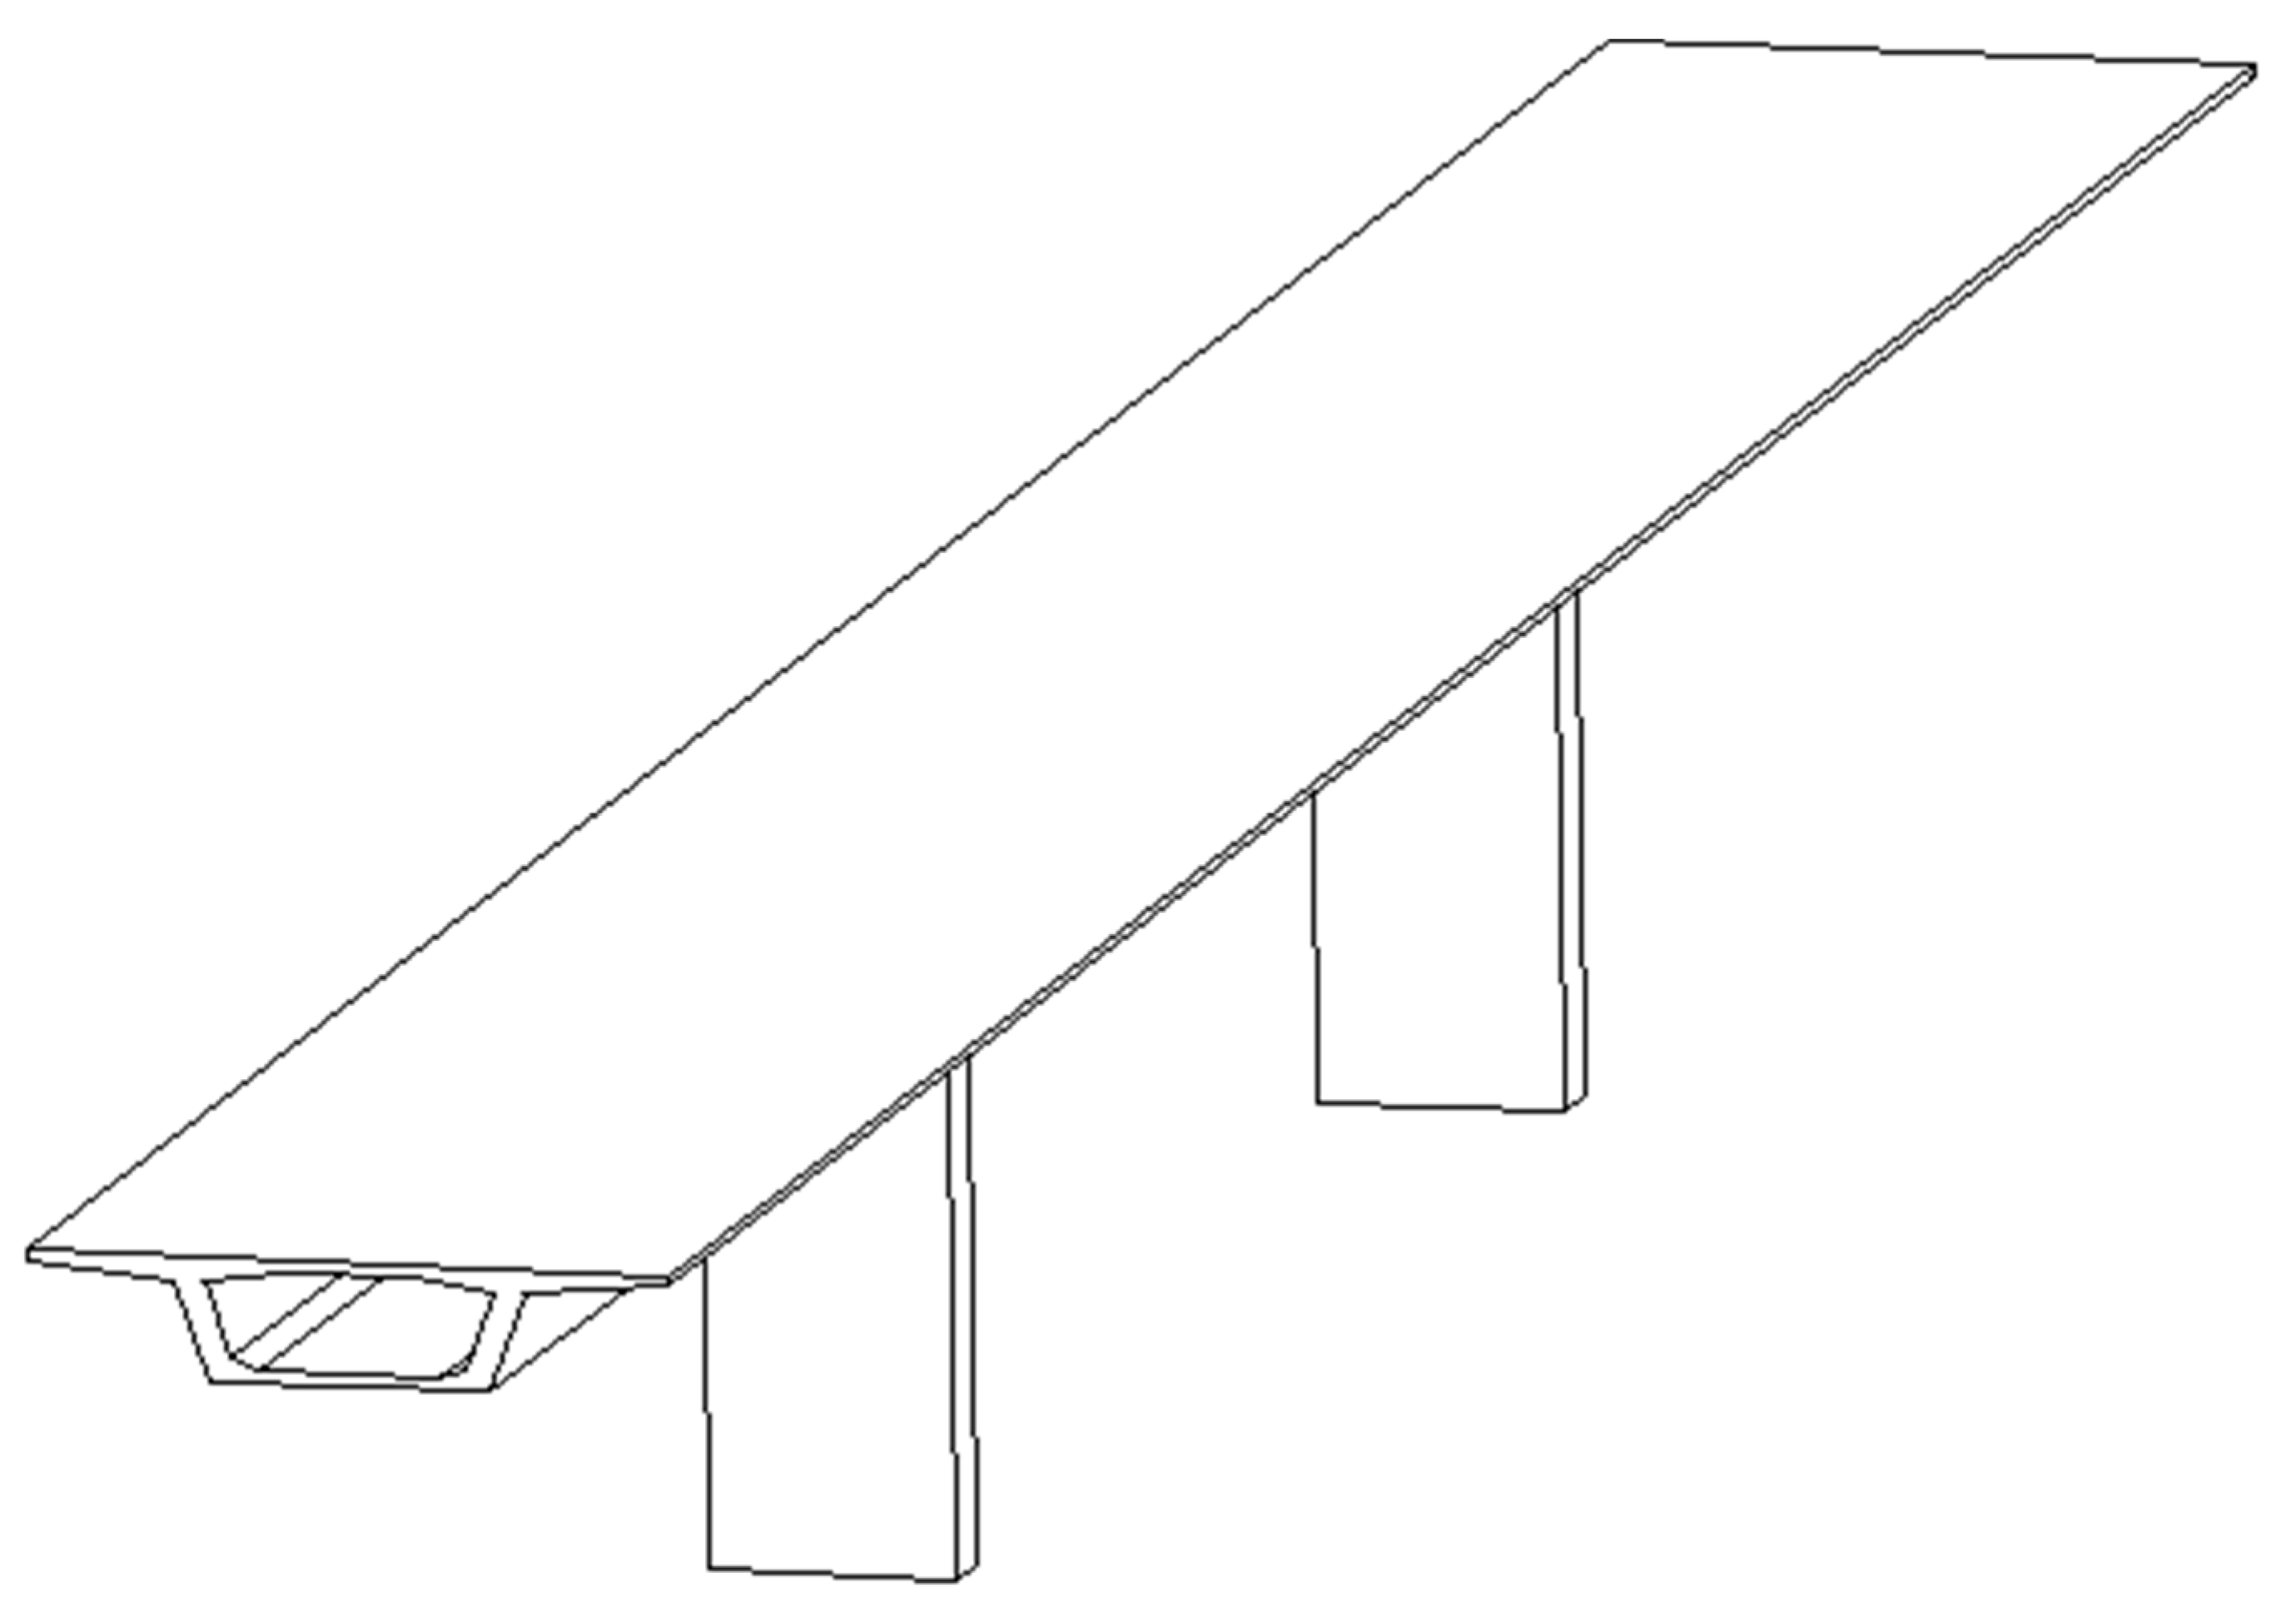
3. Case of Study
3.1. General Scheme
3.2. Bridge Studied
3.2.1. Manufacturing
3.2.2. Construction
3.2.3. Maintenance and Use
3.2.4. End of Life
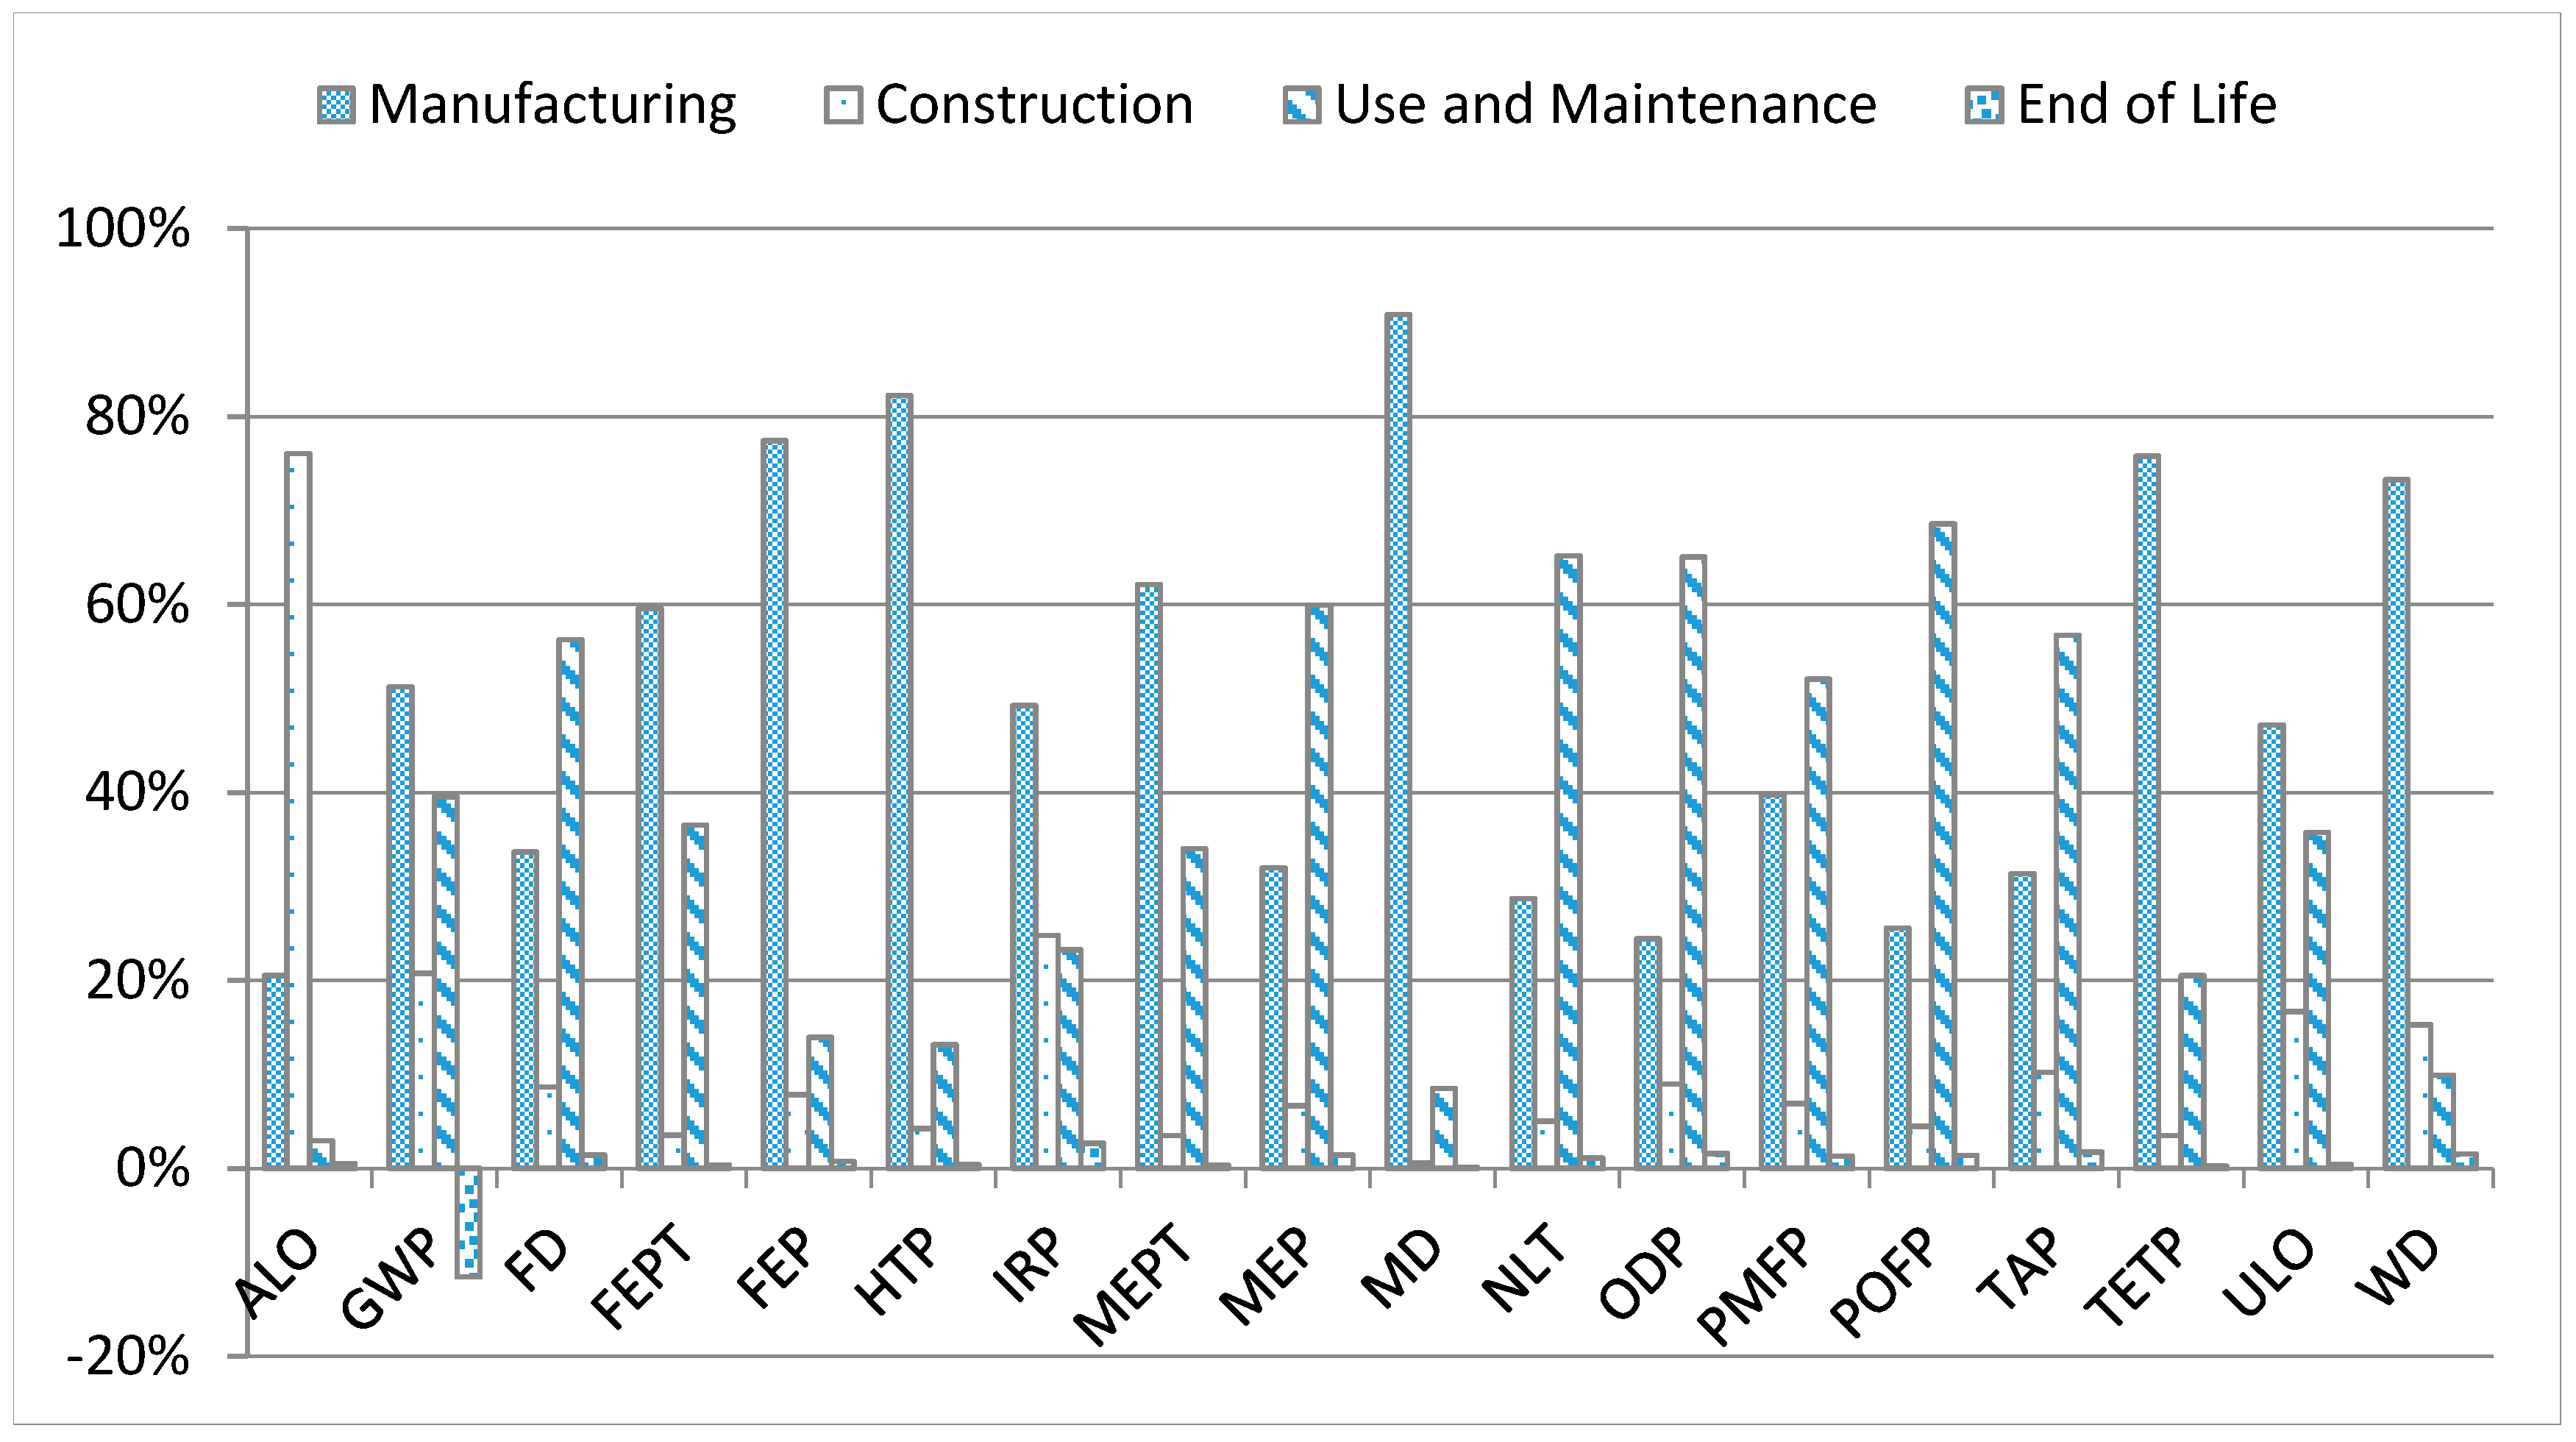
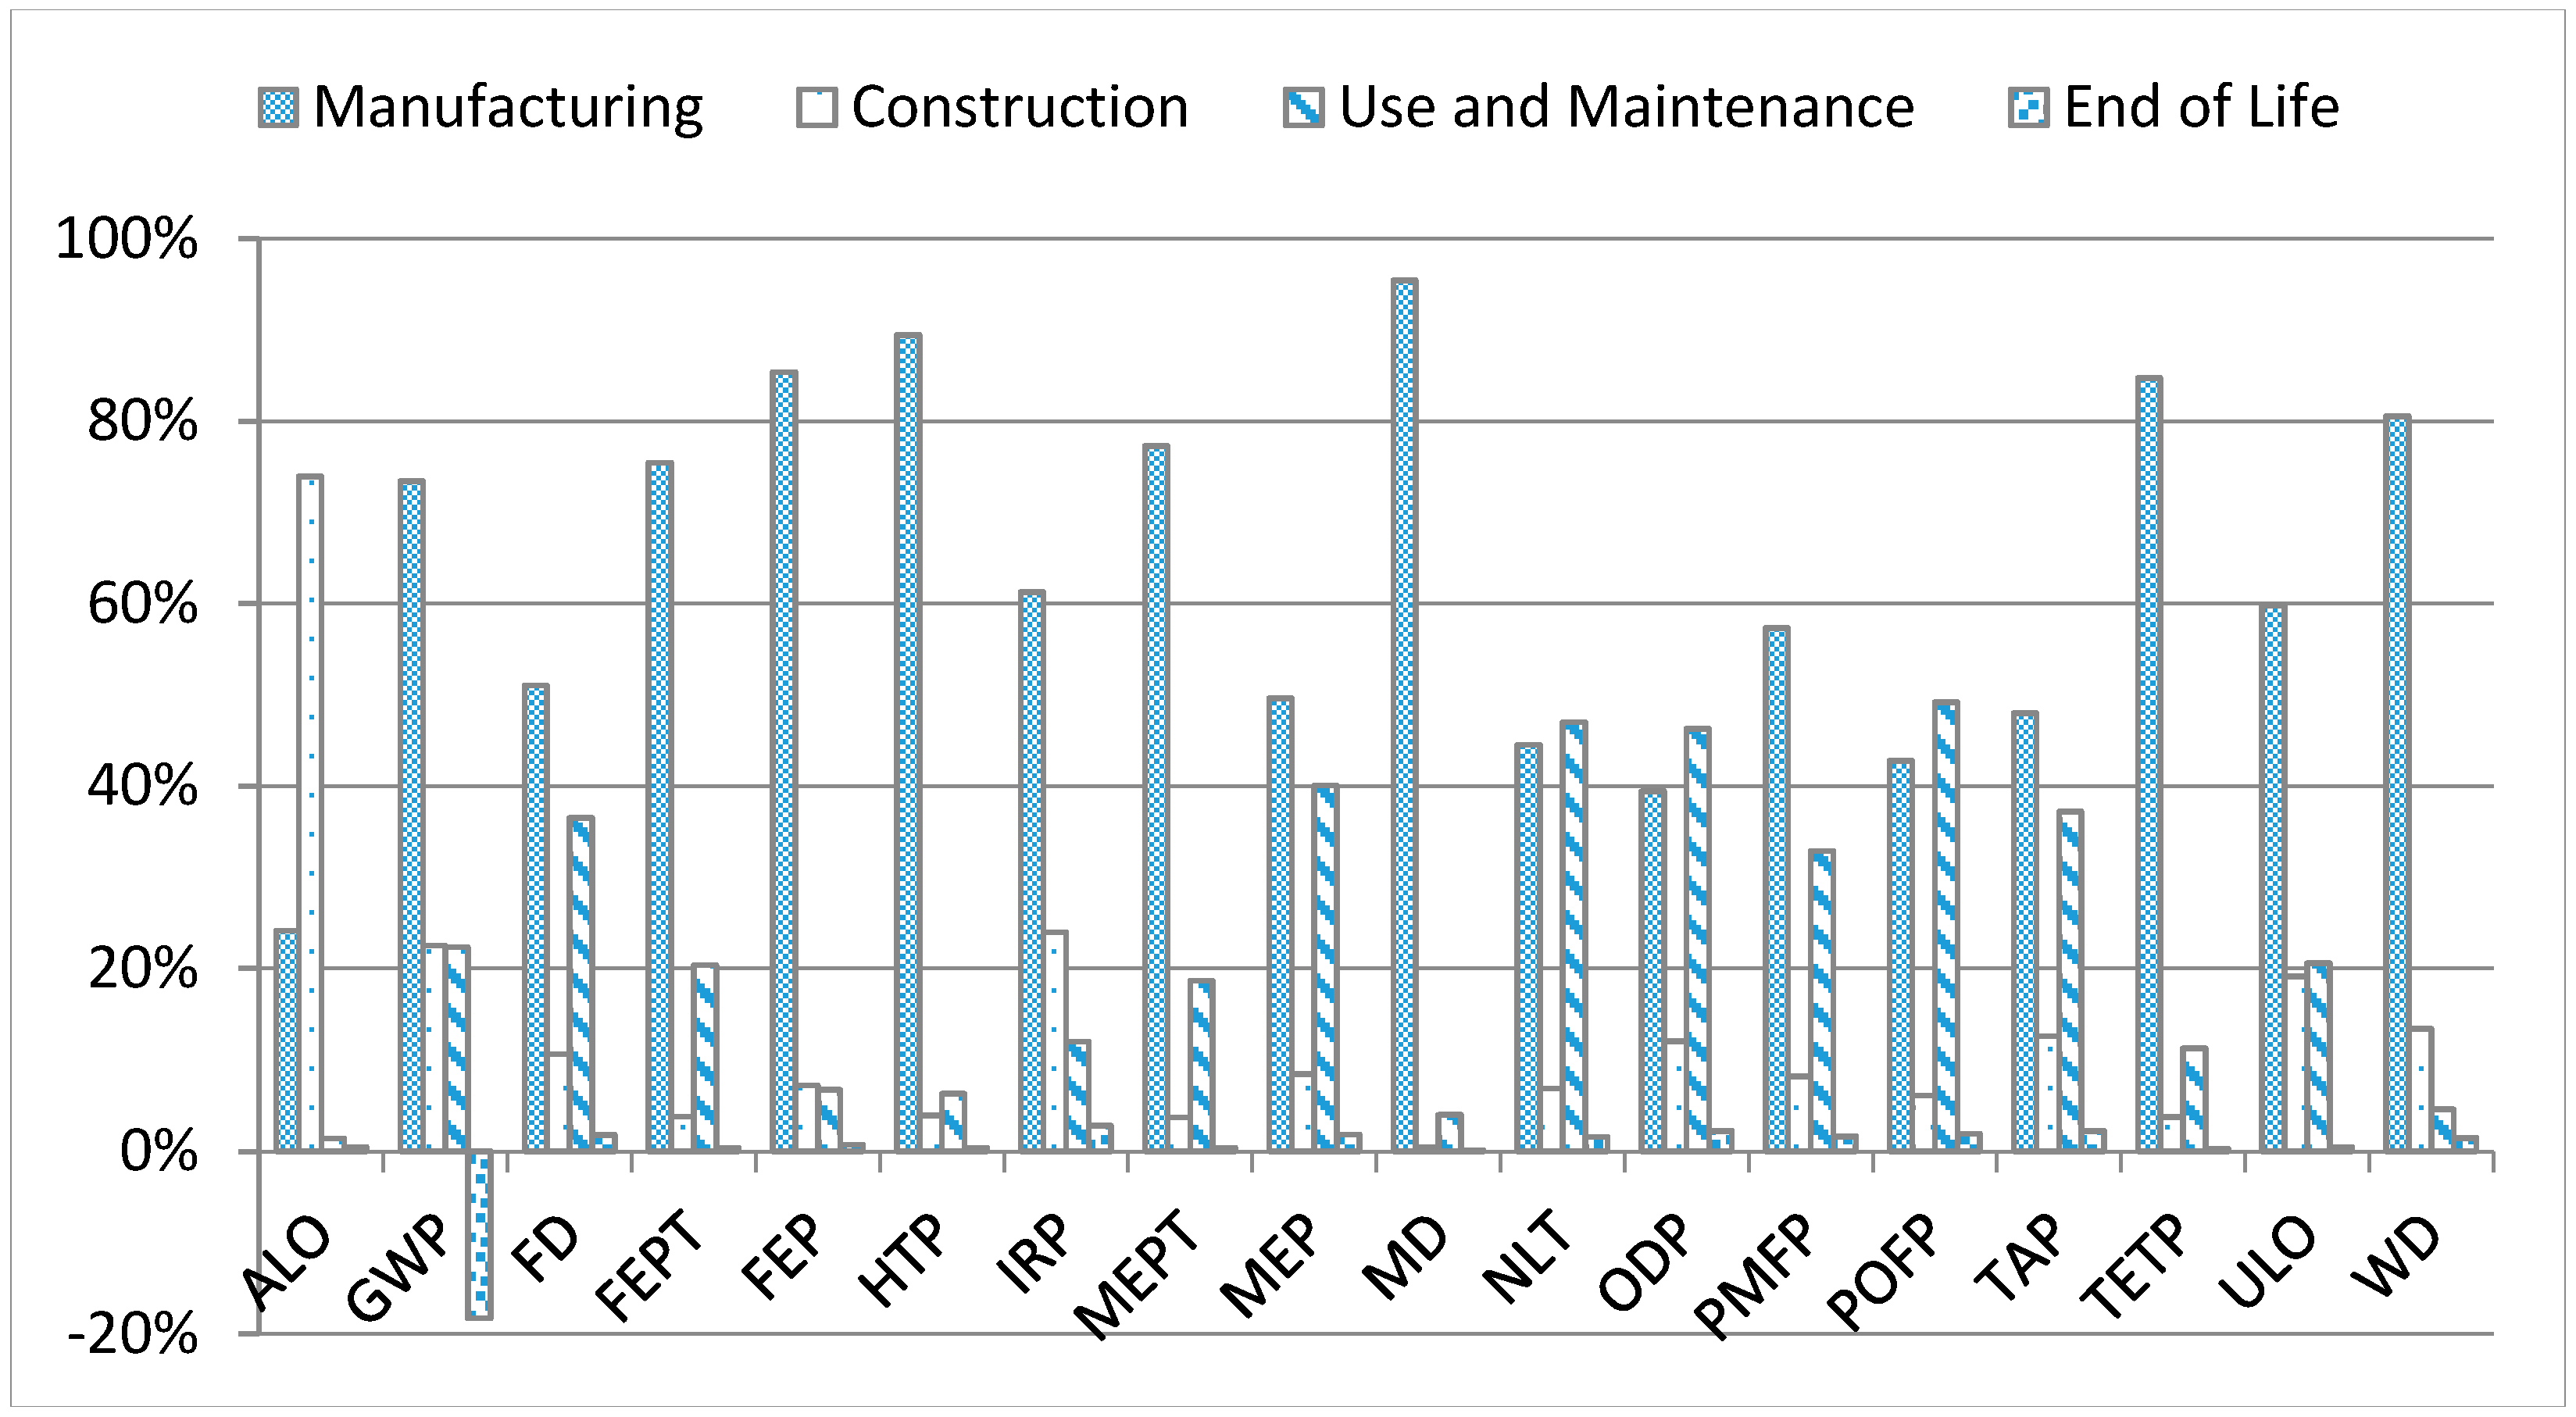
3.3. Results
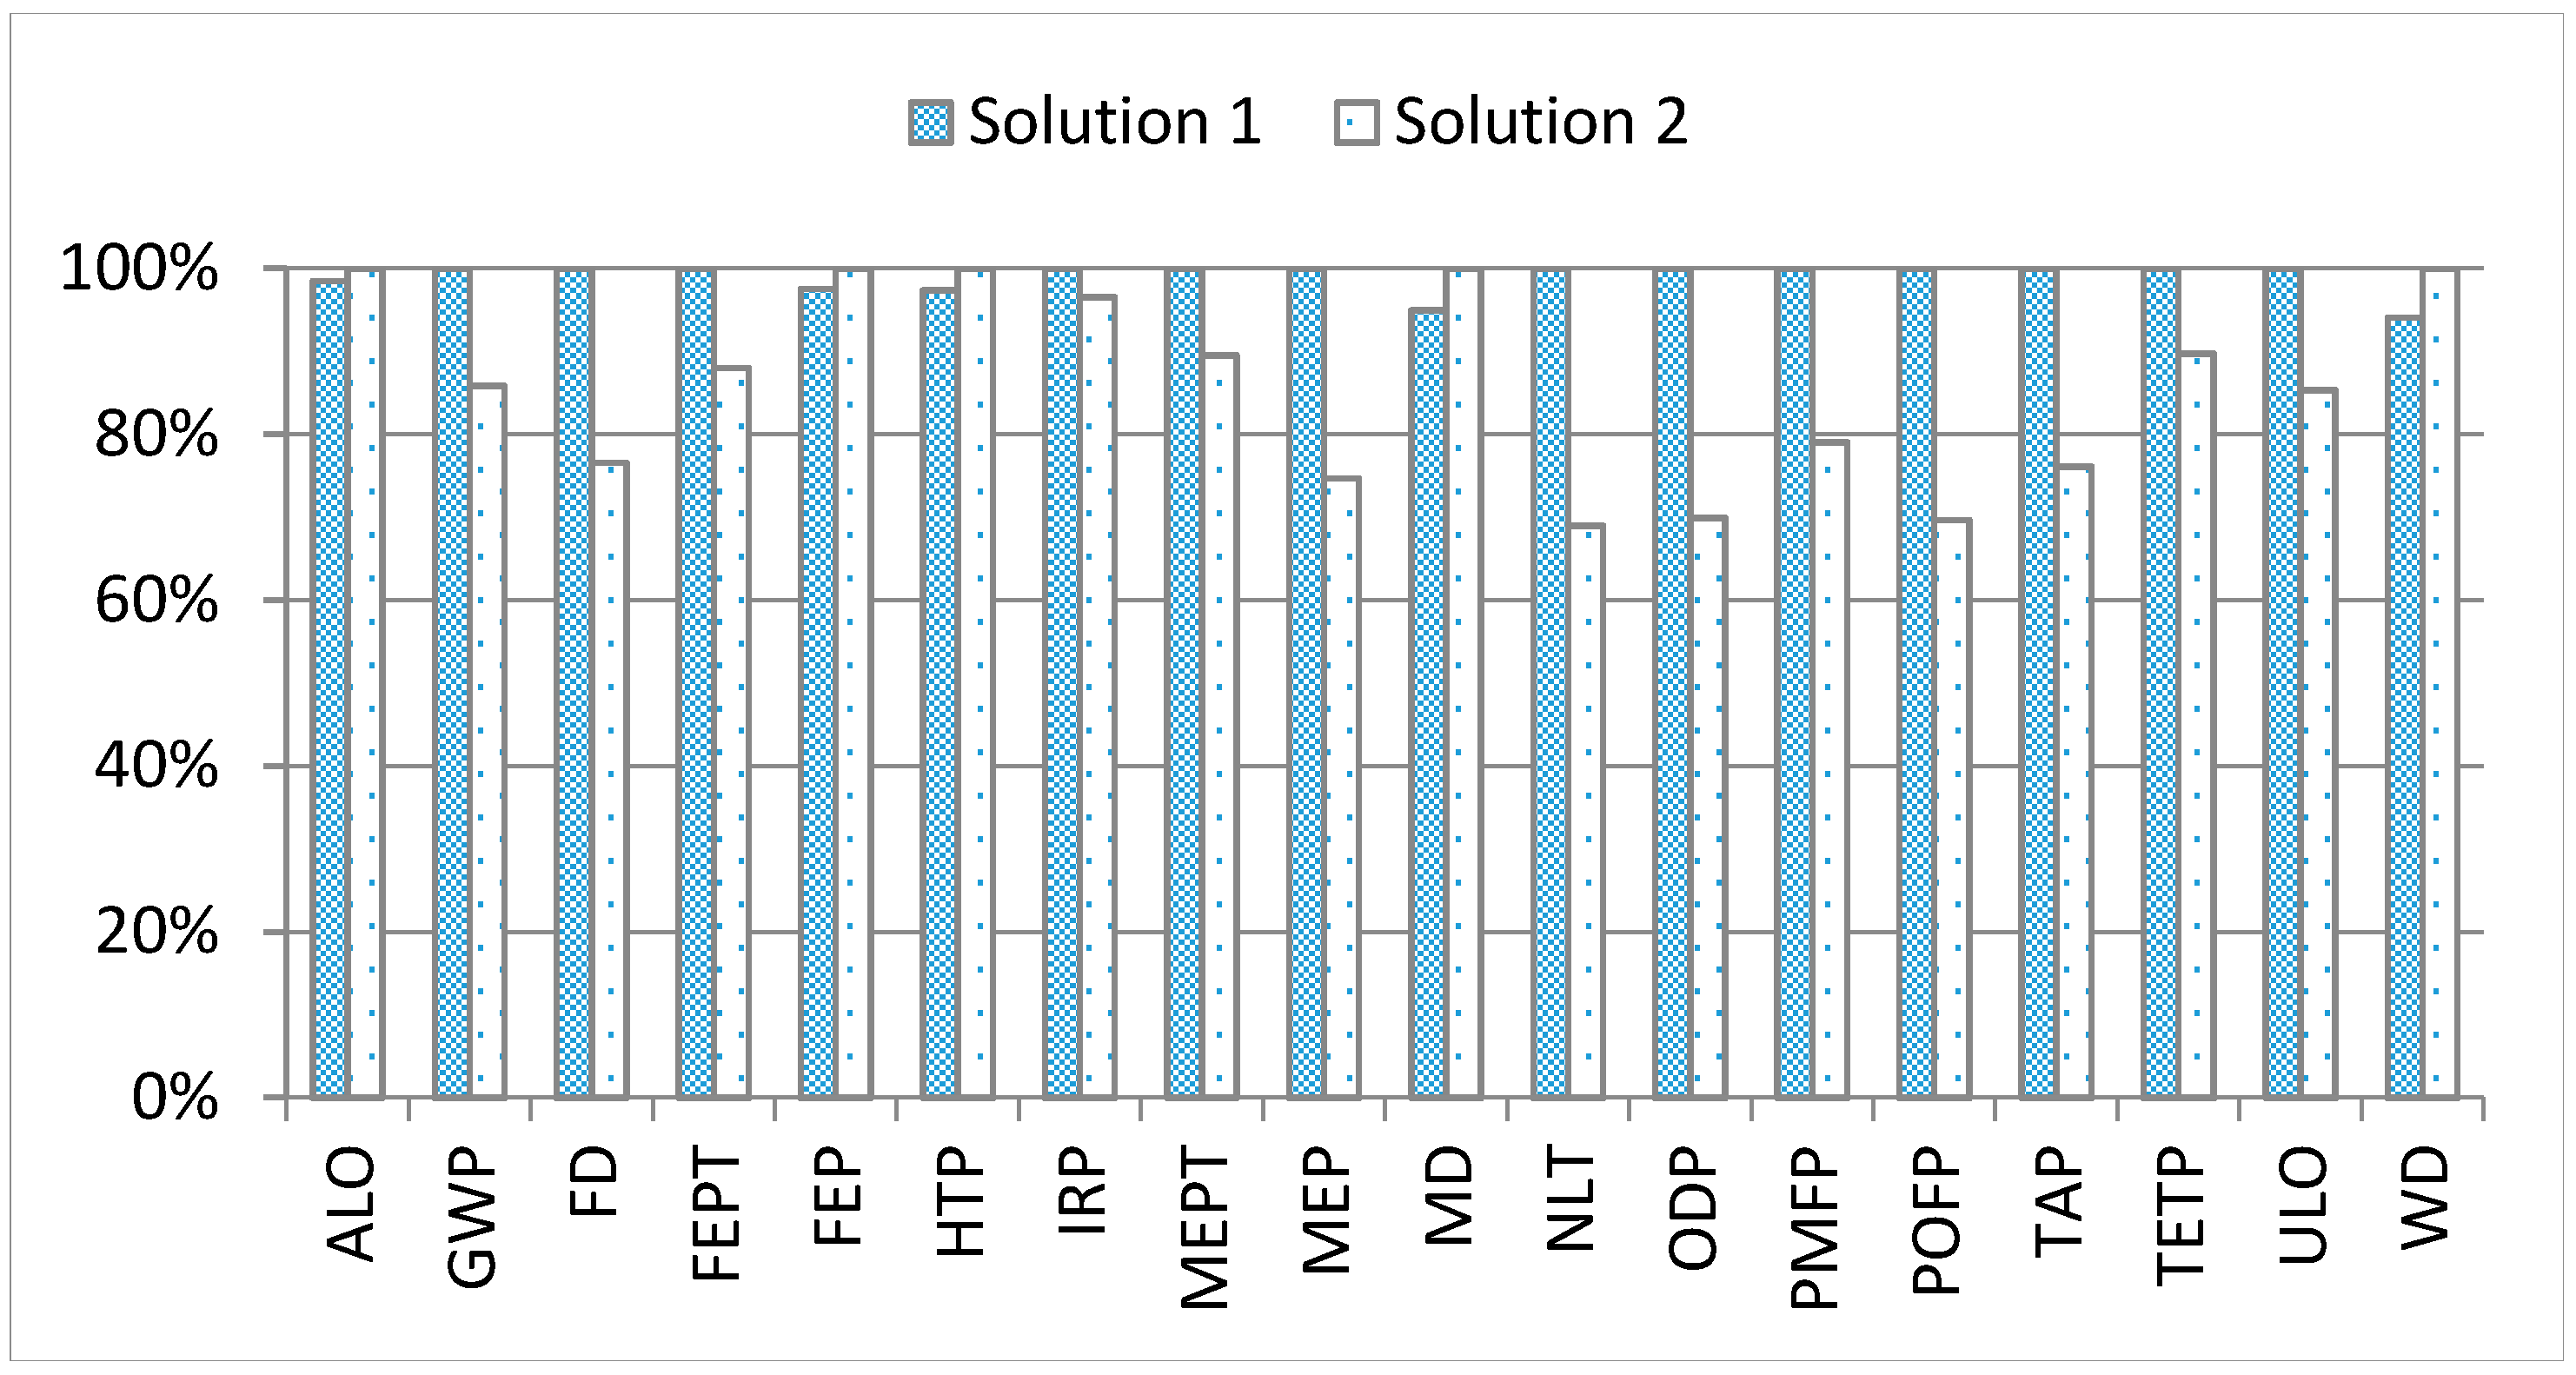
3.3.1. Midpoint Approach
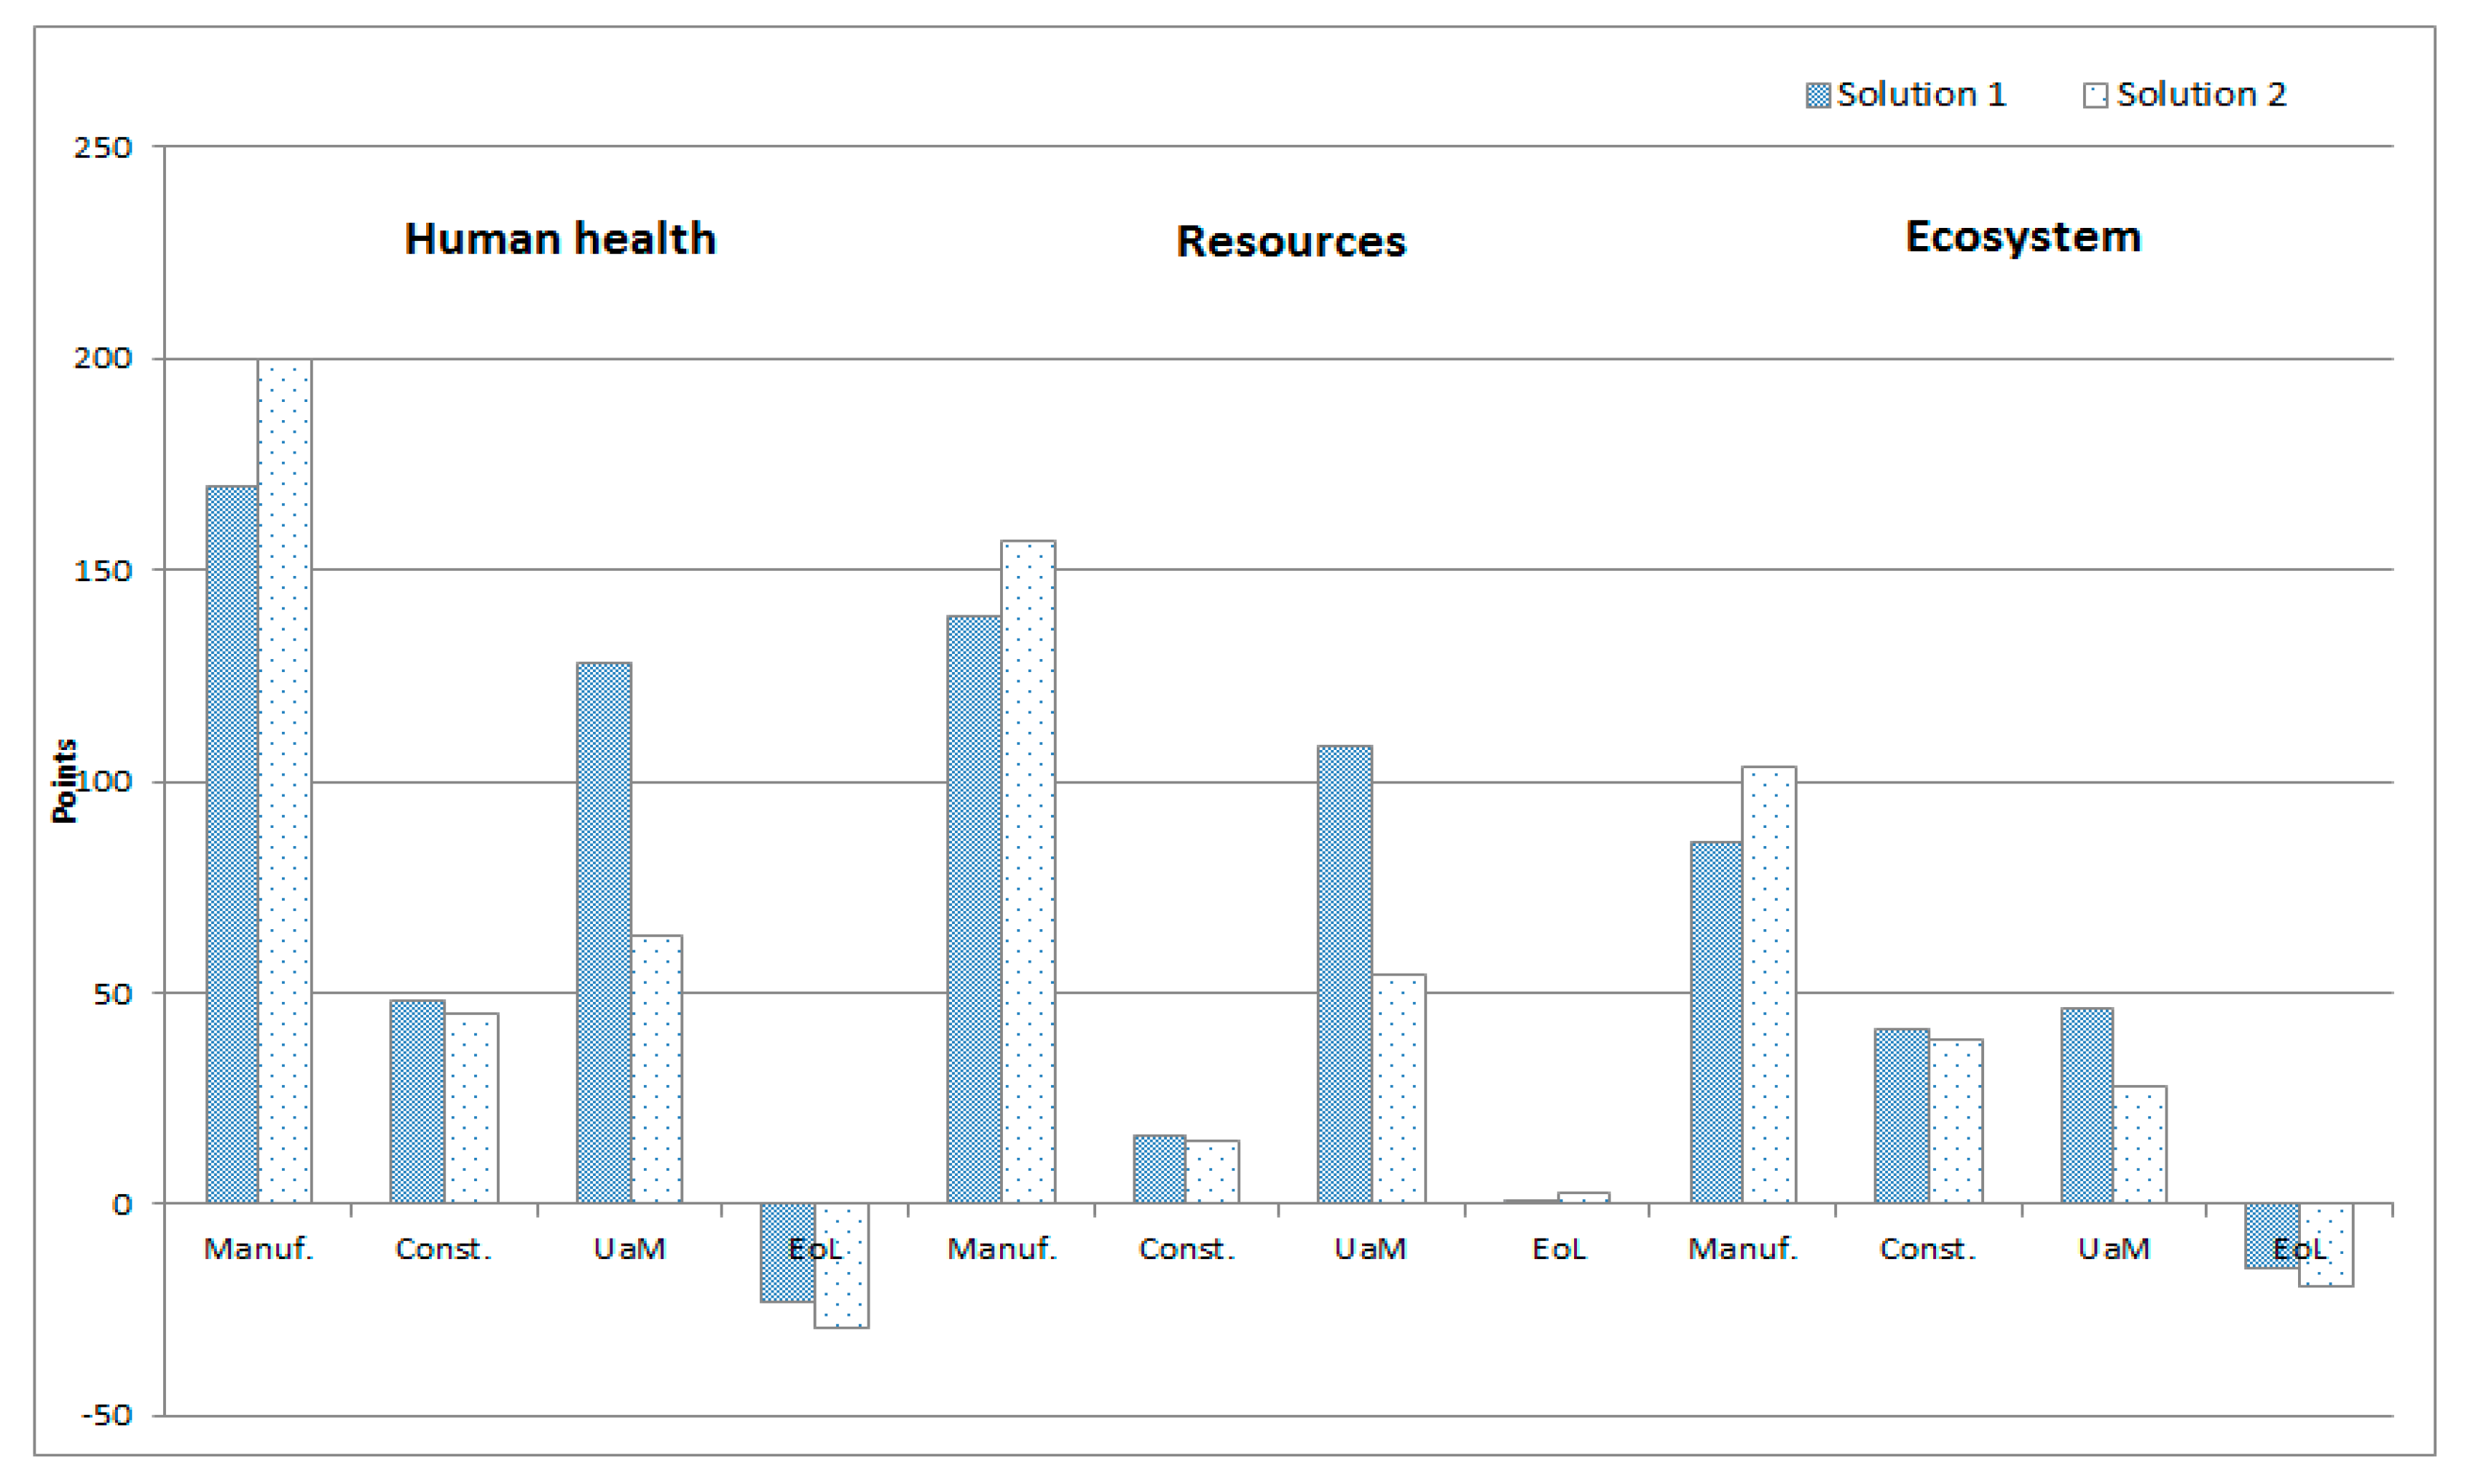
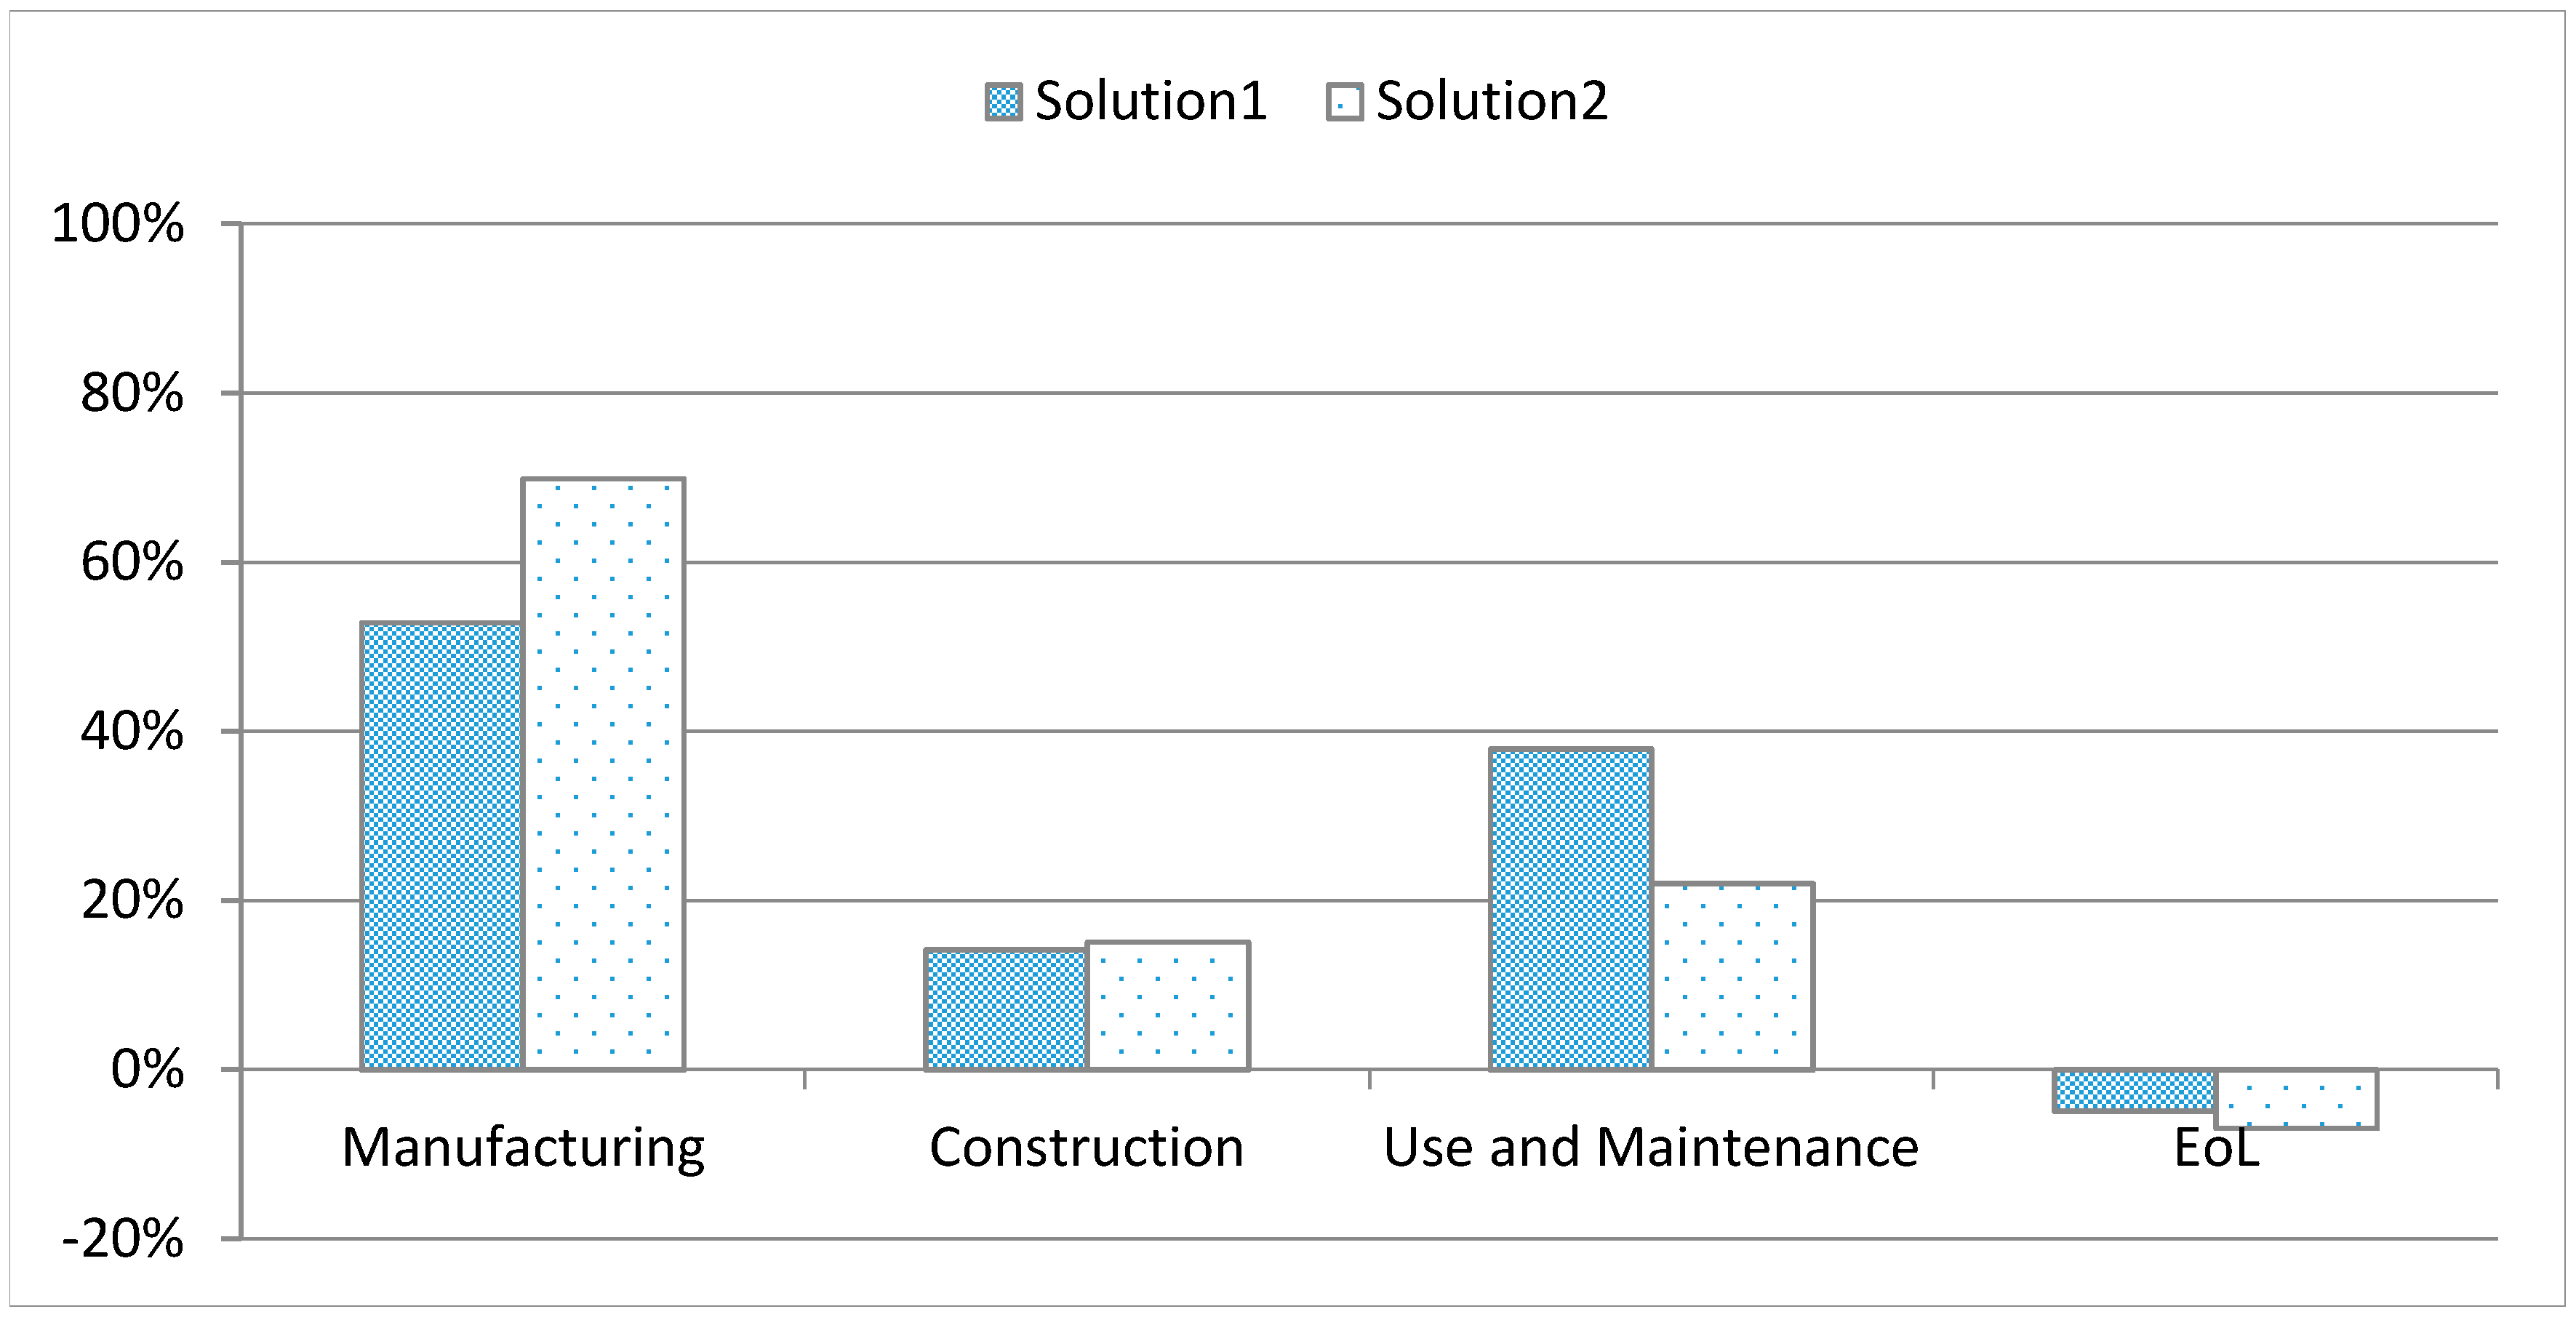
3.3.2. Endpoint Approach
4. Conclusions
Acknowledgments
Author Contributions
Conflicts of Interest
References
- United Nations. World Commission on Environment and Development Our Common Future; United Nations: New York, NY, USA, 1987. [Google Scholar]
- Penadés-Plà, V.; García-Segura, T.; Martí, J.; Yepes, V. A review of multi-criteria decision-making methods applied to the sustainable bridge design. Sustainability 2016, 8, 1295. [Google Scholar] [CrossRef]
- Jato-Espino, D.; Castillo-Lopez, E.; Rodriguez-Hernandez, J.; Canteras-Jordana, J.C. A review of application of multi-criteria decision making methods in construction. Autom. Constr. 2014, 45, 151–162. [Google Scholar] [CrossRef]
- Waas, T.; Hugé, J.; Block, T.; Wright, T.; Benitez-Capistros, F.; Verbruggen, A. Sustainability Assessment and Indicators: Tools in a Decision-Making Strategy for Sustainable Development. Sustainability 2014, 6, 5512–5534. [Google Scholar] [CrossRef]
- Intergovernmental Panel on Climate Change. Climate Change: Fifth Assessment Report; Intergovernmental Panel on Climate Change: Geneva, Switzerland, 2014. [Google Scholar]
- Ramesh, T.; Prakash, R.; Shukla, K.K. Life cycle energy analysis of buildings: An overview. Energy Build. 2010, 42, 1592–1600. [Google Scholar] [CrossRef]
- Petek Gursel, A.; Masanet, E.; Horvath, A.; Stadel, A. Life-cycle inventory analysis of concrete production: A critical review. Cem. Concr. Compos. 2014, 51, 38–48. [Google Scholar] [CrossRef]
- Taylor, M.; Tam, C.; Gielen, D. Energy Efficiency and CO2 Emissions from the Global Cement Industry; International Energy Agency: Paris, France, 2006; pp. 4–5. [Google Scholar]
- Tait, M.W.; Cheung, W.M. A comparative cradle-to-gate life cycle assessment of three concrete mix designs. Int. J. Life Cycle Assess. 2016, 21, 847–860. [Google Scholar] [CrossRef]
- Panesar, D.K.; Seto, K.E.; Churchill, C.J. Impact of the selection of functional unit on the life cycle assessment of green concrete. Int. J. Life Cycle Assess. 2017, 1–18. [Google Scholar] [CrossRef]
- Gursel, A.P.; Ostertag, C. Comparative life-cycle impact assessment of concrete manufacturing in Singapore. Int. J. Life Cycle Assess. 2017, 22, 237–255. [Google Scholar] [CrossRef]
- Laurent, A.; Olsen, S.I.; Hauschild, M.Z. Limitations of carbon footprint as indicator of environmental sustainability. Environ. Sci. Technol. 2012, 46, 4100–4108. [Google Scholar] [CrossRef] [PubMed]
- International Organization for Standardization (ISO). Environmental Managment—Life Cycle Assessment—Principles and Framework; ISO: Geneva, Switzerland, 2006. [Google Scholar]
- Horvath, A.; Hendrickson, C. Steel versus steel-reinforced concrete bridges: Environmental assessment. J. Infrastruct. Syst. 1998, 4, 111–117. [Google Scholar] [CrossRef]
- Widman, J. Environmental impact assessment of steel bridges. J. Constr. Steel Res. 1998, 46, 291–293. [Google Scholar] [CrossRef]
- Gervásio, H.; da Silva, L.S. Comparative life-cycle analysis of steel-concrete composite bridges. Struct. Infrastruct. Eng. 2008, 4, 251–269. [Google Scholar] [CrossRef]
- Stengel, T.; Schiessl, P. Life cycle assessment of UHPC bridge constructions: Sherbrooke Footbridge, Kassel Gärtnerplatz Footbridge and Wapello Road Bridge. Archit. Civ. Eng. Environ. 2009, 1, 109–118. [Google Scholar]
- Itoh, Y.; Kitagawa, T. Using CO2 emission quantities in bridge lifecycle analysis. Eng. Struct. 2003, 25, 565–577. [Google Scholar] [CrossRef]
- Bouhaya, L.; Roy, R.L.; Feraille-fresnet, A.D.; Roy, R.L.E. Simplified environmental study on innovative bridge structure. Environ. Sci. Technol. 2009, 43, 2066–2071. [Google Scholar] [CrossRef] [PubMed]
- Steele, K.N.P.; Cole, G.; Parke, G. The Application of Life Cycle Assessment Technique in the Investigation of Brick Arch Highway bridges. Available online: http://www.mbhplc.co.uk/bda/Sustain-Life-Cycle.pdf (accessed on 12 September 2017).
- Du, G.; Karoumi, R. Life cycle assessment of a railway bridge: Comparison of two superstructure designs. Struct. Infrastruct. Eng. 2012, 9, 1149–1160. [Google Scholar] [CrossRef]
- Du, G.; Safi, M.; Pettersson, L.; Karoumi, R. Life cycle assessment as a decision support tool for bridge procurement: environmental impact comparison among five bridge designs. Int. J. Life Cycle Assess. 2014, 19, 1948–1964. [Google Scholar] [CrossRef]
- Hammervold, J.; Reenaas, M.; Brattebø, H. Environmental life cycle assessment of bridges. J. Bridg. Eng. 2013, 18, 153–161. [Google Scholar] [CrossRef]
- Pang, B.; Yang, P.; Wang, Y.; Kendall, A.; Xie, H.; Zhang, Y. Life cycle environmental impact assessment of a bridge with different strengthening schemes. Int. J. Life Cycle Assess. 2015, 20, 1300–1311. [Google Scholar] [CrossRef]
- Steele, K.; Cole, G.; Parke, G.; Clarke, B.; Harding, J.; Harding, J. Highway bridges and environment-sustainable perspectives. Proc. Inst. Civ. Eng. 2003, 156, 176–182. [Google Scholar] [CrossRef]
- Ecoinvent Center Ecoinvent v3.3. 2016. Available online: http://www.ecoinvent.org/database/older-versions/ecoinvent-33/ecoinvent-33.html (accessed on 12 September 2017).
- Frischknecht, R.; Jungbluth, N.; Althaus, H.-J.; Doka, G.; Dones, R.; Heck, T.; Hellweg, S.; Hischier, R.; Nemecek, T.; Rebitzer, G.; et al. The ecoinvent database: Overview and methodological framework. Int. J. Life Cycle Assess. 2005, 10, 3–9. [Google Scholar] [CrossRef]
- Ciroth, A.; Muller, S.; Weidema, B.; Lesage, P. Empirically based uncertainty factors for the pedigree matrix in ecoinvent. Int. J. Life Cycle Assess. 2016, 21, 1339–1348. [Google Scholar] [CrossRef]
- Kellenberger, D.; Althaus, H.J.; Jungbluth, N.; Künniger, T. Life Cycle Inventories of Building Products; Swiss Centre for Life Cycle Inventories: Dübendorf, Switzterland, 2007. [Google Scholar]
- Marceau, M.L.; Nisbet, M.A.; VanGeem, M.G. Life Cycle Inventory of Portland Cement Concrete; Portland Cement Association: Skokie, IL, USA, 2007. [Google Scholar]
- García-Segura, T.; Yepes, V.; Alcalá, J. Life cycle greenhouse gas emissions of blended cement concrete including carbonation and durability. Int. J. Life Cycle Assess. 2014, 19, 3–12. [Google Scholar] [CrossRef]
- Zastrow, P.; Molina-Moreno, F.; García-Segura, T.; Martí, J.V.; Yepes, V. Life cycle assessment of cost-optimized buttress earth-retaining walls: A parametric study. J. Clean. Prod. 2017, 140, 1037–1048. [Google Scholar] [CrossRef]
- Dodoo, A.; Gustavsson, L.; Sathre, R. Carbon implications of end-of-life management of building materials. Resour. Conserv. Recycl. 2009, 53, 276–286. [Google Scholar] [CrossRef]
- Collins, F. Inclusion of carbonation during the life cycle of built and recycled concrete: Influence on their carbon footprint. Int. J. Life Cycle Assess. 2010, 15, 549–556. [Google Scholar] [CrossRef]
- García-Segura, T.; Yepes, V. Multiobjective optimization of post-tensioned concrete box-girder road bridges considering cost, CO2 emissions, and safety. Eng. Struct. 2016, 125, 325–336. [Google Scholar] [CrossRef]
- García-Segura, T.; Yepes, V.; Alcalá, J.; Pérez-López, E. Hybrid harmony search for sustainable design of post-tensioned concrete box-girder pedestrian bridges. Eng. Struct. 2015, 92, 112–122. [Google Scholar] [CrossRef]
- Lagerblad, B. Carbon Dioxide Uptake during Concrete Life Cycle—State of the Art; Cement och Betong Institutet: Stockholm, Sweeden, 2005. [Google Scholar]
- Hettinger, A.; Birat, J.; Hechler, O.; Braun, M. Sustainable bridges—LCA for a composite and a concrete bridge. In Economical Bridge Solutions based on Innovative Composite Dowels and Integrated Abutments; Petzek, E., Bancila, R., Eds.; Springer Fachmedien Wiesbaden: Wiesbaden, Germany, 2015; pp. 45–54. [Google Scholar]
- World Steel Association Steel and Energy Fact Sheet. 2008. Available online: http://www.worldsteel.org (accessed on 12 September 2017).
- European Commission. European Reference Life-Cycle Database; European Commission: Brussels, Belgium, 2012. [Google Scholar]
- Yi, S.; Kurisu, K.H.; Hanaki, K.; Hanaki, K. Life cycle impact assessment and interpretation of municipal solid waste management scenarios based on the midpoint and endpoint approaches. Int. J. Life Cycle Assess. 2011, 16, 652–668. [Google Scholar] [CrossRef]
- Goedkoop, M.; Heijungs, R.; Huijbregts, M.; Schryver, A.D.; Struijs, J.; van Zelm, R. ReCiPe 2008—A Life Cycle Impact Assessment Which Comprises Harmonised Category Indicators at Midpoint and at the Endpoint Level. 2009. Available online: https://www.researchgate.net/profile/Mark_Goedkoop/publication/230770853_Recipe_2008/links/09e4150dc068ff22e9000000.pdf (accessed on 16 October 2017).
- Dong, Y.H.; Ng, S.T. Comparing the midpoint and endpoint approaches based on ReCiPe—A study of commercial buildings in Hong Kong. Int. J. Life Cycle Assess. 2014, 19, 1409–1423. [Google Scholar] [CrossRef]
- García-Segura, T.; Yepes, V.; Frangopol, D.M. Multi-objective design of post-tensioned concrete road bridges using artificial neural networks. Struct. Multidiscip. Optim. 2017, 56, 139–150. [Google Scholar] [CrossRef]
- García-Segura, T.; Yepes, V.; Frangopol, D.M.; Yang, D.Y. Lifetime reliability-based optimization of post-tensioned box-girder bridges. Eng. Struct. 2017, 145, 381–391. [Google Scholar] [CrossRef]
- European Committee. European Committee for Standardization EN 206-1 Concrete—Part 1: Specification, Performance, Production and Conformity; European Commission: Brussels, Belgium, 2000. [Google Scholar]
- Catalonia Institute of Construction Technology BEDEC PR/PCT ITEC Material Database. 2016. Available online: https://www.itec.cat/nouBedec.c/bedec.aspx (accessed on 12 September 2017).


| Solution 1 | Solution 2 | |
|---|---|---|
| Strength (MPa) | 35 | 50 |
| Passive steel (kg/m2) | 66.89 | 74.67 |
| Active steel (kg/m2) | 21.98 | 19.8 |
| Concrete (m3/m2) | 0.674 | 0.67 |
| Cement (kg/m3) | 300 | 400 |
| Gravel (kg/m3) | 848 | 726 |
| Sand (kg/m3) | 1088 | 1136 |
| Water (kg/m3) | 160 | 160 |
| Superplasticizer (kg/m3) | 4 | 7 |
| Acronym | Reference Unit | Manufacturing | Construction | Use and Maintenance | EoL | ||||
|---|---|---|---|---|---|---|---|---|---|
| m | cv (%) | m | cv (%) | m | cv (%) | m | cv (%) | ||
| ALO | m2 × year | 155.34 | 4.13 | 576.41 | 33.43 | 22.23 | 24.51 | 3.84 | 4.89 |
| GWP | kg CO2 eq | 3589.85 | 18.93 | 1453.67 | 3.17 | 2770.57 | 12.17 | −807.73 | −5.62 |
| FD | kg oil eq | 577.04 | 6.44 | 148.42 | 6.38 | 964.35 | 11.68 | 24.10 | 16.00 |
| FEPT | kg 1,4-DB eq | 70.02 | 2.79 | 4.15 | 7.78 | 42.92 | 33.56 | 0.41 | 6.57 |
| FEP | kg P eq | 1.51 | 4.50 | 0.15 | 7.07 | 0.27 | 24.77 | 0.01 | 5.51 |
| HTP | kg 1,4-DB eq | 2687.18 | 2.90 | 137.99 | 9.51 | 429.79 | 26.39 | 12.75 | 6.40 |
| IRP | kg U235 eq | 414.10 | 15.96 | 208.40 | 4.13 | 195.61 | 12.26 | 22.61 | 5.49 |
| MEPT | kg 1,4-DB eq | 69.40 | 2.75 | 3.90 | 8.05 | 38.01 | 33.13 | 0.38 | 6.67 |
| MEP | kg N eq | 0.54 | 9.87 | 0.11 | 8.46 | 1.02 | 5.62 | 0.02 | 21.83 |
| MD | kg Fe eq | 1685.92 | 2.50 | 10.20 | 14.13 | 157.81 | 21.68 | 1.67 | 22.48 |
| NLT | m2 | 0.45 | 7.85 | 0.08 | 9.32 | 1.02 | 11.04 | 0.02 | 23.64 |
| ODP | kg CFC-11 eq | 0.00 | 7.15 | 0.00 | 5.59 | 0.00 | 10.90 | 0.00 | 17.09 |
| PMFP | kg PM10 eq | 7.08 | 6.05 | 1.22 | 8.16 | 9.27 | 6.57 | 0.23 | 19.84 |
| POFP | kg NMVOC | 10.73 | 9.88 | 1.88 | 8.79 | 28.76 | 4.94 | 0.57 | 26.35 |
| TAP | kg SO2 eq | 9.93 | 9.88 | 3.23 | 6.15 | 17.96 | 6.56 | 0.54 | 16.41 |
| TETP | kg 1,4-DB eq | 0.84 | 2.62 | 0.04 | 21.79 | 0.23 | 21.41 | 0.00 | 15.19 |
| ULO | m2 × year | 41.60 | 6.68 | 14.72 | 28.80 | 31.52 | 28.10 | 0.37 | 7.79 |
| WD | m3 | 15,361.74 | 10.46 | 3197.70 | 4.60 | 2077.07 | 22.44 | 323.72 | 4.92 |
| Acronym | Reference Unit | Manufacturing | Construction | Use and Maintenance | EoL | ||||
|---|---|---|---|---|---|---|---|---|---|
| m | cv (%) | m | cv (%) | m | cv (%) | m | cv (%) | ||
| ALO | m2 × year | 186.01 | 4.07 | 568.93 | 33.85 | 10.97 | 22.96 | 3.84 | 4.84 |
| GWP | kg CO2 eq | 4413.77 | 21.13 | 1353.95 | 3.16 | 1345.10 | 11.51 | −1099.20 | −5.09 |
| FD | kg oil eq | 669.39 | 7.56 | 139.37 | 6.70 | 479.48 | 10.78 | 23.99 | 15.79 |
| FEPT | kg 1,4-DB eq | 78.01 | 3.19 | 3.91 | 8.21 | 21.08 | 31.55 | 0.41 | 6.62 |
| FEP | kg P eq | 1.71 | 5.27 | 0.14 | 7.45 | 0.13 | 23.15 | 0.01 | 5.55 |
| HTP | kg 1,4-DB eq | 3001.31 | 3.20 | 130.42 | 10.04 | 211.78 | 24.77 | 12.75 | 6.44 |
| IRP | kg U235 eq | 497.18 | 18.30 | 194.46 | 4.14 | 97.21 | 11.34 | 22.61 | 5.53 |
| MEPT | kg 1,4-DB eq | 77.27 | 3.13 | 3.67 | 8.50 | 18.67 | 31.15 | 0.38 | 6.71 |
| MEP | kg N eq | 0.63 | 11.64 | 0.11 | 8.93 | 0.51 | 5.18 | 0.02 | 21.47 |
| MD | kg Fe eq | 1864.44 | 2.73 | 9.73 | 14.84 | 78.03 | 20.20 | 1.66 | 22.11 |
| NLT | m2 | 0.48 | 7.64 | 0.07 | 9.84 | 0.51 | 10.19 | 0.02 | 23.25 |
| ODP | kg CFC-11 eq | 0.00 | 8.54 | 0.00 | 5.82 | 0.00 | 10.06 | 0.00 | 16.85 |
| PMFP | kg PM10 eq | 8.06 | 7.22 | 1.15 | 8.62 | 4.62 | 6.04 | 0.23 | 19.53 |
| POFP | kg NMVOC | 12.49 | 11.64 | 1.77 | 9.29 | 14.36 | 4.58 | 0.57 | 25.91 |
| TAP | kg SO2 eq | 11.56 | 11.58 | 3.04 | 6.45 | 8.96 | 6.03 | 0.54 | 16.19 |
| TETP | kg 1,4-DB eq | 0.84 | 2.52 | 0.04 | 22.55 | 0.11 | 20.36 | 0.00 | 15.00 |
| ULO | m2 × year | 44.99 | 6.54 | 14.41 | 29.41 | 15.48 | 26.67 | 0.37 | 7.81 |
| WD | m3 | 17,948.35 | 12.29 | 2988.85 | 4.70 | 1026.25 | 20.95 | 324.08 | 4.89 |
© 2017 by the authors. Licensee MDPI, Basel, Switzerland. This article is an open access article distributed under the terms and conditions of the Creative Commons Attribution (CC BY) license (http://creativecommons.org/licenses/by/4.0/).
Share and Cite
Penadés-Plà, V.; Martí, J.V.; García-Segura, T.; Yepes, V. Life-Cycle Assessment: A Comparison between Two Optimal Post-Tensioned Concrete Box-Girder Road Bridges. Sustainability 2017, 9, 1864. https://doi.org/10.3390/su9101864
Penadés-Plà V, Martí JV, García-Segura T, Yepes V. Life-Cycle Assessment: A Comparison between Two Optimal Post-Tensioned Concrete Box-Girder Road Bridges. Sustainability. 2017; 9(10):1864. https://doi.org/10.3390/su9101864
Chicago/Turabian StylePenadés-Plà, Vicent, José V. Martí, Tatiana García-Segura, and Víctor Yepes. 2017. "Life-Cycle Assessment: A Comparison between Two Optimal Post-Tensioned Concrete Box-Girder Road Bridges" Sustainability 9, no. 10: 1864. https://doi.org/10.3390/su9101864
APA StylePenadés-Plà, V., Martí, J. V., García-Segura, T., & Yepes, V. (2017). Life-Cycle Assessment: A Comparison between Two Optimal Post-Tensioned Concrete Box-Girder Road Bridges. Sustainability, 9(10), 1864. https://doi.org/10.3390/su9101864