1. Introduction
With social progress and the arrival of the leisure era, people set about pursuing cultural and psychological contentment [
1] for a better quality of life. This indicates the imperative transition of urban governance (i.e., attaching more significance on people-oriented aspect) concerning both China as well as other regions of the world. In terms of a flourishing leisure industry, leisure activities could satisfy these rising needs for citizens [
2,
3]. In addition, the capacity of leisure venues symbolizes the state of the art for regional development, namely, represents the level of socio-civilization and suggests economic, humanistic and cultural vitality. The boom of leisure industry is promising to bring out big benefits for increasing urban dweller’s well-being and happiness [
4,
5], rising inhabitants’ quality of life [
6], enhancing urban cohesion [
7], uplifting urban vitality [
8] and promoting social justice through facilitating positive social changes [
9,
10,
11].
Given that urban leisure venues proffer spatial carriers for citizens’ leisure activities, leisure is actually a spatial science. Many insightful leisure studies have been done (e.g., on leisure time [
12], leisure justice [
13,
14] or leisure activities [
15,
16]), however they are normally quantitative researches based on socio-economic statistics data, the spatial aspect is not concerned. Though spatial analysis techniques are commonly applied to a wide range of fields (including land resources and wealth [
17], supermarkets and food outlets [
18,
19,
20], hospitals [
21], etc.), few scholars get to spatially analyze leisure activities (e.g., karaoke [
22], clubs [
23], tourism [
24,
25,
26,
27,
28,
29,
30], green land [
31,
32,
33], etc.), the spatiality of leisure issues is still not given sufficient attention. This results in ignoring potential spatial solutions for urban (leisure) issues. This would hinder leisure industry management and relevant policy-making in the light of ignoring to characterize spatiality of leisure activities. In this sense, healthy leisure life on a basis of corresponding urban design gets to become the target of city residents and policy makers.
The rapid advance in urban geospatial big/open data (i.e., POIs, social media data, people flow data, etc.) provides us with big opportunities for integrating spatial perspective in leisure studies for facilitating urban spatial development planning mature based on geographical analysis techniques. The increasing attention has been aroused of employing these data for a wide range of urban issues from spatial perspective, involving urban vitality, urban regeneration, social equity and justice, social cohesion and so on. In fact, urban form and urban functions can be visualized in the new data environment, namely, geospatial big/open data in the context of information and communications technology (ICT) development [
34]. Visualizing spatial distribution through geospatial data lays a solid foundation for other succeeding spatial analysis. This promisingly contributes to people-oriented policy-making integrating spatial components.
Leisure research in China is in the initial stage. Despite of rapid urbanization, China is undergoing the process of ‘New Type Urbanization’. That is, urbanization is shifting from ‘quantity-oriented mode’ with a focus on the construction scale to ‘quality-oriented mode’ with a focal of upgrading intra-city functions and valuing people-oriented principle in China [
35]. Leisure industry is manifesting its impact on urban transformation through uplifting citizens’ quality of life [
36], health and well-being [
37,
38,
39,
40], and social cohesion [
37]. This corresponds to people-oriented ‘New Type Urbanization’ strategies [
41]. Cities are normally enriched in leisure resources. Thus, we aim to demonstrate systematic spatiality of all leisure venues within cities. In this study, the metropolis of Wuhan, Central China is selected to exemplify its leisure venue spatial distribution pattern, as well as the underlying dominating factors through in-depth spatial analysis techniques.
2. Methodology
2.1. Case Study
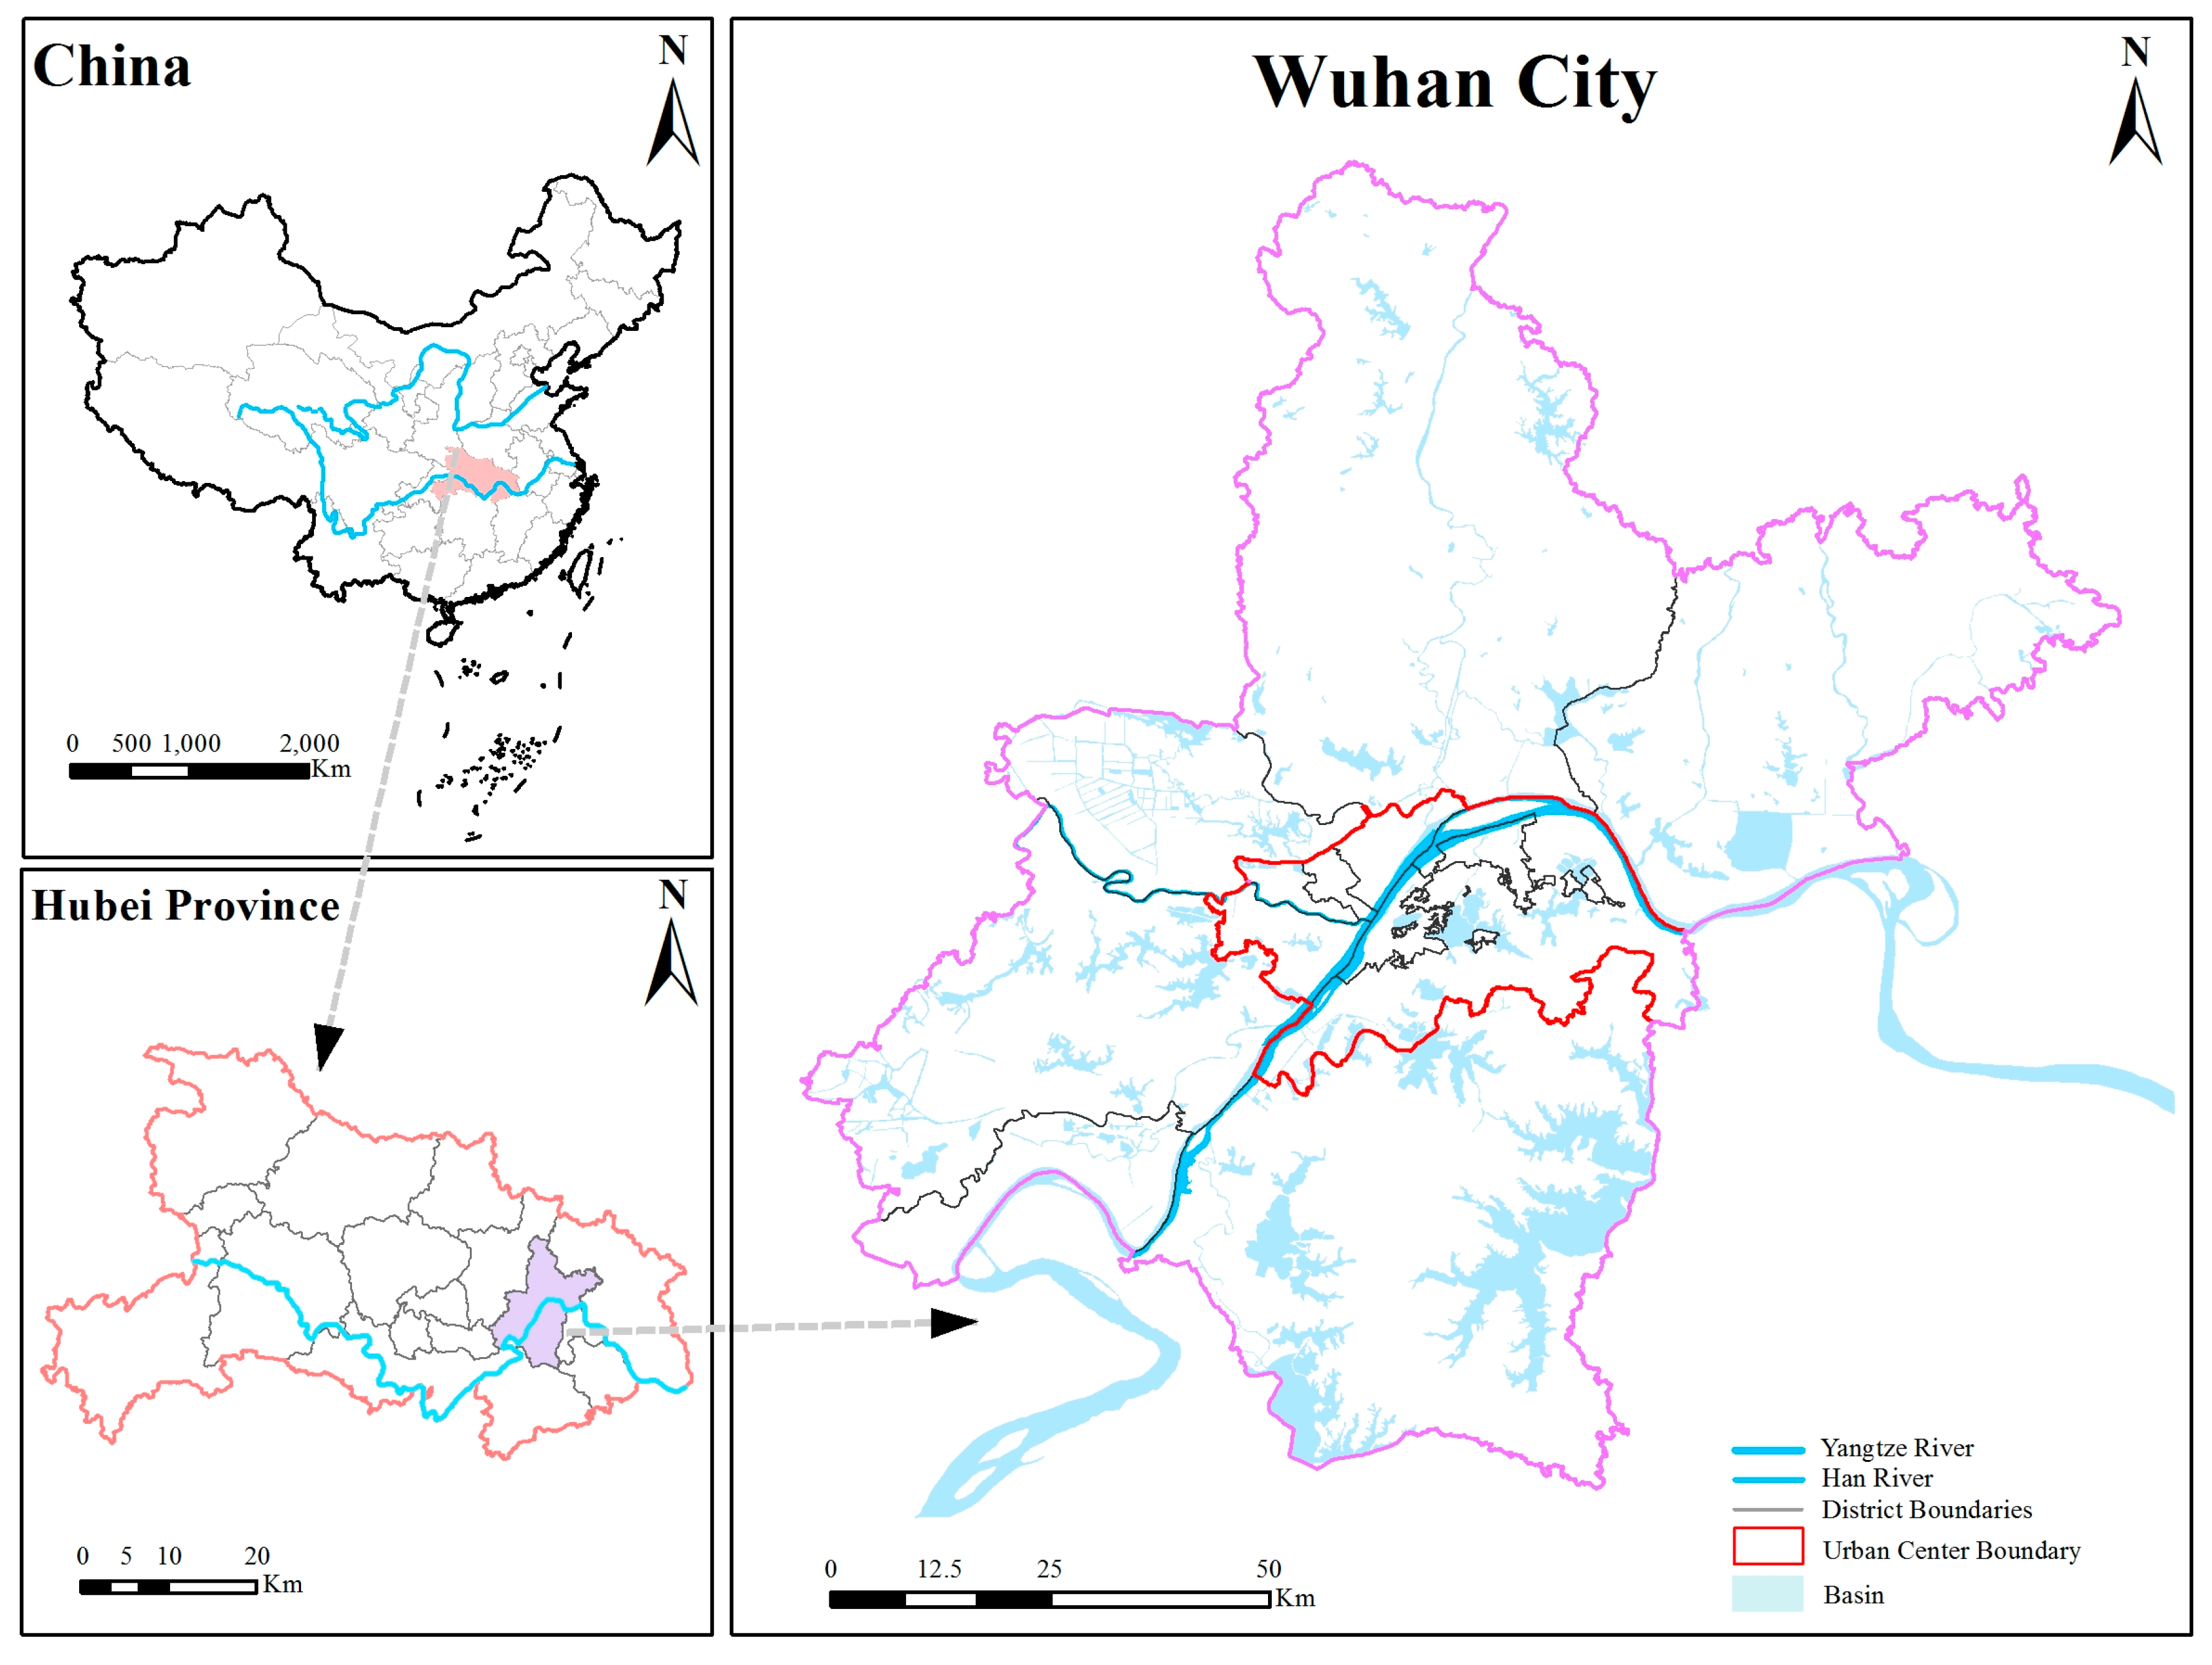
Wuhan, the capital of Hubei Province, lies in the middle reaches of the Yangtze River of Central China and is located in the northeast of Jianghan Plain between 113°41′–115°05′E and 29°58′–31°22′N. Wuhan plays a strategically pivotal role locating in Central China along one of the biggest economic zones—the Yangtze River Economic Zone, with around 10.02 million permanent inhabitants. Besides, Wuhan acts as the traffic hub of nine provinces due to its geographical location and advanced transportation networks. There are 13 districts in the city of Wuhan with a total area of 8494 km
2, seven of which make up central urban area with a total area of 678 km
2 and the other six districts are suburban areas. Wuhan is also named ‘Three Townships of Wuhan’. This actually refers to the central urban area of Wuhan, consisting of three townships—Hankou Township (i.e., Jiang’an district, Jianghan district and Qiaokou district), Great Wuchang Township (i.e., Hongshan district, Wuchang district and Qingshan district) and Great Hanyang Township (i.e., Hanyang district) around the confluence of the Yangtze River and the Han River. As a typical polycentric city, each township has its own specialty: Great Hankou Township functions as the economic and financial center; Great Wuchang Township plays the role of political, educational and cultural center; and Great Hanyang Township is the industrial center. In
Figure 1, the extent of central urban area within the red line (seven districts) and its suburban areas (6 districts) within the purple line are included with a planning area over 3000 km
2, according to the
General Urban Plan of Wuhan City (2010–2020).
2.2. Data
This research mainly involves two types of data sources—geospatial data and statistical data. For geospatial data, we apply the following data: (1) the boundary of the study area, boundaries of districts (administrative division of a city), the boundary of urban central area, geographical features (e.g., the Yangtze River, the Han River, the East Lake, etc.) have been obtained from the First National General Survey of Geographical Conditions during 2013–2015; (2) POIs of leisure venues (illustrated in
Table 1) from Baidu Map (similar to Google map) in 2017. For statistical data, population statistic data is acquired from the Six Demographic Census (2010). Furthermore, preliminary data pre-processing has been done. This process refers to leisure venues POIs selection, duplicated data removing and density calculation.
In this study, we view leisure venues as whole, and define them as four categories—tourism, culture, sports and recreation. Based on data pre-processing, we select 86,520 leisure venues from all POIs of Wuhan.
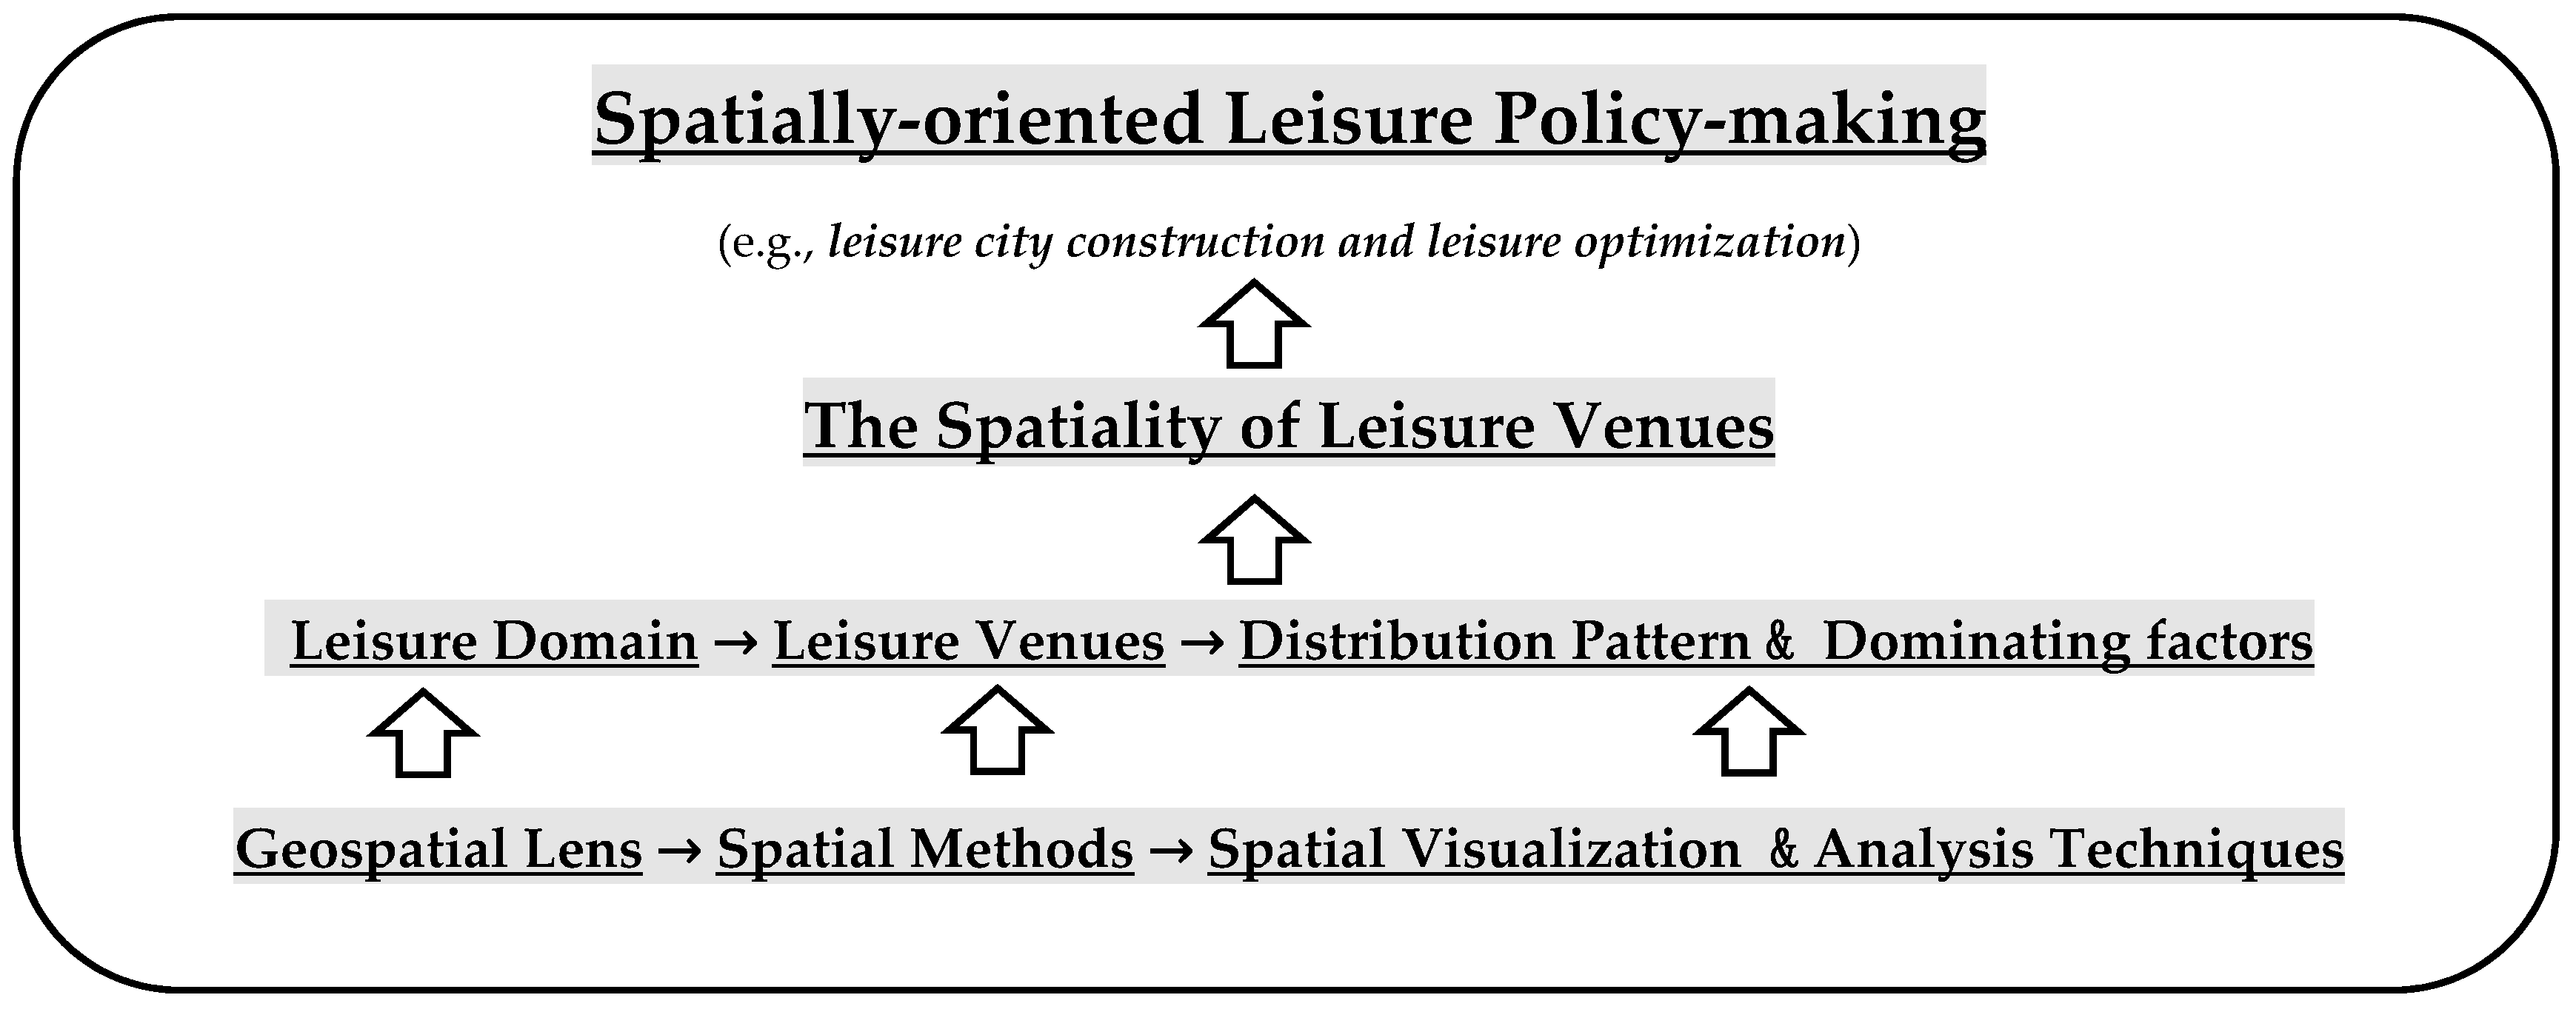
The theoretical framework of this study is to explore leisure domain (with a specific focus on leisure venues) with an initial start on the distribution pattern and dominating factors, from geospatial lens (by spatial visualization and analysis methods), for better understanding the spatiality of leisure venues and facilitating spatially-oriented leisure policy-making, shown in
Figure 2.
2.3. Methods
In this research, a series of spatial statistics and analysis techniques are implemented. As one fundamental notion of spatial analysis, point pattern analysis is utilized in this study. It evaluates the pattern, or the distribution, of a set of points on a surface [
42]. There are three general patterns: random, uniform and clustered. Cluster analysis seeks to aggregate objects into partitions for forming clusters [
43]. Within one cluster, points relate each other more than those in other clusters [
44]. Hierarchical clustering is a method of cluster analysis, attempting to create a hierarchy of clusters by grouping points into their specific clusters according to their distances [
45]. Specifically, these geospatial analysis techniques in this study include average nearest neighbor (ANN), Ripley’s K function, spatial autocorrelation, spatial interpolation—kernel density estimation (KDE) and standard deviation ellipse (SDE).
2.3.1. Average Nearest Neighbor (ANN)
As one basic agglomerative technique, Average Nearest Neighbor (ANN) produces nearest neighbor values according to the mean distance between one feature and its nearest neighbor [
46]. Equation (1) depicts the distance from cluster
X to cluster
Y, namely,
D(X, Y).
Presuming there are N points in region A, the algorithm (ANN) performs the steps as below:
Each point itself represents one cluster, namely, each cluster with one single point within. The N × N distance matrix D involves all distance d(i,j). Then figure out it.
Define a distance threshold, namely a certain value set manually or expected mean distance of all points given a random pattern.
Group those clusters that are within the set distance threshold.
Repeat Step 3 based on the distance matrix renewal unless there exist no clusters which can be merged.
2.3.2. Ripley’s K-Function
Ripley’s K-function, namely, multi-distance spatial cluster analysis is a common technique to estimate the presence of spatial dependence of points [
47]. The function expression is as below:
represents the mean value of point density. The average value is calculated by . A refers to the region area containing all points. () is the number of points within the circle with the ith point as the center with r as the radius.
2.3.3. Spatial Autocorrelation-Bivariate Moran’s I
Spatial autocorrelation is applied to detect patterns of spatial association, namely, to present locational similarity [
48]. Moran’s I is the indicator for depicting spatial autocorrelation, involving global Moran’s I and local Moran’s I. As a single value, Global Moran’s I is employed to the whole study area [
49]. While local Moran’s I (also known as local indicators of spatial association-LISA) is the value calculated for each observation unit. This allows researchers to explore local variations in spatial dependency [
50].
Besides, Moran’s I can also be divided into univariate Moran’s I and bivariate Moran’s I. Univariate Moran’s I emphasizes spatial clustering in regarding a single variable. Bivariate Moran’s I focuses on depicting the relationship between two variables. The topological relationship is taken into account between observations into account [
51]. Bivariate Moran’s I, between variables
k and
I for observation unit is defined as:
where
is the spatial weight matrix between observation unit
I and its neighboring unit
j,
is the standardized form of the value of variable
k in the observation unit
I, and
is the standardized form of the value of variable
l in the observation unit.
This spatial statistic technique indicates how one variable associate with another variable at neighboring units j. The result of Bivariate Moran’s I is in the form of a map with four types of spatial correlation: (1) two positive correlation—spatial correlation (i.e., High-High and Low-Low); (2) two negative correlation—spatial outliers (i.e., High-Low and Low-High). The former (High-high and Low-low) relates to values physically surrounded by neighboring units with similar values. The latter, or called spatial outliers (High-low and low-High), relates to values surrounded by neighboring units with dissimilar values.
2.3.4. Spatial Interpolation-Kernel Density Estimation (KDE)
Spatial interpolation means the value estimation of un-sampled sites (or cells in a raster) within the study area [
52]. Kernel density estimation (KDE) is one commonly used interpolation technique for evaluating the probability density function of a random variable [
53]. “Kernel density estimation involves placing a symmetrical surface over each point, evaluating the distance from the point to a reference location based on a mathematical function, and summing the value of all the surfaces of that reference location” [
54].
N refers to the number of points and d(s,si) represents the distance between point s and point . expresses a weighting function (i.e., the kernel—the set of rules determining how much weight a point should be given close to the center).
As seen in the equation, the results are influenced by three factors:
The point-to-point distances.
The bandwidth, which is very important to control the degree of smoothing applied to the data. An acquired estimator is under smoothed and highly variable with small bandwidth. Inversely, the estimator is over smooth with big bandwidth [
55].
The weighting function.
Although there is a range of kernel functions, empirical studies indicate very little difference in the results between different weighting functions.
2.3.5. Standard Deviational Ellipse (SDE)
Standard deviational ellipse (SDE) is, also named as directional distribution, is one of the classical statistical techniques for depicting spatial characteristics of geographic features around its center. SDE was firstly put forward [
56]. Ever since then SDE has long functioned as a versatile GIS tool for summarizing the distributed features—central tendency, dispersion and directional trend. It is typically exerted for summarizing the geographical distribution trend concerning its central tendency, dispersion and directional trend [
57,
58].
SDE undertakes the calculate process on according to a distribution. In other words, That is, a feature class is generated around the map center. The default ellipse size concern three-level ranks according to the points evaluated. The 1st rank covers 68% of all points. The 2nd rand involves 95%. In addition, the 3rd rank contains 99%.
2.3.6. Thiessen Polygons (or Voronoi Diagrams) Analysis
Thiessen polygons, also named Voronoi diagrams, are created based on point input features. Its seminal work could be traced to Voronoi [
59]. The steps to Voronoi diagrams are: First, Delaunay triangulation network is made based on these input point features. Then, excenters of all these triangles are generated. Third, Voronoi diagrams are ultimately created through connecting all these excenters. Hence, Voronoi diagrams own the following characteristics [
60]:
Each Thiessen polygon (or Voronoi cell) merely contains one input point feature.
The distance of any location to one particular input point feature within one Voronoi cell is shorter than to input point features in other Voronoi cells.
The distances of any point on the border of every Thiessen polygon to the two input feature on its both sides are the same.
Based on this simple type of geometrical structure, Voronoi diagrams have a wide range of applications (e.g., geography, geology, ecology, materials science and biology) due to its adjacency similarity [
61].
3. Results
This section is divided into two parts—spatial pattern of leisure venues and the dominating factors underlying the distribution.
3.1. Spatial Pattern of Leisure Venues
Population Density and Leisure Venues Density
By the year of 2017, there are 86,520 leisure venues (POIs) in the city of Wuhan.
Table 2 shows the number of leisure venues and their density in each district. Considering that the area of each district varies, using the number of leisure venues per 1 km
2 and per 10,000 residents make it comparable between districts.
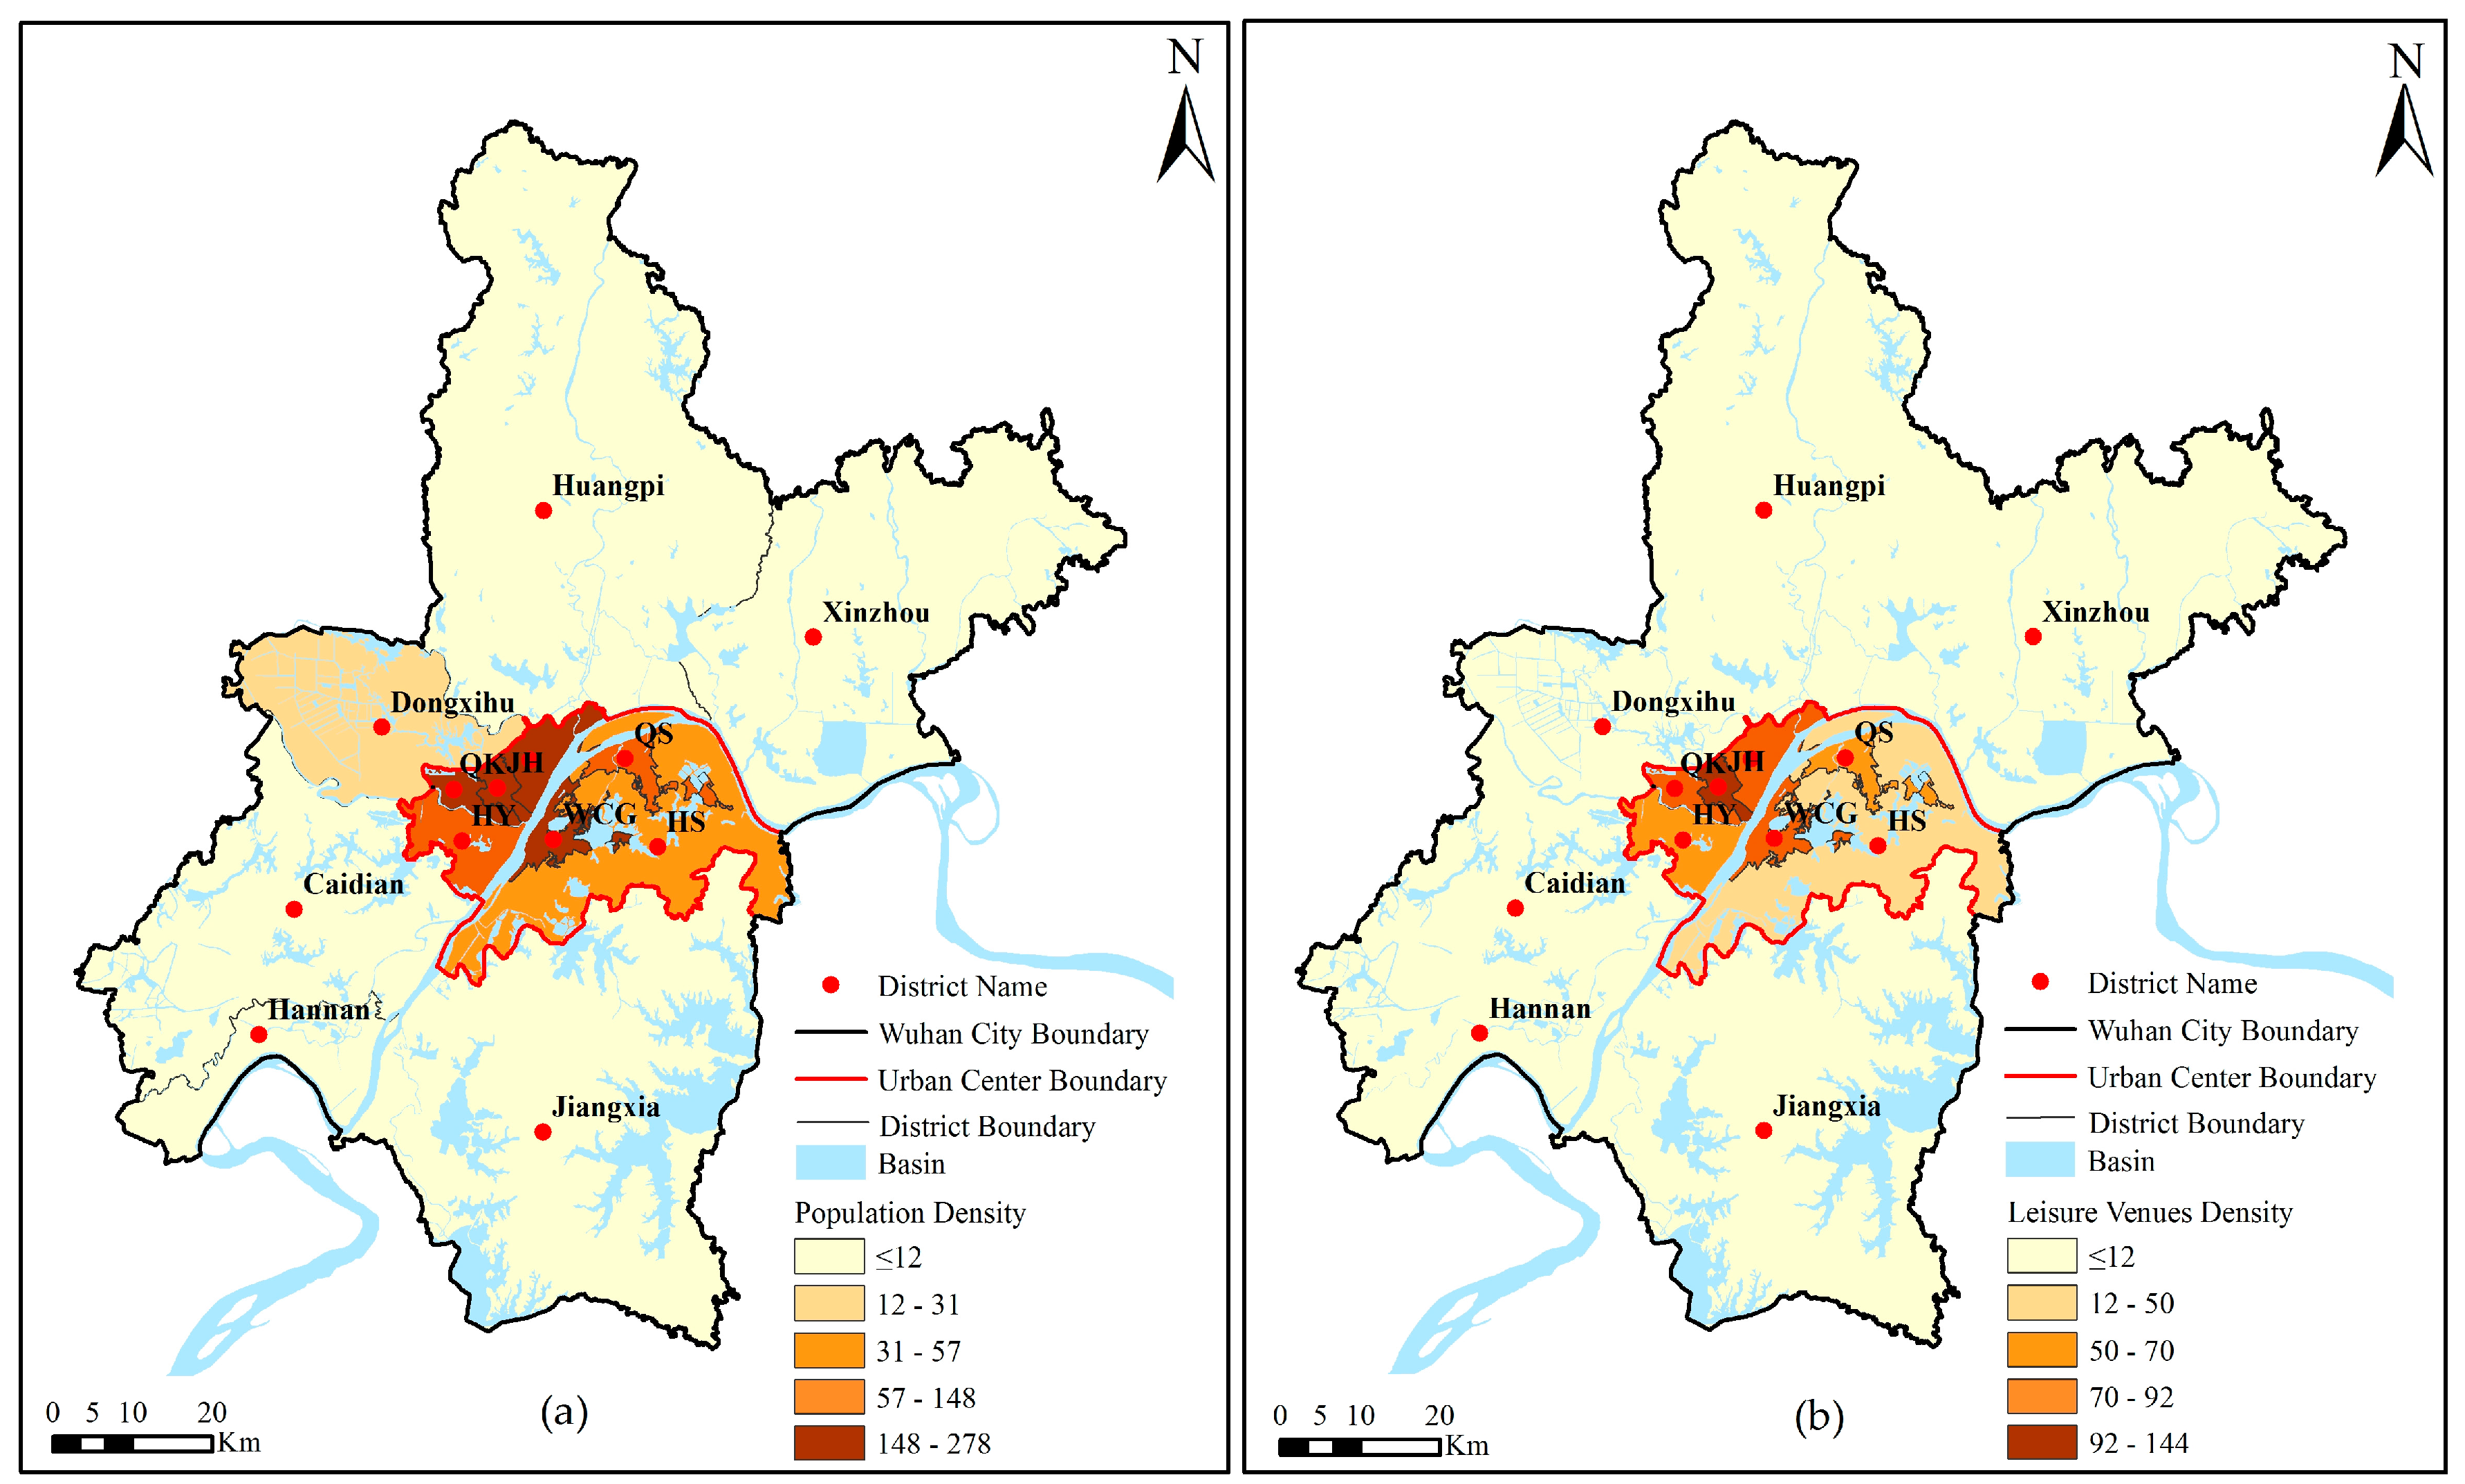
In
Figure 3, we can observe obvious distribution of both population and leisure venues with the “comparatively higher density in urban center” pattern. Specifically, the average number of leisure venues are 10 per km
2 and 86 per 10,000 residents. Considering the size of the serving population, the highest LVD value is in Jianghan district (132), locating in urban center. The lowest LVD value is in Xinzhou District (31), locating in urban suburb. Besides, four other urban center districts are with LVD value over the average (86)—Jiang’an (104), Wuchang (104), Hanyang (103) and Hongshan (102). The LVD values in two other urban center districts—Qiaokou (65) and Qingshan (76) are below the average. Meanwhile, the lowest LVD value is in Xinzhou district (31) in urban suburb, and the values in three suburban districts are below the average—Caidian (81), Hannan (63) and Huangpi district (37). Yet, LVD values in two other suburban districts are higher than the average—Dongxihu (107) and Jiangxia (95). The reason is that Dongxihu district enriches historical sites and Jiangxia district natural landscapes. Therefore, although these two districts are suburbs, the density is still high. On the whole, most leisure venues are in urban centers, though the urban-suburban LVD difference is not striking.
In terms of leisure venue density per km2, the difference between urban center and urban suburbs are conspicuous. The highest value is in Jianghan district (278) in city center, highly above the average (10). The lowest value is in Huangpi district (1) in urban suburbs. Besides, all six other districts in urban center are all above the average. The four other districts are all below the average, except Dongxihu district (12). City center is with more population yet less area compare with urban suburban area. Hence the disparity of LVD per km2 between city center and urban suburbs is quite striking, while the disparity of LVD per 10,000 people between city center and urban suburbs is comparatively inconspicuous.
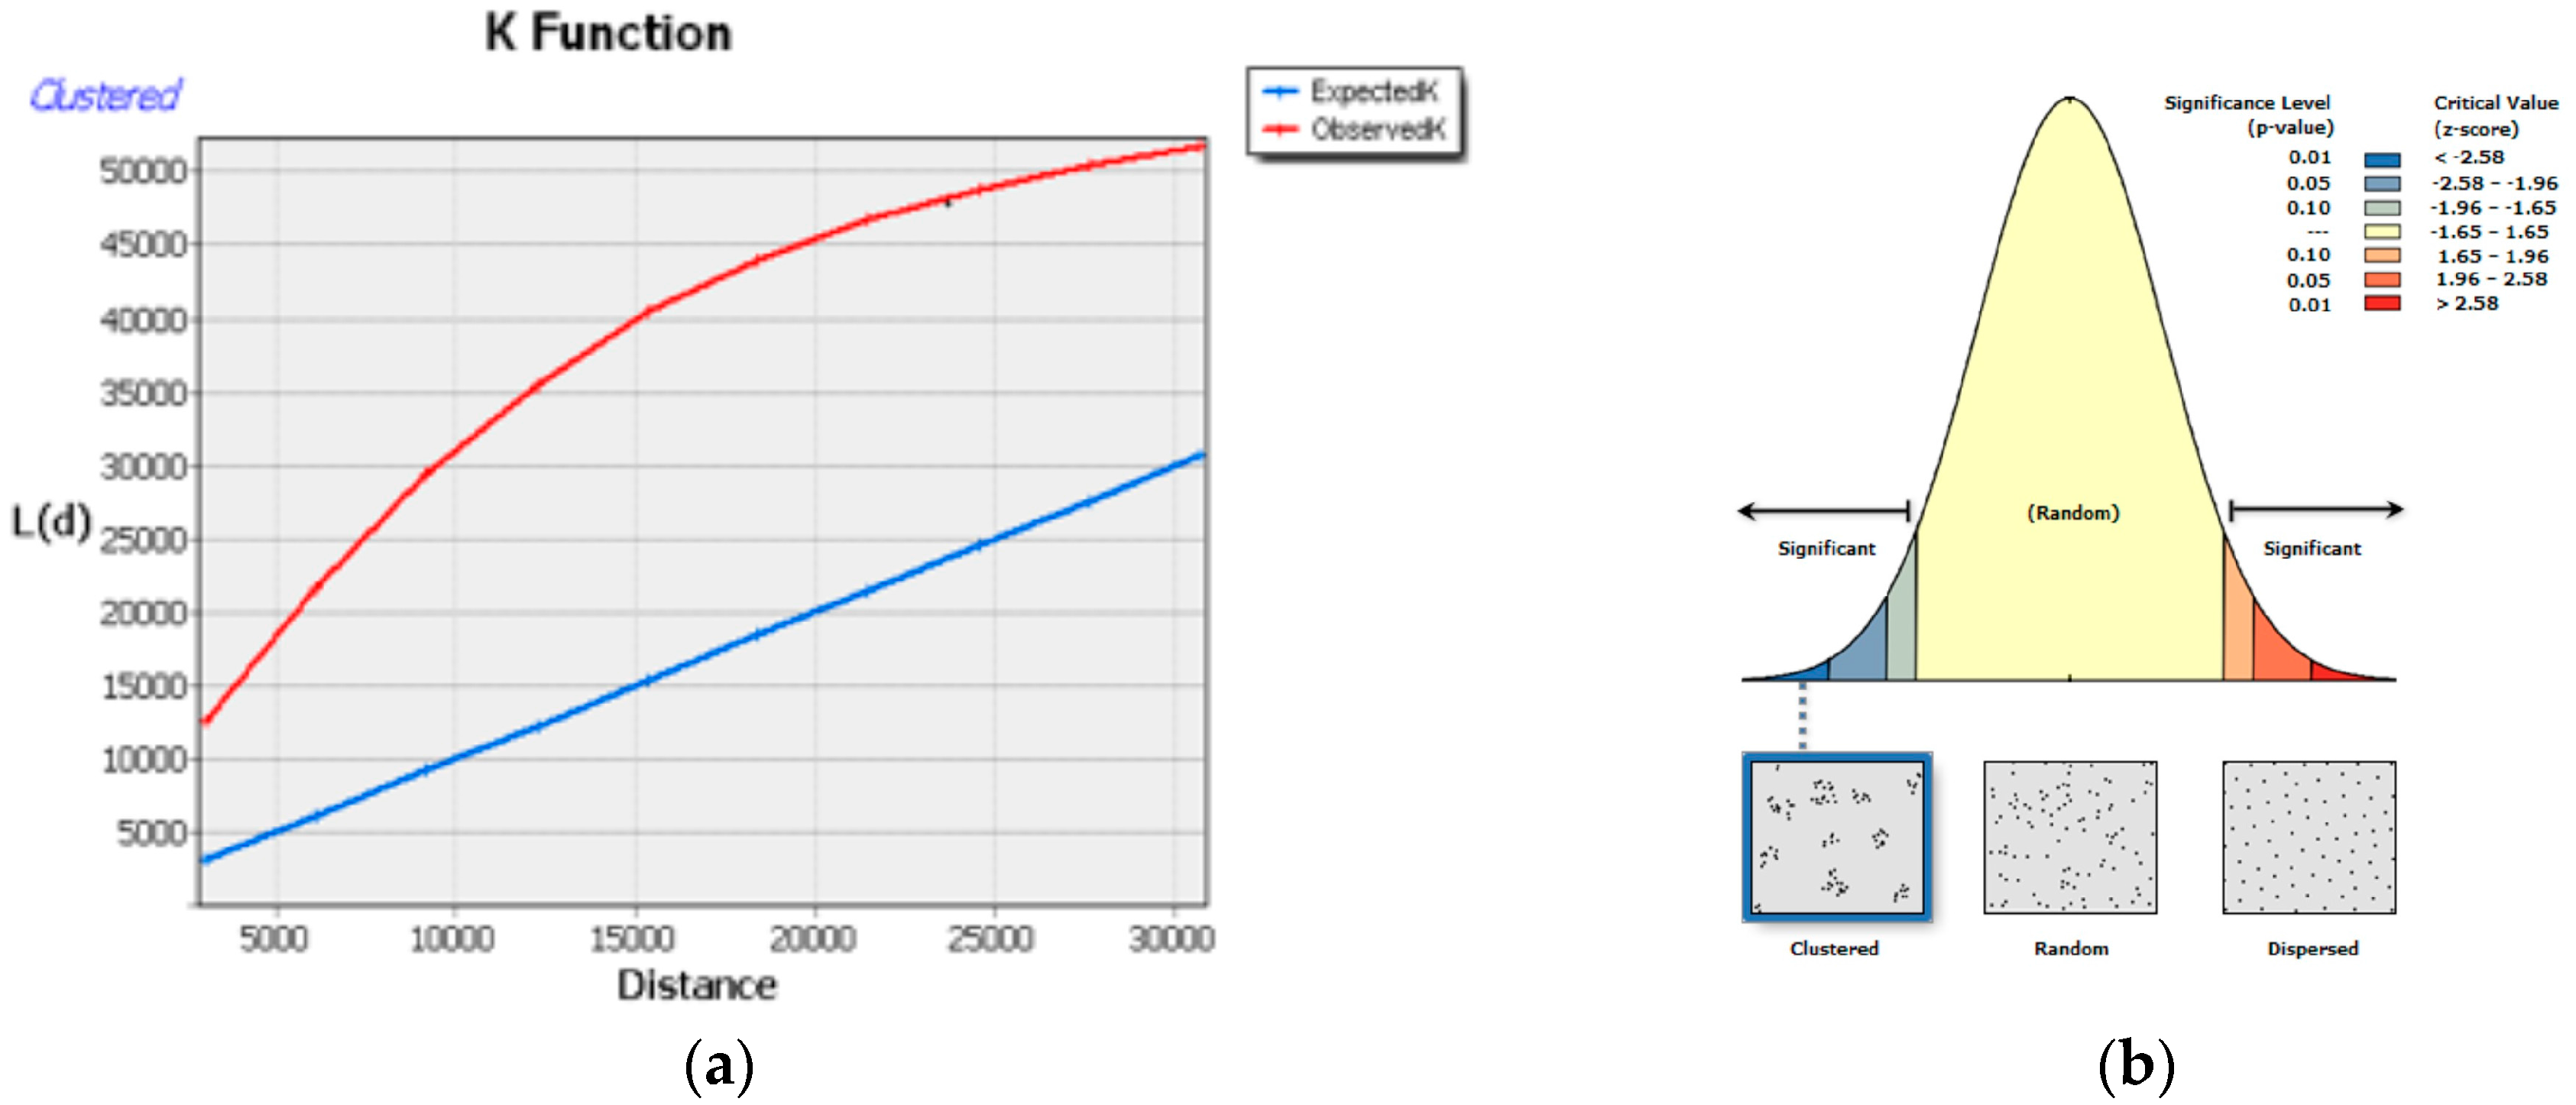
In order to discover the spatial distribution pattern of these leisure venues, Ripley’s K-function illustrates a systematic pattern. The classic version of this function is applied to explore the spatial dependence according to multi-distances of each leisure venue from one another.
As shown in
Figure 4, the red and blue lines respectively represent the observed and expected L value of leisure venues in Wuhan. In terms of any given distance, the observed K (red curve) is always larger than the expected K (the blue line). This indicates that this leisure venues’ distribution is generally clustered, yet with various clustering extents. The clustering level increases while the distance threshold increases. Since the Ripley’s K-function has ascertained leisure venues are spatially clustered.
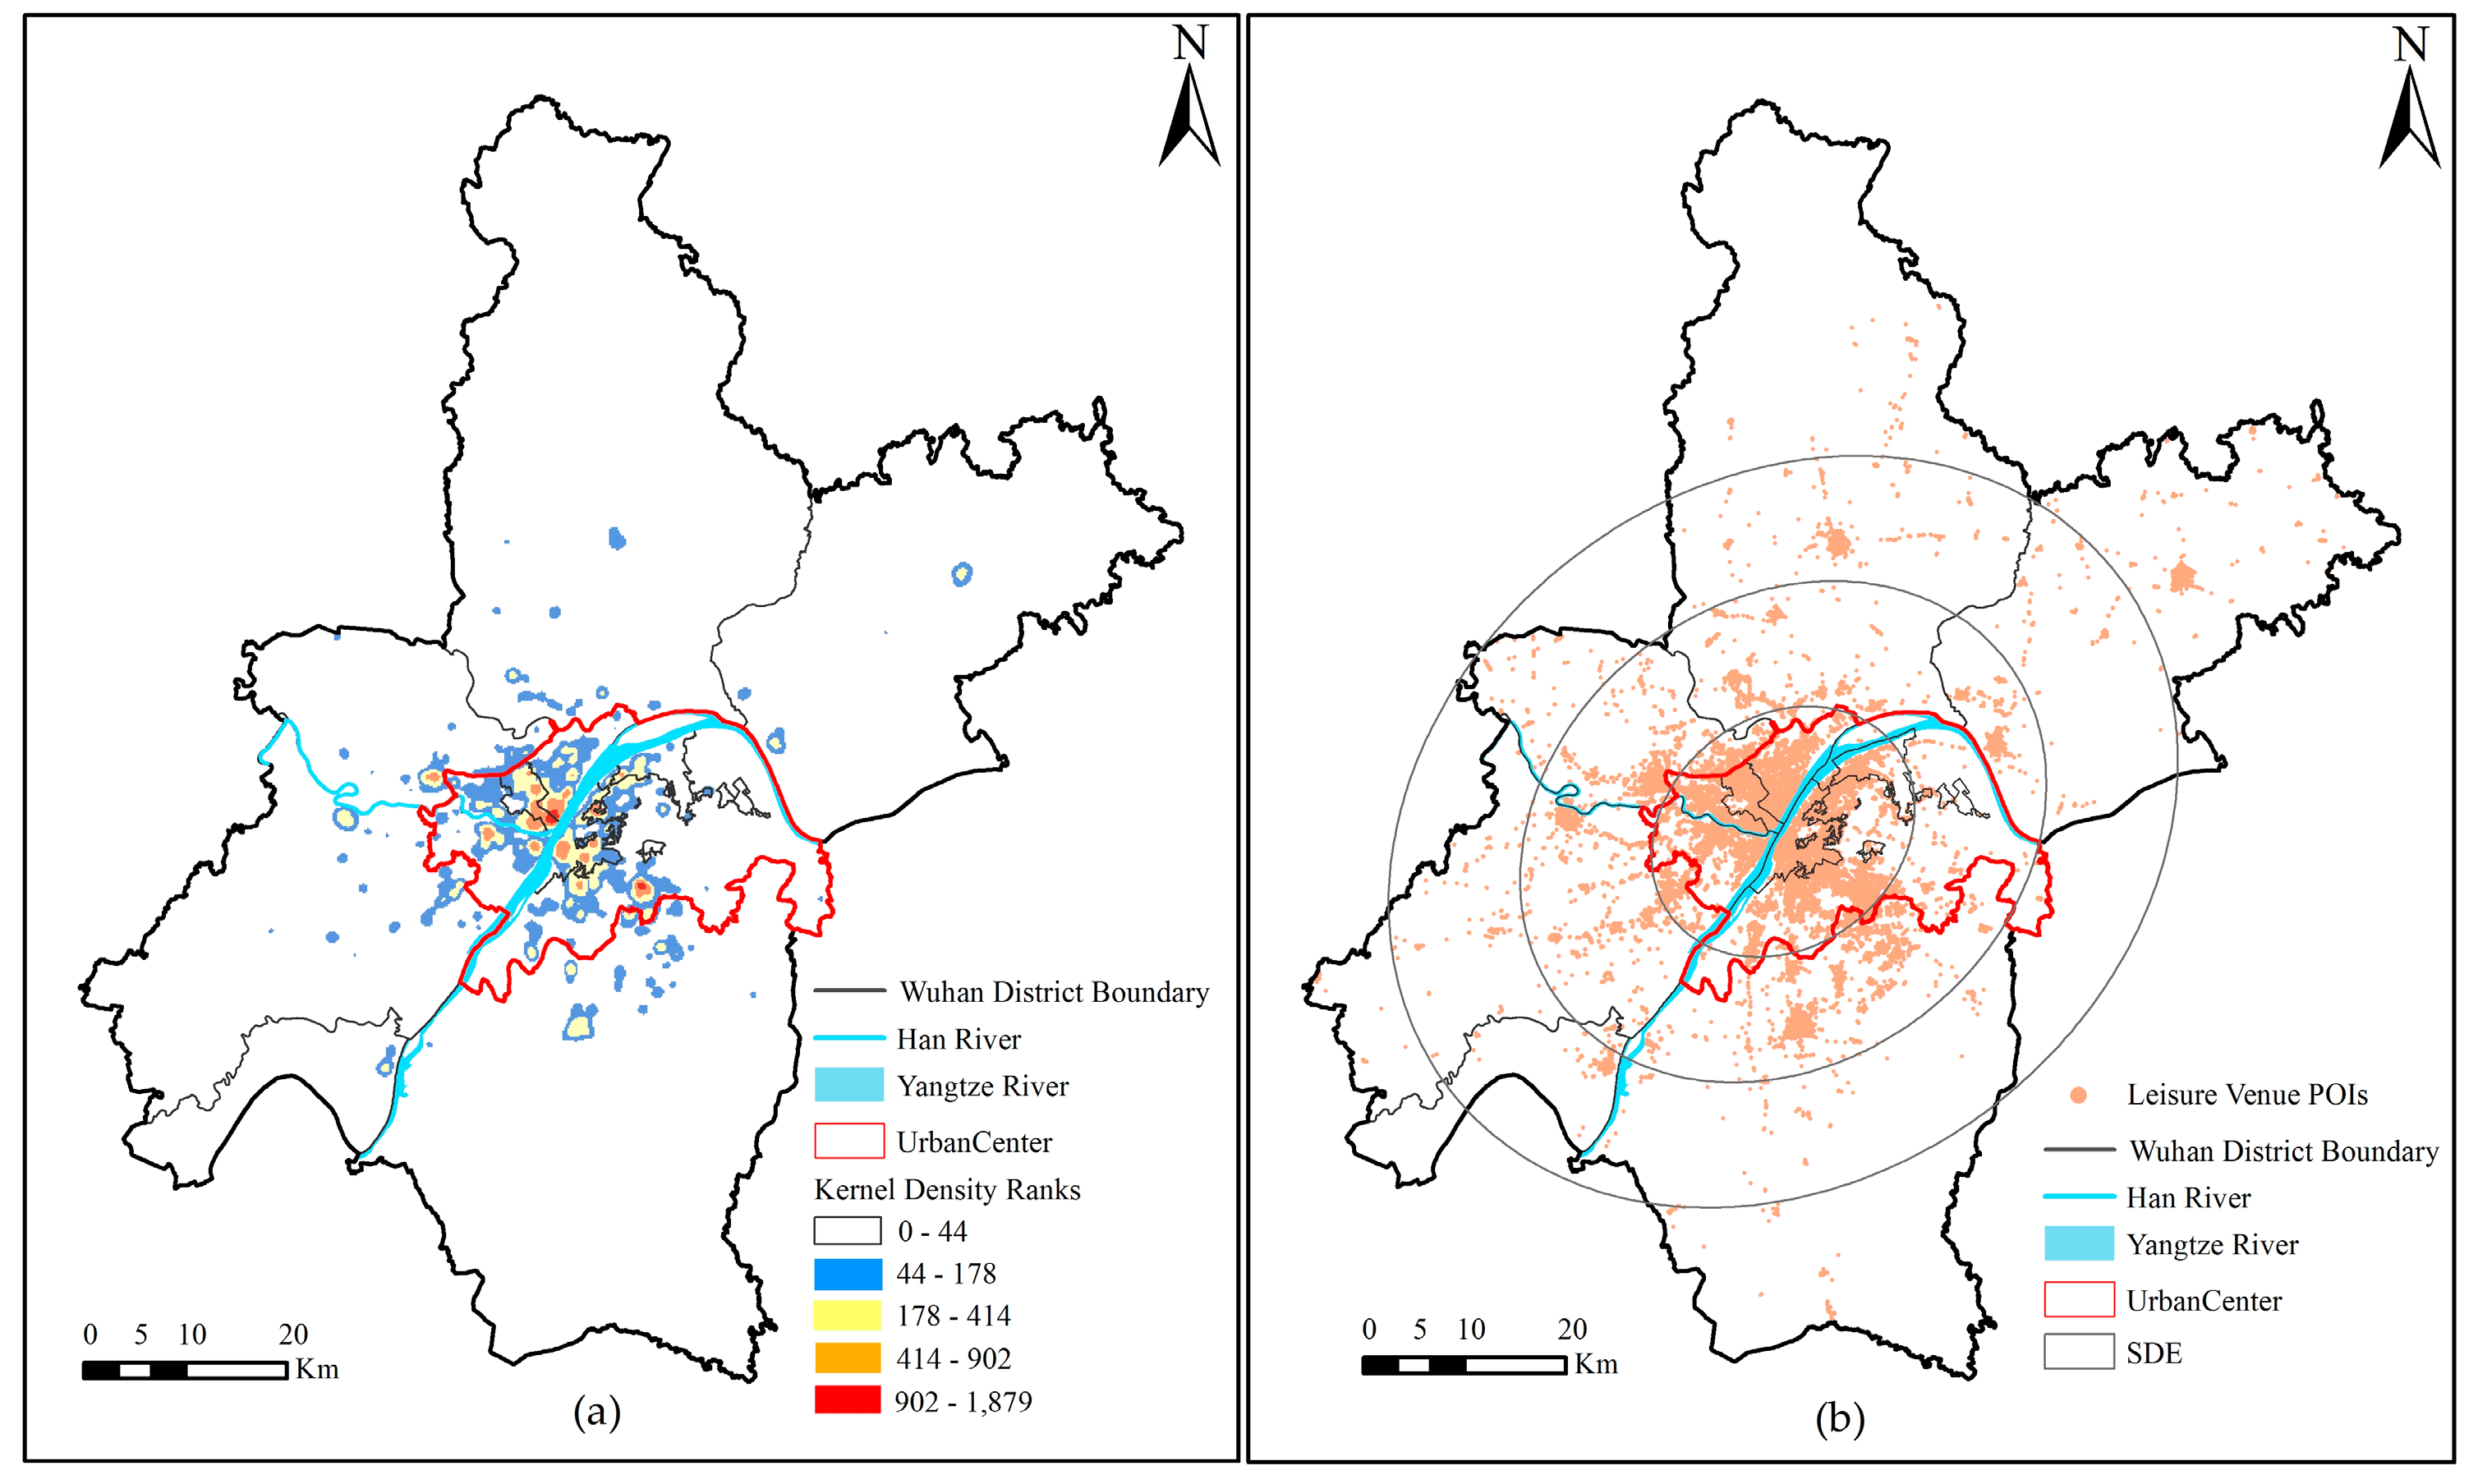
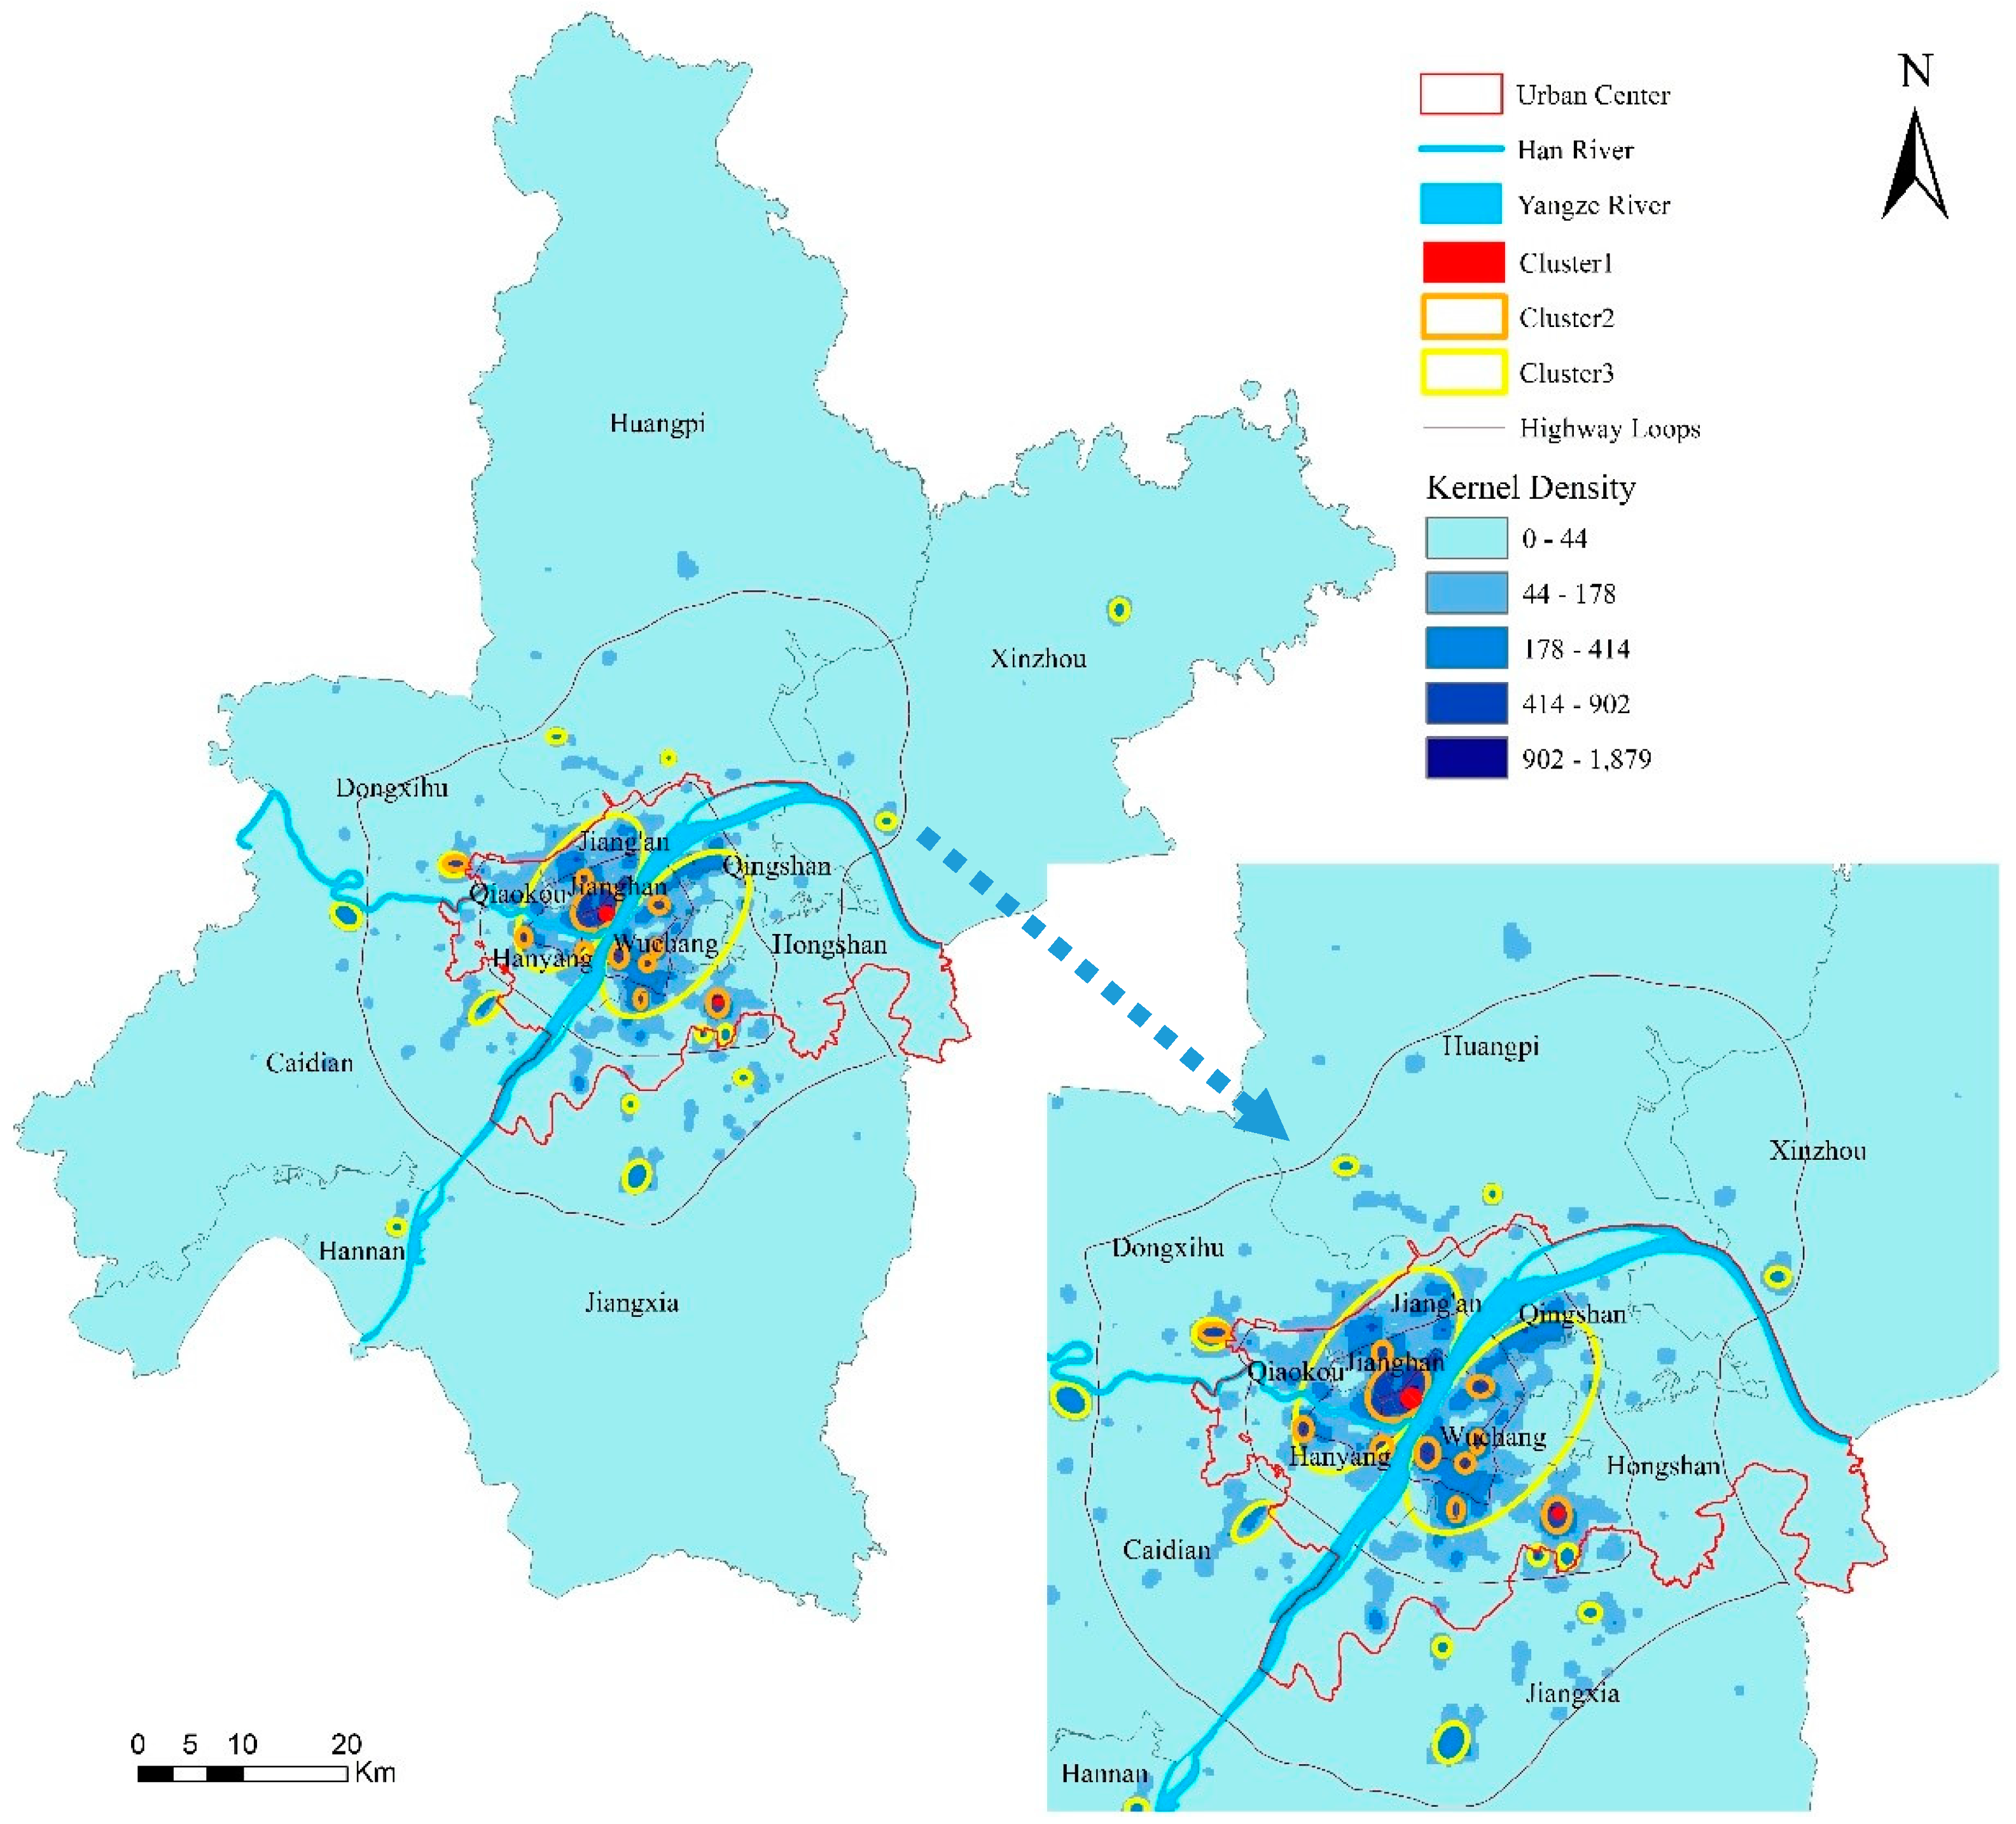
The above figures show a general view of all leisure venues distribution in (a) and its distribution trend in (b). We could clearly see that leisure venues are highly clustered in city center (within the red circle) with few sporadic clusters in suburbs. Red, orange and yellow areas are top three levels of leisure venues aggregated zones. Furthermore, the distribution is toward southwest-northeast direction, in accordance with the flow direction of the Yangtze River.
On this basis, we circled the top three-level clusters. That is, the 1st level clusters in red circles, the 2nd level clusters in orange circles and the 3rd level clusters in yellow circles (shown in
Figure 5). In addition, we have explained the clusters in detail in
Table 3.
3.2. Dominating Factors on the Distribution of Leisure Venues
Based on the above analysis, we infer that there are plenty of potential triggers for forming the status quo of the leisure venues distribution. These triggers might contain transportation network, residential areas, universities, hospitals or government organs. In this section, we strongly argue that policy, economy and population are the three main underlying reasons hauling the development of other industries (e.g., transportation and education), and will further advance the development of leisure industry. The below analysis is undertaken to ascertain the relationship among leisure venues, policy, population and economy.
3.2.1. Policy
Policies represent the decision-makings of governments or authorized organizations. Policies are normally compulsory for guiding the development direction, including leisure-relevant policies. Therefore, it is strongly argued that leisure policy functions as the agent of spatial evolvement.
Internationally, the First World Leisure High-Level Forum was held by World Leisure Organization (WLO) in 2006, with the subject Leisure Change Human Beings’ Life, issuing a series of policies at international scale. This represents the active attitude of pursuing civilization and healthy life-style. In terms of China, Government Work Report in the Year of 2016 has put forward to actively develop leisure industry (i.e., cultural, tourism, recreation and sports industry) and renewal consumption and economic growth mode.
The Chinese government views leisure industry as containing four main aspects—sports (mainly for physical health), tourism and recreation (mainly for psychological and spiritual needs), and cultural for urban specialty and development sustainability. The National Tourism Leisure Outline (2013–2020) has been issued in 2001. This regulates that urban-rural planning should take tourism leisure space and facilities into account for optimizing spatial pattern. Besides, merely opinions-type government documents are issued. These involves Entertainment Venues Management Regulations in 2006, ‘Opinion by the State Council about Accelerating the Tourism Development’ (No. 41 Document in 2007 of the State Council). ‘Opinion by the State Council about Accelerating the Tourism Development’, ‘National Leisure and Tourism Schema’ issued by the National Office in 2013. That is, there is no systematic framework of leisure policies formed, much less whether spatial-perspectives are adopted in leisure-relevant policies.
3.2.2. Population
As argued, cultural and spiritual needs of the population are the primary trigger for the development of leisure industry. Due to the process of a rapid urbanization in China, obvious regional development gap exist within Chinese cities. The population is a normally-considered factor to reflect the disequilibrium and spatial variations of social development in a wide range of aspects. In this study, population density is utilized as the indicator reflecting demographic characteristic. We have probed whether population density exerts influence on the spatial distribution of leisure venues in a way or not.
The population data are from the Six National Population Census, taking both residents and floating population (without local Hukou, or residing less than six months) into account. The total number of residents is 10.02 million in Wuhan, distributed in 13 districts within the study area. Population density is 1180 per km
2. According to the aforementioned
Figure 3, we can capture a clear pattern that the density decreases gradually with the increase of the distance from urban central zone (except Dongxihu District). The density of leisure venues presents a similar pattern, with high values appearing in the city center, but less regularity in the suburb areas.
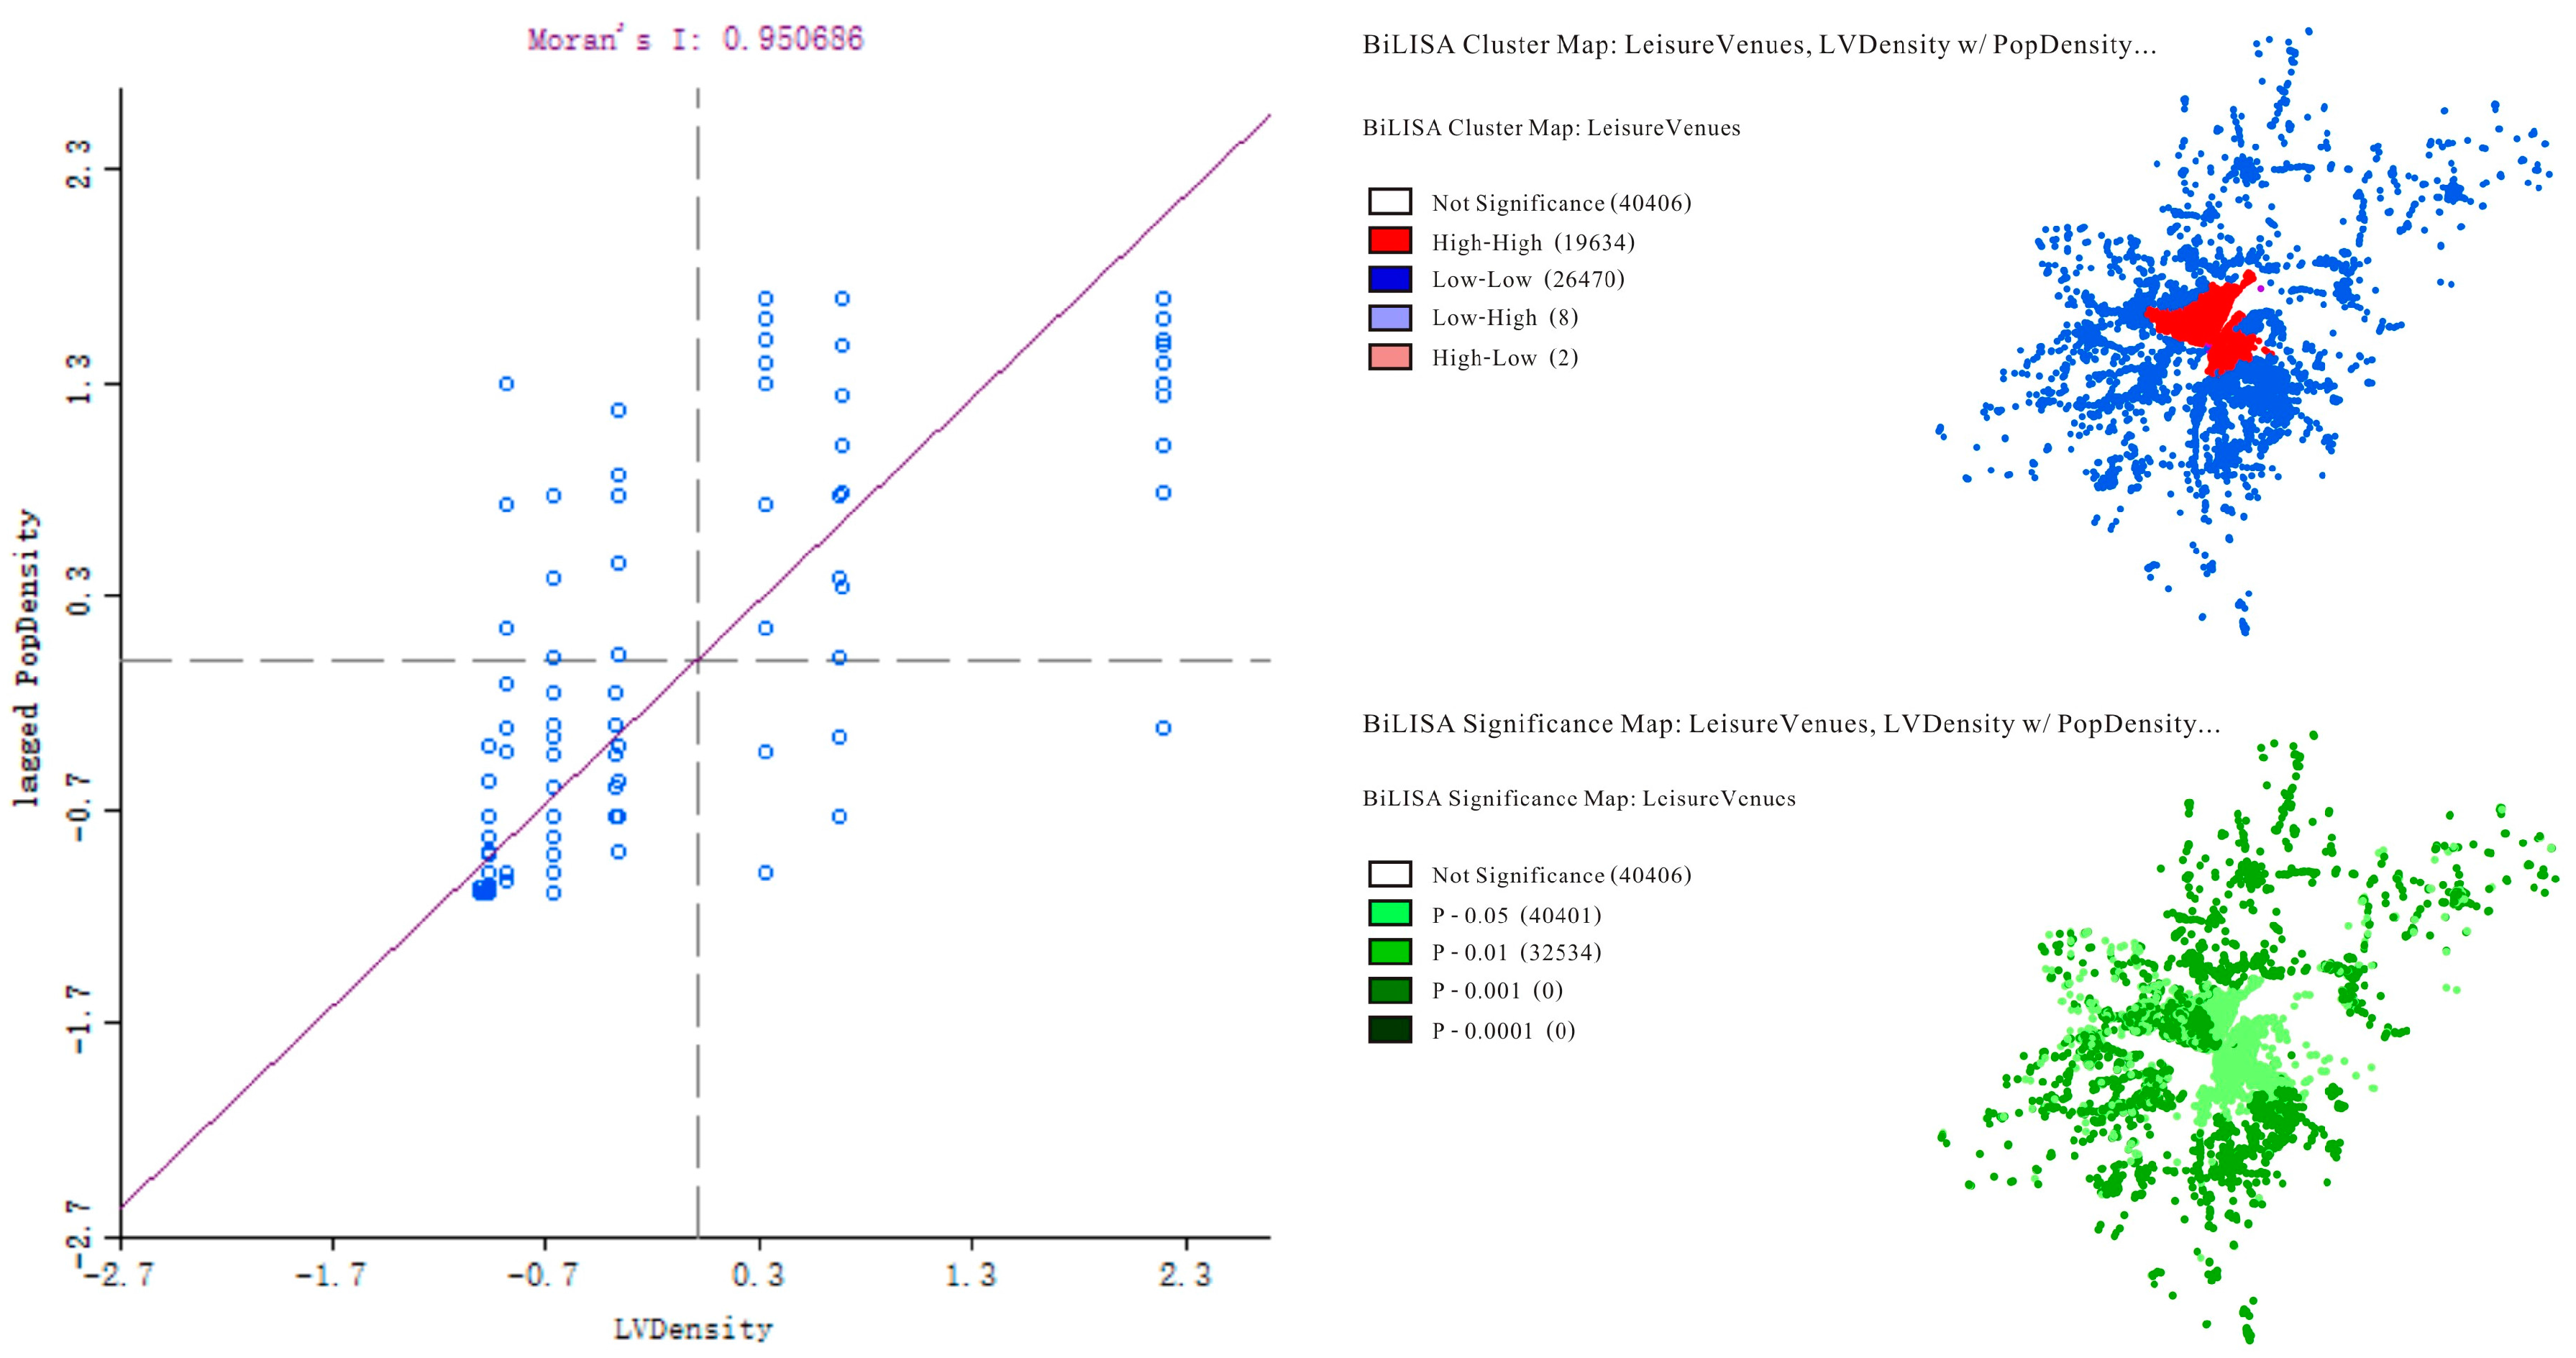
To further assess the spatial association between population density and leisure venue density, we have used Bivariate Moran’s I statistic by means of the GeoDa software [
62]. We have created a weights’ matrix based on K-nearest neighbors and got the result of 0.950686 as Global Bivariate Moran’s I, namely, the scatter plot slope, indicating a considerable positive association between the distribution of the population and leisure venues. In the scatter plot, four quadrants match four corresponding kinds of association. The first and the third quadrants represent spatial clusters, HH (High-High) and LL (Low-Low), respectively. The second and the fourth quadrants represent spatial outliers, LH (Low-High) and HL (High-Low), respectively.
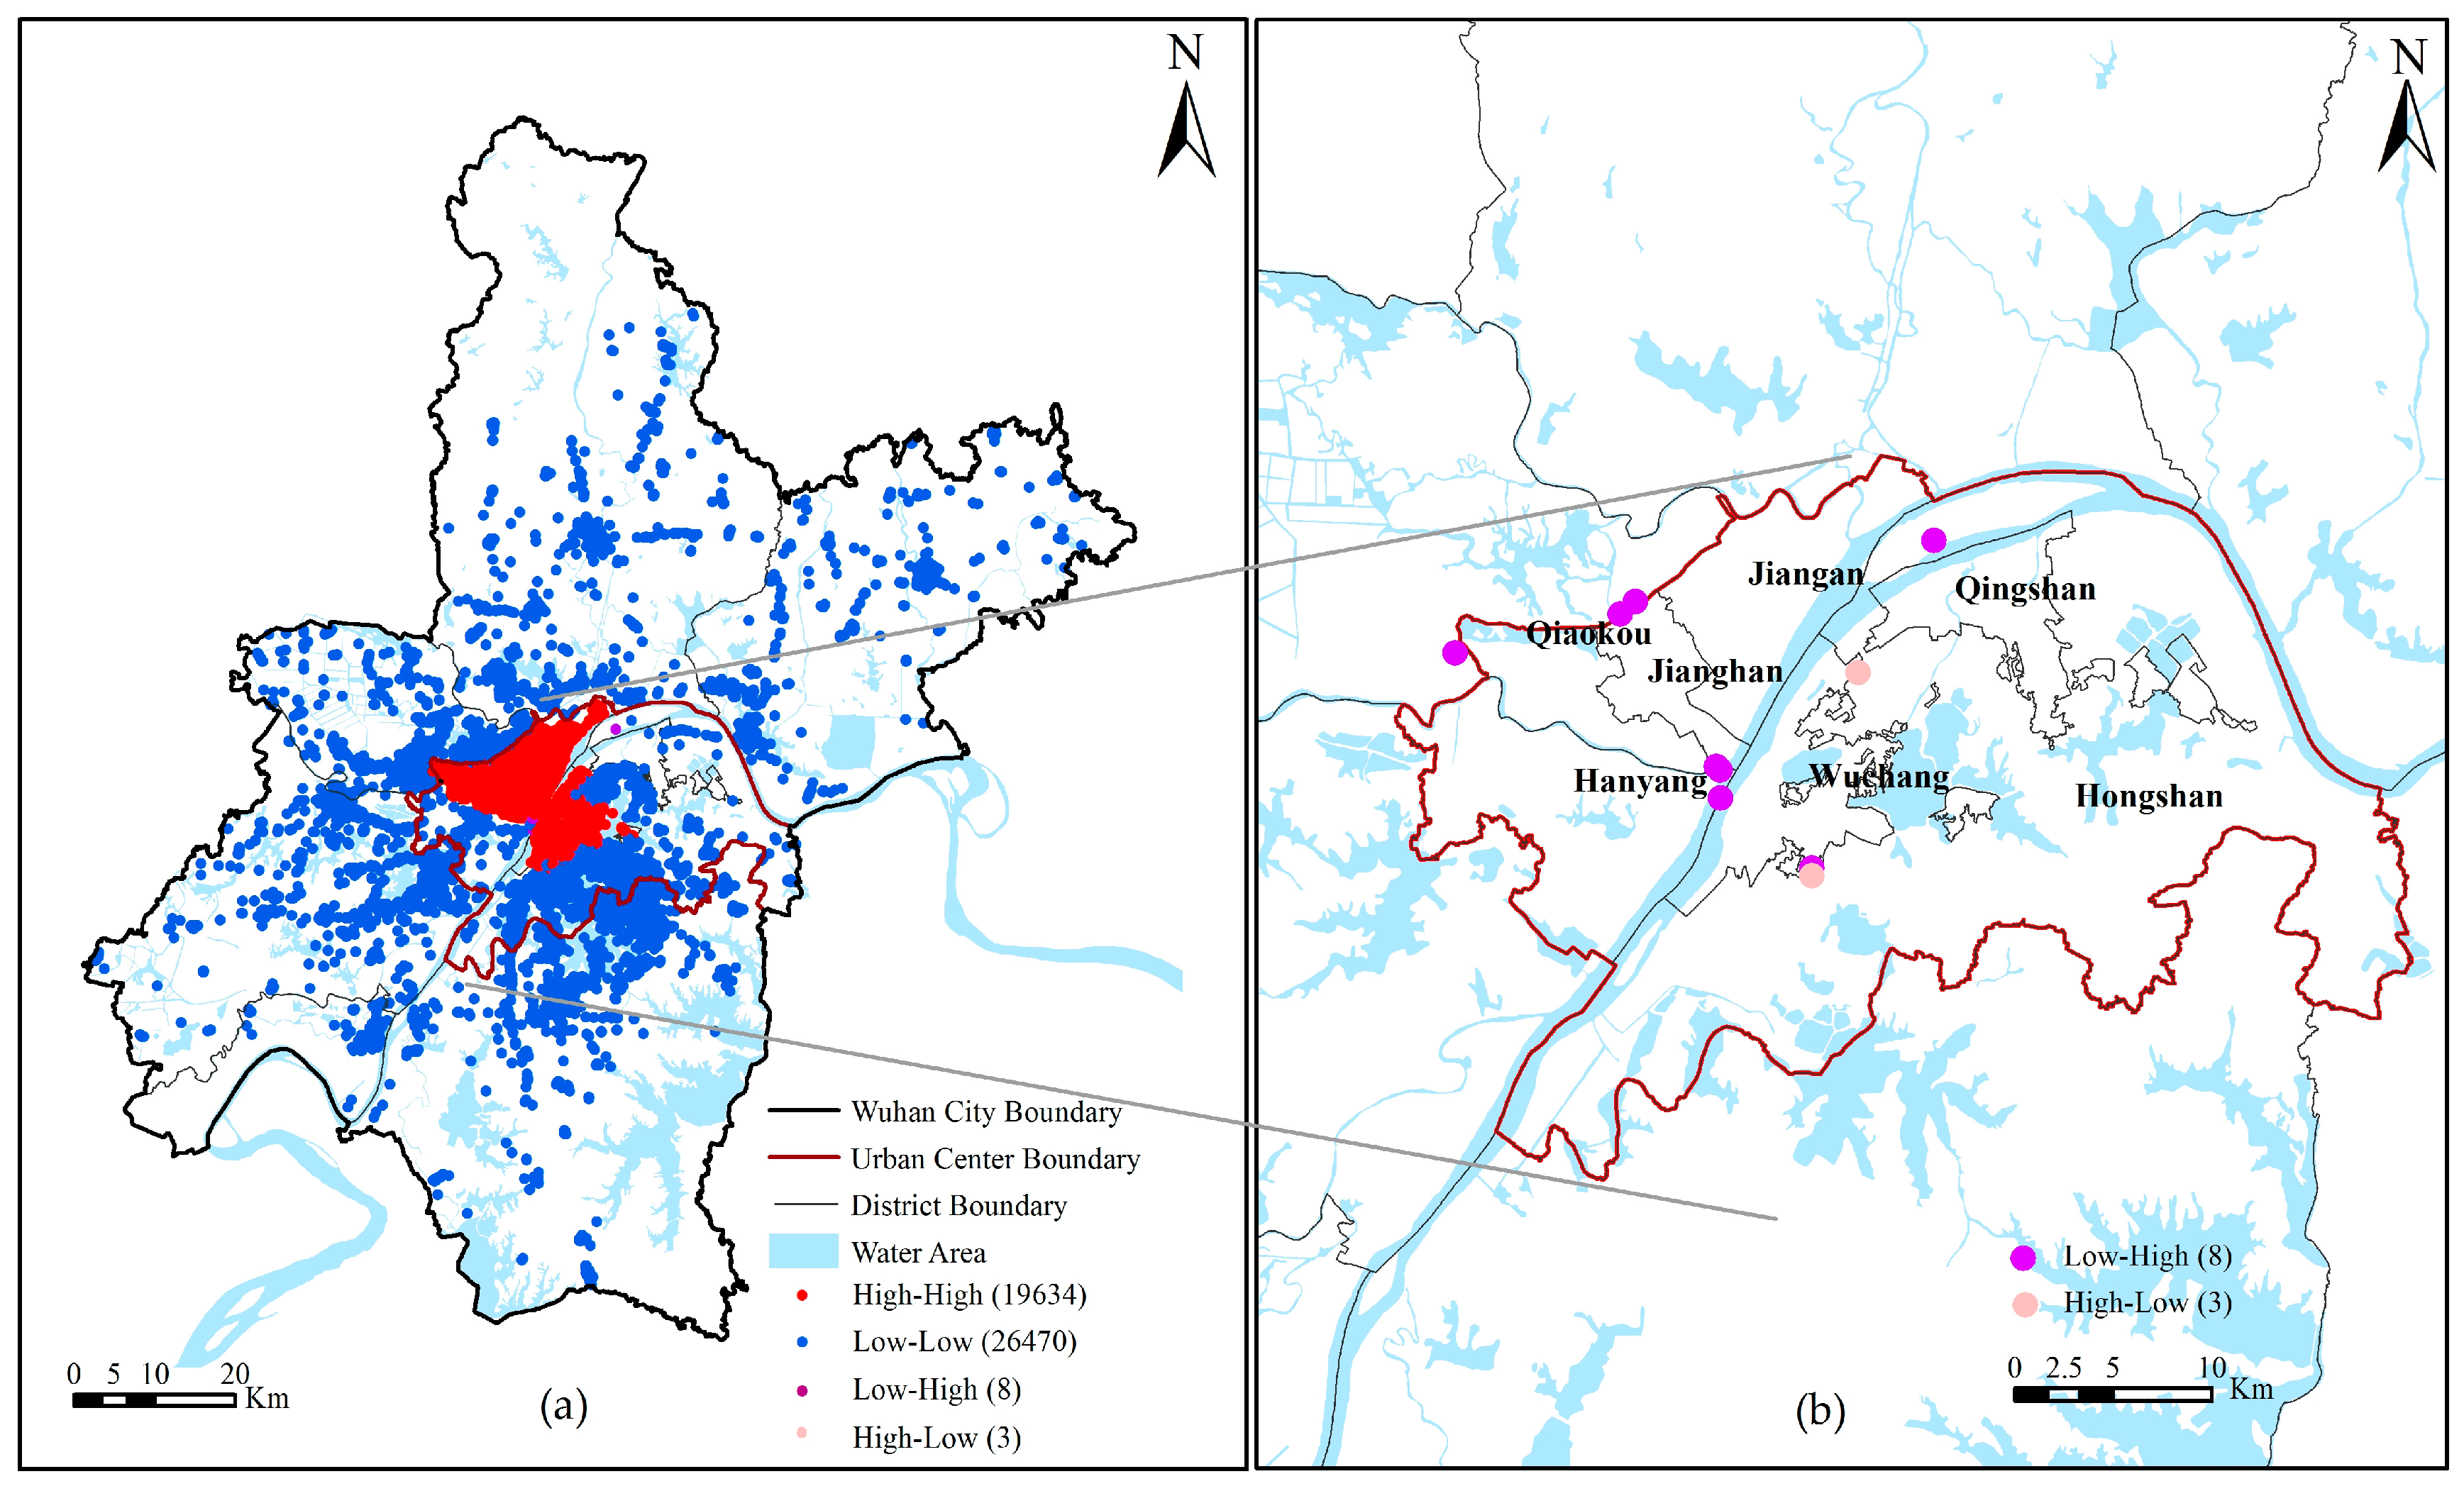
Figure 7 provides the spatial visualization of these spatial clusters and outliers. There are 62 clusters with positive association (in the first and the third quadrants) and many of them are significant, meaning that leisure venues are in general distribution at the places where more people reside. As expected, the HH is mainly located in the urban core, and LL is found in the suburban areas, whereas there are fewer districts in which the density of the population and leisure venues are negatively associated.
Figure 8 is created to show specific Low-High (8) and High-Low (3) locations. Low-High point features are public bathhouse (5), sport clubs (2) and leisure garden (1). The five public bathhouses locate in the Qiaokou District (1), Hongshan District (2) and Hanyang District (2) of urban center with high population density. The reason why leisure venues are low might be this leisure or life style (i.e., public bathing) becomes obsolete. While, the sport clubs and leisure garden are all in Dongxihu District of urban suburbs. The reason why they are Low-High type could be the access cost is commercially high. Moreover, High-Low locations are respectively the Wuhan Yangtze River Bridge Area (1) and the Wuhan Erqi Yangtze River Bridge Area (2). The Wuhan Yangtze River Bridge Area is the most famous tourist hotspot with a lot of historic places of interest (e.g., Yellow Crane Tower). Hence, despite low residential population, the actual visitor population is high. This is why the Wuhan Yangtze River Area are in High-Low domain. For the Wuhan Erqi Yangtze River Bridge Area, the reason might be that there are universities in that region. Likewise, the actual population is higher, despite of lower residential population. Thus, the leisure density is comparatively high.
3.2.3. Economy (Commercial Centers)
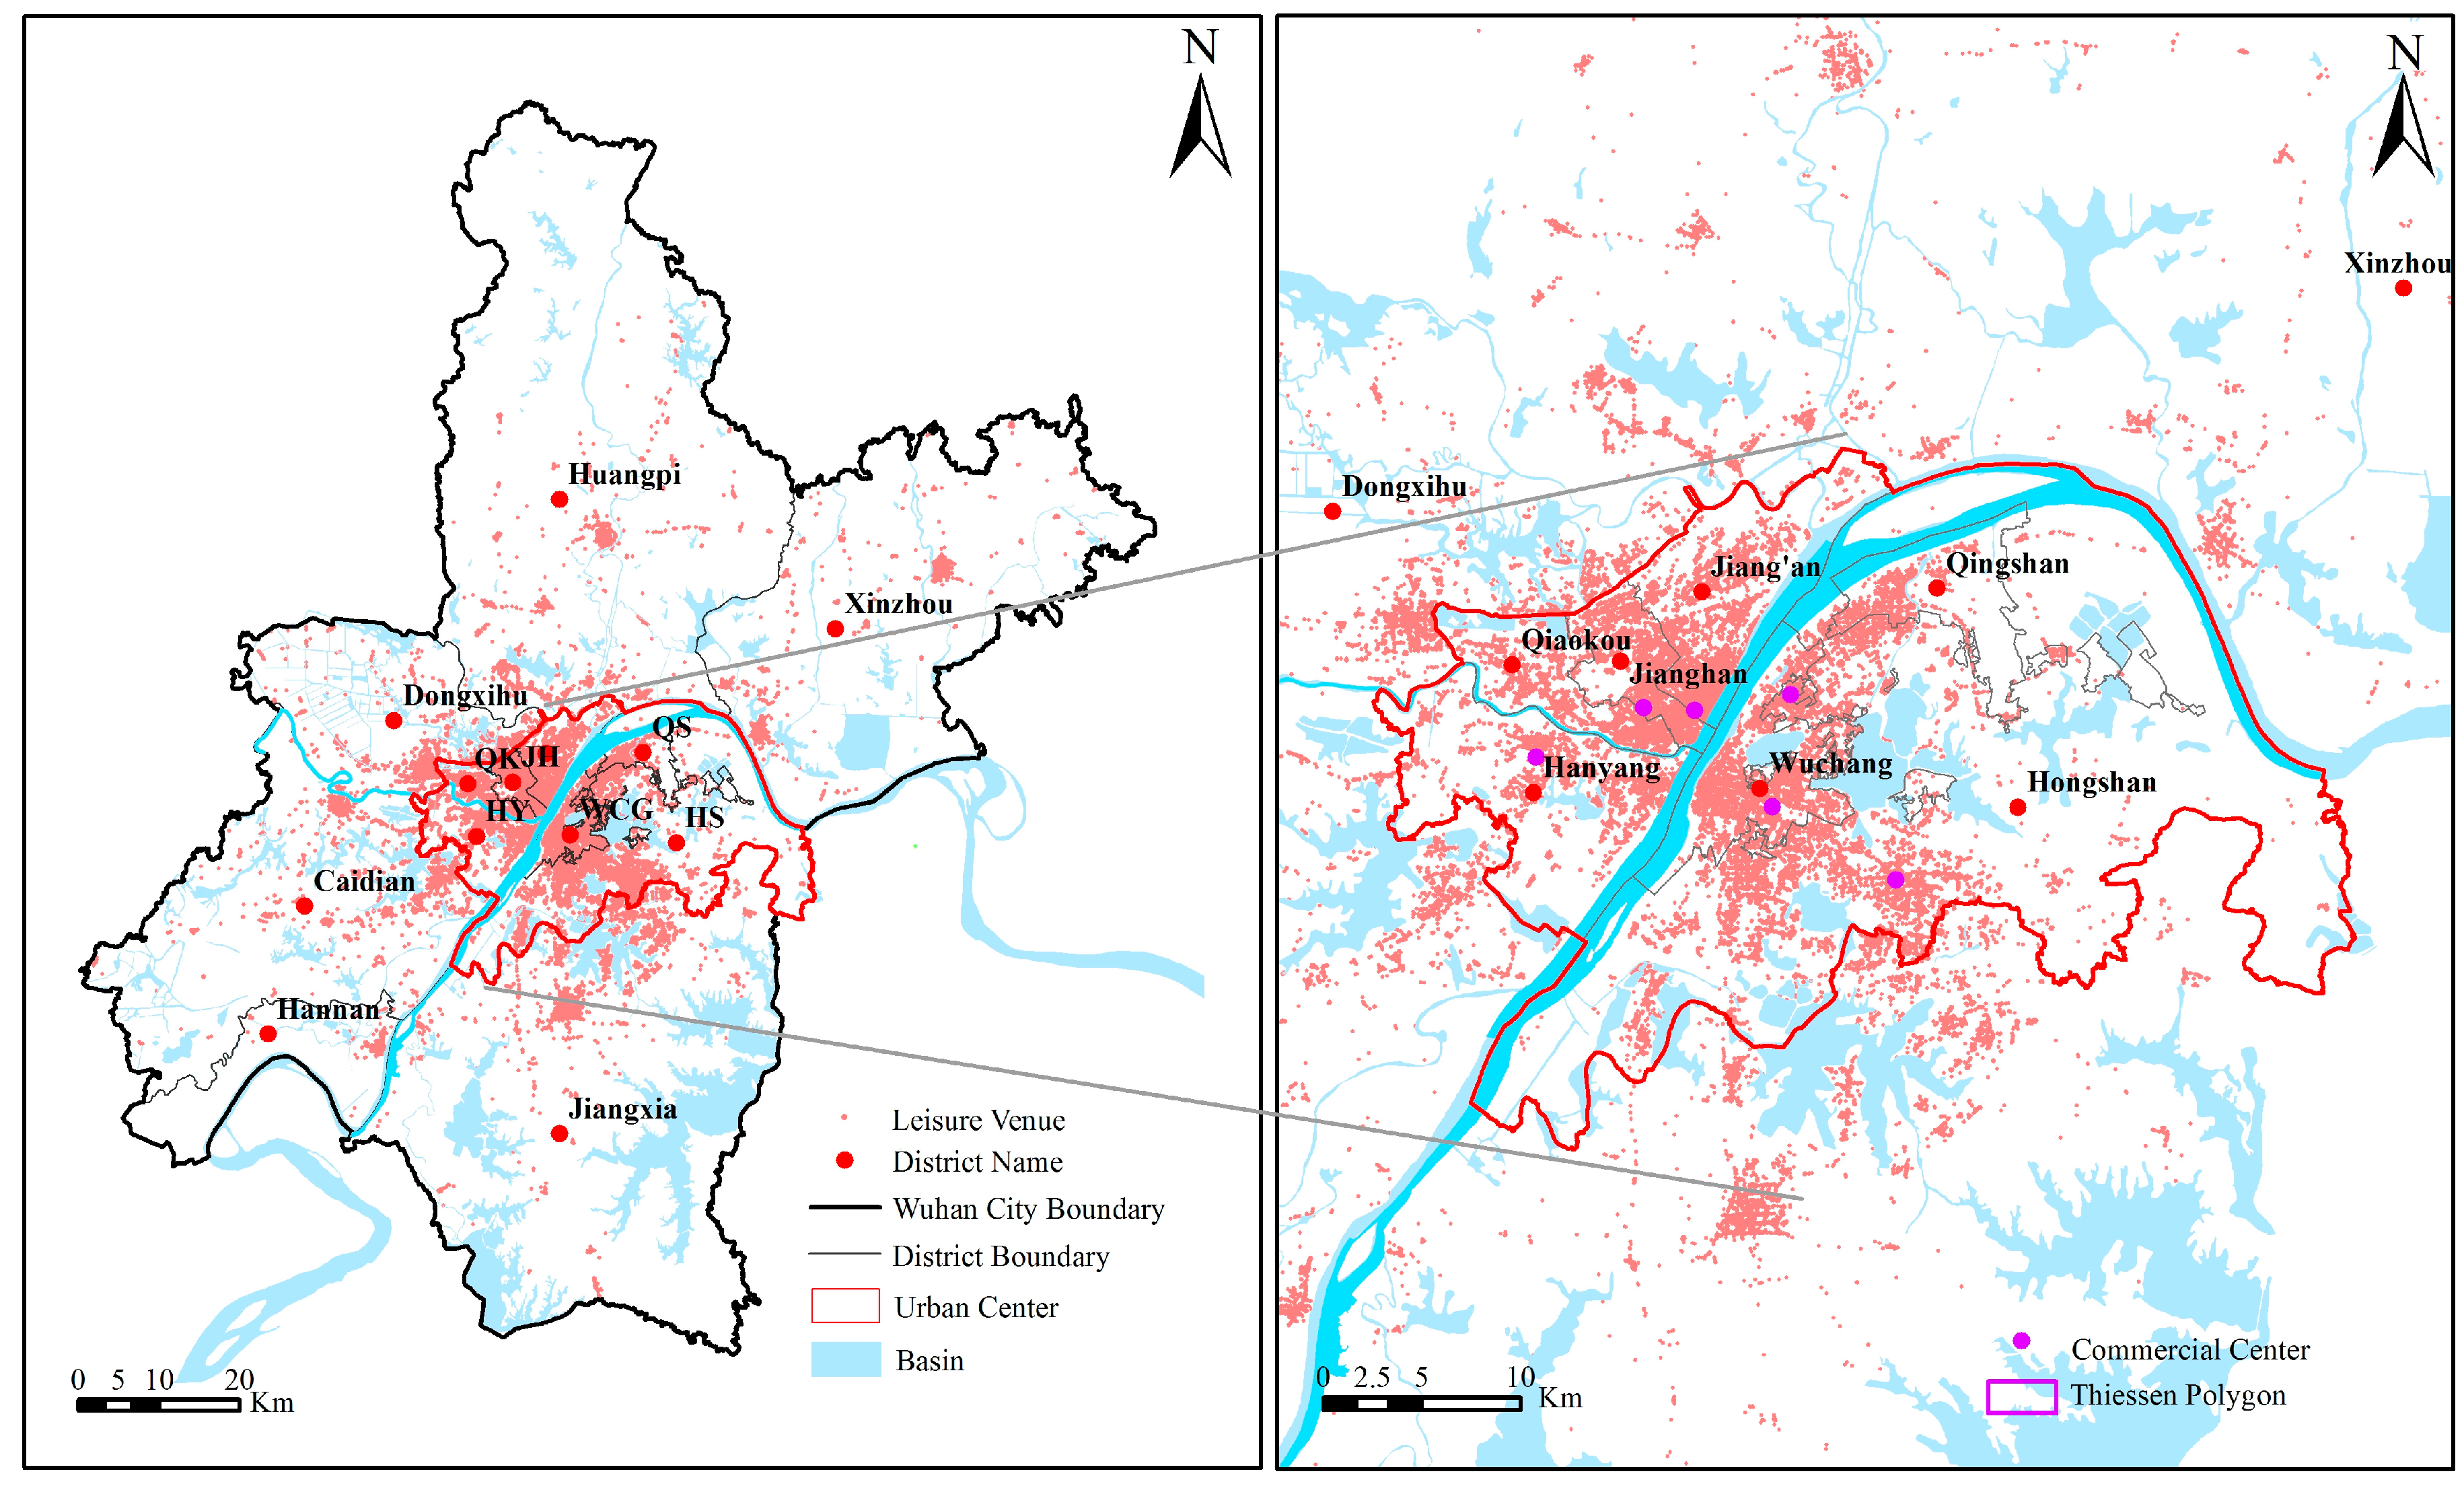
As we argued, economy is the third dominating factor. Commercial centers are selected as the indicator representing economy. Considering commercial centers as one crucial component influencing urban structure, we argue that commercial centers have the gravity effect for citizens, and have a great impact on the decisions of consuming activities. According to
Wuhan Commercial Facilities Spatial Layout Planning, six commercial centers are involved (in
Table 4).
According to the characteristics of Thiessen polygons (or Voronoi diagrams), we know that the distance of each leisure venue to the particular commercial center in the same Voronoi cell is shorter, compared with that commercial centers in other Voronoi cell. In this sense, each Voronoi cell indicates the influential range of each commercial center [
22]. Hence, to explore the relationship between commercial centers and leisure venues, we employ Thiessen polygons to partition the urban space into service regions of each commercial center, shown in
Figure 9.
The below table summarizes the area of each Voronoi cell of the each commercial center and the number of leisure venues located in each Voronoi cell. Whether the number of leisure venues matches the service area of commercial centers implies the influence of commercial centers on the location choice of leisure venues.
According to
Table 5, we can observe that the number of leisure venues is associated with the location and the level of commercial centers. In general, there are more leisure venues in commercial centers that are located in the urban center than in periphery areas. Furthermore, there are more leisure venues found in higher level commercial centers.
4. Discussion
Based on the above results, this discussion section will be unfolded from three aspects as below.
4.1. Spatial Pattern
Results reveal significant clusters of leisure venues in downtown area and slightly obvious clusters in suburbs of Wuhan City. This pattern almost corresponds to the urban form of ‘Three-township’ in Wuhan—two 1st-level clusters are separately located in two townships—Hankou and Wuchang Township. That is, most leisure venues are gathered on both sides along the Yangtze River.
4.1.1. Spatial Discrepancy
The distribution pattern of leisure venues are: (1) The two highly clustered areas (1st level in red circle) are respectively located in two townships among ‘Three Townships of Wuhan’, namely Great Wuchang Township and Great Hankou Township, except Great Hanyang Township; (2) Most 2nd-level clusters are in urban center, except one in urban suburb; and (3) the two clusters with largest areas (3rd level in yellow circles) seem the Leisure Eyes of Wuhan. There is far from sufficient leisure venues in suburbs. Sporadic 3rd-level clusters exist in suburbs, with no 1st-level clusters and merely one 2nd-level cluster. The distribution of leisure venues is conspicuously unevenness. This indicates the remarkably imbalanced development disparity among districts, especially between city center and suburbs. City center is comparatively mature and flourishing, with its suburbs in very preliminary stage.
4.1.2. Cluster Types
In this study, we have discovered that clusters can be categorized into four types. That is, business-oriented, transportation-oriented, school-oriented, and mix-oriented types. ‘Transportation’ involves the ferry, metro, railway and road modes. ‘School’ mainly involves universities. The two 1st-level clusters are mix-oriented clusters (transportation-business-school oriented). In terms of the 2nd-level clusters, there are one business-oriented cluster, four transportation-oriented clusters and five mix-oriented clusters. For the 3rd-level clusters, the ‘Leisure Eyes of Wuhan’ (two 3rd-level clusters in urban center along the Yangtze River), are mix-oriented. For the other 3rd-level clusters, there are five school-oriented clusters, three transportation-oriented clusters, one business-oriented cluster, and one mix-oriented cluster. City center is abundant in business districts and key universities with well-developed transportation system. In this sense, clusters in urban center are mainly the mix-oriented type. While, there are mainly school-oriented clusters in suburbs, due to underdeveloped economic and transportation status. Hence, eliminating the leisure venue distribution imparity might be available through strengthening the development of business districts, transportation network and education industry.
4.2. Dominating Factors
Three dominating factors are identified, leisure policy, population and economy. For policy, we aim to probe how leisure policies function as dominating force for leisure industry. Spatial components are presumed to act as an advocacy tool to leisure development. Yet leisure relevant policies or regulations are far from sufficient. Further research is needed to systematically construct leisure policy framework and integrate spatial components for promoting positive effects and lessening negative effects for leisure development. For population and economy, we choose population density and commercial centers as their indicators, respectively. We found that population density and commercial centers positively correlates to the distribution of leisure venues. That is, regularities of spatial pattern is significantly influenced by population distribution and commercial center location.
4.3. Limitations
Regardless of the above discoveries, there are still limitations in this research. First, we presume that leisure venues positively influence human being’s life. Yet certain leisure venues (e.g., in obscure streets) might not. Leisure venue assessment is not included in this study. Second, POIs data merely show locations rather than other attributes (e.g., boundaries, areas, service conditions etc.). In-depth analysis (e.g., radiation effect) is not involved in this study. Third, even though the refiner the scale (e.g., the community scale) is, the more specific information will be explored. Due to data availability, this study focuses on the district scale. Fourth, besides dominating factors, other influential factors (e.g., climate or transportation) is not involved in this study. Fifth, the study mainly concentrates on spatially quantitative analysis. Qualitative approach is not sufficiently considered. Sixth, dynamic analysis based on temporal data is not involved due to data availability. Seventh, rural leisure is not involved in this study due to the paper length range. In addition, rural leisure could be a potential solution for balancing the imparity of urban center and urban suburbs development through facilitating people flow. Eighth, inter-regional leisure is not included in this study, involving inter-city tourism etc. Ninth, specific leisure venues are not involved in this study due to this article length range. Given the variety of leisure venues, certain leisure venues might be in dispersal pattern. In addition, what are the spatial distribution patterns of every particular type of leisure venues and how mutual correlation occurs among different types of leisure venues could be further researched to indicate urban law of activities and development.
5. Conclusions
With rapid socio-economic development, urban residents are enjoying prolonged leisure time. Abundant leisure venues (e.g., cultural sites, gymnasiums, karaoke bars, cafes, cinemas, green land, amusement parks, etc.) have sprung up through all of China, especially enriching cities rather than the countryside. This article has analyzed the spatial distribution pattern of leisure venues as a whole in the metropolis of Wuhan. In addition, this study has also identified three dominating factors (i.e., policy, population and economy).
In this study, 86,520 leisure venues are involved. Spatial discrepancy is conspicuously discovered between urban central areas and urban suburban areas, indicating uneven development. The spatial pattern of leisure venues is highly clustered, verified through point pattern analysis. Three-level clusters are found and circled—1st level in red circles, 2nd level in orange circles, and 3rd level in yellow circles. Most clusters are located in urban central areas, on both sides of the Yangtze River, forming ‘the Leisure Eyes of Wuhan’. Sporadic low-level clusters are distributed in suburbs. Moreover, four types of clusters are ascertained: business-oriented, transportation-oriented, school-oriented, and mix-oriented.
In terms of the three dominating factors, policy is the most compulsory enforced one theoretically. Yet no systematic leisure policy framework is formed in fact, much less integrating spatial components. Population density is selected as the indicator representing population, while commercial centers economy. Leisure venues are normally aggregated in city center where most people reside. In addition, commercial centers generally attract more citizens and have more leisure venues. There exist close association between leisure venues and two other dominating factors (population density and commercial centers).
The conspicuous spatial discrepancy has been manifested. The severe uneven distribution of leisure venues exert impact on the recreational equity or balanced development between urban downtown areas and suburban areas. This might further influence social equity and justice due to the disparity of leisure accessibility among different districts. The striking disparity in the distribution of leisure venues might lead to an imbalance of leisure demands and supply, especially between city center and urban suburbs. ‘Three Townships of Wuhan’ (i.e., the metropolitan area) has two 1st-level leisure venue clusters, respectively in Great Hankou Township and Great Wuchang Township, except in Great Hanyang Township. This indicates supporting the commercial centers in Great Hanyang Township could decentralize the leisure function of city center, and meanwhile easing the development pressure of the metropolitan area. In addition, promoting rural leisure industry might be an effective solution to eradicate imbalanced development through flow of people, material and information. More investment in commercial centers, transportation modes (e.g., metro lines) and reallocating key universities could be the further step for strengthening regional leisure function, attracting more people, thus facilitating economic development, satisfying cultural needs, enhancing social communication, promoting social equity and triggering urban vitality. This study contributes to policy-making of leisure land optimization for guiding healthy leisure life and uplifting urban competiveness.

 ,
, 


