Article

Channels to West: Exploring the Migration Routes between Romania and France

by
Marius Lupșa Matichescu
,
Alexandru Dragan
and
Daniel Lucheș
*
West University of Timișoara, 300223 Timișoara, Romania
*
Author to whom correspondence should be addressed.
Sustainability 2017, 9(10), 1861; https://doi.org/10.3390/su9101861
Submission received: 19 July 2017 / Revised: 5 September 2017 / Accepted: 6 October 2017 / Published: 17 October 2017

Abstract

:
The integration of East European Countries in European Union has long-term consequences, with migration being one of the main social effects of this process. From an economic perspective, the research on migration has attracted considerable attention, whereas the analyses focused on the social networks are more scarce. The importance of these social networks becomes more substantial due to their quality and ability to reduce costs, risks of movement and uncertainty. Although the migratory networks are known at national levels, there are very few data related to the territorial distribution of migration network between origin and destination areas. In this context, Romania registered the highest level of emigration toward Western European countries, and this case study offers illustrative insights for the broader literature. In order to illustrate the territorial distribution of migrants’ network between Romania and France, we used an exhaustive analysis of the trajectories of all clients who used one of the largest transport companies operating between Romania and France (8094 cases). Using the benefits of this evidence-based approach, we identified the regions and the Romanian towns most affected by the migration phenomenon. Complementary, we illustrated the territorial distribution and the preferred destination regions in France for the Romanian immigrants. We present the migration networks that exist between the towns of the two countries and identify the intensity of each migration circuit.

1. Introduction

The changes that Romania experienced after the fall of Communism have had various impacts on its society. One of the most visible measures is emigration, which has affected a considerable part of its population. It is a difficult and laborious task to estimate the number of Romanian migrants; some researchers and institutions offer various estimates: an OECD report shows that in 2007, the year Romania joined the European Union, the country held the first position, even above China, when it came to the number of emigrants in OECD countries. Moreover, the same report estimates that in 2011, more than 3.5 million of Romanians went abroad, i.e., more than 17% of its total population [1].
Romanian emigration has experienced its major period of growth and development not due to the involvement of State institutions but because of the social relation between the emigrants. The growth of the migration rate in absolute terms throughout the European statistics and the Public Opinion Barometer [2,3] corroborated with the decrease in the migratory rate in the official statistics and establishes the fact that the migration has experienced a change of framework in which it had previously developed. After the migration of ethnic groups, it developed not due to the intervention of the state institutions, but within the framework of social networks, by using the social capital, family networks or even acquaintances. Experts in Romanian migration, [4,5,6] in referenceto Massey’s theory [7] argue—in reference to Massey’s theory (Massey, Alarcon, Durand & Gonzalez, 1987) on the role of social networks in the development of migratory process—the institutions, that NGOs as well as religious groups are the institutions that, once organized in a transnational context, could promote the development of the migratory phenomenon.
One of the political events that facilitated migration in Europe that created massive population movements was the accession of many countries from Europe to the European Union [8]. Studies on Romanian migration [3,4,5,9,10,11,12] have been carried out, which allow us to observe the regionalization of this migratory flow. Dumitru Sandu considers that during the period of 1990–2001, migration is characterized by a clear structure where migrants choose specific destinations [3] according to their origins in the home country. Migrants from the Moldavian region tend to move towards Italy and Israel whereas Transylvanian and Muntenian migrations are strongly oriented towards Hungary and Turkey, respectively [13]. Since 2001, the level of regionalization has diminished considerably and for the seven historical regions, Italy has become a major destination. The region of Muntenia remains an exception; the migrants from here tend to move towards Spain [3]. One of the first scientific approaches focusing on the regionalization of the Romanian migration to Spain was developed by Marcu, in 2008, stressing the fact that there is a strong correlation between the regional development and the emigration regions [14]. Romanian migration was mainly channeled to Italy and Spain: recent countries of immigration, having a fast economic growth, a high demand of workers and a policy open to economic migrants [15]. In consequence, in 2010, Romanian migrants constituted the highest represented foreign group in Italy (968,576 persons residing legally) and the second largest in Spain (843,775 persons). Germany, France and the UK—countries with a long tradition of receiving immigrants—were placed far behind Italy and Spain, with 50 to 100 thousands migrants to each country [16]. However, Romanians in France were the largest group among those residing for economic reasons (about 4000 entries in 2010) [17].
If Italy and Spain remain the topmost countries in terms of the number of Romanian emigrants and the studies on this phenomenon, the other countries hardly constituted a center of interest for the researchers in migration studies. Looking at the case of France, which represents the fourth destination country of the Romanians, apart from the research carried out by Dana Diminescu on the Romanian community from the northern part of the country [18], which has emigrated towards Paris, there are no other regional studies on the migration in France. However, these two countries have old economic and cultural relations and the number of Romanian emigrants is growing.
Our article aims at analyzing the migration routes from Romania to France, starting from the year 2007. This period corresponds to the integration of Romania in the European Union and to the period that witnessed the largest number of persons leaving the country—549,000, France being the fourth European destination, after Spain, Italy and Germany [19]. Romanian migration towards France raises the question of potential existence of regionalization [14]. In this respect, we aim to identify the Romanian regions from where migrants left for France. Secondly, we will investigate the following question: in which regions of France have these migrants settled down? Finally, the last question related to our research deals with the most important migration routes that have formed between the Romanian regions and French regions.
We used the entire customer database of one of the main bus company in Romania, analyzing the travel undertaken by all the clients between Romania and France, in 2007. We began with the assumption that the departure cities do not only include the population of the city itself but also that of small towns and villages that are in the immediate vicinity. The originality of this study therefore lies in the regionalization of migratory flow towards France. In the absence of information at this stage, a hypothesis cannot be established. For this reason, we do not want to propose hypotheses, but we aim to explore the spatial distribution of migration trajectories at regional level between Romania and France.
The article is divided into 5 parts. The introduction includes the context and the aim of the study. The second part represents a conceptual basis for analyzing the migration routes between Romania and France. In the third section, we will present the methodology we use, namely, an operational definition, the databases used and analyzed, the population and the sample studied, but also the limits of the study. The results are focused on the spatial aspects of Romanian migration to France in 2007, specifically on departure and arrival regions, from the point of view of the intensity of migration; a fact that we will explain and discuss in the end of the article.

2. Conceptual Basis for Analyzing the Migration Routes Existing between Romania and France

The families as well as the community of origin represent an analytical framework for the migration studies. However, the economic factor will not be denied. The core of the discussion will be focused on the migratory network and on the regionalization of the migration having a potential impact of the territorial complexity on migrants’ decisions and evolutions.
The consideration of family as an important actor in emigration and the community of origin as a reference point in determining the relative deficiency, as a probable source of emigration, have influenced the emergence and development of new theories on migration. If the theories that we deal with in this article are based on economics, justifying migration through “micro” or “macro” reasons, other theories attempting to justify migration are social in nature. Contrary to the main-stream, non-economic factors were introduced in the preexisting decision models, not as marginal appendages, but as elements central to the decision process. Due to these theories, the social capital, the psychological costs, the family and the networks become the factors that are taken into consideration in the decision process. It is thereby perceived through the logic of heterogeneous preference, and not through a process based uniquely on economic considerations.
This does not mean that there is no role for economic factor in the migratory decision process, but we are positing the idea that it should not be the only criteria for analysis. Boswell considers that for the development of such model, in which economic approach is one of the approaches among others, as in sociology, or in political sciences, the research work should begin with a detailed observation of the specific social groups, rather than provide general assumptions related to maximization of utility and rationalization [6] (p. 522).
With this new type of approach, migration theory will gain not only in terms of new factors that are taken into account in explaining the decision-making process, but also from a methodological point of view, by introducing the community through an analytical framework. These new theories render Faist’s criticism in The Volume and Dynamics of International Migration and Transnational Social Spaces [20] obsolete. This criticism was presented to economists, who, in the explanation of the migration process, have traditionally provided micro or macro theories as economic motivation for migration, ignoring the meso-level, the role of migration network and social capital in the decision process. The specificity of these theories, therefore, lies in the fact that they occur at the meso-level and put the emphasis on the social capital of individuals.
In this process, migration is perceived in relation to the “migratory network”, a notion that has a long tradition, starting with Thomas and Znaniecki [21]. The originality is part of the central role played by the notion in the investigation and explanation of the process; the latter does not call for a detailed elaboration. The migratory network can be defined as a set of interpersonal relationships that links migrants returning to their host countries with friends or other individuals from their native land. They provide information, financial assistance, facilitate employment and accommodation, and offer support in various forms. By performing these services, migrants reduce costs and uncertainty involved in migration, thereby facilitating it at the same time [22] (pp. 42–43).
In order to advance in our theoretical trajectory, we can consider, like Douglas Massey, that “migratory networks could be considered as a form of relational capital that allows access to other goods of economic value such as employment or higher wages” [7]. From this point of view, Massey incorporates migration theory into the social capital theory, thereby associating himself with such renowned names as Pierre Bourdieu or James Coleman.
In this respect, the network’s key role today has been to bring about a significant intensification in migratory flows when it remains largely unrestricted. The importance of these social networks becomes more substantial due to their quality and ability to reduce costs, risks of movement and uncertainty in a general context where entry into the country is increasingly becoming difficult. Similarly, in this migratory network structure, other intermediary institutions like volunteer missions, humanitarian groups, having their own discourse and various objectives, offer assistance to migrants to let them overcome entry barriers in their host countries. However, the insertion of these institutions within the notion of social capital does not seem to be as simple as in the case of networks.
Moreover, the migratory network is the principal mechanism that makes emigration a self-perpetuating phenomenon. These networks tend to grow and become wider and denser. All the movements that are carried out represent resources for those who stay back and at the same time facilitate all future movements thereby participating in network growths and their future expansion. The increase in the size and importance of migratory networks has led to the appearance of the term in common parlance “chain migration” [23] (p. 292).
The development, or the lack of it, of the migratory network cannot be fully analyzed without taking into account the local culture, the intensity and the nature of relation that exist between the members of the community. Cultural variables such as expectations for mutual assistance (care or the help others if necessary) [24], loyalty (support for friends or for the family even if there is a conflict of interest) can influence the type of migration in which the migrant participates. He can, for instance, migrate after observing the success of other migrants, as in the theory of Manski [25] or organize networks and migratory chains.
In direct connection with the migration network theory is the definition given for migration by Kritz, Lim Zlotnik in their work, International Migration Systems. A Global Approach [26]. They consider the migratory system as spaces characterized by relatively stable relations between a group from the host country and another from areas in the country of origin. These types of relationships do not only exist due to migration but also through links that are supported by networking and other ties of various natures. These ties and multiple interrelations offer the most appropriate context for the analysis of migratory flow. These structures should be adapted to integrate the rest of the theoretical explanations by considering all the important actors, such as network, intermediary actors and especially the State.
From a territorial point of view, regions (at origin and destination) are structuring the migration field; the transnational fields represent more than interactions between societies, i.e., a “configuration of interactions among clusters of sending micro regions in Romania and receiving macro regions, formed by clusters of receiving countries” [27]. It reminds us of the suggestion by Collyer and King, that mobility is more significant than capital factor in global inequality [28]. Thus, beyond the dynamics of the spatial mobility of migrants, the focus can be placed on the space-related conditions, on the regional and local social context, on urban-rural interrelations and on the economic specificities of migrants’ spaces [29]. The link between sending and receiving regions develops inside both a culture of migration [30]—redefining there the social spaces—the communities and the transnational circuits.
If we consider human capital as a source of wealth [31], the mobility of individuals is stressed as an important factor behind knowledge transfer and the competitiveness of regions [32,33]. Migrant workers are using their skills in the arrival region from now on, contributing to its performance, but they are also bringing a cultural baggage. At this point, territorial clusters are becoming a key factor naturally created, as migrants’ needs are similar, from gastronomy, sociability or transport routes to their home country [34]. Thus, a geographic analysis on Romanian migrants in France is necessary as a preliminary base for the understanding of this phenomenon.
Like Faist [35], we consider that “the network constitutes an intermediate level and a relationship between the explanation that concerns the micro level, where the decision is individual, and the macro level where the decision is based on the structural determinants”. Meso-level analysis, by virtue of its link between micro and macro levels, becomes a bridge through which an important limitation of thought on migration is overcome [23] (p. 292).
The network therefore represents a very important element in our approach to the migration process theory. Even if the importance of social networks could be easily overestimated, we can conveniently say and assume that the network is one of the most important factors that could explain migration [23] (p. 292). Using a vocabulary of extension, we can then say that many migrants migrate because others, with whom they are in contact, have already migrated.
According to the literature available, Romanian migrants have extensively used migrant networks in their migration paths across Europe. In this regard, the case of Romanian immigrants from Borșa (north of Romania) living in Milano is emblematic [36]. In the same way, the scholars Tim Elrick and Oana Ciobanu have another inportant contribution towards the understanding of Romanian migration network. By analysing two Romanian comunities in Spain that come from two diferent Romanian villages, the authors highlight how networks can mediate political changes [37]. Another complementary studies conducted on Romanian communities living in Western Europe have put in evidence another migrant’s network and their specific way of development [38]. Furthermore, specific analyses were conducted on professional groups in order to analyses how migration networks are affected by the professional career. In this regard, we highlight the studies conducted on the migrations of doctors [13] and ITC engineers [39] from Romania.
Even if these studies, and some others as well, bring information about Romanian migrant’s networks, there is no study yet that aims to map how Romanian networks are spread out in the destination country. This study will offer not only a better image related to the territorial distribution of Romanian immigrants and their network but could also offer new opportunity for the study of the new and unstudied migrants realities.

3. Methodology

3.1. Operational Definitions for Our Terms

In order to identify the migration routes between Romania and France, we will carry out a statistical study. By following both Massey’s observation on the role of migration networks and Faist’s proposal [35], which suggest the meso-level approach to migratory analysis, we will look at the migration patterns that exist in Romania. Although the migratory phenomenon has been dealt with in several studies, the causes, development and effects of the process are fairly well known at the national level, yet it remains a little known phenomenon in terms of migratory regionalization.
To have a clear picture of Romanian emigration towards France, recreating an image of the migratory circuits between these two countries represents the first step in this process. In terms of geographical coverage, our meso-level research will be realized at the town level. We will perceive the town in geographical terms, but the boundaries of the locality are always blurred. For this reason, we take as a reference unit the city and its neighboring region. These regions are not only limited to the city but also to all the villages and small towns that are present in the vicinity of the city in question.

3.2. Choosing the Data

There are some possibilities of studying the directions of the migratory flow. In this respect, we highlight the official data and the information obtained from representative studies at national level. Both of them could offer important information in this regard, but few correlations could be done between the region from the departing country and the region of destination country.
With reference to the official data, we can have information on the correlations that exist between Romanian regions and destination countries. In this type of statistics, we have access to the information on the country of destination but not the region in which the migrant arrives. Moreover, these data refer to the departmental regions (We will use the French term of “department” for designating the sub-regional level (county)) defined from a purely political-administrative point of view, and it is unable to allow a more detailed analysis at the regional level around the large and medium-sized cities, as we had proposed to carry out for our research at the meso-level.
In order to carry out this study on migratory regionalization, we aimed at working on a secondary analysis. The latter is based on data that are not produced by the same researcher who performed the analysis. This is the particularly the case when s/he uses data produced by institutions or by companies (ministries, associations, companies, research and study centers...) without having taken part in the developmental phase of this data» [40] (p. 14).
In order to achieve a picture closer to the reality of our terrain, we have chosen one of the biggest bus companies operating between Romania and France. This type of data is relevant because it has a number of advantages for our progression. Indeed, due to this database, we have access to information related to all the departures made from all big and middle-sized Romanian cities.
In addition to this, these statistics also provide both departure cities from Romania and arrival cities in France. Even if the arrival city in France is not necessarily the destination city for the migrant, we assume that the city of arrival is at least located within the destination region. Under these conditions, this type of data makes sense in achieving our objectives since we can precisely identify the Romanian regions having the highest rate of emigration while also having access to the French regions favored by emigrants.

3.3. The Population and the Samples Studied

Our sample is based on 8094 cases. This represents an exhaustive number of individuals who made a movement between Romania and France with one of the largest international bus transport companies in the year 2007. We chose this year for two particular reasons: primarily because Romania joined the European Union in 2007, enabling the Romanians to enjoy the right to free mobility within Europe and to work in France. Secondly, the year 2007 recorded the highest number of emigrants in the history of Romania, 549,000 [1].
As for the dispersion on the Romanian territory, according to our information, it covers the departures that have been carried out during 2007 from 44 Romanian cities, thereby representing 35 of the 41 regional departments of Romania. These cities represent, in most of the cases, the main town and the second most important cities of the departments. For France, the destination places are represented by 16 regions located around the 16 largest French cities.
Thus, the sample on which we will carry out our analysis and measurements will be a database of more than 8000 people representing 44 departure points around the largest Romanian cities towards 16 French regions during the year 2007.

3.4. Analysis and Interpretation of Data

The data used were not intended to be subjected to statistical processing and socio-geographic analysis in their primary form. Before proceeding to primary data analysis, we coded the starting places in the home country using the following variables: the city, the department and the region of departure. The arrival locations have also been subjected to this coding.
Thus, the relationship between the Romania regions and the French regions that define the strongest migration routes will be analyzed through statistical operations: correlation, cross-tabulation, percentage comparison and chi-squared test. All statistical calculations that we will use in this approach (frequency analysis on our database) will be processed using the SPSS software. The data obtained from our analysis will be combined and analyzed in relation to the 2002 census, this one being more adapted for such analysis, compared the one from 2011, when the data are already affected by migration.

3.5. Limits

We identified two types of limitations for our analysis: the limitations that depend on the means of transport involved and the limitations arising from the specificity of the individuals included in our sample. With respect to the first category of limitations, we note that bus is not the only means of transport for traveling abroad. Other means such as car or plane represent other alternatives that are not taken into account in our data. Still, we assume that in this period, the large majority of people used the bus to go abroad, as this mode of transportation is the most representative of Romanian migrants.
Moreover, the company that we chose for our data on departures is not the only transport company operating in Romania. However, this company has the highest geographic coverage at national level, having the greatest number of bus stations in Romanian localities. Companies under study have national coverage, or operate at regional level, thus allowing access to international transport to and from Romania. Under these conditions, even if our data have certain limitations, we consider that they have a high level of representativeness of the trends showing Romanian migratory flow towards France.
The second category of limitations is linked to the characteristic of the individuals included in this study. In fact, our data do not differentiate between the specificity of the individual as migrant and tourist. Therefore, tourists are also included in the notion of migrant in our samples. It is for this reason that for touristic cities like Paris, our data contain a relatively higher number of tourists. However, this is an exceptional case.
We are aware of the complexities of our data; their quality remains feasible and scientific. It is a substantial sample that consists of 8000 individuals coming from almost all the Romanian departments, and who all made a trip to France. Other means such as transport by car and plane still remain expensive for a Romanian migrating for economic reasons. Given the specificity of Romanian migration, an economic migration as we have observed, we consider that bus transport from Romania to abroad remains an important medium for the Romanian migrants, since it is accessible from the financial point of view.

4. Results

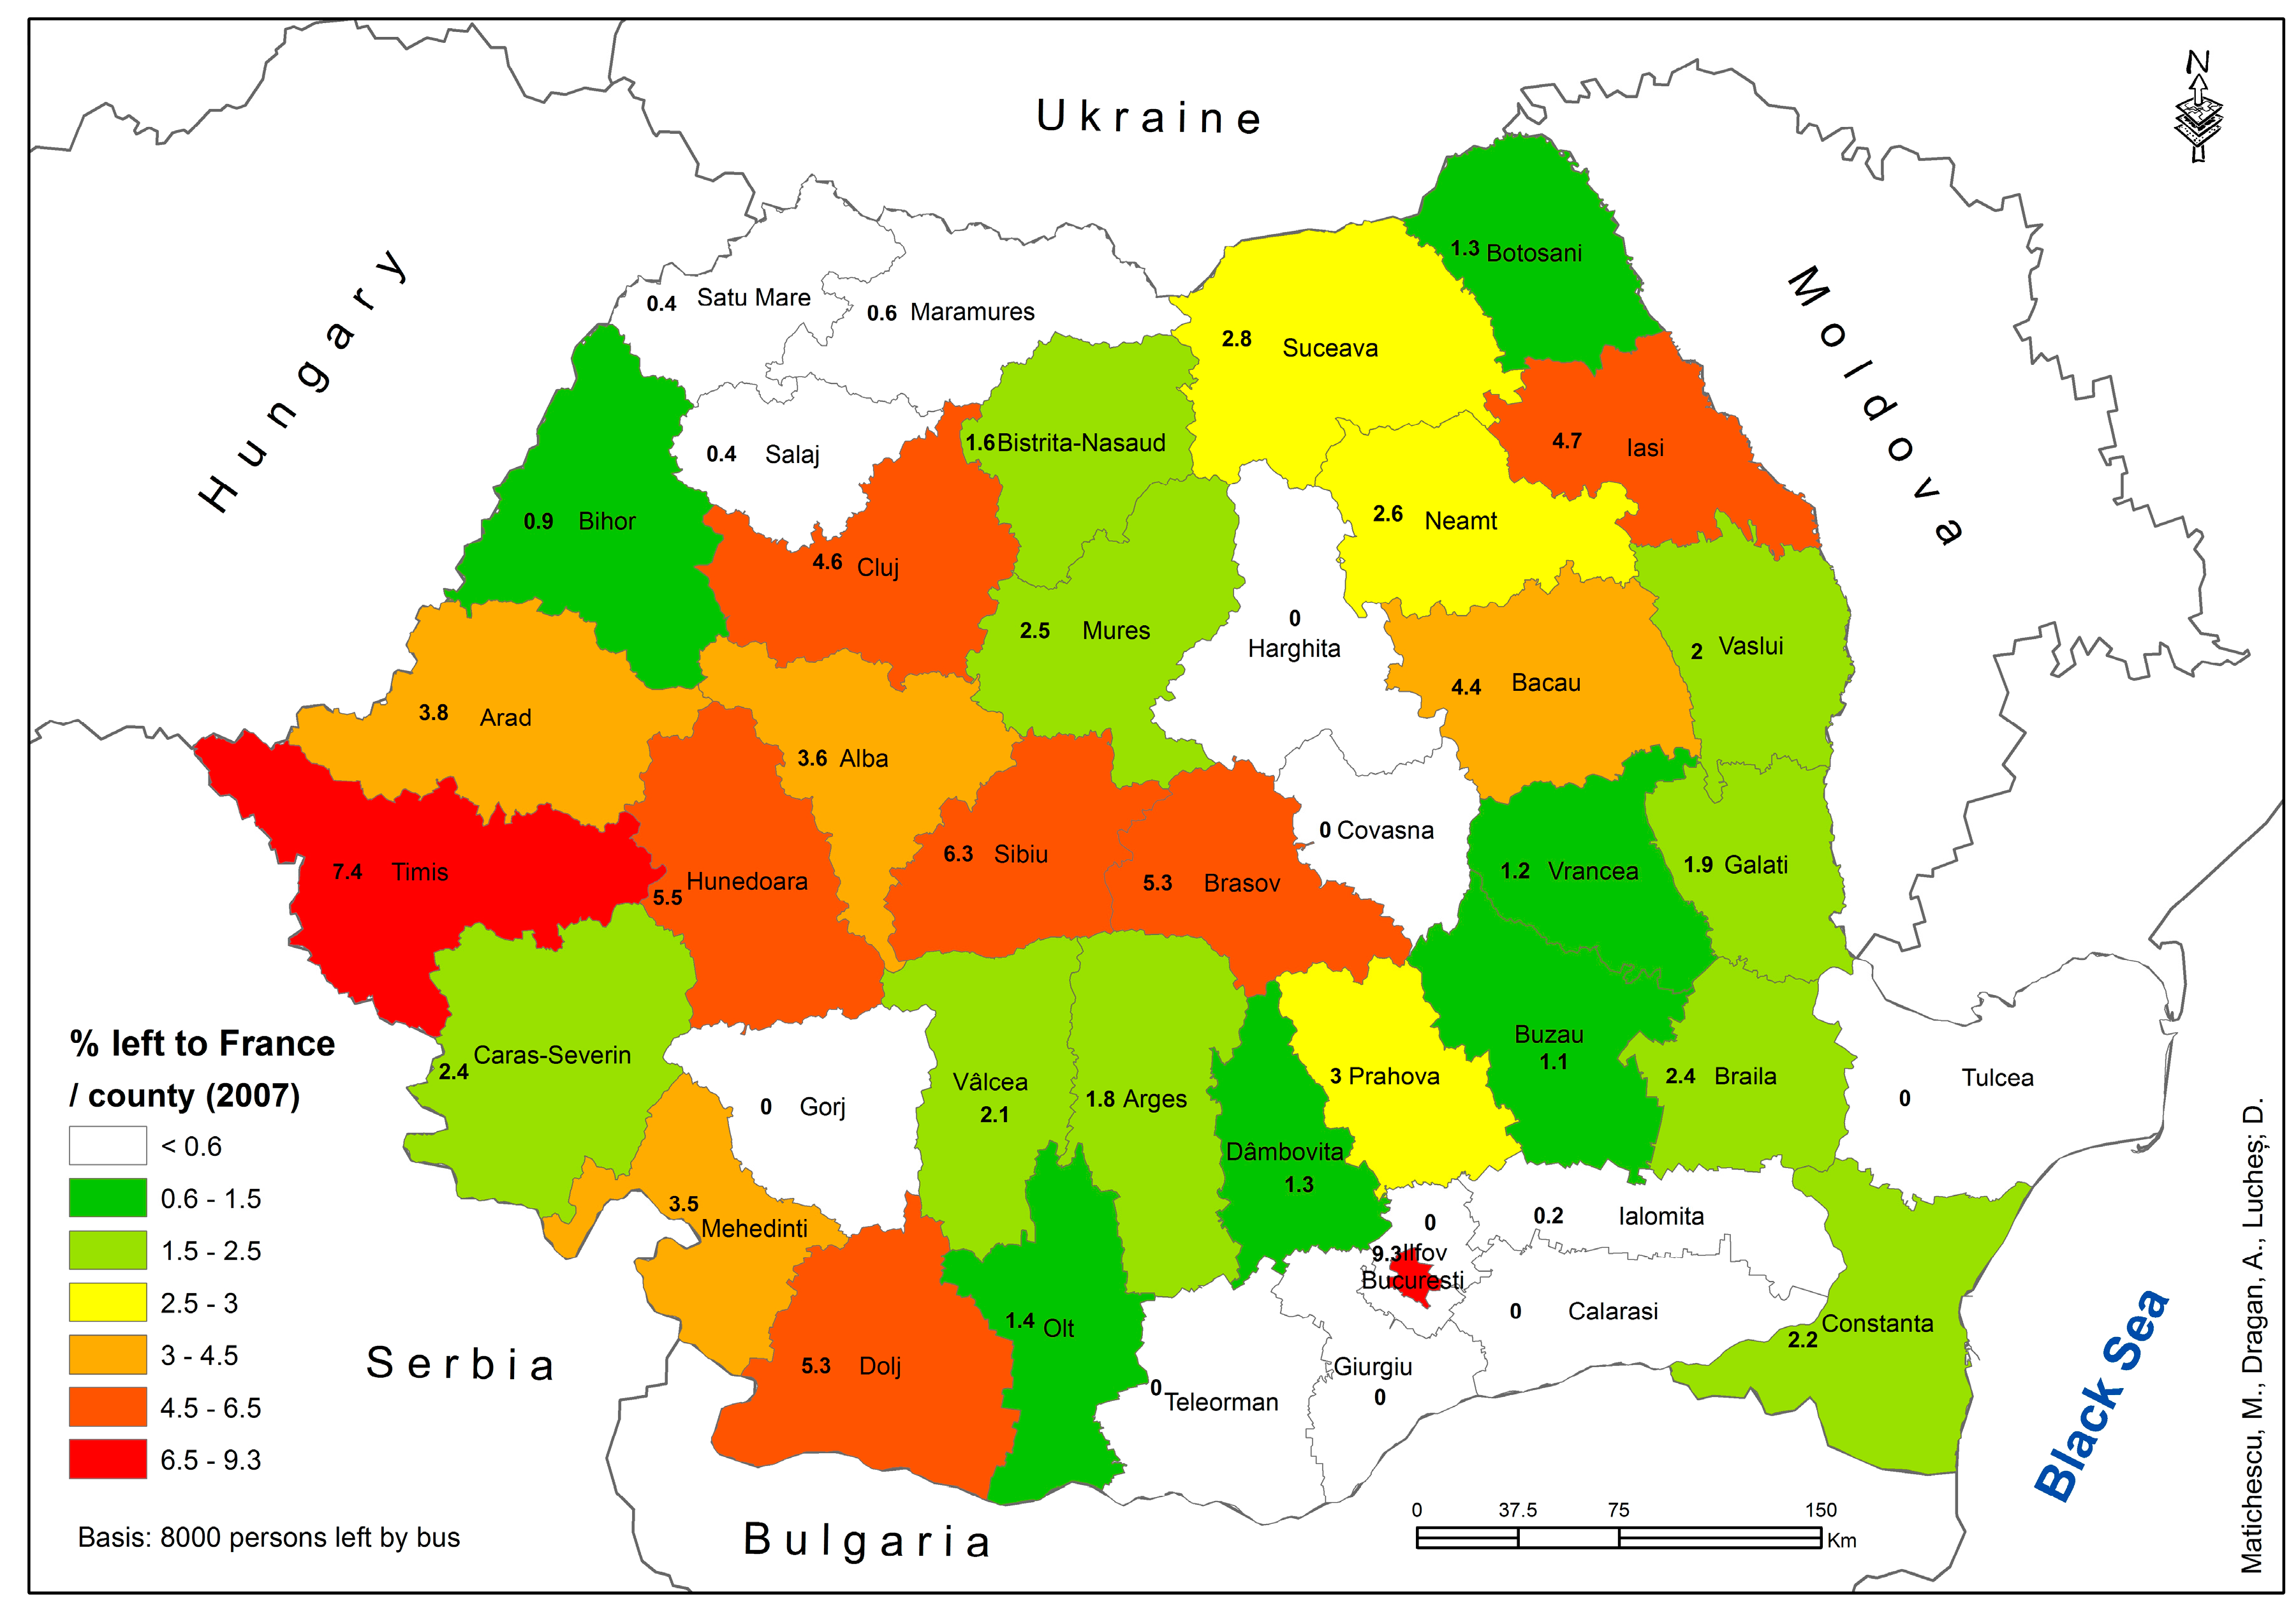
4.1. The Departure Regions of Romania

Although the emigration phenomenon has become a subject of several studies, with its causes, development and effects being fairly well known at the national level, it remains a relatively unknown phenomenon in terms of migratory regionalization. Apart from some studies carried out at the locality level [3,10,38,41], other studies remain representative of the national level and do not enter into detailed study of a region [11,42,43]. Moreover, our approach will be the first one that can present an image of migratory circuits between all regions of Romania and France. The conception of an image of the migratory circuits between the two countries constitutes the first step in this process of painting the picture of Romanian emigration towards France. We will present the measures that we applied in order to identify the directions of the migratory circuits between Romanian regions and some regions of France.
We calculated the rate of emigration to France, which corresponds to each department of using the data from the bus company combined with the one from the 2002 census. In order to calculate this index, we have collected the data corresponding to the cities of the same department. In those departments where we analyzed many cities, we collected data from all these cities in order to obtain the data corresponding to the department in question. In those departments where only one city was taken into account, we extrapolated these data for the entire department. The motivation for our choice for this extrapolation is presented in the following lines.
Our approach for extrapolating data from cities to department level is based on the specificity of our data. Our figures show the departures made in buses from the largest cities of Romania. We begin with the assumption that the departure cities do not only include the population of the city itself but also that of small towns and villages that are in the immediate vicinity. We confirm this assumption by the fact that between large cities, small towns and villages that are in close proximity, there is a strong connection and interdependence (Since, for economic reasons, international transport companies only operate in large cities and not in villages or small towns, in order to maintain strong connectivity between other towns of the department and cities/main cities, our assumption is that the departures made from the major departmental cities represent all departures made at the departmental level) [42,44].
As far as our study is concerned, we have at least one city at each department’s level, from which the departures were made. In all cases where only one city is mentioned, it is the primary location in the department and the only one from where the departures were made. Thus, by grouping all the departures carried out at the departmental level, we can say that the data become representative of this level. The result of this approach, as we have seen, highlights the fact that the departments with the highest emigration rates are the ones having the highest rate of emigration from their major towns. The average rate was 238 departures per department and it corresponds to 2.93% of our samples taken at the national level.
Using this standard deviation of 2.10 for the percentage analysis, we have defined four categories of departments (see Table 1). The first category concerns the departments with a very small migratory rate represented by the cities that have an emigration rate between 0% and 1%. In this category we find the departments in the North-west of the country: Satu Mare, Salaj and Bihor and another department near Bucharest, Ialomita.
We want to draw attention to the following question: why is the emigration rate lowest in these departments? For the region surrounding Bucharest, the low level of international migration can be explained by the proximity to the capital, which attracts the labor force. Studies on urban dynamics show the capacity of Bucharest to act as a magnet and to attract people from the departments around it [45]. As for the other three departments in the North West part of the country, there are data and sociological studies that could explain their reduced presence on this migration route. Dana Diminescu in her study on the young people of Satu Mare, considered Romanian emigrants moving to France in the early 90s as pioneers [18]. In this regard, in this region we have a strong migratory community, which is well developed and has already accumulated a considerable amount of resources. Considering that the bus transportation concern mainly migrants with low level of resources, in the first period of emigration, we assume that people from the north of Romania, being a developed migration community, do not use national bus companies anymore. Moreover, having an old migration network, the individuals from the North developed their own local transportation opportunities (local companies, relatives, neighbors, etc.). More precisely, in the three departments, migration to France is not necessarily less stronger than in other departments, but because people have emigrated for a long time from these regions, they developed their own means of transportation [18].
The impetus for showing that people in this region use buses less than any other means of transport is that the resources of emigrants are growing in direct proportion to their time spent abroad, and by using these resources, one of the first purchases made by the Romanian emigrants is a personal vehicle. Resource growth can be associated with the purchase of a car and thereby to the movement between the two countries by immigrant’s own means or with the assumption of the involvement of other factors in regard to the choice of means of transport.
The second category of department is the one which has an emigration rate between 1% and 3%. In this category, with the standard deviation below average, we find the Romanian departments of north, north east, east, south east and south.
Departments with an above-average emigration rate towards France, i.e., between 3 and 5 percent and more than 5 percent, are located in the central and western part of Romania. If one divides the Romanian map into two from the west to the east, it is possible to observe, apart from the Romanian capital and two departments, a very strong regionalization between the west and the east. In 2007, the western part and the central part had an above-average migratory rate towards France, while the emigration to France was below average for the east, north and south.

4.2. The Intensity of Emigration among the Population of the Department

In order to find out whether the regionalization of emigration in relation to cities and departments is an effect of their demographic quota, a question is posited in our analysis: if the emigration rate is higher for some cities and lower for other cities, is it the result of the size of the city? Bucharest has the highest migration rate, but it is, at the same time, the largest urban center of Romania. This interrogation thereby becomes central to our study; it is about the relation between the emigration rate and the size of the city.
By comparing the emigration rate with the size of the city/department, we can relate cities having a larger, smaller or equal emigration rate as compared to their demographic quota. More precisely, we can observe the cities having a higher or a lower emigration flow towards France in comparison to their own sizes. In order to compare these two variables at each city/departmental level, we will have to compare the emigration rate with the demographic contingent of the same city/department in relation to the national total.
But before we move on to this type of analysis, we interrogate into the possibility of lending our data to this type of analysis. Our data represent the departures made from the principal towns of the Romanian departments. As the data are not representative only for the city but for the entire area around the city or even for the whole department, the calculations that we have made are not possible by using our data in their primary form at each city level; to be more precise, although we may have official statistical data on the size of the population in each city, we cannot use those data just at the city level. We cannot substantiate it for a simple reason that all the emigrants who left one city or another did not live in the city in question.
Following this logic, our approach, which aims to relate the emigration rate (A) to the demographic quota (B), becomes feasible only at the departmental level. To implement this approach, we compared the emigration rate percentage of the department (A) with its population percentage at the national level (B). Taking the official population census figures from 2002 we have calculated the population percentage in each department.
  • A = Emigration rate per department calculated in accordance with our calculations
  • B = Population percentage of the department in relation to the total population
In a uniform emigration situation of the same intensity throughout the department, for an X percentage in the national population, one must have the same X percentage for the emigration rate. Specifically, the population size of each department must represent, in terms of percentage, the probable emigration rate of the same department. For example, a department with 3% of the population must have a probable emigration rate of 3%. Therefore, the population rate is equal to the probable emigration rate (C) for the same department.
  • C = probable emigration rate per department
  • B = C
Once we know the probable emigration rate for each department we can calculate the emigration intensity in each department. The intensity of the emigration process (I) in the department is the result of the difference between the actual emigration rate (A) and the probable emigration rate (C)
  • I = intensity of the emigration flow per department
  • I = A − C
By calculating the difference between the actual emigration rate and the probable emigration rate, we can know from which department emigration is more intense or weak towards France, in each case. In the case where I (A − C) is a negative number, emigration could be said to be below its expected rate in relation to the population. Therefore, the intensity is lower in this department.
In the case where intensity (I) is a positive number—thereby suggesting that the actual emigration rate exceeds the probable emigration rate—we can conclude that the department experiences an intense rate of emigration towards France. Case 0 represents the ideal case in which the actual emigration rate is equal to the expected emigration rate.
For example, in our sample, the department of Timis has a real emigration rate (A) of 7.4% at the national level. At the same time, its population (B) is equivalent to the probable emigration (C) at national level, representing 3.12%. Since the result of the difference between the actual emigration rate and that of probable emigration rate is a positive number, it may be deduced that emigration towards France is an intense phenomenon in this department. Moreover, since the number obtained by this difference is equal to the probable emigration rate, it may be said that the actual emigration is two times higher than the probable emigration in that department. It means that the emigration flow towards France in the department of Timis is very intense and involves a very large percentage of its population.
The case of Timis department:
  • A = 7.4%
  • B = 3.12%
  • C = 3.12%
  • I= 7.4% − 3.13% = 4.27%
According to our calculation, in other departments such as Bihor, the size of the emigration rate is much smaller than the size of the probable emigration; as a result the intensity of emigration is very low. Even though the department holds 2.77% of the national population, the emigration rate in this department, calculated at the national level (A) is only 0.9%. In this case, (I) is a negative number, (−1.87), which means that the emigration in this department is a process that does not concern a very large percentage of the population. Therefore, the intensity of the emigration phenomenon is very low in this department.
From a similar viewpoint, the intensity of emigration to France was calculated for all the Romanian departments. They are presented according to their intensity (Figure 1).
Firstly, we defined four categories of departments in relation to the intensity of the emigration phenomenon (I) (Between −2% and −1%, “between −1% and 0%”, “between 0% and 2%” and “more than 2%”). The first category, “between −2% and −1%”, defines the departments with very low migratory intensity. The “between −1% and 0%” category is specific for departments with low emigration intensity while the “between 0% and 2%” category defines the departments with high migratory intensity. Finally, in the last category, we find the departments with very high migration intensity. In these departments, the actual emigration rate in some cases is twice as large as the probable emigration rate that corresponds to the size of the department.
As Figure 1 shows, we can observe that the departments of the west and the center have the highest intensity of the migration process. The departments of Timis and Sibiu are those where the emigration is the strongest, exceeding several times the national average. In the same category of departments in which the intensity of the migration process is very high, there are other departments such as Mehedinti, Dolj, Hunedoara and Brasov.
In the western part of the country also we can find the departments where emigration is enclosed in a standard deviation above average. More precisely, these departments have an intensity “between 0% and 2%”: namely the departments of Caraş-Severin, Arad, Cluj and Alba.
In the same interval provided by the standard deviation, but lower than the average (with an intensity “between −1% and 0%”), we find most of the northern and eastern regions of Romania. Bucharest, Ilfov and Prahova fall into this category.
The department table is filled with the departments of northern Romania where the strength of the migratory process is the lowest in comparison to the size of their population. In this category are the departments of Bihor, Maramures and Satu Mare. The same situation can be observed for the departments around Bucharest: Dâmboviţa, Arges, Buzau, Ialomita or Constanta.
If we make assumptions about the departments in the north of the country, we can say that these results are the consequence of the limitation of our data, restricted to the bus transport. The migration by bus in 2007 is no longer representative of the population of this region having prospered due to long-term emigration. As a result of their prosperity and development of their migration network, as we assumed before, migrants may now prefer to travel by private cars or by plane or by local transportation companies to arrive in France.
With regard to very low emigration for the departments around the capital, the explanation that we are putting forward, and which remains to be verified later, refers to other aspects such as industrialization of the region and other economic indicators. Knowing that Bucharest was the most industrialized region of Romania, with the greatest amount of investment received after the fall of the communist period, it can be said that the region has always needed manpower. Competitive and diversified offers may have encouraged migrants to move towards the country capital instead of moving to abroad [45]. As far as the results of our approach are concerned, we have observed that the emigration towards France in the year 2007 specifically concerned the central and the western Romania. The departments of these two regions, as well as the capital Bucharest, are those that exceed the national average. The administrative centers of these departments and cities such as Timisoara, Sibiu, Deva or Bucharest, are the departure points that have not only brought together the population of the city but also the rural population around the city. Once the departments with the highest migratory rate were identified, the intensity of the migration process at each department level was the next question that our study proposed to answer. By comparing the emigration rate with the population of the department we have seen that the departments where emigration is very intense are the departments of the west, the south-west and the center of the country; in these departments, the migration towards France is the most intense in comparison to the population of the department.

4.3. Destinations Favored by the Romanians in France

Once the regions of departure and the strength of the migratory process in each Romanian region have been identified, the next question with which we try to engage in our study is that of the choice of settlement regions of emigrants in France.
In order to identify the most favored arrival cities in France by Romanian emigrants, we carried out a frequency analysis on the French cities where the individuals from our samples arrived. The frequency analysis of arrival cities is shown in Table 2.
As one can perceive on our map (see Figure 2), most of the Romanian emigrants had the city of Paris as main destination and by extension the region of Ile de France—42%. While Paris and the Ile de France account for almost half of the Romanian migration in France, the other half of the Romanian migration is distributed between three large cities, according to our calculations: Bordeaux, with 11%, Nice with 11% and Toulouse with 9% et and seven other cities that hold a percentage between 1% to 6% (Reims 1.17%; Cannes 2.73%; Montpellier 2.88%; Toulon 3.19%; Marseille 3.97%; Metz 4.24% et Strasbourg 5.84%). Other cities like Narbonne, Carcassonne, Avignon and Nimes with a percentage of less than 1% complete our arrival cities table in France.
With regard to the north-south regionalization, it can be observed that migrants are almost perfectly divided between the cities in the north of France (Paris, Reims, Strasbourg and Metz) and other cities related to our study that are located in the south of France, with the sole exception of Bordeaux.

4.4. The Migratory Circuit between Romania and France

Once the main destination cities have been identified, another question relevant to our study is whether there are strong correlations between the Romanian and the French cities. This new reasoning can help us to identify the principal migration networks between Romania and France.
Our next goal is to study “concomitant variations” [46], i.e., relationships or correlations between the departure or arrival regions. The main tool that we will use to study the relationships between the “departure regions” variable and the “destination region” variable is the cross-tabulation. It is a table showing the distribution of individuals according to two simultaneous variables. These tables are intended to highlight the influence of one variable over another (in order to identify the social determinants) or, in a simpler way, the dependence of a cross-variable (in order to show the existence of interdependence between the phenomena) [40] (p. 67).
The question to which this type of picture responds is “to what extent such phenomena depend on social characteristics.” Using the cross-tabulation as type of analysis for our study, we want to identify the extent to which the presence of a migrant in a French region is dependent on his/her departure from a particular Romanian region.
By taking the cities of arrival one by one, and making the calculations of the cross table, it has been observed that there are some cities in France where the emigrants come from some specific cities of Romania. In the case of Avignon, 21% of the migrant population comes from Iasi city/region, 7% from the region of Sibiu and 5% from the region of Piatra Neamţ. All other cities in Romania have an emigration rate of 0–2% towards Avignon.
Similar cases to that of Avignon can be identified for other city-pairs such as Cannes, where 27% of Romanian migrants come from the city of Iasi, Carcassonne, where 24% of the migrants are from the city/region of Târgu Mures, and Reims where, in a ratio of 33%, Romanian migrants come from Suceava. In the same category falls the city of Toulon where 20% of the migrants come from the city of Sebes.
The case of Bordeaux is different; we do not have a Romanian city from where most of the population arrives to this particular city. The highest percentage belongs to the city of Bacau with 8.7%, followed by Bucharest with 7.8%, Brasov with 7.4 and Braila with 6.7%. Some other cities like Timisoara, Craiova and Focşani have a percentage around 5%, while the others have a lower percentage of departure.
Marseille or Nice represent similar cases as Bordeaux. In Marseille, it cannot be said that the migrant population comes from a particular region/city of Romania. The population originates, in almost equal proportions, from several cities and regions: Iasi, Bucharest or Sibiu. In the case of Nice, apart from the migrants from Bucharest (15%) and others from cities with a percentage between 4% and 6%, such as Deva (6%), Ploiesti (5.7%), Sebes 6.4%), Targoviste or Timisoara (5%), the origin from all other cities is almost uniformly “distributed” among other Romanian cities.
For the city of Paris and the region of Ile-de-France, Romanians arriving in this geographical region come from Bucharest (8.3%), Sibiu (6.5%) or Timisoara (7.3%). Other cities are included in a normal trend curve, proof that the migration to Paris affected more or less all the regions of Romania.
If the analysis we have just presented highlights the cities from which most migrants come to the cities of France, another type of approach puts emphasis on the cities of Romania. By focusing on these Romanian cities, we can trace the preferred destinations in France from each city. More precisely, in the framework of first calculations, we identified the regions from which the immigrants come in order to settle down in Ile de France and other regions of France. In this type of calculation, only those regions are taken into consideration which have provided a large number of migrants, and because of a very low percentages of migration, one cannot see the migration trend for the cities having a very low rate. For this reason, we have chosen to carry out a second type of calculation in order to highlight the preferred destination for each city taken into account.
To identify the advantage of this type of analysis, we will take the case of the city of Turda (in the central part of the country, department of Cluj). As the number of migrants from Turda to Paris is not large enough in comparison to cities like Bucharest, Sibiu or Timisoara, it was not considered as a main Romania city sending migrants to Paris. In this second calculation of destination cities for migrants from Turda, we observed that 93% of its population included in our study chose Paris as their destination city. This information becomes very important for our study because it highlights the existence of a strong migratory network between Turda and Paris. In similar cases there are thirteen cities which have a percentage superior to 47% of departures to Paris: Arad (48.5%); Botoşani (62%); Constanta (48.9%), Craiova (56.7%), Dej (59%); Medias (70%), Piatra Neamţ (51.6%), Ramnicu Vâlcea (55.7%), Resita (62.8%) Sibiu (47.7%) Slatina (55.5%); Timisoara (48.6%), Turda (93.3%), Turnu Severin (54.7%).
But Paris is not the only city to become a favorite destination because, for Romanian cities like Bacau or Focşani, the main destination is Bordeaux in France. The city of Nice is also a destination chosen primarily by the migrants of Targoviste. This migration route was also identified through field work carried out by Swanie Potot in her research carried out between 1997 and 2000 [47]. Similarly, Nice, as well as Toulouse, are important destinations for those who come from Bucharest (see Figure 2).
We can observe by looking at these calculations that there is a strong relation of correspondence between the regions of Romania and some regions of France. The fact that more than 40% or even 50% of migrants from one region have chosen the same destination shows that there is a strong migration network between these two regions. Through this statistical approach carried out at the national level, our results on the existence of migration networks are again confirmed, indicating the presence of geographic clusters we treated in the first section of this article (see Figure 3).
In addition, geographic distribution, with regard to cities, is also an important phenomenon to observe. If we look at the Romanian cities that have as their main destination the Parisian region, we can remark that they are mostly part of the western and central regions of Romania. On the other hand, regarding migration to the south of France, it concerns the population coming from the east and the south-east of Romania.

5. Conclusions

Our study on the migration between Romania and France becomes very useful to complete the picture of Romanian immigration to France. Based on the sample size of more than 8000 people, our research represents the first study allowing to identify the spatial distribution of Romanian migrants travelling to France at a regional level. Our results show three categories of migration patterns toward Romanian departments, concerning the emigration to France.
The first category includes the departments with a very low migration rate, located in the North-West (Satu Mare, Salaj, Maramures and Bihor) and around Bucharest (especially Ialomita). As other studies already proved, the northern part of Romania is the oldest emigration area, with a very well developed migration network toward France. That does not means that in the four departments the migration itself to France is less developed than elsewhere, but over time, in this region, migration networks develop self-replicating and self-sustainable mechanisms, as Faist’s theory on transnational networks indicated. In this regard, in this region, people replaced international bus companies with their own local transportation opportunities (local companies, relatives, neighbors, etc.). Concerning the area surrounding Bucharest, an explanation confirms the WorldBank conclusions, arguing that the capital itself acts like a magnet for the population living around. Consequently, in this region, we have a high level of internal migration toward Bucharest, associated with the low level of international migration.
The second category, with an average level of emigration, includes departments of East and South-East of Romania. This area corresponds to an early wave of emigration, determined by an economic precocity and a low level of urbanization, as other scholars already indicated [14]. The migrants from these departments can be generally found in Italy and Spain.
The third category includes departments with a high level of emigration to France (Timis, Sibiu, Hunedoara, Brasov, etc.). These departments are generally more urbanized and economically developed, being generally situated in the Western and Central part of the country [14]. However, in these categories are included the regional poles of the country, such as Iasi and Craiova and especially Bucharest.
Moreover, our research helped us to obtain innovative results and to identify migration trajectories that were not yet presented in the broader literature. In this regard, we highlighted the pairs existing between departures and receiving areas: Turda and Paris, Targoviste and Nice, Sebes and Toulouse, etc. Overall, Paris remains the most important destination for the Romanian immigrants coming by bus in 2007, keeping the main characteristics of Romanian migration to France. They came from the western and central parts of Romania and from its largest towns.
Through this approach, we attempted to present the initial picture of the Romanian emigration towards France at the regional level. As our analysis indicates, emigration is highly regionalized from the point of view of intensity on the one hand, and on the basis of destination regions in France, on the other hand. These data confirm that Romanian emigration is an emigration of networks and these circuits are strongly regionalized in nature.

Acknowledgments

This work was supported by a grant of the Romanian National Authority for Scientific Research and Innovation, CNCS—UEFISCDI, project number 1/06.10.2016, within PNCDI III.

Author Contributions

All authors contributed equally to this work. All authors read and approved the final manuscript.

Conflicts of Interest

The authors declare no conflict of interest.

References

  1. Organisation for Economic Co-operation and Development. International Migration Outlook; OECD: Paris, France, 2013; ISBN 9789264200166. [Google Scholar]
  2. Organisation for Economic Co-operation and Development. International Migration Outlook: SOPEMI; OECD: Paris, France, 2016; ISBN 9789264258457. [Google Scholar]
  3. Sandu, D.; All, E. L’habitation Temporaire à L’étranger; Fondation pour une Société Ouverte: Bucuresti, Romania, 2006. [Google Scholar]
  4. Serban, M.; Stoica, M. Politici şi Instituţii în Migraţia Internaţională: Migraţie Pentru Muncă din România, 1990–2006; Fundatia pentru o Societate Deschisa: Bucuresti, Romania, 2007. [Google Scholar]
  5. Diminescu, D.; Lazaroiu, S. Circulatory Migration of Romanians; International Organization for Migration: Paris, France, 2002. [Google Scholar]
  6. Boswell, C.; Mueser, P.R. Introduction: Economics and Interdisciplinary Approaches in Migration Research. J. Ethn. Migr. Stud. 2008, 34, 519–529. [Google Scholar] [CrossRef]
  7. Massey, D.S.; Alarcon, R.; Durand, J.; Gonzalez, H. Return to Aztlan: The Social Process of International Migration from Western Mexico; University of California Press: Berkeley/Los Angeles, CA, USA, 1987. [Google Scholar]
  8. Boswell, C.; Ciobanu, O. Culture, utility or social systems? Explaining the cross-national ties of emigrants from Bora, Romania. Ethnic Racial Stud. 2009, 32, 1346–1364. [Google Scholar] [CrossRef] [Green Version]
  9. Saghin, D.; Luches, D. The influece of personal and professional variables upon the nature of immigration of romanan doctors to France: The moderationg effect of gender. Transylv. Rev. 2016, 49, 132–149. [Google Scholar]
  10. Favell, A. The new face of East—West migration in Europe. J. Ethnic Migr. Stud. 2008, 34, 701–716. [Google Scholar] [CrossRef]
  11. Matichescu, M.L.; Anamaria, B.I.C.A.; Ogodescu, A.S.; Lobont, O.R.; Moldovan, N.C.; Iacob, M.C.; Sorana, R.O.S.U. The Romanian Migration: Development of the Phenomenon and the Part Played by the Immigration Policies of European Countries. Rev. Cercet. Interv. Soc. 2015, 50, 225–238. [Google Scholar]
  12. Marcu, S. Uneven mobility experiences: Life-strategy expectations among Eastern European undergraduate students in the UK and Spain. Geoforum 2014, 58, 68–75. [Google Scholar] [CrossRef]
  13. Popa, N.; Luches, D. Etudier la médecine pour émiger? In Migration en Blanc. Médecins D’est en Ouest; L’Harmattan: Paris, France, 2014; pp. 83–100. [Google Scholar]
  14. Marcu, S. Sobrevivir a la transición: La emigración internacional de rumanos desde un enfoque territorial. Cuad. Geogr. 2008, 34, 135–152. [Google Scholar]
  15. De la Rica, S.; Albrecht, G.; Ortega, F. Immigration in Spain: What have we learned from recent evidence? Cuad. Econ. ICE 2014, 87, 9–29. [Google Scholar]
  16. Roman, M.; Andren, D. Should I Stay or Should I Go? Romanian Migrants During Transition and Enlargements. In Labor Migration, EU Enlargement, and the Great Recession; Springer: Berlin, Germany, 2016; pp. 247–271. [Google Scholar]
  17. Devitt, C. Labour Migration Governance in Contemporary Europe: The Case of France; Bank of Canada Working Papers; Bank of Canada: Ottawa, ON, Canada, 2012. [Google Scholar]
  18. Diminescu, D. Pour une anthropologie des migrations roumaines en France. Le cas du Pays d’Oas. Migr. Etud. 1999, 91, 1–19. [Google Scholar]
  19. National Institute of Statistics of Romania. Statistics. 2017. Available online: http://statistici.insse.ro/shop/index.jsp?page=tempo3&lang=ro&ind=POP309D (accessed on 14 February 2017).
  20. Faist, T. The Volume and Dynamics of International Migration and Transnational Social Spaces; Clarendon Press: Oxford, UK, 2000. [Google Scholar]
  21. Thomas, W.; Znanicki, F. The Polish Peasant en Europe and America; Chicago University Press: Chicago, IL, USA, 1918–1920. [Google Scholar]
  22. Massey, D.S.; Arango, J.; Hugo, G.; Kouaouci, A.; Pellegrino, A.; Taylor, J.E. Worlds in Motion. Understanding International Migration at the End of the Millennium; Clarendon Press: Oxford, UK, 1998. [Google Scholar]
  23. Arango, J. Explaining migration: A critical view. In UNESCO 2000; Blackwell Publishers: Oxford, UK, 2000. [Google Scholar]
  24. Dragan, A.; Popa, N. Social Economy in Post-communist Romania: What Kind of Volunteering for What Type of NGOs? J. Balk. Near East. Stud. 2017, 19, 330–350. [Google Scholar] [CrossRef]
  25. Manski, C. Economic analysis of social interactions. J. Econ. Perspect. 2000, 14, 115–136. [Google Scholar] [CrossRef]
  26. Kritz, M.; Lim, L.L.; Zlotnik, H. International Migration Systems: A Global Approach; Clarendon Press: Oxford, UK, 1992. [Google Scholar]
  27. Sandu, D. Romanian Migration as Multiregional Building of Transnational Fields. Romanians’ Social Transnationalism in the Making. 2014. Available online: http://www.ssoar.info/ssoar/handle/document/39528 (accessed on 14 February 2017).
  28. Collyer, M.; King, R. Producing transnational space: International migration and the extra-territorial reach of state power. Prog. Hum. Geogr. 2014, 39, 185–204. [Google Scholar] [CrossRef]
  29. Pott, A. Geography of migration. In The Encyclopedia of Global Human Migration; Blackwell Publishing: Oxford, UK, 2013; pp. 12–20. [Google Scholar]
  30. Marcu, S. Romanian Migration to the Community of Madrid (Spain): Patterns of Mobility and Return. Int. J. Popul. Res. 2011, 2011, 1–13. [Google Scholar] [CrossRef]
  31. Glaeser, E. The new economics of urban and regional growth. In The Oxford Handbook of Economic Geography; Oxford University Press: Oxford, UK, 2000; pp. 83–98. [Google Scholar]
  32. Boschma, R.; Eriksson, R.; Lindren, U. How does labour mobility affect the performance of plants? The importance of relatedness and geographical proximity. J. Econ. Geogr. 2009, 9, 169–190. [Google Scholar] [CrossRef]
  33. Hudson, R. Economic Geographies: Circuits, Flows and Spaces; Sage: Newcastle upon Tyne, UK, 2005; p. 248. [Google Scholar]
  34. Basant, R. Knowledge Flows and Industrial Clusters: An Analytical Review of Literature; East-West Center: Honolulu, HI, USA, 2002. [Google Scholar]
  35. Faist, T. The Crucial Meso-Level. In International Migration Immobility and Development; Berg: Oxford, UK, 1997. [Google Scholar]
  36. Anghel, R.G. Changing Statuses: Freedom of Movement, Locality and Transnationality of Irregular Romanian Migrants in Milan. J. Ethnic Migr. Stud. 2008, 34, 787–802. [Google Scholar] [CrossRef]
  37. Elrick, T.; Ciobanu, O.R. Migration networks and policy impacts: Insights from Romanian-Spanish migrations. Glob. Netw. 2009, 9, 100–116. [Google Scholar] [CrossRef]
  38. Marcu, S. From the Marginal Immigrant to the Mobile Citizen: Reconstruction of Identity of Romanian Migrants in Spain. Popul. Space Place 2015, 21, 506–517. [Google Scholar] [CrossRef]
  39. Nedelcu, M. Migrants’ New Transnational Habitus: Rethinking Migration Through a Cosmopolitan Lens in the Digital Age. J. Ethnic Migr. Stud. 2012, 38, 1339–1356. [Google Scholar] [CrossRef]
  40. Martin, O. Les Enquête et ses Méthodes: L’analyse de Données Qunatitatives; Armand Colin: Paris, France, 2007. [Google Scholar]
  41. Rey, V.; Diminescu, D.; Ohlinger, R. Les Circulations Migratoires Roumaines: Une Intégration par la Bas? Edition de la Maison des Siences de l’Homme: Paris, France, 2001. [Google Scholar]
  42. Lazaroiu, S. More ‘Out’ than ‘In’ at the Crossroads between Europe and the Balkan; International Organization for Migration: Bucharest, Romania, 2003. [Google Scholar]
  43. Fundația pentru o Societate Deschisă. Living Abroad on a Temporary Basis the Economic Migration of Romanians: 1990–2006; Fundația pentru o societate deschisă: Bucharest, Romania, 2006. [Google Scholar]
  44. Sandu, D. Cum “ajungi” intr-un sat sarac: Drumul Sociologic. Sociol. Românească 2001, 1–4, 153–171. [Google Scholar]
  45. World Bank. Magnet cities: Migration and commuting in Romania; World Bank: Bucharest, Romania, 2017. [Google Scholar]
  46. Durkheim, É. Le Suicide; Presses Universitaires de France: Paris, France, 1990. [Google Scholar]
  47. Potot, S. La place des femmes dans les réseaux migrants roumains. Revue Eur. Migr. Int. 2005, 21, 243–257. [Google Scholar] [CrossRef]
Figure 1. Map of counties in relation to the intensity of the emigration phenomenon among their population.
Sustainability 09 01861 g001
Figure 2. The main Romanian departments showing emigration trends towards Paris.
Sustainability 09 01861 g002
Figure 3. The migration network between Romania and France.
Sustainability 09 01861 g003
Table 1. Analysis of the migration rate at the department level in Romania.
RegionsMigration Frequency (No.)Migration Percentage (A)Population NumberPopulation Percentage (BetC)Intensity Migratory Phen. (I)
Bihor740.9600,2232.77−1.87
Satu Mare330.4369,0961.70−1.30
Maramures891.1510,6882.35−1.25
Arges1421.8653,9033.01−1.21
Dambovita1051.3541,3262.49−1.19
Buzau871.1494,9822.28−1.18
Ialomita160.2296,4861.37−1.17
Constanta1762.2715,1723.30−1.10
Galati1511.9619,5222.86−0.96
Bucharest7539.32,221,86010.24−0.94
Olt1121.4490,2762.26−0.86
Prahova2433829,2243.82−0.82
Botosani1081.3454,0232.09−0.79
Salaj310.4248,4071.14−0.74
Vrancea981.2390,2681.80−0.60
Suceava2242.8690,9413.18−0.38
Vaslui1602455,5502.10−0.10
Mures2082.6579,8622.67−0.07
Neamt2092.6557,0842.570.03
Bistrita Nasaud1291.6312,3251.440.16
Valcea1742.1413,5701.910.19
Braila1982.4373,8971.720.68
Caras-Severin1982.4333,3961.540.86
Iasi3834.7819,0443.770.93
Bacau3524.3708,7513.271.03
Cluj3524.3703,2693.241.06
Arad3093.8461,7302.131.67
Alba2923.6382,9991.771.83
Dolj4325.3734,8233.391.91
Mehedinti2853.5306,1181.412.09
Brasov4235.2588,3662.712.49
Hunedoara4395.4487,1152.243.16
Timis5987.4677,7443.124.28
Sibiu5116.3422,2241.954.35
Average238.05882.935294118 0.30
Standard Deviation170.80662.102795016 1.63
Table 2. The frequency analysis of the arrival cities.
Arrival CityFrequency (No.)Percentage (%)
Narbonne450.56
Carcassonne460.57
Nîmes510.63
Avignon800.99
Reims951.17
Cannes2212.73
Montpellier2332.88
Toulon2583.19
Marseille3213.97
Metz3434.24
Strasbourg4735.84
Toulouse7078.73
Nice90211.14
Bordeaux92011.37
Paris339941.99
Total8094100
Average539.66.67

