Notifiable Sexually Transmitted Infections in China: Epidemiologic Trends and Spatial Changing Patterns


Abstract
1. Introduction
2. Data and Methods
2.1. Data Resources
2.2. Descriptive Epidemiology Analysis
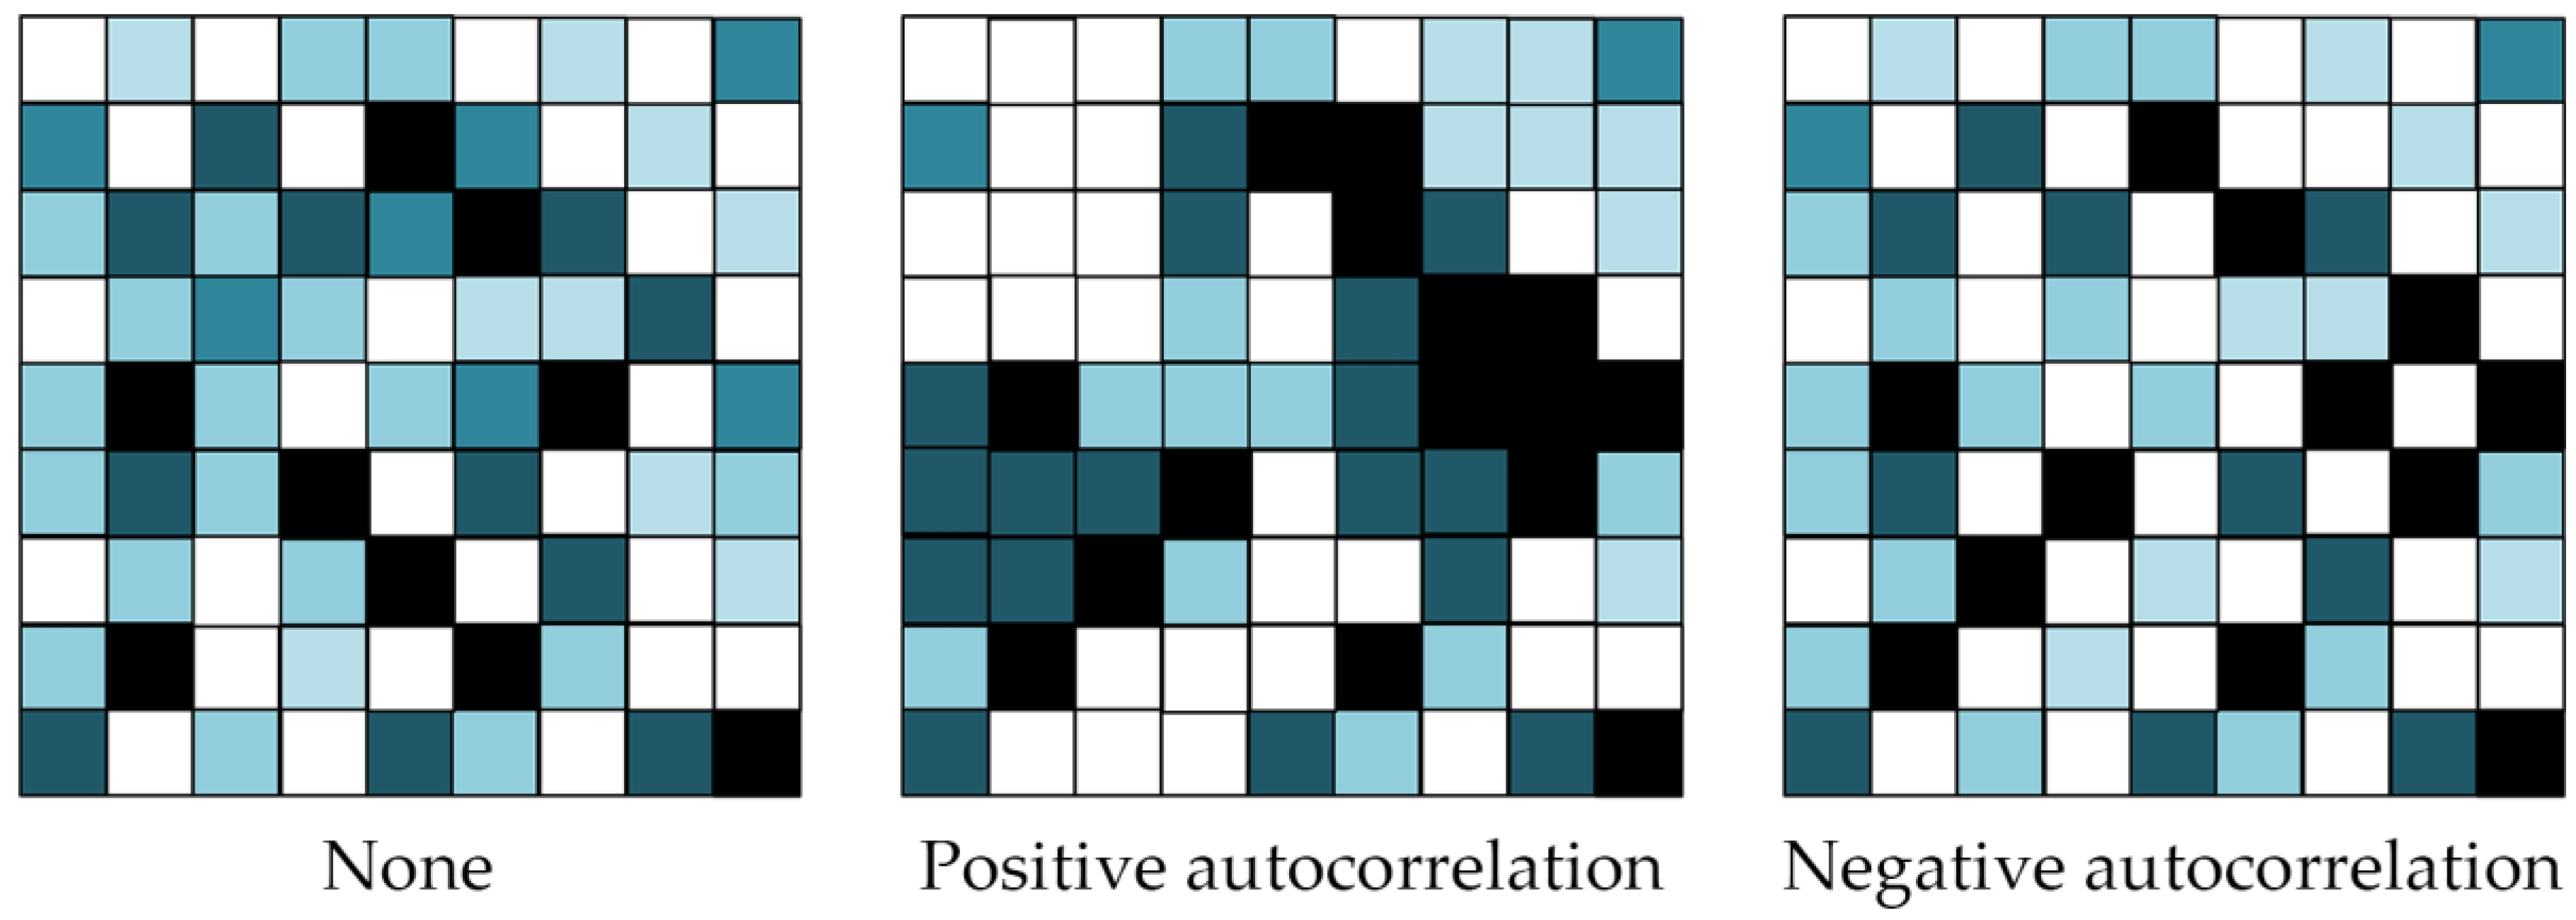
2.3. Spatial Autocorrelation Analysis
2.3.1. Spatial Weight Matrix
2.3.2. Global Moran’s I
2.3.3. Local Moran’s I
2.3.4. Corresponding Mapping Tools
2.4. Softwares
3. Results
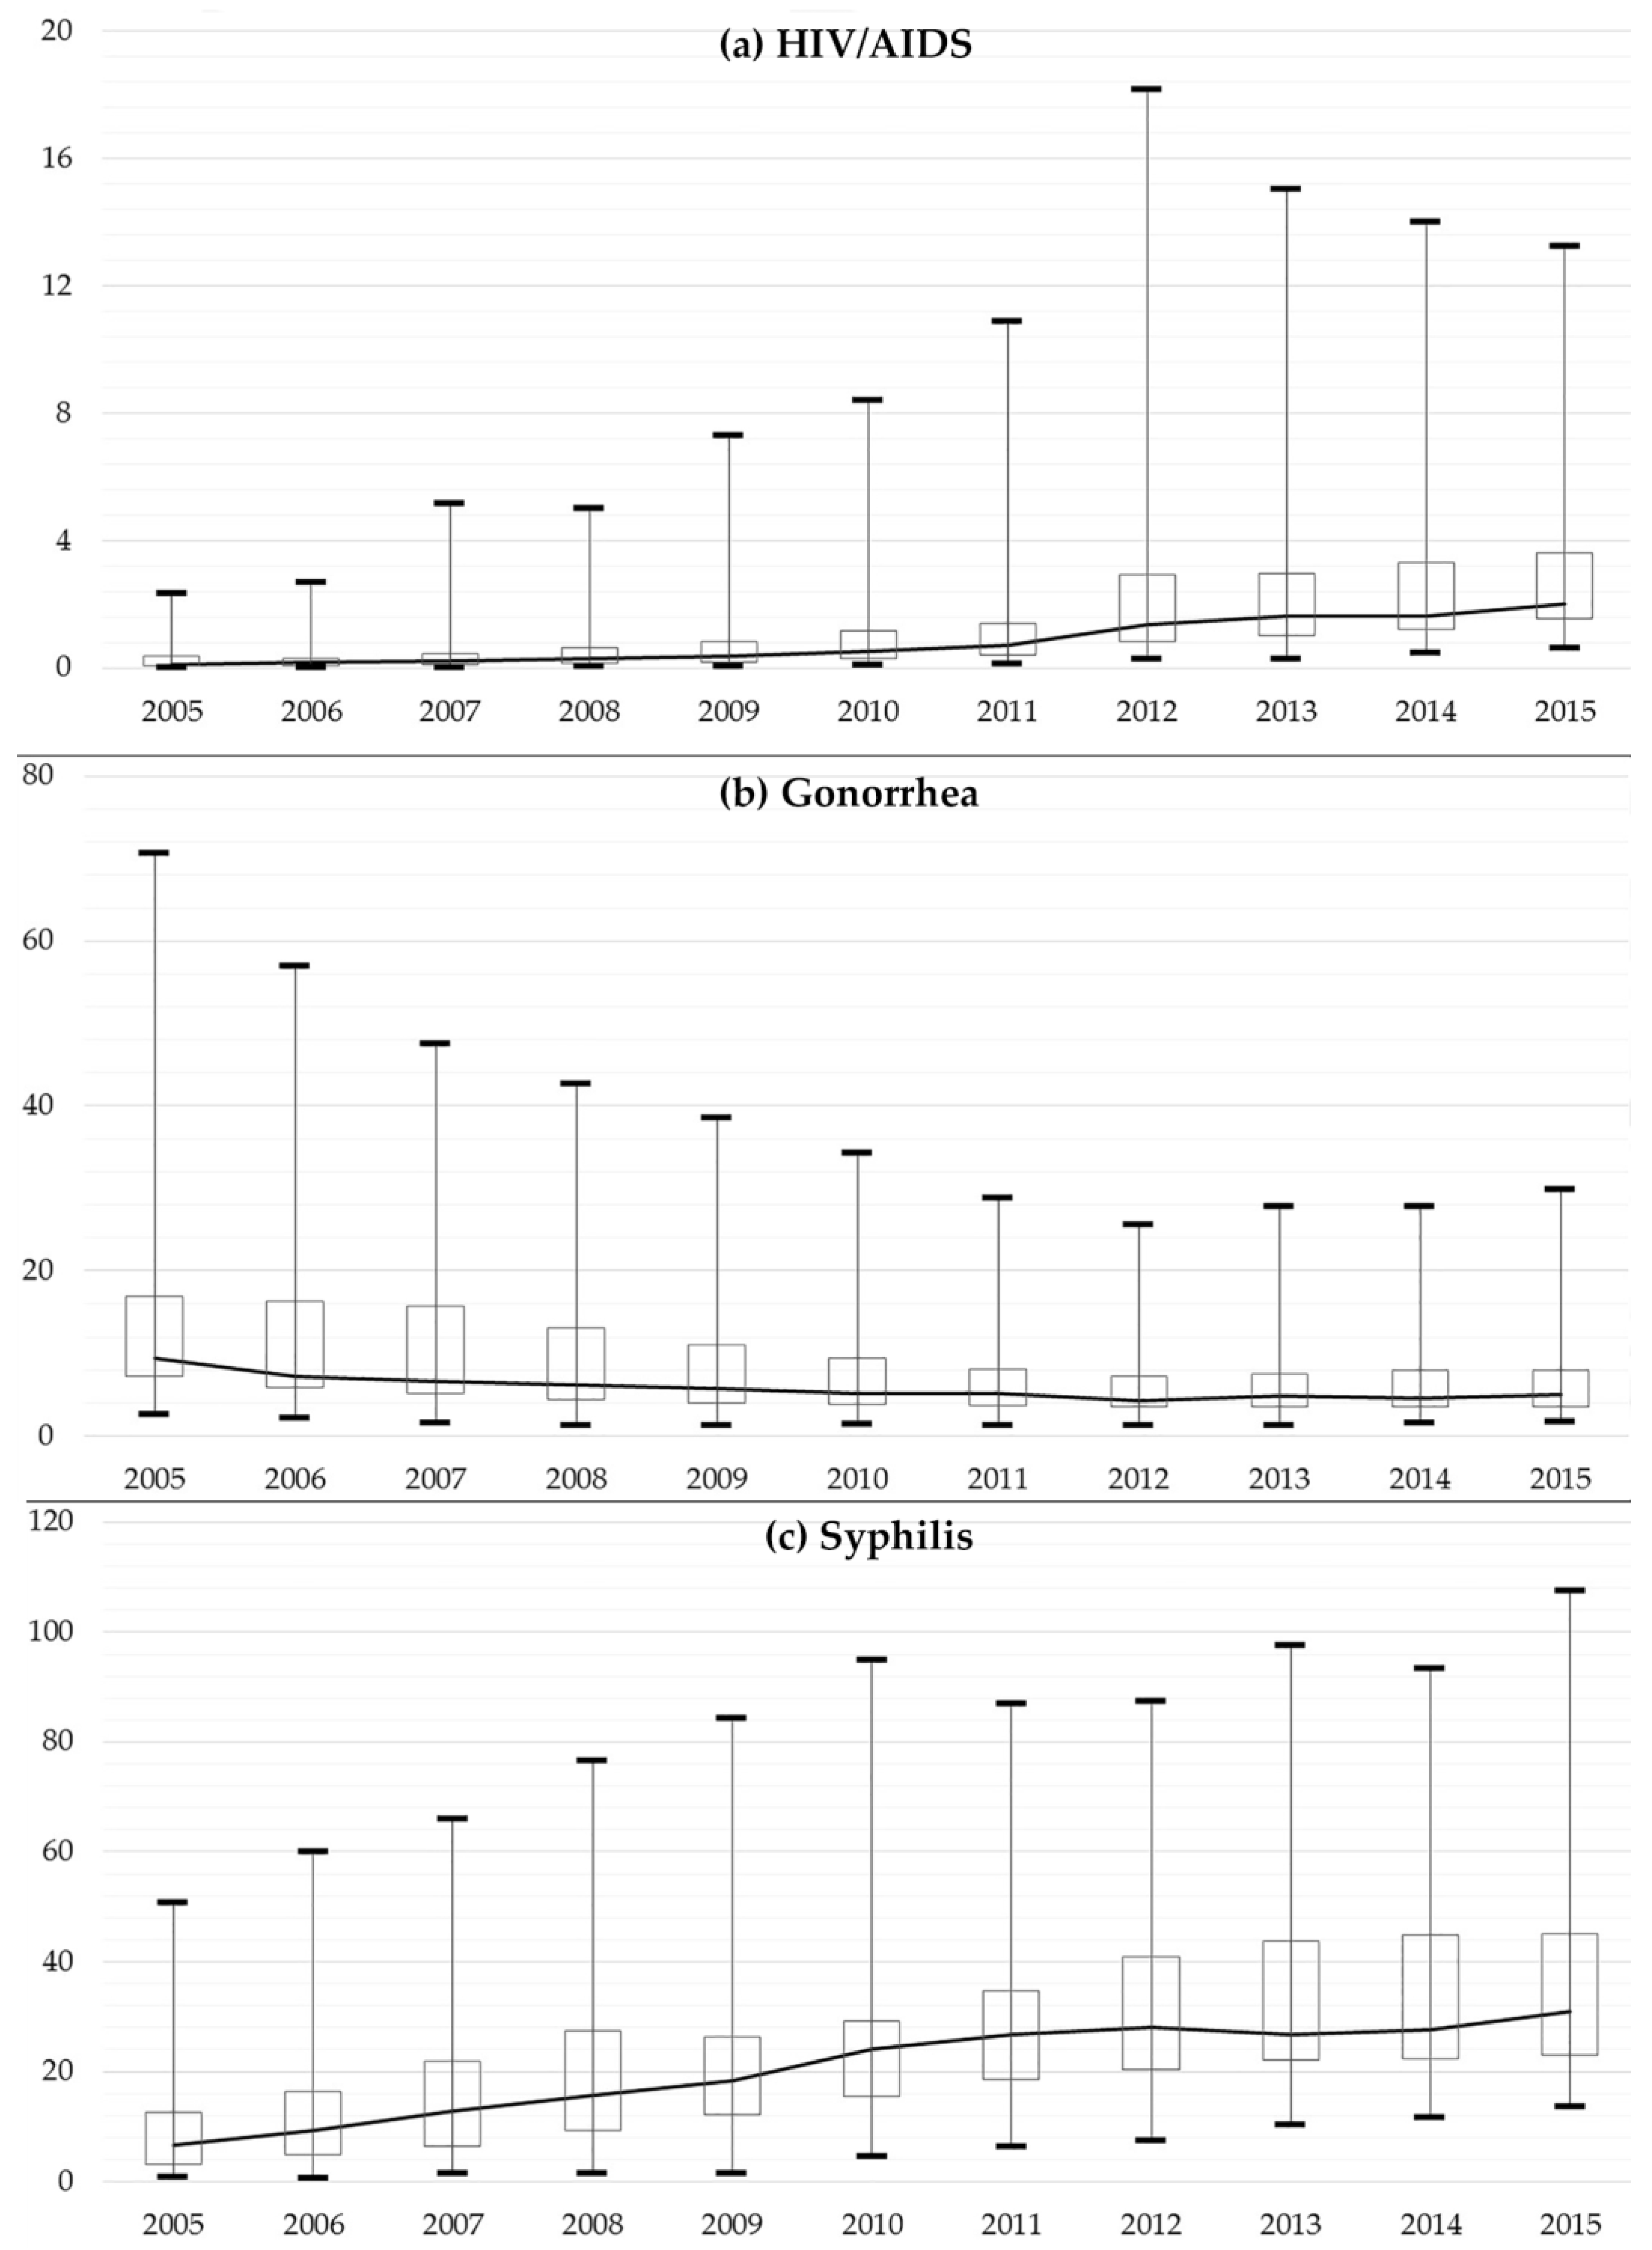
3.1. Epidemiological Trends
3.2. Global Spatial Autocorrelation
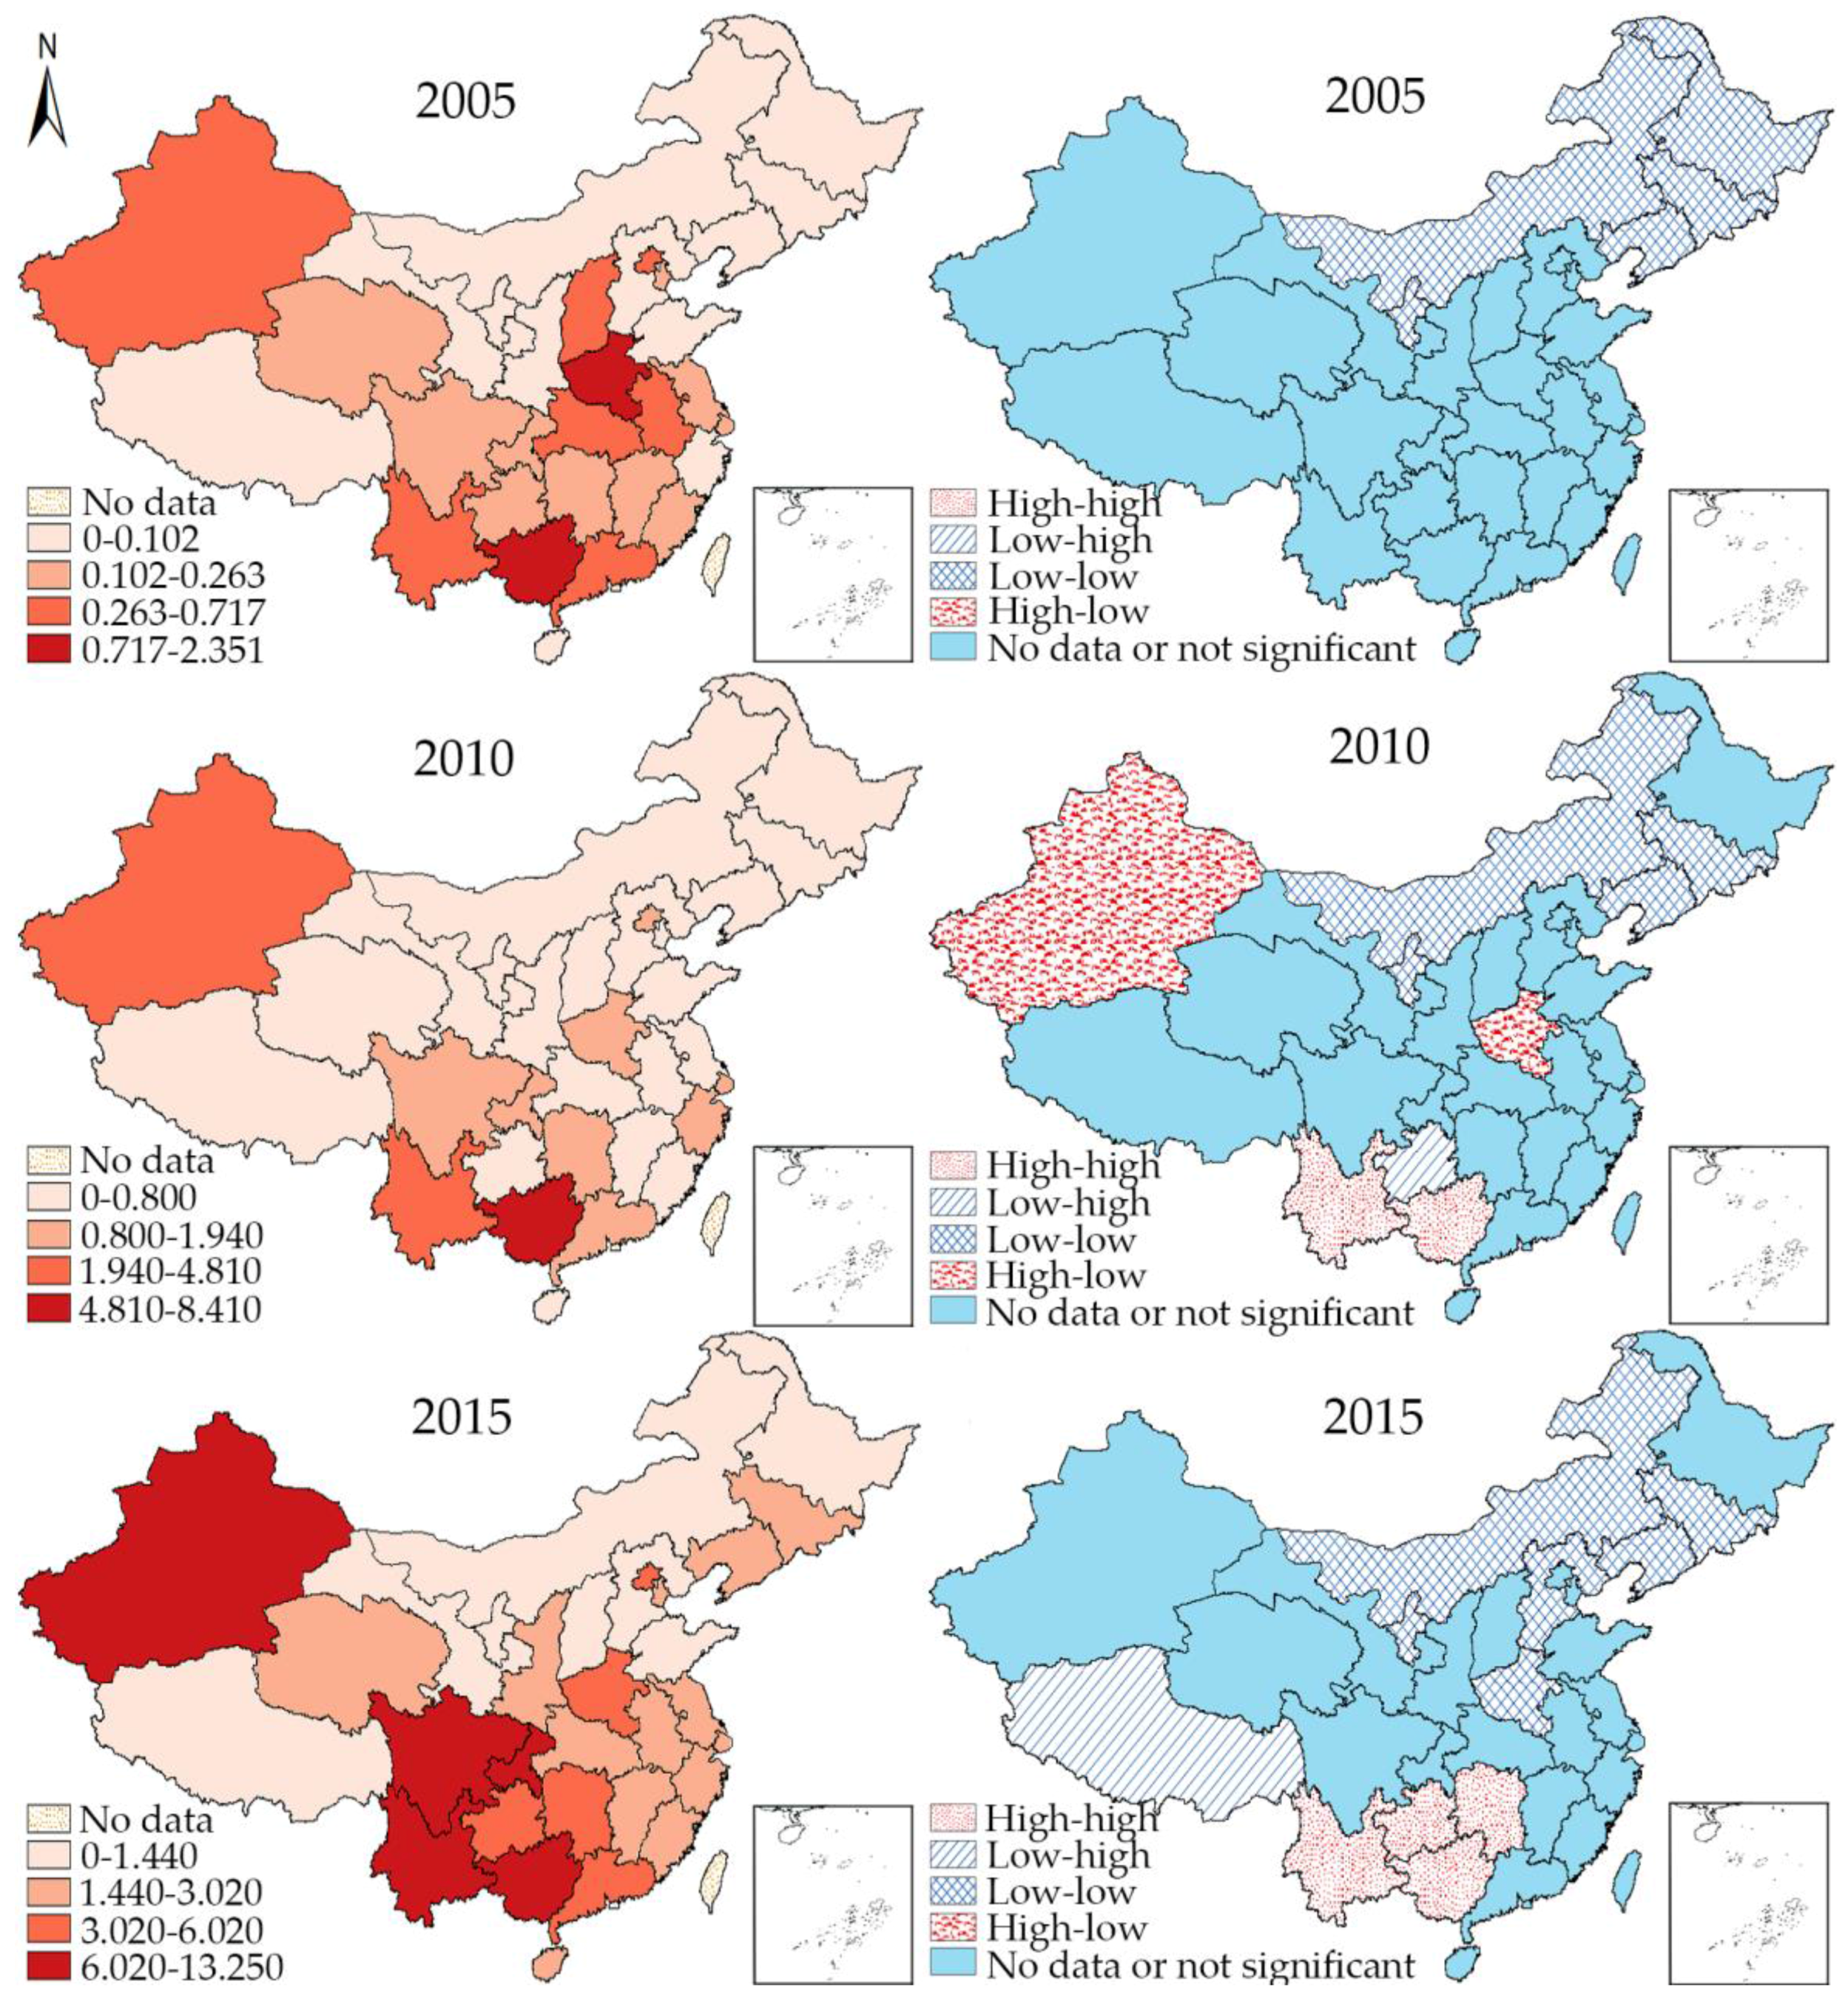
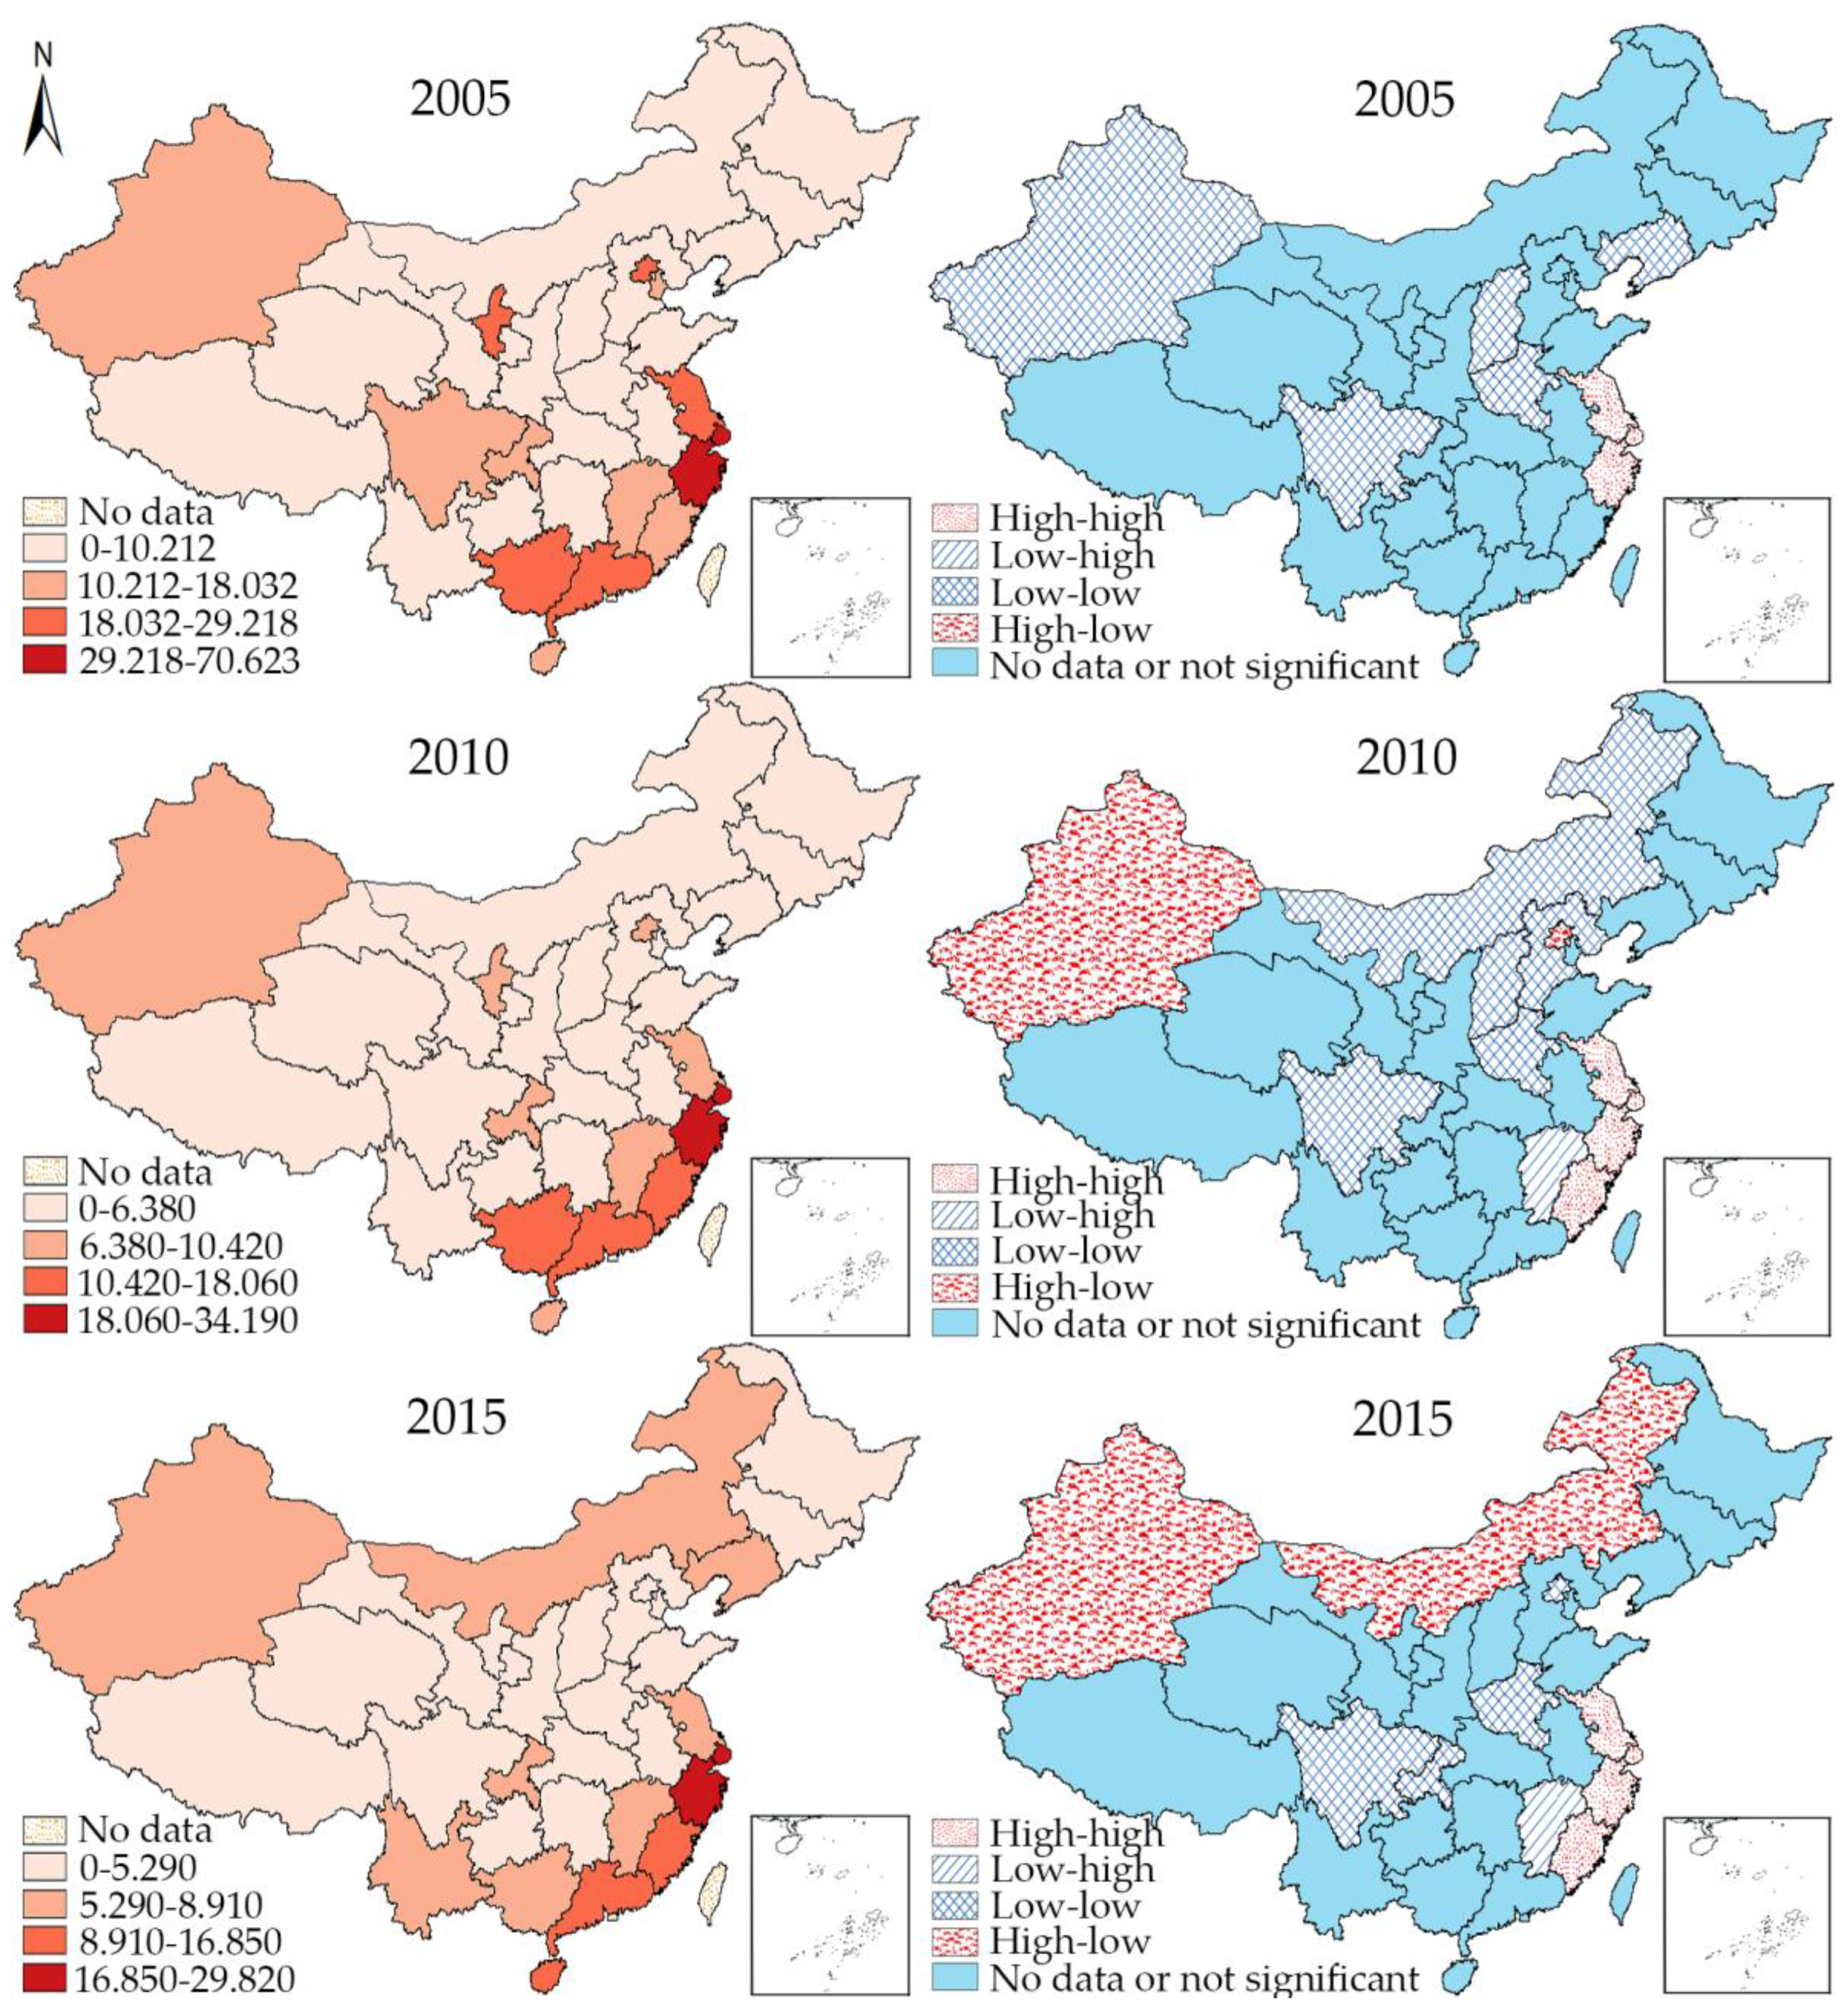
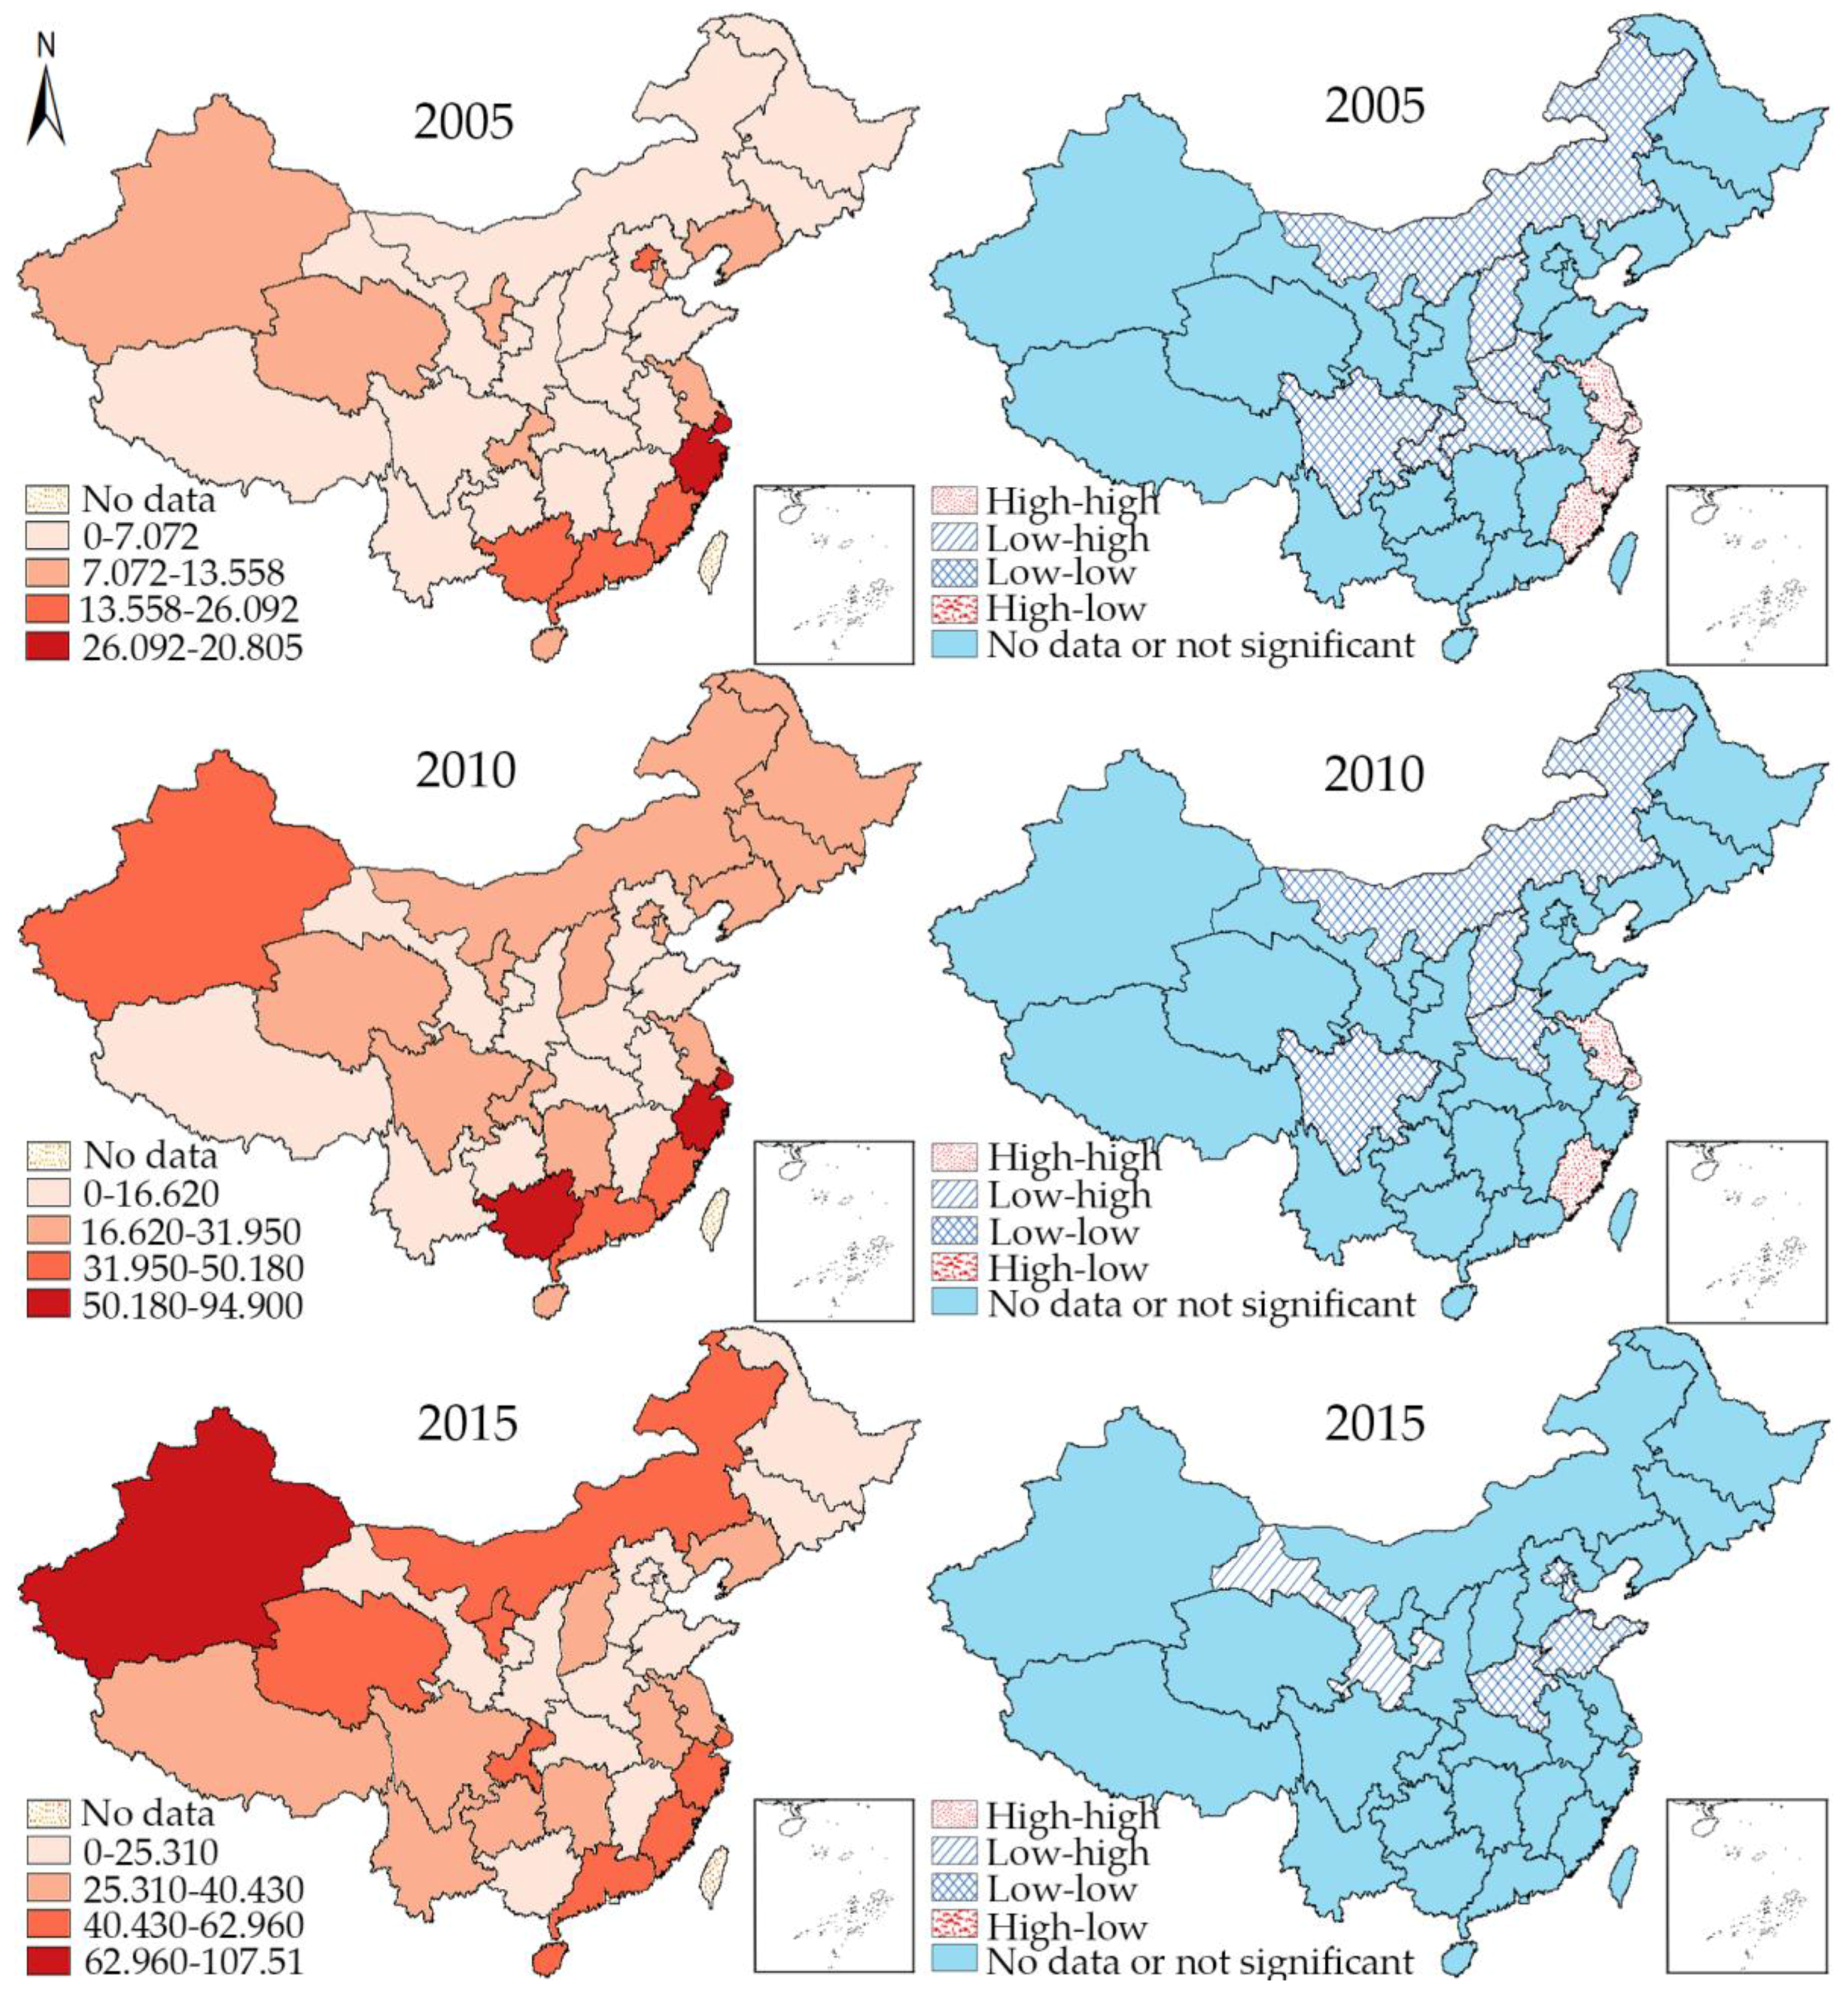
3.3. Local Spatial Autocorrelation
3.4. Frequency Summary of the Spatial-Temporal Clusters
4. Discussion
5. Conclusions
Supplementary Materials
Author Contributions
Conflicts of Interest
References
- Schleihauf, E.; Watkins, R.E.; Plant, A.J. Heterogeneity in the spatial distribution of bacterial sexually transmitted infections. Sex. Transm. Infect. 2009, 85, 45–49. [Google Scholar] [CrossRef] [PubMed]
- Fung, I.C.H.; Hao, Y.; Cai, J.; Ying, Y.; Schaible, B.J.; Yu, C.M.; Tse, Z.T.H.; Fu, K.W. Chinese social media reaction to information about 42 notifiable infectious diseases. PLoS ONE 2015, 10, e0129525. [Google Scholar] [CrossRef] [PubMed]
- World Health Organization. Health in 2015: From MDGs to SDGs; World Health Organization: Genova, Switherland, 2015. [Google Scholar]
- Xu, X.; Xiao, Y.; Wang, N. Modeling sexual transmission of HIV/AIDS in Jiangsu province, China. Math. Methods Appl. Sci. 2013, 36, 234–248. [Google Scholar] [CrossRef]
- National Health and Family Planning Commission of the PRC. China Health and Family Planning Statistical Yearbook 2016; Chinese Peking Union Medical College Press: Beijing, China, 2016.
- Chen, X.; Gong, X.; Liang, G.; Zhang, G. Epidemiologic trends of sexuallly transmitted diseases in China. Sex. Transm. Dis. 2000, 27, 138–142. [Google Scholar] [CrossRef] [PubMed]
- Li, M.; Shen, Y.; Jiang, X.; Li, Q.; Zhou, X.; Lu, H. Clinical epidemiology of HIV/AIDS in China from 2004–2011. Biosci. Trends 2014, 8, 52–58. [Google Scholar] [CrossRef] [PubMed]
- Tan, N.X.; Tan, G.X.; Yang, L.; Yang, B.; Powers, K.A.; Emch, M.E.; Tucker, J.D. Temporal Trends in Syphilis and Gonorrhea Incidences in Guangdong Province, China. J. Infect. Dis. 2014, 209, 426. [Google Scholar] [CrossRef] [PubMed]
- Yan, Y.; Wu, S.; Chen, L.; Yan, P.; Qiu, Y. Shift in HIV/AIDS Epidemic in Southeastern China : A Longitudinal Study from 1987 to 2015. Int. J. Environ. Res. Public Health 2016, 13, 794. [Google Scholar] [CrossRef] [PubMed]
- Peng, Z.-H.; Cheng, Y.-J.; Reilly, K.H.; Wang, L.; Qin, Q.-Q.; Dingi, Z.-W.; Ding, G.-W.; Ding, K.-Q.; Yu, R.-B.; Chen, F.; et al. Spatial distribution of HIV/AIDS in Yunnan province, People’s Republic of China. Geospat. Health 2011, 5, 177–182. [Google Scholar] [CrossRef] [PubMed]
- Wu, X.; Tucker, J.D.; Hong, F.; Messina, J.; Lan, L.; Hu, Y.; Wen, L.; Zhang, C.; Feng, T.; Emch, M.E.; et al. Multilevel and spatial analysis of syphilis in Shenzhen, China, to inform spatially targeted control measures. Sex. Transm. Infect. 2013, 88, 325–329. [Google Scholar] [CrossRef] [PubMed]
- Qian, S.; Guo, W.; Xing, J.; Qin, Q.; Ding, Z.; Chen, F.; Zhihang, P.; Wang, L. Diversity of HIV/AIDS epidemic in China: A result from hierarchical clustering analysis and spatial autocorrelation analysis. AIDS 2014, 28, 1805–1813. [Google Scholar] [CrossRef] [PubMed]
- Zhang, Y.; Xiao, Q.; Zhou, L.; Ma, D.; Liu, L.; Lu, R.; Yi, D.; Yi, D. The AIDS epidemic and economic input impact factors in Chongqing, China, from 2006 to 2012: A spatial-temporal analysis. BMJ Open 2015, 5, e006669. [Google Scholar] [CrossRef] [PubMed]
- Chen, W.; Zhou, F.; Hall, B.J.; Wang, Y.; Latkin, C.; Ling, L.; Tucker, J.D. Spatial distribution and cluster analysis of risky sexual behaviors and STDs reported by Chinese adults in Guangzhou, China: A representative population-based study. Sex. Transm. Infect. 2016, 9, 1–7. [Google Scholar] [CrossRef]
- Xing, J.; Li, Y.; Tang, W.; Guo, W.; Ding, Z.; Ding, G.; Wang, L.; Qin, Q.; Xu, Y.; Qian, S.; et al. HIV/AIDS Epidemic Among Older Adults in China During 2005–2012: Results From Trend and Spatial Analysis. Clin. Infect. Dis. 2014, 59, 53–60. [Google Scholar] [CrossRef] [PubMed]
- Zhang, X.; Tang, W.; Li, Y.; Mahapatra, T.; Feng, Y.; Li, M.; Chen, F.; Li, P.; Xing, J.; Qian, S.; et al. The HIV/AIDS epidemic among young people in China between 2005 and 2012: Results of a spatial temporal analysis. HIV Med. 2016, 18, 141. [Google Scholar] [CrossRef] [PubMed]
- Liu, Y.; Wang, X.; Liu, Y.; Sun, D.; Ding, S.; Zhang, B.; Du, Z.; Xue, F. Detecting Spatial-Temporal Clusters of HFMD from 2007 to 2011 in Shandong Province, China. PLoS ONE 2013, 8, e63447. [Google Scholar] [CrossRef] [PubMed]
- Martins-melo, F.R.; Pinheiro, M.C.C.; Ramos, A.N., Jr.; Alencar, C.H.; Bezerra, F.S.; Heukelbach, J. Spatiotemporal Patterns of Schistosomiasis-Related Deaths, Brazil, 2000–2011. Emerg. Infect. Dis. 2015, 21, 1820–1823. [Google Scholar] [CrossRef] [PubMed]
- Xia, J.; Cai, S.; Zhang, H.; Lin, W.; Fan, Y.; Qiu, J.; Sun, L.; Chang, B.; Zhang, Z.; Nie, S. Spatial, temporal, and spatiotemporal analysis of malaria in Hubei Province, China from 2004–2011. Malar. J. 2015, 14, 1–10. [Google Scholar] [CrossRef] [PubMed]
- Ge, E.; Zhang, X.; Wang, X.; Wei, X. Spatial and temporal analysis of tuberculosis in Zhejiang Province, China, 2009–2012. Infect. Dis. Poverty 2016, 5, 11. [Google Scholar] [CrossRef] [PubMed]
- Varga, C.; Pearl, D.L.; McEwen, S.A.; Sargeant, J.M.; Pollari, F.; Guerin, M.T. Area-level global and local clustering of human Salmonella Enteritidis infection rates in the city of Toronto, Canada, 2007–2009. BMC Infect. Dis. 2015, 15, 1–13. [Google Scholar] [CrossRef] [PubMed]
- Fang, L.; Yan, L.; Liang, S.; de Vlas, S.J.; Feng, D.; Han, X.; Zhao, W.; Xu, B.; Bian, L.; Yang, H.; et al. Spatial analysis of hemorrhagic fever with renal syndrome in China. BMC Infect. Dis. 2006, 6, 77. [Google Scholar] [CrossRef] [PubMed]
- Abbas, T.; Younus, M.; Muhammad, S.A. Spatial cluster analysis of human cases of Crimean Congo hemorrhagic fever reported in Pakistan. Infect. Dis. Poverty 2015, 4, 9. [Google Scholar] [CrossRef] [PubMed]
- Anselin, L. Local Indicators of Spatial Association—Lisa. Geogr. Anal. 1995, 27, 93–115. [Google Scholar] [CrossRef]
- Moraga, P.; Montes, F. Detection of spatial disease clusters with LISA functions. Stat. Med. 2011, 30, 1057–1071. [Google Scholar] [CrossRef] [PubMed]
- Chen, J.; Yang, S.; Li, H.; Zhang, B.; Lv, J. Research on geographical environment unit division based on the method of natural breaks (jenks). Remote Sens. Spat. Inf. Sci. 2013, XL-4/W3, 47–50. [Google Scholar] [CrossRef]
- Zhang, L.; Wilson, D.P. Trends in notifiable infectious diseases in Vhina: Implications for surveillance and population health policy. PLoS ONE 2012, 7, e31076. [Google Scholar] [CrossRef]
- Wang, H.; Chen, R.Y.; Sharp, G.B.; Brown, K.; Smith, K.; Ding, G.; Jin, X.; Xu, J.; Dong, R.; Wang, N. Mobility, risk behavior and HIV/STI rates among female sex workers in Kaiyuan City, Yunnan Province, China. BMC Infect. Dis. 2010, 10, 198. [Google Scholar] [CrossRef] [PubMed]
- Ison, C.A. Antimicrobial resistance in sexually transmitted infections in the developed world: implications for rational treatment. Curr. Opin. Infect. Dis. 2012, 25, 73–78. [Google Scholar] [CrossRef] [PubMed]
- Wang, Y.; Yang, Y.; Shi, X.; Mao, S.; Shi, N.; Hui, X. The spatial distribution pattern of human immunodeficiency virus/acquired immune deficiency syndrome in China. Geospat. Health 2016, 11, 414. [Google Scholar] [CrossRef] [PubMed]
- Cohen, M.; Ping, G.; Fox, K.; Henderson, G. Sexuallly transmitted diseases in the People’s Republic of China. Sex. Transm. Dis. 2000, 27, 143–145. [Google Scholar] [CrossRef] [PubMed]
- Behaviors, R.; Willem, J.; Van Wijngaarden, D.L.; Girault, P. The Epidemiology of Human Immunodeficiency Virus Infection, Sexually Transmitted Infections, and Associated The Epidemiology of Human Immunodeficiency Virus Infection. Sex. Transm. Dis. 2009, 36, 319–324. [Google Scholar] [CrossRef]


| Region | HIV (Growth Rate) | Gonorrhea (Growth Rate) | Syphilis (Growth Rate) | ||||||
|---|---|---|---|---|---|---|---|---|---|
| 2005 | 2010 | 2015 | 2005 | 2010 | 2015 | 2005 | 2010 | 2015 | |
| Beijing | 0.49 | 1.00(104%) | 3.61(261%) | 26.93 | 8.83(−67%) | 5.14(−42%) | 17.58 | 24.97(42%) | 24.68(−1%) |
| Tianjin | 0.14 | 0.47(236%) | 1.79(281%) | 14.43 | 3.43(−76%) | 2.70(−21%) | 10.27 | 24.39(137%) | 19.37(−21%) |
| Hebei | 0.09 | 0.17(89%) | 0.92(441%) | 2.52 | 1.38(−45%) | 1.72(25%) | 1.20 | 4.57(281%) | 13.50(195%) |
| Shanxi | 0.34 | 0.47(38%) | 1.35(187%) | 7.95 | 3.42(−57%) | 3.72(9%) | 6.36 | 20.10(216%) | 26.90(34%) |
| Neimenggu | 0.03 | 0.12(300%) | 0.83(592%) | 7.28 | 6.08(−16%) | 8.33(37%) | 5.97 | 24.18(305%) | 43.41(80%) |
| Liaoning | 0.06 | 0.25(317%) | 1.88(652%) | 7.03 | 5.11(−27%) | 5.89(15%) | 8.25 | 28.96(251%) | 40.43(40%) |
| Jilin | 0.08 | 0.36(350%) | 1.96(444%) | 9.46 | 6.38(−33%) | 5.29(−17%) | 6.18 | 20.73(235%) | 21.34(3%) |
| Heilongjiang | 0.06 | 0.29(383%) | 1.44(397%) | 10.21 | 3.81(−63%) | 4.38(15%) | 7.07 | 20.67(192%) | 25.31(22%) |
| Shanghai | 0.17 | 1.43(741%) | 2.15(50%) | 70.62 | 28.22(−60%) | 29.82(6%) | 50.80 | 76.42(50%) | 56.13(−27%) |
| Jiangsu | 0.11 | 0.42(282%) | 1.98(371%) | 29.22 | 10.42(−64%) | 7.65(−27%) | 12.42 | 31.95(157%) | 29.64(−7%) |
| Zhejiang | 0.09 | 0.88(878%) | 3.02(243%) | 55.21 | 34.19(−38%) | 29.41(−14%) | 43.11 | 94.90(120%) | 59.36(−37%) |
| Anhui | 0.41 | 0.54(32%) | 1.71(217%) | 8.42 | 5.03(−40%) | 4.64(−8%) | 5.30 | 16.62(214%) | 34.19(106%) |
| Fujian | 0.14 | 0.65(364%) | 2.00(208%) | 18.03 | 14.30(−21%) | 13.13(−8%) | 24.29 | 48.73(101%) | 62.96(29%) |
| Jiangxi | 0.14 | 0.53(279%) | 2.60(391%) | 11.15 | 7.10(−36%) | 7.27(2%) | 6.07 | 12.92(113%) | 25.11(94%) |
| Shandong | 0.06 | 0.11(83%) | 0.62(464%) | 6.25 | 2.77(−56%) | 3.85(39%) | 2.35 | 6.90(194%) | 15.00(117%) |
| Henan | 2.35 | 1.58(−33%) | 3.26(106%) | 5.10 | 1.97(−61%) | 2.92(48%) | 2.67 | 14.29(435%) | 17.04(19%) |
| Hubei | 0.39 | 0.62(59%) | 2.02(226%) | 7.36 | 4.72(−36%) | 3.87(−18%) | 2.93 | 16.12(450%) | 20.67(28%) |
| Hunan | 0.26 | 1.16(346%) | 3.82(229%) | 5.66 | 4.08(−28%) | 3.56(−13%) | 3.37 | 24.04(613%) | 31.04(29%) |
| Guangdong | 0.47 | 1.20(155%) | 3.65(204%) | 23.80 | 18.06(−24%) | 15.84(−12%) | 21.94 | 41.93(91%) | 46.64(11%) |
| Guangxi | 1.85 | 8.41(355%) | 13.25(58%) | 23.66 | 15.12(−36%) | 8.56(−43%) | 26.09 | 76.64(194%) | 17.27(−77%) |
| Hainan | 0.05 | 0.36(620%) | 2.10(483%) | 14.04 | 8.59(−39%) | 16.85(96%) | 13.56 | 27.57(103%) | 48.59(76%) |
| Chongqing | 0.15 | 1.49(893%) | 8.76(488%) | 15.95 | 9.60(−40%) | 5.93(−38%) | 10.79 | 29.58(174%) | 48.55(64%) |
| Sichuan | 0.11 | 1.94(1664%) | 9.55(392%) | 12.66 | 6.00(−53%) | 3.37(−44%) | 6.58 | 24.52(273%) | 27.83(13%) |
| Guizhou | 0.11 | 0.80(627%) | 6.02(653%) | 6.05 | 3.89(−36%) | 4.76(22%) | 2.75 | 15.77(473%) | 32.37(105%) |
| Yunnan | 0.72 | 4.81(568%) | 12.31(156%) | 7.35 | 3.98(−46%) | 6.42(61%) | 2.48 | 10.95(342%) | 33.02(202%) |
| Xizang | 0.07 | 0.14(100%) | 1.04(643%) | 4.73 | 2.76(−42%) | 1.73(−37%) | 0.76 | 7.62(903%) | 33.57(341%) |
| Shaanxi | 0.06 | 0.34(467%) | 1.74(412%) | 7.91 | 4.80(−39%) | 3.47(−28%) | 2.95 | 12.24(315%) | 24.91(104%) |
| Gansu | 0.10 | 0.21(110%) | 1.20(471%) | 6.56 | 3.57(−46%) | 2.94(−18%) | 4.73 | 15.33(224%) | 16.78(9%) |
| Qinghai | 0.13 | 0.39(200%) | 2.59(564%) | 8.36 | 3.73(−55%) | 2.86(−23%) | 12.73 | 27.87(119%) | 42.66(53%) |
| Ningxia | 0.07 | 0.30(329%) | 1.18(293%) | 27.24 | 10.36(−62%) | 5.09(−51%) | 7.82 | 23.64(202%) | 49.19(108%) |
| Xinjiang | 0.53 | 2.50(372%) | 8.13(225%) | 14.63 | 9.36(−36%) | 8.91(−5%) | 10.80 | 50.18(365%) | 107.51(114%) |
| SUM | 0.43 | 1.20(179%) | 3.69(208%) | 13.79 | 7.91(−43%) | 7.36(−7%) | 9.67 | 26.86(178%) | 31.85(19%) |
| Year | HIV | Gonorrhea | Syphilis | ||||||
|---|---|---|---|---|---|---|---|---|---|
| Moran’s I | Z-Value | p-Value | Moran’s I | Z-Value | p-Value | Moran’s I | Z-Value | p-Value | |
| 2005 | 0.0293 | 0.6353 | 0.1952 | 0.4169 *** | 4.3346 | 0.0009 | 0.3789 *** | 3.8163 | 0.0028 |
| 2006 | 0.0733 | 0.9776 | 0.1520 | 0.3770 *** | 3.8440 | 0.0029 | 0.3414 *** | 3.3541 | 0.0050 |
| 2007 | 0.1558 ** 1 | 1.9343 | 0.0489 | 0.3774 *** | 3.7337 | 0.0032 | 0.3359 *** | 3.3475 | 0.0042 |
| 2008 | 0.2209 ** | 2.6304 | 0.0218 | 0.3984 *** | 3.9970 | 0.0023 | 0.3248 *** | 3.2528 | 0.0041 |
| 2009 | 0.2055 ** | 2.6227 | 0.0221 | 0.4187 *** | 4.1808 | 0.0018 | 0.2974 *** | 2.9106 | 0.0090 |
| 2010 | 0.1929 ** | 2.5401 | 0.0211 | 0.4171 *** | 4.2655 | 0.0015 | 0.2524 ** | 2.5505 | 0.0157 |
| 2011 | 0.2029 ** | 2.6661 | 0.0198 | 0.4248 *** | 4.2208 | 0.0014 | 0.1063 | 1.2033 | 0.1161 |
| 2012 | 0.2327 ** | 2.4921 | 0.0224 | 0.4195 *** | 4.0752 | 0.0014 | 0.0539 | 0.7593 | 0.2177 |
| 2013 | 0.2786 ** | 2.8495 | 0.0127 | 0.4888 *** | 4.6721 | 0.0006 | 0.0443 | 0.7020 | 0.2293 |
| 2014 | 0.3069 *** | 3.1133 | 0.0078 | 0.4658 *** | 4.4637 | 0.0011 | 0.0942 | 1.1006 | 0.1390 |
| 2015 | 0.3402 *** | 3.3731 | 0.0044 | 0.4714 *** | 4.6355 | 0.0007 | 0.1099 * | 1.3451 | 0.0955 |
© 2017 by the authors. Licensee MDPI, Basel, Switzerland. This article is an open access article distributed under the terms and conditions of the Creative Commons Attribution (CC BY) license (http://creativecommons.org/licenses/by/4.0/).
Share and Cite
Zhu, B.; Fu, Y.; Liu, J.; Mao, Y. Notifiable Sexually Transmitted Infections in China: Epidemiologic Trends and Spatial Changing Patterns. Sustainability 2017, 9, 1784. https://doi.org/10.3390/su9101784
Zhu B, Fu Y, Liu J, Mao Y. Notifiable Sexually Transmitted Infections in China: Epidemiologic Trends and Spatial Changing Patterns. Sustainability. 2017; 9(10):1784. https://doi.org/10.3390/su9101784
Chicago/Turabian StyleZhu, Bin, Yang Fu, Jinlin Liu, and Ying Mao. 2017. "Notifiable Sexually Transmitted Infections in China: Epidemiologic Trends and Spatial Changing Patterns" Sustainability 9, no. 10: 1784. https://doi.org/10.3390/su9101784
APA StyleZhu, B., Fu, Y., Liu, J., & Mao, Y. (2017). Notifiable Sexually Transmitted Infections in China: Epidemiologic Trends and Spatial Changing Patterns. Sustainability, 9(10), 1784. https://doi.org/10.3390/su9101784